Intel Core i7-13650HX
Az Intel Core i5-13650HX a Raptor Lake sorozat gyors csúcskategóriás mobil processzora . A 2023 elején jelentették be. A CPU 6 gyors Raptor Cove teljesítményű magot (P-magokat) integrál Hyper-Threadinggel és 8 Gracemont hatékonysági magot HyperThreading nélkül. A P-magok 2,6 GHz (alap) és 4,9 GHz (egy magos boost, összes magos 4,5 GHz) közötti órajelen járnak. A kisebb E-magok 1,9 és 3,6 GHz közötti órajellel működnek.
Az Alder Lake-hez képest a Raptor Lake továbbfejlesztett P-magokat (Raptor Cove mikroarchitektúra) kínál nagyobb gyorsítótárakkal és több E-magot (ugyanaz a Gracemont mikroarchitektúra). A chip továbbá támogatja a gyorsabb DDR5 memóriát (a 13980HX esetében akár 5600 MHz, az i5 esetében viszont csak 4800 MHz).
Teljesítmény
Az adatbázisunkban szereplő 13650HX átlagosan ugyanabban a ligában játszik, mint a Core i7-13700HX és a Core i9-12950HX , ami a többszálas benchmark-eredményeket illeti.
Az Ön mérföldköre attól függően változhat, hogy milyen magasak a CPU teljesítményhatárai, és mennyire kompetens a rendszer hűtési megoldása.
A CPU továbbra is egy továbbfejlesztett 10 nm-es FinFET eljárással készül (Intel 7), amely lehetővé teszi a magasabb órajeleket. A teljesítményfogyasztás 55 W alapteljesítményben van megadva, maximum 157 Wattig. Turbó teljesítmény.
Széria Intel Raptor Lake-HX Kódnév Raptor Lake-HX Széria: Raptor Lake-HX Raptor Lake-HX Órajel 1900 - 4900 MHz Level 3 Cache 24 MB Magok / Szálak 14 / 20 Max. Áramfelvétel (TDP - Thermal Design Power) 55 Watt Gyártástechnológia 10 nm Die size 257 mm2 Max. Hőmérséklet 100 °C Socket BGA1964 Jellegzetességek DDR4-3200/DDR5-4800 RAM, PCIe 5, Thr. Dir., DL B., GNA, MMX, SSE, SSE2, SSE3, SSSE3, SSE4.1, SSE4.2, AVX, AVX2, BMI2, ABM, FMA, ADX, SMEP, SMAP, EIST, TM1, TM2, HT, Turbo, SST, AES-NI, RDRAND, RDSEED, SHA GPU Intel UHD Graphics Xe 16EUs (Tiger Lake-H) ( - 1550 MHz)64 bit 64 bites támogatás Architecture x86 Bejelentés dátuma 01/04/2023 Termék hivatkozás (külső) ark.intel.com
Benchmarkok Performance Rating - CB R15 + R20 + 7-Zip + X265 + Blender + 3DM11 CPU
46 pt (64%)
...
...
max:
Cinebench 2024 - CB24 CPU Single Core
min: 107.2 avg: 109.6 median: 109.6 (76%) max: 111.9 Points
CPU TDP 45 W TDP 55 W 96% 100%
...
Apple M1
...
Cinebench 2024 - CB24 CPU Multi Core
min: 805 avg: 991 median: 990.5 (18%) max: 1176 Points
CPU TDP 45 W TDP 55 W 68% 100%
...
max:
Cinebench R23 - Cinebench R23 Multi Core
min: 18879 avg: 20359 median: 20774.5 (19%) max: 21006 Points
CPU TDP 45 W TDP 55 W TDP 110 W TDP 191 W 90% 98% 100% 100%
...
...
max:
Cinebench R23 - Cinebench R23 Single Core
min: 1813 avg: 1858 median: 1857.5 (79%) max: 1903 Points
CPU TDP 45 W TDP 55 W TDP 110 W TDP 191 W 95% 99% 100% 96%
...
...
max:
Cinebench R20 - Cinebench R20 CPU (Single Core)
min: 700 avg: 715 median: 716 (80%) max: 728 Points
CPU TDP 45 W TDP 55 W TDP 110 W TDP 191 W 96% 99% 100% 98%
...
...
max:
Cinebench R20 - Cinebench R20 CPU (Multi Core)
min: 7197 avg: 7760 median: 7910 (19%) max: 8021 Points
CPU TDP 45 W TDP 55 W TDP 110 W TDP 191 W 90% 98% 100% 100%
...
...
max:
Cinebench R15 - Cinebench R15 CPU Multi 64 Bit
min: 2864 avg: 3041 median: 3075.5 (19%) max: 3147 Points
CPU TDP 45 W TDP 55 W TDP 110 W TDP 191 W 91% 96% 100% 100%
...
...
max:
0 160 320 480 640 800 960 1120 1280 1440 1600 1760 1920 2080 2240 2400 2560 2720 2880 3040 Tooltip Gigabyte G6X 9KG (2024): Ø2018 (1801.23-2863.69)
Dell G16, i7-13650HX, RTX 4060: Ø2933 (2802.3-3015.45)
Asus ROG Strix G18 G814JI: Ø3111 (3067.01-3136.03)
Dell G15 5530: Ø2985 (2897.29-3146.63)
Cinebench R15 - Cinebench R15 CPU Single 64 Bit
min: 256 avg: 268.3 median: 271 (82%) max: 275 Points
CPU TDP 45 W TDP 55 W TDP 110 W TDP 191 W 93% 98% 100% 99%
...
...
max:
Cinebench R11.5 - Cinebench R11.5 CPU Multi 64 Bit
37.4 Points (49%)
...
max:
Cinebench R11.5 - Cinebench R11.5 CPU Single 64 Bit
3.3 Points (82%)
...
...
max:
Cinebench R10 - Cinebench R10 Rend. Single (32bit)
10616 pontok (64%)
...
max:
Cinebench R10 - Cinebench R10 Rend. Multi (32bit)
68755 pontok (50%)
...
max:
8422 pontok (13%)
...
...
max:
7-Zip 18.03 - 7-Zip 18.03 Multli Thread 4 runs
min: 73927 avg: 77006 median: 77020 (44%) max: 80057 MIPS
CPU TDP 45 W TDP 55 W TDP 110 W TDP 191 W 92% 95% 100% 97%
...
...
max:
7-Zip 18.03 - 7-Zip 18.03 Single Thread 4 runs
min: 5828 avg: 5934 median: 5891 (70%) max: 6125 MIPS
CPU TDP 45 W TDP 55 W TDP 110 W TDP 191 W 95% 97% 100% 95%
...
...
max:
X264 HD Benchmark 4.0 - x264 Pass 2
175.1 fps (61%)
...
max:
X264 HD Benchmark 4.0 - x264 Pass 1
345.8 fps (80%)
...
max:
HWBOT x265 Benchmark v2.2 - HWBOT x265 4k Preset
min: 18.9 avg: 21.3 median: 21.4 (38%) max: 23.6 fps
CPU TDP 45 W TDP 55 W TDP 110 W TDP 191 W 80% 85% 100% 96%
...
...
max:
0 5 10 15 20 25 30 Tooltip Gigabyte G6X 9KG (2024): Ø21.2 (1.83-33)
Dell G16, i7-13650HX, RTX 4060: Ø19.3 (0.38-21.5)
Dell G15 5530: Ø23.2 (1.52-33.1)
Asus ROG Strix G18 G814JI: Ø23.6 (1.12-31.9)
TrueCrypt - TrueCrypt Serpent
1.6 GB/s (0%)
...
...
max:
TrueCrypt - TrueCrypt Twofish
2.9 GB/s (50%)
...
max:
TrueCrypt - TrueCrypt AES
16.7 GB/s (43%)
...
max:
Blender - Blender 3.3 Classroom CPU *
min: 272 avg: 308.5 median: 280.5 (4%) max: 401 Seconds
CPU TDP 45 W TDP 55 W TDP 110 W TDP 191 W 100% 102% 102% 102%
...
...
Intel Celeron J4125
Blender - Blender 2.79 BMW27 CPU *
min: 158 avg: 178.5 median: 165 (1%) max: 226 Seconds
CPU TDP 45 W TDP 55 W TDP 110 W TDP 191 W 100% 100% 100% 100%
...
Apple M1 Max
...
AMD E1-2100
R Benchmark 2.5 - R Benchmark 2.5 *
min: 0.4217 avg: 0.4 median: 0.4 (9%) max: 0.4407 sec
CPU TDP 45 W TDP 55 W TDP 110 W TDP 191 W 100% 100% 100% 100%
...
...
AMD E1-2100
3DMark 06 - CPU - 3DMark 06 - CPU
16051 Points (34%)
...
max:
Super Pi mod 1.5 XS 1M - Super Pi mod 1.5 XS 1M *
6.7 s (1%)
Intel Core i7-11390H
...
VIA C3-M C3-M-1200
Super Pi mod 1.5 XS 2M - Super Pi mod 1.5 XS 2M *
14.8 s (1%)
...
Intel Core i7-11390H
Intel Core i5-1230U
AMD Ryzen 5 PRO 4650U
...
Intel Celeron Dual-Core T1400
Super Pi Mod 1.5 XS 32M - Super Pi mod 1.5 XS 32M *
370.4 s (2%)
...
Intel Core i5-1230U
AMD Ryzen 5 PRO 4650U
Intel Core i5-11500B
Intel Core i5-11320H
...
VIA C3-M C3-M-1200
3DMark 11 - 3DM11 Performance Physics
min: 21967 avg: 23883 median: 24468.5 (66%) max: 24629 Points
CPU TDP 45 W TDP 55 W TDP 110 W TDP 191 W 89% 99% 100% 99%
...
max:
3DMark - 3DMark Ice Storm Physics
90187 Points (73%)
...
...
max:
3DMark - 3DMark Ice Storm Extreme Physics
89359 Points (73%)
...
...
max:
3DMark - 3DMark Ice Storm Unlimited Physics
92195 Points (78%)
...
AMD Ryzen 9 5980HS
AMD Ryzen 9 5900HS
...
max:
3DMark - 3DMark Cloud Gate Physics
min: 21558 avg: 21733 median: 21744 (55%) max: 21896 Points
CPU TDP 55 W TDP 110 W TDP 191 W 100% 98% 99%
...
max:
3DMark - 3DMark Fire Strike Standard Physics
min: 27723 avg: 31118 median: 31955.5 (57%) max: 32839 Points
CPU TDP 45 W TDP 55 W TDP 110 W TDP 191 W 84% 97% 97% 100%
...
...
max:
3DMark - 3DMark Time Spy CPU
min: 13526 avg: 14070 median: 14032 (59%) max: 14690 Points
CPU TDP 45 W TDP 55 W TDP 110 W TDP 191 W 92% 100% 96% 96%
...
...
max:
Geekbench 6.2 - Geekbench 6.2 Single-Core
min: 2505 avg: 2534 median: 2533.5 (77%) max: 2562 pontok
CPU TDP 45 W TDP 55 W 98% 100%
...
...
Geekbench 6.2 - Geekbench 6.2 Multi-Core
min: 13554 avg: 13633 median: 13632.5 (54%) max: 13711 pontok
CPU TDP 45 W TDP 55 W 99% 100%
...
...
max:
Geekbench 5.5 - Geekbench 5.1 - 5.4 64 Bit Single-Core
min: 1810 avg: 1842 median: 1845 (78%) max: 1866 pontok
CPU TDP 45 W TDP 55 W TDP 110 W TDP 191 W 97% 100% 98% 99%
...
AMD Ryzen Z1
...
Geekbench 5.5 - Geekbench 5.1 - 5.4 64 Bit Multi-Core
min: 12509 avg: 13584 median: 13729.5 (25%) max: 14367 pontok
CPU TDP 45 W TDP 55 W TDP 110 W TDP 191 W 94% 87% 100% 98%
...
Apple M1 Max
...
max:
Geekbench 5.0 - Geekbench 5.0 64 Bit Single-Core
1795 pontok (8%)
...
...
max:
Geekbench 5.0 - Geekbench 5.0 64 Bit Multi-Core
12356 pontok (39%)
...
...
max:
AMD Ryzen Threadripper PRO 3995WX
Geekbench 4.4 - Geekbench 4.1 - 4.4 64 Bit Single-Core
7895 pontok (79%)
...
Intel Core i7-1265U
...
max:
Geekbench 4.4 - Geekbench 4.1 - 4.4 64 Bit Multi-Core
52742 pontok (59%)
...
...
max:
Mozilla Kraken 1.1 - Kraken 1.1 Total Score *
min: 502 avg: 506 median: 507 (1%) max: 511 ms
CPU TDP 45 W TDP 55 W TDP 110 W TDP 191 W 100% 100% 100% 100%
...
...
AMD A4-1250
max:
Apple S7
Octane V2 - Octane V2 Total Score
94168 Points (85%)
...
...
WebXPRT 4 - WebXPRT 4 Score
min: 260 avg: 272.5 median: 276.5 (79%) max: 277 Points
CPU TDP 45 W TDP 110 W TDP 191 W 94% 100% 100%
...
...
max:
WebXPRT 3 - WebXPRT 3 Score
min: 268 avg: 297 median: 302 (63%) max: 312 Points
CPU TDP 45 W TDP 55 W TDP 110 W TDP 191 W 97% 86% 100% 93%
...
...
CrossMark - CrossMark Overall
min: 1839 avg: 1877 median: 1842 (71%) max: 1951 Points
CPU TDP 45 W TDP 55 W TDP 191 W 100% 94% 94%
...
...
max:
Power Consumption - Prime95 Power Consumption - external Monitor *
min: 100.9 avg: 151.5 median: 161.9 (28%) max: 181.3 Watt
CPU TDP 45 W TDP 55 W TDP 110 W TDP 191 W 120% 101% 109% 100%
Qualcomm Snapdragon 7c Gen 2
...
Intel Xeon W-10885M
...
max:
AMD Ryzen Threadripper PRO 3975WX
0 15 30 45 60 75 90 105 120 135 150 165 180 195 210 Tooltip Gigabyte G6X 9KG (2024): Ø100.9 (83.9-141.4)
Asus ROG Strix G18 G814JI: Ø146.8 (136.8-168.9)
Dell G16, i7-13650HX, RTX 4060: Ø176.7 (168.74-182.35)
Dell G15 5530: Ø181.3 (152.3-224)
Power Consumption - Cinebench R15 Multi Power Consumption - external Monitor *
min: 158 avg: 180.7 median: 181 (33%) max: 203 Watt
CPU TDP 55 W TDP 110 W TDP 191 W 106% 113% 100%
...
Intel Xeon W-10885M
...
max:
0 15 30 45 60 75 90 105 120 135 150 165 180 195 210 Tooltip Asus ROG Strix G18 G814JI: Ø158 (157-160.9)
Dell G16, i7-13650HX, RTX 4060: Ø181.3 (174.56-185.44)
Dell G15 5530: Ø203 (194.5-220)
Power Consumption - Idle Power Consumption - external Monitor *
min: 16.7 avg: 21.8 median: 20.4 (13%) max: 29.8 Watt
CPU TDP 45 W TDP 55 W TDP 110 W TDP 191 W 107% 109% 111% 100%
...
...
max:
0 5 10 15 20 25 30 35 Tooltip Asus ROG Strix G18 G814JI: Ø16.7 (10-25.8)
Dell G16, i7-13650HX, RTX 4060: Ø19.2 (2.9589-35.758)
Gigabyte G6X 9KG (2024): Ø21.7 (20.2-25.8)
Dell G15 5530: Ø29.8 (23.8-37.2)
Power Consumption - Idle Power Consumption 150cd 1min *
min: 13.1 avg: 14 median: 14 (16%) max: 15 Watt
CPU TDP 45 W TDP 55 W TDP 110 W 103% 101% 100%
...
AMD Ryzen 9 5900HS
...
max:
0 5 10 15 20 25 Tooltip Gigabyte G6X 9KG (2024): Ø13.1 (11.9-27.1)
Dell G16, i7-13650HX, RTX 4060: Ø14.6 (0.8094-28.274)
Asus ROG Strix G18 G814JI: Ø15 (9.02-20)
Power Consumption - Cinebench R15 Multi Power Efficiency - external Monitor
min: 15.5 avg: 17.3 median: 16.7 (12%) max: 19.8 Points per Watt
CPU TDP 55 W TDP 110 W TDP 191 W 84% 100% 78%
...
AMD Ryzen 5 3580U
Intel Core i5-11320H
AMD Ryzen 5 3500U
Intel Core i5-8250U
...
- A keresett grafikus kártyához tartozó benchmark értékek skálája
- A keresett grafikus kártyához tartozó átlagos benchmark értékek
* A kisebb számok nagyobb teljesítményt jelentenek.
v1.26
log 26. 00:18:28
#0 no ids found in url (should be separated by "_") +0s ... 0s
#1 not redirecting to Ajax server +0s ... 0s
#2 did not recreate cache, as it is less than 5 days old! Created at Thu, 25 Apr 2024 05:38:32 +0200 +0.001s ... 0.001s
#3 no comparison url found in template nbc.compare_page_2 needed +0.012s ... 0.013s
#4 no comparison url found in template nbc.compare_page_2 needed +0s ... 0.013s
#5 no comparison url found in template nbc.compare_page_2 needed +0s ... 0.014s
#6 no comparison url found in template nbc.compare_page_2 needed +0s ... 0.014s
#7 no comparison url found in template nbc.compare_page_2 needed +0s ... 0.014s
#8 no comparison url found in template nbc.compare_page_2 needed +0s ... 0.015s
#9 no comparison url found in template nbc.compare_page_2 needed +0s ... 0.015s
#10 no comparison url found in template nbc.compare_page_2 needed +0s ... 0.015s
#11 composed specs +0s ... 0.016s
#12 did output specs +0s ... 0.016s
#13 getting avg benchmarks for device 14669 +0.02s ... 0.036s
#14 got single benchmarks 14669 +0.026s ... 0.062s
#15 got avg benchmarks for devices +0s ... 0.062s
#16 min, max, avg, median took s +0.931s ... 0.993s
#17 no comparison url found in template nbc.compare_page_2 needed +0s ... 0.993s
#18 return log +0s ... 0.993s
Tesztek a következőre Intel Core i7-13650HX processzor
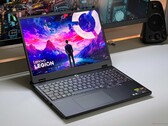
Asus ROG Strix G18 G814JI laptop rövid értékelés: Fény és árnyék a 18 hüvelykes gamer géppel 2023-ban egyre több 18 hüvelykes laptop lép be a gamer gépek szegmensébe. Az egyik különleges jelölt a ROG Strix G18, amely a legújabb, csúcskategóriás komponen...
Intel Core i7-13650HX | NVIDIA GeForce RTX 4070 Laptop GPU | 18.00" | 3 kg
Asus TUF Gaming A16 FA607J : NVIDIA GeForce RTX 4050 Laptop GPU, 16.00", 2.3 kg
Külsős Teszt » Asus TUF Gaming A16 FA607J
Gigabyte G6X 9KG (2024) : NVIDIA GeForce RTX 4060 Laptop GPU, 16.00", 2.6 kg
Külsős Teszt » Gigabyte G6X 9KG (2024)
Asus ROG Strix G16 G614JU, i7-13650HX : NVIDIA GeForce RTX 4050 Laptop GPU, 16.00", 2.5 kg
Külsős Teszt » Asus ROG Strix G16 G614JU, i7-13650HX
Dell G15 5530, RTX 4050 : NVIDIA GeForce RTX 4050 Laptop GPU, 15.60", 2.8 kg
Külsős Teszt » Dell G15 5530, RTX 4050
Dell G16 7630 : NVIDIA GeForce RTX 4060 Laptop GPU, 15.60", 2.9 kg
Külsős Teszt » Dell G16 7630
Asus ROG Strix G16 G614JV, i7-13650HX : NVIDIA GeForce RTX 4060 Laptop GPU, 16.00", 2.5 kg
Külsős Teszt » Asus ROG Strix G16 G614JV, i7-13650HX
Dell G15 5530 : NVIDIA GeForce RTX 4060 Laptop GPU, 15.60", 3 kg
Külsős Teszt » Dell G15 5530
Asus Vivobook Pro 15 K6502, i7-13650HX RTX 3050 : NVIDIA GeForce RTX 3050 4GB Laptop GPU, 15.60", 1.8 kg
Külsős Teszt » Asus Vivobook Pro 15 K6502, i7-13650HX RTX 3050
Asus ROG Strix G18 G814JI : NVIDIA GeForce RTX 4070 Laptop GPU, 18.00", 3 kg
Külsős Teszt » Asus ROG Strix G18 G814JI
Please share our article, every link counts!
A széria további processzorai Raptor Lake-HX Hasonló processzorok
Klaus Hinum (Update: 2023-12-10)