Notebookcheck Logo

Intel Core i5-1145G7
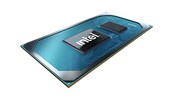
Intel i5-1145G7

Az Intel Core i5-1145G7 egy energiatakarékos négymagos SoC laptopok és ultrabookok számára, amely a 2021 elején bejelentett Tiger Lake-U generáción alapul. Négy Willow Cove processzormagot (a HyperThreadingnek köszönhetően 8 szálat) integrál. Az alap órajele a TDP-beállításoktól függ, és 1,1 GHz (12 Watt TDP) és 2,6 GHz (28 Watt) között mozog. A Boost mindig 4,4 GHz-en van megadva (egy vagy két mag).

További újdonság a teljesen új Gen 12 architektúrán alapuló, 80 EU-s integrált Xe grafikus kártya. Ez a régebbi Iris Plus G7 (Ice Lake) processzorhoz képest jelentősen nagyobb teljesítményt nyújt.

A Tiger Lake SoC-k továbbá PCIe 4 támogatással (4 sáv), AI hardveres gyorsítással, valamint a Thunderbolt 4 / USB 4 és Wifi 6 részleges integrációjával bővülnek a chipben. Ezen felül az i5 támogatja a vPro-t a könnyű távoli menedzselés érdekében.

A chip az Intel továbbfejlesztett 10 nm-es SuperFin eljárásában készül, amely a TSMC 7 nm-es eljárásához (pl. Ryzen 4000-es sorozat) hasonlíthatónak kell lennie.

SzériaIntel Tiger Lake
KódnévTiger Lake-UP3

Széria: Tiger Lake Tiger Lake-UP3

Intel Core i7-1195G72.9 - 5 GHz4 / 8 cores12 MB L3
Intel Core i7-1185G73 - 4.8 GHz4 / 8 cores12 MB L3
Intel Core i7-1165G72.8 - 4.7 GHz4 / 8 cores12 MB L3
Intel Core i5-1155G72.5 - 4.5 GHz4 / 8 cores8 MB L3
Intel Core i5-1145G7 « 2.6 - 4.4 GHz4 / 8 cores8 MB L3
Intel Core i5-1135G72.4 - 4.2 GHz4 / 8 cores8 MB L3
Intel Core i3-1125G42 - 3.7 GHz4 / 8 cores8 MB L3
Intel Core i3-1115G43 - 4.1 GHz2 / 4 cores6 MB L3
Órajel2600 - 4400 MHz
Level 1 Cache320 KB
Level 2 Cache5 MB
Level 3 Cache8 MB
Magok / Szálak4 / 8
Max. Áramfelvétel (TDP - Thermal Design Power)28 Watt
Gyártástechnológia10 nm
Max. Hőmérséklet100 °C
SocketBGA1449
JellegzetességekDDR4-3200/LPDDR4x-4266 RAM, PCIe 4, 4 GT/s bus, DL Boost, GNA, vPro, MMX, SSE, SSE2, SSE3, SSSE3, SSE4.1, SSE4.2, AVX, AVX2, AVX-512, BMI2, ABM, FMA, ADX, VMX, SMX, SMEP, SMAP, EIST, TM1, TM2, HT, Turbo, SST, AES-NI, RDRAND, RDSEED, SHA, TME
GPUIntel Iris Xe Graphics G7 80EUs (400 - 1300 MHz)
64 bit64 bites támogatás
Architecturex86
Bejelentés dátuma09/01/2020
Termék hivatkozás (külső)ark.intel.com

Benchmarkok

Performance Rating - CB R15 + R20 + 7-Zip + X265 + Blender + 3DM11 CPU
32.8 pt (45%)
AMD E1-2100
2.47 -92%
...
31.8 -3%
31.8 -3%
31.9 -3%
Intel Core i7-8850H
31.9 -3%
32 -2%
32.4 -1%
32.4 -1%
Intel Core i7-9750H
32.6 -1%
Intel Core i7-8559U
32.7 0%
Intel Core i5-1145G7
32.8
32.9 0%
Intel Core i7-9850H
32.9 0%
32.9 0%
33 1%
33.2 1%
33.6 2%
33.9 3%
33.9 3%
34 4%
...
57 74%
max:
72.1 120%
0%
100%
Cinebench R23 - Cinebench R23 Multi Core
min: 4769     avg: 4880     median: 4880 (5%)     max: 4991 Points
AMD E1-2100
202 -96%
...
3984 -18%
Intel Core i5-1035G1
4027 -17%
Intel Core i5-8257U
4033 -17%
Intel Core i7-10610U
4049 -17%
Intel Core i7-10710U
4079 -16%
4112 -16%
4311 -12%
Intel Core i5-8400H
4657 -5%
4724 -3%
Intel Core i5-1145G7
4880
Intel Core i5-1230U
4911 1%
5022 3%
5049 3%
5110 5%
5132 5%
5149 6%
5182 6%
5212 7%
5324 9%
...
32782 572%
max:
107681 2107%
0%
100%
Cinebench R23 - Cinebench R23 Single Core
min: 1361     avg: 1375     median: 1374.5 (58%)     max: 1388 Points
AMD E1-2100
114 -92%
...
1294 -6%
Intel Core i3-1115G4
1299 -6%
Intel Xeon W-10885M
1300 -5%
Intel Core i5-1230U
1319 -4%
1322 -4%
1362 -1%
1363 -1%
1365 -1%
1373 0%
Intel Core i5-1145G7
1375
1378 0%
AMD Ryzen 5 PRO 5675U
1388 1%
1409 2%
1410 3%
1412 3%
1418 3%
1425 4%
1425 4%
1428 4%
...
2184 59%
max:
2351 71%
0%
100%
Cinebench R20 - Cinebench R20 CPU (Single Core)
531 Points (59%)
Cinebench R20 - Cinebench R20 CPU (Multi Core)
min: 1693     avg: 1842     median: 1841.5 (4%)     max: 1990 Points
Cinebench R15 - Cinebench R15 CPU Multi 64 Bit
min: 791     avg: 792     median: 791.5 (5%)     max: 792 Points
AMD A4-1200
31 -96%
...
Intel Core i5-8400H
762 -4%
Intel Core i7-8705G
763 -4%
Intel Core i5-1038NG7
768 -3%
773 -2%
Intel Core i7-8706G
781 -1%
784 -1%
Intel Xeon E3-1535M v6
784 -1%
AMD Ryzen 7 3780U
788 -1%
Intel Core i7-8709G
791 0%
Intel Core i5-1145G7
792
Intel Core i5-8300H
793 0%
796 1%
Intel Core i7-8559U
798 1%
799 1%
809 2%
812 3%
814 3%
Intel Core i5-9400H
823 4%
825 4%
...
5600 607%
max:
15842 1900%
0%
100%
04590135180225270315360405450495540585630675720765810Tooltip
Cinebench R15 - Cinebench R15 CPU Single 64 Bit
min: 202     avg: 202.5     median: 202.5 (61%)     max: 203 Points
AMD A4-1200
19 -91%
...
194.8 -4%
Intel Xeon E-2276M
195 -4%
Intel Core i9-8950HK
195.9 -3%
196.7 -3%
Intel Core i9-9980HK
198.8 -2%
199.8 -1%
201 -1%
AMD Ryzen 5 5560U
202 0%
Apple M1 Max
202.3 0%
Intel Core i5-1145G7
202.5
203 0%
203.6 1%
205.1 1%
206.7 2%
206.7 2%
Apple M1
207.3 2%
209 3%
Intel Xeon W-10885M
209.8 4%
Apple M1 Pro 8-Core
210 4%
...
311 54%
max:
332 64%
0%
100%
Cinebench R11.5 - Cinebench R11.5 CPU Multi 64 Bit
min: 9.12     avg: 9.3     median: 9.3 (12%)     max: 9.41 Points
Cinebench R11.5 - Cinebench R11.5 CPU Single 64 Bit
min: 2.26     avg: 2.3     median: 2.3 (57%)     max: 2.36 Points
Cinebench R10 - Cinebench R10 Rend. Single (32bit)
min: 8225     avg: 8275     median: 8274.5 (50%)     max: 8324 pontok
Cinebench R10 - Cinebench R10 Rend. Multi (32bit)
min: 25475     avg: 25545     median: 25545 (19%)     max: 25615 pontok
Cinebench R10 - Cinebench R10 Rend. Multi (64bit)
min: 33427     avg: 34400     median: 34399.5 (24%)     max: 35372 Points
Cinebench R10 - Cinebench R10 Rend. Single (64bit)
min: 10472     avg: 10648     median: 10648 (13%)     max: 10824 Points
wPrime 2.10 - wPrime 2.0 1024m *
min: 227.285     avg: 281.1     median: 281.1 (3%)     max: 335 s
wPrime 2.10 - wPrime 2.0 32m *
min: 6.499     avg: 8.4     median: 8.3 (2%)     max: 10.2 s
WinRAR - WinRAR 4.0
min: 4190     avg: 4707     median: 4706.5 (7%)     max: 5223 pontok
7-Zip 18.03 - 7-Zip 18.03 Multli Thread 4 runs
min: 20565     avg: 21844     median: 21844 (13%)     max: 23123 MIPS
7-Zip 18.03 - 7-Zip 18.03 Single Thread 4 runs
min: 4751     avg: 4802     median: 4802 (57%)     max: 4853 MIPS
X264 HD Benchmark 4.0 - x264 Pass 2
46.3 fps (16%)
X264 HD Benchmark 4.0 - x264 Pass 1
192 fps (44%)
HWBOT x265 Benchmark v2.2 - HWBOT x265 4k Preset
min: 5.46     avg: 6     median: 6 (11%)     max: 6.6 fps
0123456789101112131415Tooltip
TrueCrypt - TrueCrypt Serpent
min: 0.437     avg: 0.5     median: 0.5 (0%)     max: 0.469 GB/s
TrueCrypt - TrueCrypt Twofish
min: 0.713     avg: 0.8     median: 0.8 (13%)     max: 0.802 GB/s
TrueCrypt - TrueCrypt AES
5.6 GB/s (15%)
Blender - Blender 3.3 Classroom CPU *
1116 Seconds (14%)
Blender - Blender 2.79 BMW27 CPU *
min: 601     avg: 641     median: 641 (5%)     max: 681 Seconds
R Benchmark 2.5 - R Benchmark 2.5 *
min: 0.627     avg: 0.6     median: 0.6 (14%)     max: 0.63 sec
3DMark 06 - CPU - 3DMark 06 - CPU
min: 8786     avg: 8923     median: 8922.5 (19%)     max: 9059 Points
Super Pi mod 1.5 XS 1M - Super Pi mod 1.5 XS 1M *
min: 7.2     avg: 7.5     median: 7.5 (2%)     max: 7.825 s
Super Pi mod 1.5 XS 2M - Super Pi mod 1.5 XS 2M *
min: 15.7     avg: 16.5     median: 16.5 (1%)     max: 17.298 s
Super Pi Mod 1.5 XS 32M - Super Pi mod 1.5 XS 32M *
min: 366     avg: 389.8     median: 389.8 (2%)     max: 413.691 s
3DMark Vantage - 3DM Vant. Perf. CPU no Physx
30874 Points (27%)
3DMark 11 - 3DM11 Performance Physics
min: 10880     avg: 11208     median: 11208 (30%)     max: 11536 Points
3DMark - 3DMark Ice Storm Physics
63423 Points (52%)
3DMark - 3DMark Ice Storm Extreme Physics
63591 Points (52%)
3DMark - 3DMark Ice Storm Unlimited Physics
65828 Points (55%)
3DMark - 3DMark Cloud Gate Physics
min: 8524     avg: 8726     median: 8725.5 (22%)     max: 8927 Points
3DMark - 3DMark Fire Strike Standard Physics
min: 13209     avg: 13311     median: 13311 (24%)     max: 13413 Points
3DMark - 3DMark Time Spy CPU
min: 4092     avg: 4290     median: 4289.5 (18%)     max: 4487 Points
Geekbench 5.5 - Geekbench 5.1 - 5.4 64 Bit Single-Core
min: 1427     avg: 1429     median: 1428.5 (60%)     max: 1430 pontok
AMD E1-2100
125 -91%
...
1373 -4%
AMD Ryzen 7 5800HS
1380 -3%
1388 -3%
Intel Core i7-11600H
1401 -2%
1410 -1%
1412 -1%
1412 -1%
1413 -1%
1428 0%
Intel Core i5-1145G7
1429
1430 0%
1431 0%
1438 1%
1441 1%
1452 2%
1452 2%
1456 2%
1460 2%
1464 2%
...
2331 63%
0%
100%
Geekbench 5.5 - Geekbench 5.1 - 5.4 64 Bit Multi-Core
min: 5055     avg: 5261     median: 5261 (9%)     max: 5467 pontok
Geekbench 5.0 - Geekbench 5.0 64 Bit Single-Core
1423 pontok (6%)
Geekbench 5.0 - Geekbench 5.0 64 Bit Multi-Core
5351 pontok (17%)
Geekbench 4.4 - Geekbench 4.1 - 4.4 64 Bit Single-Core
6226 pontok (62%)
Geekbench 4.4 - Geekbench 4.1 - 4.4 64 Bit Multi-Core
20787 pontok (23%)
Mozilla Kraken 1.1 - Kraken 1.1 Total Score *
min: 702     avg: 712     median: 712 (1%)     max: 722 ms
WebXPRT 4 - WebXPRT 4 Score
177.4 Points (51%)
WebXPRT 3 - WebXPRT 3 Score
min: 234     avg: 238.5     median: 238.5 (50%)     max: 243 Points
CrossMark - CrossMark Overall
min: 1279     avg: 1285     median: 1284.5 (49%)     max: 1290 Points
Power Consumption - Prime95 Power Consumption - external Monitor *
min: 38     avg: 42.8     median: 42.8 (7%)     max: 47.5 Watt
05101520253035404550556065707580Tooltip
Power Consumption - Cinebench R15 Multi Power Consumption - external Monitor *
min: 45.2     avg: 50.4     median: 50.4 (9%)     max: 55.5 Watt
0510152025303540455055606570Tooltip
Power Consumption - Idle Power Consumption - external Monitor *
10.9 Watt (7%)
012345678910111213141516Tooltip
Power Consumption - Idle Power Consumption 150cd 1min *
3.6 Watt (4%)
05101520Tooltip
Power Consumption - Cinebench R15 Multi Power Efficiency - external Monitor
17.5 Points per Watt (13%)
- A keresett grafikus kártyához tartozó benchmark értékek skálája
- A keresett grafikus kártyához tartozó átlagos benchmark értékek
* A kisebb számok nagyobb teljesítményt jelentenek.

v1.26
log 17. 01:05:48

#0 no ids found in url (should be separated by "_") +0s ... 0s

#1 not redirecting to Ajax server +0s ... 0s

#2 did not recreate cache, as it is less than 5 days old! Created at Tue, 16 Apr 2024 05:37:29 +0200 +0.001s ... 0.001s

#3 no comparison url found in template nbc.compare_page_2 needed +0.008s ... 0.009s

#4 no comparison url found in template nbc.compare_page_2 needed +0s ... 0.009s

#5 no comparison url found in template nbc.compare_page_2 needed +0s ... 0.009s

#6 no comparison url found in template nbc.compare_page_2 needed +0s ... 0.01s

#7 no comparison url found in template nbc.compare_page_2 needed +0s ... 0.01s

#8 no comparison url found in template nbc.compare_page_2 needed +0s ... 0.01s

#9 no comparison url found in template nbc.compare_page_2 needed +0s ... 0.01s

#10 composed specs +0s ... 0.01s

#11 did output specs +0s ... 0.01s

#12 getting avg benchmarks for device 12236 +0.018s ... 0.028s

#13 got single benchmarks 12236 +0.02s ... 0.048s

#14 got avg benchmarks for devices +0s ... 0.048s

#15 min, max, avg, median took s +1.1s ... 1.148s

#16 no comparison url found in template nbc.compare_page_2 needed +0s ... 1.149s

#17 return log +0s ... 1.149s

Tesztek a következőre Intel Core i5-1145G7 processzor

Panasonic Toughbook FZ-40: Intel Iris Xe Graphics G7 80EUs, 14.00", 3.4 kg
  Külsős Teszt » Panasonic Toughbook FZ-40

Acer Chromebook 515 CB515-1W-50FL: Intel Iris Xe Graphics G7 80EUs, 15.60", 1.7 kg
  Külsős Teszt » Acer Chromebook 515 CB515-1W-50FL

Dell Latitude 15 9520, i5-1145G7: Intel Iris Xe Graphics G7 80EUs, 15.00", 1.4 kg
  Külsős Teszt » Dell Latitude 15 9520, i5-1145G7

Dell Latitude 14 3420-WNC19: Intel Iris Xe Graphics G7 80EUs, 14.00", 1.5 kg
  Külsős Teszt » Dell Latitude 14 3420-WNC19

Lenovo ThinkPad T14 G2-20W00027US: Intel Iris Xe Graphics G7 80EUs, 14.00", 1.5 kg
  Külsős Teszt » Lenovo ThinkPad T14 G2-20W00027US

Fujitsu Lifebook U7511, i5-1145G7: Intel Iris Xe Graphics G7 80EUs, 15.60", 1.5 kg
  Külsős Teszt » Fujitsu Lifebook U7511, i5-1145G7

Fujitsu Lifebook E5411, i5-1145G7: Intel Iris Xe Graphics G7 80EUs, 14.00", 1.8 kg
  Külsős Teszt » Fujitsu Lifebook E5411, i5-1145G7

Fujitsu Lifebook U7411, i5-1145G7: Intel Iris Xe Graphics G7 80EUs, 14.00", 1.2 kg
  Külsős Teszt » Fujitsu Lifebook U7411, i5-1145G7

Dell Latitude 13 5320, i5-1145G7: Intel Iris Xe Graphics G7 80EUs, 13.30", 1.2 kg
  Külsős Teszt » Dell Latitude 13 5320, i5-1145G7

Dell Latitude 13 7320 2-in-1, i5-1145G7: Intel Iris Xe Graphics G7 80EUs, 13.30", 1.4 kg
  Külsős Teszt » Dell Latitude 7320 2-in-1, i5-1145G7

Please share our article, every link counts!

» Mobil processzorok összehasonlítása
Minden, noteszgépekben megtalálható CPU összehasonlítása

» Mobil processzorok Benchmark listája
Minden ismert noteszgép processzor benchmark listája

A széria további processzorai Tiger Lake

» Intel Core i9-11900KB
   8x 3.3 GHz - 5.3 GHz
» Intel Core i9-11980HK
   8x 3.3 GHz - 5 GHz
» Intel Core i9-11900H
   8x 2.5 GHz - 4.9 GHz
» Intel Core i9-11950H
   8x 2.6 GHz - 5 GHz
» Intel Xeon W-11955M
   8x 2.6 GHz - 5 GHz
» Intel Core i7-11850H
   8x 2.5 GHz - 4.8 GHz
» Intel Core i7-11800H
   8x 2.3 GHz - 4.6 GHz
» Intel Core i7-11600H
   6x 2.9 GHz - 4.6 GHz
» Intel Xeon W-11855M
   6x 3.2 GHz - 4.9 GHz
» Intel Core i5-11500H
   6x 2.9 GHz - 4.6 GHz
» Intel Core i5-11500B
   6x 3.3 GHz - 4.6 GHz
» Intel Core i5-11400H
   6x 2.7 GHz - 4.5 GHz
» Intel Core i5-11260H
   6x 2.6 GHz - 4.4 GHz
» Intel Core i7-11390H
   4x 3.4 GHz - 5 GHz
» Intel Core i7-11375H
   4x 3.3 GHz - 5 GHz
» Intel Core i7-1195G7
   4x 2.9 GHz - 5 GHz
» Intel Core i7-11370H
   4x 3.3 GHz - 4.8 GHz
» Intel Core i7-1185G7
   4x 3 GHz - 4.8 GHz
» Intel Core i7-1165G7
   4x 2.8 GHz - 4.7 GHz
» Intel Core i5-1155G7
   4x 2.5 GHz - 4.5 GHz
» Intel Core i5-11320H
   4x 3.2 GHz - 4.5 GHz
» Intel Core i5-11300H
   4x 3.1 GHz - 4.4 GHz
» Intel Core i5-1145G7
   4x 2.6 GHz - 4.4 GHz
» Intel Core i5-1135G7
   4x 2.4 GHz - 4.2 GHz
» Intel Core i7-1180G7
   4x 2.2 GHz - 4.6 GHz
» Intel Core i7-1160G7
   4x 2.1 GHz - 4.4 GHz
» Intel Core i5-1140G7
   4x 1.8 GHz - 4.2 GHz
» Intel Core i5-1130G7
   4x 1.8 GHz - 4 GHz
» Intel Core i3-1125G4
   4x 2 GHz - 3.7 GHz
» Intel Core i3-1115G4
   2x 3 GHz - 4.1 GHz
» Intel Core i3-1120G4
   4x 1.5 GHz - 3.5 GHz
» Intel Core i3-1110G4
   2x 2.5 GHz - 3.9 GHz
» Intel Celeron 6305
   2x 1.8 GHz
» Intel Celeron 6205
   2x
» Intel Pentium Gold 7505
   2x 2 GHz - 3.5 GHz

Hasonló processzorok

+ Intel Core i5-1230U
   10x 0.7 GHz - 4.4 GHz
+ Intel Core 3 100U
   6x 0.9 GHz - 4.7 GHz
+ Intel Core i3-1315U
   6x 0.9 GHz - 4.5 GHz
+ Intel Core i3-1215U
   6x 0.9 GHz - 4.4 GHz
+ Intel Core i5-10400H
   4x 2.6 GHz - 4.6 GHz
» Intel Core i5-1145G7
   4x 2.6 GHz - 4.4 GHz
- Intel Core i5-1135G7
   4x 2.4 GHz - 4.2 GHz
- AMD Ryzen 3 8440U
   4x 3 GHz - 4.7 GHz
- AMD Ryzen 3 7440U
   4x 3 GHz - 4.7 GHz
- Intel Core i5-10300H
   4x 2.5 GHz - 4.5 GHz
- AMD Ryzen 5 4500U
   6x 2.3 GHz - 4 GHz
> Magyarország - Kezdőlap > GYIK / Technológia / Benchmarkok > Noteszgép processzorok > Intel Tiger Lake i5-1145G7 SoC
Klaus Hinum (Update: 2021-08-12)