Tesztek a következőre Intel Core i7-1185G7 processzor
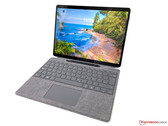
Microsoft Surface Pro 8 Convertible értékelés: Erős, 120 Hz-es és végre Thunderbolt-tal
A Microsoft az Intel új Tiger Lake CPU-ival, valamint nagyobb 13 hüvelykes, 120 Hz-es képernyővel, cserélhető SSD-vel és Thunderbolt 4-gyel frissíti csúcskategóriás átalakítható gépét. Az opcionális LTE-kapcsolat sajnos továbbra is csak az üzleti ügyfelekre korlátozódik.
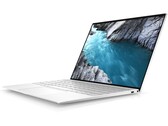
Intel Core i7-1185G7, Iris Xe G7 96EUs, 13", 891 gDell XPS 13 9310 Laptop rövid értékelés: Jobb, mint az IPS?
A vásárlók kérték, a Dell pedig hallgatott rájuk: XPS 13 9310 most OLED-del is elérhető, így egyike lett az első 13,4 hüvelykes 16:10-es laptopoknak, amelyek ezzel az opcióval rendelkeznek. Viszont nem árt az óvatosság, mivel az OLED-nek is megvannak a maga hátrányai.
Intel Core i7-1185G7, Iris Xe G7 96EUs, 13.4", 1.2 kgPanasonic Toughbook 40: Intel Iris Xe Graphics G7 96EUs, 14.00", 3.9 kg
Külsős Teszt » Panasonic Toughbook 40
Acer TravelMate P6 TMP614P-52-724G: Intel Iris Xe Graphics G7 96EUs, 14.00", 1.2 kg
Külsős Teszt » Acer TravelMate P6 TMP614P-52-724G
Dell Latitude 7330 Rugged Extreme: Intel Iris Xe Graphics G7 96EUs, 13.30", 2.7 kg
Külsős Teszt » Dell Latitude 7330 Rugged Extreme
Dell Latitude 14 5430 Rugged, i7-1185G7: Intel Iris Xe Graphics G7 96EUs, 14.00", 2 kg
Külsős Teszt » Dell Latitude 14 5430 Rugged, i7-1185G7
Dell Latitude 15 9520 2-in-1: Intel Iris Xe Graphics G7 96EUs, 15.00", 1.7 kg
Külsős Teszt » Dell Latitude 15 9520 2-in-1
Dell Latitude 15 5520, i7-1185G7: Intel Iris Xe Graphics G7 96EUs, 15.60", 1.6 kg
Külsős Teszt » Dell Latitude 15 5520, i7-1185G7
Dell XPS 13 9310 Core i7 4K: Intel Iris Xe Graphics G7 96EUs, 13.40", 1.3 kg
Külsős Teszt » Dell XPS 13 9310 Core i7 4K
Microsoft Surface Pro 8, i7-1185G7: Intel Iris Xe Graphics G7 96EUs, 13.00", 0.9 kg
Külsős Teszt » Microsoft Surface Pro 8, i7-1185G7
Dell Latitude 15 9520-NMM8M: Intel Iris Xe Graphics G7 96EUs, 15.60", 1.4 kg
Külsős Teszt » Dell Latitude 15 9520-NMM8M
Panasonic Toughbook FZ-55 MK2: Intel Iris Xe Graphics G7 96EUs, 14.00", 2.3 kg
Külsős Teszt » Panasonic Toughbook FZ-55 MK2
MSI Summit E14 A11SCST-069NE: NVIDIA GeForce GTX 1650 Ti Mobile, 14.00", 1.3 kg
Külsős Teszt » MSI Summit E14 A11SCST-069NE
Dell Latitude 13 7320 2-in-1, i7-1185G7: Intel Iris Xe Graphics G7 96EUs, 13.30", 1.1 kg
Külsős Teszt » Dell Latitude 13 7320 2-in-1, i7-1185G7
MSI Summit E14 A11SCS: NVIDIA GeForce GTX 1650 Ti Max-Q, 14.00", 1.3 kg
Külsős Teszt » MSI Summit E14 A11SCS
Fujitsu LifeBook U9311X i7 LTE: Intel Iris Xe Graphics G7 96EUs, 13.30", 1 kg
Külsős Teszt » Fujitsu LifeBook U9311X i7 LTE
HP ZBook Firefly 14 G8, i7-1185G7: NVIDIA T500 Laptop GPU, 14.00", 1.4 kg
Külsős Teszt » HP ZBook Firefly 14 G8, i7-1185G7
Microsoft Surface Laptop 4 15, i7-1185G7: Intel Iris Xe Graphics G7 96EUs, 15.00", 1.5 kg
Külsős Teszt » Microsoft Surface Laptop 4 15, i7-1185G7
Dell Latitude 9420 2-in-1: Intel Iris Xe Graphics G7 96EUs, 14.00", 1.5 kg
Külsős Teszt » Dell Latitude 9420 2-in-1
MSI Prestige 14 A11SCS-036DC: NVIDIA GeForce GTX 1650 Ti Max-Q, 14.00", 1.3 kg
Külsős Teszt » MSI Prestige 14 A11SCS-036DC
Lenovo ThinkPad X1 Yoga G6-20XY002VUS: Intel Iris Xe Graphics G7 96EUs, 14.00", 1.4 kg
Külsős Teszt » Lenovo ThinkPad X1 Yoga G6-20XY002VUS
HP EliteBook 840 Aero G8 3E4Q6AA: Intel Iris Xe Graphics G7 96EUs, 14.00", 1.2 kg
Külsős Teszt » HP EliteBook 840 G8 3E4Q6AA
MSI Summit E15 A11SCS-091AU: NVIDIA GeForce GTX 1650 Ti Max-Q, 15.60", 1.7 kg
Külsős Teszt » MSI Summit E15 A11SCS-091AU
Asus ExpertBook B9 B9400CEA-KC0266R: Intel Iris Xe Graphics G7 96EUs, 14.00", 1 kg
Külsős Teszt » Asus ExpertBook B9 B9400CEA-KC0266R
Lenovo ThinkPad X1 Carbon G9 FHD, i7-1185G7: Intel Iris Xe Graphics G7 96EUs, 15.60", 1.1 kg
Külsős Teszt » Lenovo ThinkPad X1 Carbon G9 FHD, i7-1185G7
MSI Prestige 14 Evo A11M-266RU: Intel Iris Xe Graphics G7 96EUs, 14.00", 1.3 kg
Külsős Teszt » MSI Prestige 14 Evo A11M-266RU
MSI Stealth 15M A11SEK-055XES: NVIDIA GeForce RTX 2060 Mobile, 15.60", 1.7 kg
Külsős Teszt » MSI Stealth 15M A11SEK-055XES
HP ZBook Firefly 15 G8-313P1EA: NVIDIA T500 Laptop GPU, 15.60", 1.8 kg
Külsős Teszt » HP ZBook Firefly 15 G8-313P1EA
Dell Latitude 14 7420, i7-1185G7: Intel Iris Xe Graphics G7 96EUs, 14.00", 1.2 kg
Külsős Teszt » Dell Latitude 14 7420, i7-1185G7
Dell XPS 13 9310 OLED: Intel Iris Xe Graphics G7 96EUs, 13.40", 1.2 kg
Külsős Teszt » Dell XPS 13 9310 OLED
MSI Summit E13 Flip Evo A11MT: Intel Iris Xe Graphics G7 96EUs, 13.40", 1.4 kg
Külsős Teszt » MSI Summit E13 Flip Evo A11MT
Dell Latitude 13 7320, i7-1185G7: Intel Iris Xe Graphics G7 96EUs, 13.30", 1.3 kg
Külsős Teszt » Dell Latitude 13 7320, i7-1185G7
Lenovo ThinkPad P14s Gen2-20VX000GGE: NVIDIA T500 Laptop GPU, 14.00", 1.5 kg
Külsős Teszt » Lenovo ThinkPad P14s Gen2-20VX000GGE
HP Elite Dragonfly Max: Intel Iris Xe Graphics G7 96EUs, 13.30", 1.2 kg
Külsős Teszt » HP Elite Dragonfly Max
Microsoft Surface Laptop 4 13 i7: Intel Iris Xe Graphics G7 96EUs, 13.50", 1.3 kg
Külsős Teszt » Microsoft Surface Laptop 4 13 i7
MSI Prestige 15 A11SCS-033XES: NVIDIA GeForce GTX 1650 Ti Max-Q, 15.60", 1.7 kg
Külsős Teszt » MSI Prestige 15 A11SCS-033XES
HP EliteBook 840 Aero G8, i7-1185G7: Intel Iris Xe Graphics G7 96EUs, 14.00", 1.2 kg
Külsős Teszt » HP EliteBook 840 Aero G8, i7-1185G
Lenovo Yoga 9i 14ITL5-82BG004GGE: Intel Iris Xe Graphics G7 96EUs, 14.00", 1.4 kg
Külsős Teszt » Lenovo Yoga 9i 14ITL5-82BG004GGE
MSI Summit E15 A11SCST-067RU: NVIDIA GeForce GTX 1650 Ti Max-Q, 15.60", 1.8 kg
Külsős Teszt » MSI Summit E15 A11SCST-067RU
MSI Summit E15 A11SCST-227ID: NVIDIA GeForce GTX 1650 Ti Max-Q, 15.60"
Külsős Teszt » MSI Summit E15 A11SCST-227ID
MSI Prestige 15 A11SCX-019XES: NVIDIA GeForce GTX 1650 Max-Q, 15.60", 1.7 kg
Külsős Teszt » MSI Prestige 15 A11SCX-019XES
MSI Prestige 14 Evo A11M-014IT: Intel Iris Xe Graphics G7 96EUs, 14.00", 1.3 kg
Külsős Teszt » MSI Prestige 14 Evo A11M-014IT
MSI Summit E15 A11SCST: NVIDIA GeForce GTX 1650 Ti Max-Q, 15.60", 1.8 kg
Külsős Teszt » MSI Summit E15 A11SCST
Lenovo Yoga 9 14 ITL 4K: Intel Iris Xe Graphics G7 96EUs, 14.00", 1.5 kg
Külsős Teszt » Lenovo Yoga 9 14 ITL 4K
MSI Stealth 15M A11SDK-085: NVIDIA GeForce GTX 1660 Ti Max-Q, 15.60"
Külsős Teszt » MSI Stealth 15M A11SDK-085
MSI Stealth 15M A11SDK-032RU: NVIDIA GeForce GTX 1660 Ti Max-Q, 15.60"
Külsős Teszt » MSI Stealth 15M A11SDK-032RU
MSI Prestige 14 Evo A11M-005: Intel Iris Xe Graphics G7 96EUs, 14.00", 1.2 kg
Külsős Teszt » MSI Prestige 14 Evo A11M-005
Lenovo Yoga 9 14ITL5, i7-1185G7: Intel Iris Xe Graphics G7 96EUs, 14.00", 1.4 kg
Külsős Teszt » Lenovo Yoga 9 14ITL5, i7-1185G7