Tesztek a következőre Intel Core i7-10875H processzor
Dell Precision 5550 Munkaállomás rövid értékelés: Az XPS 15 Profiknak
Bár a hagyományos munkaállomások, mint a Precision 7550, soha nem lesznek helyettesíthetőek, egyre nagyobb az igény a stílusos, ultravékony munkaállomásokra is. A Precision 5550 az XPS 15 9500-ban levő GeForce GPU-kat TUring Quadro GPU-kra cseréli, ezáltal vonzóbbá téve a profik számára.
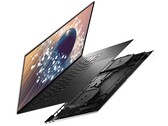
Intel Core i7-10875H, NVIDIA Quadro T2000 Max-Q, 15.6", 2 kgDell XPS 17 9700 Core i7 Laptop rövid értékelés: Nagyjából egy MacBook Pro 17
Vajon a Dell képes ugyanúgy uralni a 17 hüvelykes piacot, ahogy meghódította a 15 hüvelykest? Az XPS 17 meglepően kompakt, olyan specifikációkkal, amelyek szerint akár kétszer akkora is lehetne, de néhány apróbb részletben mellélőtt.
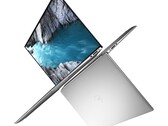
Intel Core i7-10875H, NVIDIA GeForce RTX 2060 Max-Q, 17", 2.5 kgDell XPS 15 9500 Core i7 GeForce GTX 1650 Ti Laptop rövid értékelés: Semmi Core i9 Ostobaság
Mi a különbség az 1300 dolláros XPS 15 és a 2400 dolláros XPS 15 között? A kijelző felbontása és a teljesítmény előnyei egyértelműek, de emellett kisebb változások is vannak. Itt mindegyiket megvizsgáljuk.
Intel Core i7-10875H, NVIDIA GeForce GTX 1650 Ti Mobile, 15.6", 2 kgAcer ConceptD 7 Ezel CC715-71-789C: NVIDIA GeForce RTX 2070 Max-Q, 15.60", 2.5 kg
Külsős Teszt » Acer ConceptD 7 Ezel CC715-71-789C
Asus TUF Gaming F15 FX506LH-HN129: NVIDIA GeForce GTX 1650 Mobile, 15.60", 2.3 kg
Külsős Teszt » Asus TUF Gaming F15 FX506LH-HN129
MSI Creator 15 A10UG: NVIDIA GeForce RTX 3070 Laptop GPU, 15.60", 2.1 kg
Külsős Teszt » MSI Creator 15 A10UG
MSI Creator 15 A10SFS-287: NVIDIA GeForce RTX 2070 Super Max-Q, 15.60", 1.9 kg
Külsős Teszt » MSI Creator 15 A10SFS-287
Razer Blade Pro 17 2021 (QHD Touch): NVIDIA GeForce RTX 3080 Laptop GPU, 17.30", 3 kg
Külsős Teszt » Razer Blade Pro 17 2021 Touch 4K, i7-10875H RTX 3080
MSI GE75 Raider 10SF-286: NVIDIA GeForce RTX 2070 Mobile, 17.30", 2.6 kg
Külsős Teszt » MSI GE75 Raider 10SF-286
Razer Blade 15 Advanced Edition 2021 QHD, i7-10875H RTX 3080: NVIDIA GeForce RTX 3080 Laptop GPU, 15.60", 2.2 kg
Külsős Teszt » Razer Blade 15 Advanced Edition 2021 QHD, i7-10875H RTX 3080
Hyperbook Pulsar V15: NVIDIA GeForce RTX 3060 Laptop GPU, 15.60", 1.7 kg
Külsős Teszt » Hyperbook Pulsar V15
Razer Blade Pro 17 2021 QHD, i7-10875H RTX 3060: NVIDIA GeForce RTX 3060 Laptop GPU, 17.30", 2.8 kg
Külsős Teszt » Razer Blade Pro 17 2021 QHD, i7-10875H RTX 3060
Lenovo Legion C7 15IMH05 82EH0030GE: NVIDIA GeForce RTX 2070 Max-Q, 15.60", 2.3 kg
Külsős Teszt » Lenovo Legion C7 15IMH05 82EH0030GE
Razer Blade 15 Advanced Edition 2021 FHD, i7-10875H RTX 3080: NVIDIA GeForce RTX 3080 Laptop GPU, 15.60", 2.2 kg
Külsős Teszt » Razer Blade 15 Advanced Edition 2021 FHD, i7-10875H RTX 3080
Aorus 15G KC: NVIDIA GeForce RTX 3060 Laptop GPU, 15.60", 2 kg
Külsős Teszt » Aorus 15G KC
Gigabyte Aero 15 OLED WB-8NL5130SP: NVIDIA GeForce RTX 2070 Max-Q, 15.60", 2 kg
Külsős Teszt » Gigabyte Aero 15 OLED WB-8NL5130SP
Asus Zephyrus S15 GX502LXS-XS79: NVIDIA GeForce RTX 2080 Super Max-Q, 15.60", 2 kg
Külsős Teszt » Asus Zephyrus S15 GX502LXS-XS79
Gigabyte G5 KC: NVIDIA GeForce RTX 3060 Laptop GPU, 15.60", 2.2 kg
Külsős Teszt » Gigabyte G5 KC
MSI GE66 Raider 10UG: NVIDIA GeForce RTX 3070 Laptop GPU, 15.60", 2.4 kg
Külsős Teszt » MSI GE66 Raider 10UG
Schenker XMG Pro 17 (Early 2021, RTX 3070): NVIDIA GeForce RTX 3070 Laptop GPU, 17.30", 2.3 kg
Külsős Teszt » Schenker XMG Pro 17 (Early 2021, RTX 3070)
Lenovo Legion 7 15IMHG05-81YU0007FR: NVIDIA GeForce RTX 2080 Super Max-Q, 15.60", 2.3 kg
Külsős Teszt » Lenovo Legion 7 15IMHG05-81YU0007FR
Asus ROG Strix Scar 17 G732LXS-HG014T: NVIDIA GeForce RTX 2080 Super Mobile, 17.30", 3 kg
Külsős Teszt » Asus ROG Strix SCAR 17 G732LXS-HG014T
Asus ROG Zephyrus M15 GU502LW-HC201T: NVIDIA GeForce RTX 2070 Max-Q, 15.60", 2 kg
Külsős Teszt » Asus ROG Zephyrus M15 GU502LW-HC201T
MSI GE76 Raider 10UE: NVIDIA GeForce RTX 3060 Laptop GPU, 17.30", 2.9 kg
Külsős Teszt » MSI GE76 Raider 10UE
Asus ROG Strix G15 G512LV-HN221: NVIDIA GeForce RTX 2060 Mobile, 15.60", 2.4 kg
Külsős Teszt » Asus ROG Strix G15 G512LV-HN221
MSI GS66 Stealth 10SE-616XES: NVIDIA GeForce RTX 2060 Mobile, 15.60", 2.1 kg
Külsős Teszt » MSI GS66 Stealth 10SE-616XES
MSI GE66 Raider 10SGS-498XES: NVIDIA GeForce RTX 2080 Super Max-Q, 15.60", 2.4 kg
Külsős Teszt » MSI GE66 Raider 10SGS-498XES
MSI Creator 15 A10SD-276ES: NVIDIA GeForce GTX 1660 Ti Max-Q, 15.60"
Külsős Teszt » MSI Creator 15 A10SD-276ES
MSI Creator 17 A10SGS: NVIDIA GeForce RTX 2080 Super Max-Q, 17.30", 2.4 kg
Külsős Teszt » MSI Creator 17 A10SGS
MSI GS66 Stealth 10SFS-440: NVIDIA GeForce RTX 2070 Super Max-Q, 15.60", 2.1 kg
Külsős Teszt » MSI GS66 Stealth 10SFS-440
MSI Creator 15 A10SF-008: NVIDIA GeForce RTX 2070 Max-Q, 15.60", 2.1 kg
Külsős Teszt » MSI Creator 15 A10SF-008
Asus ROG Strix G15 G512LW-HN852: NVIDIA GeForce RTX 2060 Mobile, 15.60", 2.3 kg
Külsős Teszt » Asus ROG Strix G15 G512LW-HN852
Asus ROG Zephyrus Duo 15 GX550LXS-HF073T: NVIDIA GeForce RTX 2080 Super Mobile, 15.60", 2.5 kg
Külsős Teszt » Asus ROG Zephyrus Duo 15 GX550LXS-HF073T
Razer Blade 15 Advanced Edition, i7-10875H, RTX 2070 Super: NVIDIA GeForce RTX 2070 Super Max-Q, 15.60", 2.2 kg
Külsős Teszt » Razer Blade 15 Advanced Edition, i7-10875H, RTX 2070 Super
Asus Strix Scar 17 G732LWS-HG029T: NVIDIA GeForce RTX 2070 Super Mobile, 17.30", 2.9 kg
Külsős Teszt » Asus Strix Scar 17 G732LWS-HG029T
Origin PC EVO15-S 2020: NVIDIA GeForce RTX 2080 Super Max-Q, 15.60", 2 kg
Külsős Teszt » Origin PC EVO15-S 2020
MSI Creator 17 A10SFS-269: NVIDIA GeForce RTX 2070 Super Max-Q, 17.30", 2.5 kg
Külsős Teszt » MSI Creator 17 A10SFS-269
Asus Strix Scar 15 G532LWS-HF162T: NVIDIA GeForce RTX 2070 Super Mobile, 15.60", 2.6 kg
Külsős Teszt » Asus Strix Scar 15 G532LWS-HF162T
Lenovo Legion 7i-81YU0035SB: NVIDIA GeForce RTX 2080 Super Max-Q, 15.60", 2.3 kg
Külsős Teszt » Lenovo Legion 7i-81YU0035SB
Razer Blade 15 Advanced Edition, i7-10875H, RTX 2080 Super Max-Q: NVIDIA GeForce RTX 2080 Super Max-Q, 15.60", 2.2 kg
Külsős Teszt » Razer Blade 15 Advanced Edition, i7-10875H, RTX 2080 Super Max-Q
Asus Strix Scar 17 G732LXS-HG047T: NVIDIA GeForce RTX 2080 Super Mobile, 17.30", 2.9 kg
Külsős Teszt » Asus Strix Scar 17 G732LXS-HG047T
Acer Predator Triton 500 PT515-52-77P9: NVIDIA GeForce RTX 2080 Super Mobile, 15.60", 2.1 kg
Külsős Teszt » Acer Predator Triton 500 PT515-52-77P9
Asus ROG Zephyrus S GX701L: NVIDIA GeForce RTX 2080 Super Max-Q, 17.30", 2.6 kg
Külsős Teszt » Asus ROG Zephyrus S GX701L
Asus Zephyrus S17 GX701LXS: NVIDIA GeForce RTX 2080 Super Max-Q, 17.30", 2.6 kg
Külsős Teszt » Asus Zephyrus S17 GX701LXS
Razer Blade 15 RTX 2080 Super Max-Q: NVIDIA GeForce RTX 2080 Super Max-Q, 15.60", 2.2 kg
Külsős Teszt » Razer Blade 15 RTX 2080 Super Max-Q
MSI Creator 17 A10SF-270: NVIDIA GeForce RTX 2070 Max-Q, 17.30", 2.5 kg
Külsős Teszt » MSI Creator 17 A10SF-270
Aorus 15G XB: NVIDIA GeForce RTX 2070 Super Max-Q, 15.60", 2.3 kg
Külsős Teszt » Aorus 15G XB
Acer Predator Triton 500 PT515-52: NVIDIA GeForce RTX 2070 Super Max-Q, 15.60", 2.1 kg
Külsős Teszt » Acer Predator Triton 500 PT515-52
MSI Creator 17 A10SE-256: NVIDIA GeForce RTX 2060 Mobile, 17.30", 2.5 kg
Külsős Teszt » MSI Creator 17 A10SE-256
Asus Strix Scar 17 G732LW-EV050T: NVIDIA GeForce RTX 2070 Mobile, 17.30", 2.9 kg
Külsős Teszt » Asus Strix Scar 17 G732LW-EV050T
Asus Strix Scar 15 G532LW-AZ056T: NVIDIA GeForce RTX 2070 Mobile, 15.60", 2.6 kg
Külsős Teszt » Asus Strix Scar 15 G532LW-AZ056T
Razer Blade Pro 17 RTX 2080 Super Max-Q: NVIDIA GeForce RTX 2080 Super Max-Q, 17.30", 2.8 kg
Külsős Teszt » Razer Blade Pro 17 RTX 2080 Super Max-Q
Razer Blade 15 Studio Edition 2020: NVIDIA Quadro RTX 5000 Max-Q, 15.60", 2.2 kg
Külsős Teszt » Razer Blade 15 Studio Edition 2020
Dell XPS 17 9700 Core i7 RTX 2060 Max-Q: NVIDIA GeForce RTX 2060 Max-Q, 17.00", 2.5 kg
Külsős Teszt » Dell XPS 17 9700 Core i7 RTX 2060 Max-Q
Gigabyte Aorus 17G XB: NVIDIA GeForce RTX 2070 Super Max-Q, 17.30", 2.7 kg
Külsős Teszt » Gigabyte Aorus 17G XB
Razer Blade Pro 17 RTX 2070 Max-Q 300 Hz: NVIDIA GeForce RTX 2070 Max-Q, 17.30", 2.7 kg
Külsős Teszt » Razer Blade Pro 17 RTX 2070 Max-Q 300 Hz
Asus Strix Scar 17 G732LXS-HG109T: NVIDIA GeForce RTX 2080 Super Mobile, 17.30", 2.9 kg
Külsős Teszt » Asus Strix Scar 17 G732LXS-HG109T
Gigabyte Aero 15 OLED KB-8NL5130SP: NVIDIA GeForce RTX 2060 Mobile, 15.60", 2 kg
Külsős Teszt » Gigabyte Aero 15 OLED KB-8NL5130SP
Asus Zephyrus S15 GX502LXS-HF038T: NVIDIA GeForce RTX 2080 Super Max-Q, 15.60", 2 kg
Külsős Teszt » Asus Zephyrus S15 GX502LXS-HF038T
Dell XPS 15 9500 Core i7 4K UHD: NVIDIA GeForce GTX 1650 Ti Mobile, 15.60", 2 kg
Külsős Teszt » Dell XPS 15 9500 Core i7 4K UHD
Aorus 15G YB-8DE2130MH: NVIDIA GeForce RTX 2080 Super Max-Q, 15.60", 2.2 kg
Külsős Teszt » Aorus 15G YB-8DE2130MH
Aorus 15G WB-8DE2130MD: NVIDIA GeForce RTX 2070 Max-Q, 15.60", 2.2 kg
Külsős Teszt » Aorus 15G WB-8DE2130MD
Asus Strix G15 G512LWS-AZ029T: NVIDIA GeForce RTX 2070 Super Mobile, 15.00", 2.4 kg
Külsős Teszt » Asus Strix G15 G512LWS-AZ029T
Aorus 17G XB: NVIDIA GeForce RTX 2070 Super Max-Q, 17.30", 2.7 kg
Külsős Teszt » Aorus 17G XB
Gigabyte Aero 17 HDR XB: NVIDIA GeForce RTX 2070 Super Max-Q, 17.30", 2.7 kg
Külsős Teszt » Gigabyte Aero 17 HDR XB
Asus ROG Zephyrus Duo 15 GX550LWS-HF055T: NVIDIA GeForce RTX 2070 Super Mobile, 15.60", 2.4 kg
Külsős Teszt » Asus ROG Zephyrus Duo 15 GX550LWS-HF055T
Gigabyte Aero 15 OLED XB-8DE51B0SP: NVIDIA GeForce RTX 2070 Super Max-Q, 15.60", 2.2 kg
Külsős Teszt » Gigabyte Aero 15 OLED XB-8DE51B0SP