Dell XPS 17 9700 Core i7 Laptop rövid értékelés: Nagyjából egy MacBook Pro 17
Értékelés | Dátum | Modell | Súly | Magasság | Méret | Felbontás | Legjobb ár |
|---|---|---|---|---|---|---|---|
| 87.9 % v7 (old) | 08/2020 | Dell XPS 17 9700 Core i7 RTX 2060 Max-Q i7-10875H, GeForce RTX 2060 Max-Q | 2.5 kg | 19.5 mm | 17.00" | 3840x2400 | |
| 82.5 % v7 (old) | 11/2020 | MSI Creator 17 A10SGS i7-10875H, GeForce RTX 2080 Super Max-Q | 2.4 kg | 20 mm | 17.30" | 3840x2160 | |
| 80.9 % v7 (old) | 06/2020 | HP Envy 17t-cg000 i7-1065G7, GeForce MX330 | 2.7 kg | 19.3 mm | 17.30" | 3840x2160 | |
| 87 % v7 (old) | 05/2020 | Gigabyte Aero 17 HDR XB i7-10875H, GeForce RTX 2070 Super Max-Q | 2.7 kg | 21 mm | 17.30" | 3840x2160 | |
| 87.4 % v7 (old) | 07/2020 | Razer Blade Pro 17 RTX 2070 Max-Q 300 Hz i7-10875H, GeForce RTX 2070 Max-Q | 2.7 kg | 19.9 mm | 17.30" | 1920x1080 |

| SD Card Reader | |
| average JPG Copy Test (av. of 3 runs) | |
| Razer Blade Pro 17 RTX 2070 Max-Q 300 Hz (Toshiba Exceria Pro SDXC 64 GB UHS-II) | |
| Gigabyte Aero 17 HDR XB (Toshiba Exceria Pro SDXC 64 GB UHS-II) | |
| Dell XPS 17 9700 Core i7 RTX 2060 Max-Q (Toshiba Exceria Pro SDXC 64 GB UHS-II) | |
| HP Envy 17t-cg000 (Toshiba Exceria Pro SDXC 64 GB UHS-II) | |
| maximum AS SSD Seq Read Test (1GB) | |
| Gigabyte Aero 17 HDR XB (Toshiba Exceria Pro SDXC 64 GB UHS-II) | |
| Razer Blade Pro 17 RTX 2070 Max-Q 300 Hz (Toshiba Exceria Pro SDXC 64 GB UHS-II) | |
| Dell XPS 17 9700 Core i7 RTX 2060 Max-Q (Toshiba Exceria Pro SDXC 64 GB UHS-II) | |
| HP Envy 17t-cg000 (Toshiba Exceria Pro SDXC 64 GB UHS-II) | |


| |||||||||||||||||||||||||
Fényerő megoszlás: 84 %
Centrumban: 539.4 cd/m²
Kontraszt: 1686:1 (Fekete: 0.32 cd/m²)
ΔE ColorChecker Calman: 4.12 | ∀{0.5-29.43 Ø4.73}
calibrated: 3.91
ΔE Greyscale Calman: 1.5 | ∀{0.09-98 Ø4.97}
100% sRGB (Argyll 1.6.3 3D)
90.4% AdobeRGB 1998 (Argyll 1.6.3 3D)
99.8% AdobeRGB 1998 (Argyll 3D)
100% sRGB (Argyll 3D)
90.5% Display P3 (Argyll 3D)
Gamma: 2.15
CCT: 6438 K
| Dell XPS 17 9700 Core i7 RTX 2060 Max-Q Sharp LQ170R1, IPS, 17", 3840x2400 | Razer Blade Pro 17 RTX 2070 Max-Q 300 Hz Sharp LQ173M1JW02, IPS, 17.3", 1920x1080 | MSI Creator 17 A10SGS B173ZAN05.0 (AUO278E), Mini-LED IPS-Level, 17.3", 3840x2160 | HP Envy 17t-cg000 AU Optronics AUO168E, IPS, 17.3", 3840x2160 | Gigabyte Aero 17 HDR XB AUO B173ZAN03.2 (AUO329B), IPS, 17.3", 3840x2160 | Apple MacBook Pro 16 2019 i9 5500M APPA044, IPS, 16", 3072x1920 | |
|---|---|---|---|---|---|---|
| Display | -16% | -9% | -2% | -1% | ||
| Display P3 Coverage (%) | 90.5 | 72.2 -20% | 82 -9% | 86.2 -5% | 86.5 -4% | |
| sRGB Coverage (%) | 100 | 98.5 -1% | 97.5 -2% | 100 0% | 100 0% | |
| AdobeRGB 1998 Coverage (%) | 99.8 | 73 -27% | 84 -16% | 99.8 0% | 100 0% | |
| Response Times | 80% | 72% | 10% | 6% | -6% | |
| Response Time Grey 50% / Grey 80% * (ms) | 51.2 ? | 5.6 ? 89% | 45.2 ? 12% | 55.2 ? -8% | 52.4 ? -2% | |
| Response Time Black / White * (ms) | 32 ? | 9.6 ? 70% | 8.8 ? 72% | 29.6 ? 7% | 26 ? 19% | 34.9 ? -9% |
| PWM Frequency (Hz) | 26600 ? | 131700 | ||||
| Screen | -46% | -6% | -46% | 17% | 12% | |
| Brightness middle (cd/m²) | 539.4 | 328 -39% | 996 85% | 383.4 -29% | 487 -10% | 519 -4% |
| Brightness (cd/m²) | 494 | 329 -33% | 952 93% | 382 -23% | 475 -4% | 477 -3% |
| Brightness Distribution (%) | 84 | 78 -7% | 93 11% | 86 2% | 95 13% | 86 2% |
| Black Level * (cd/m²) | 0.32 | 0.35 -9% | 0.68 -113% | 0.34 -6% | 0.38 -19% | 0.39 -22% |
| Contrast (:1) | 1686 | 937 -44% | 1465 -13% | 1128 -33% | 1282 -24% | 1331 -21% |
| Colorchecker dE 2000 * | 4.12 | 4.74 -15% | 4.21 -2% | 6.24 -51% | 1.19 71% | 2.28 45% |
| Colorchecker dE 2000 max. * | 7.65 | 8.99 -18% | 6.79 11% | 10.18 -33% | 2.43 68% | 6.54 15% |
| Colorchecker dE 2000 calibrated * | 3.91 | 2.12 46% | 2.03 48% | 3.7 5% | 0.5 87% | 0.86 78% |
| Greyscale dE 2000 * | 1.5 | 6.8 -353% | 4.1 -173% | 6.6 -340% | 1.45 3% | 0.9 40% |
| Gamma | 2.15 102% | 2.2 100% | 2.207 100% | 2.272 97% | 2.21 100% | 2145 0% |
| CCT | 6438 101% | 6446 101% | 7491 87% | 5973 109% | 6557 99% | 6572 99% |
| Color Space (Percent of AdobeRGB 1998) (%) | 90.4 | 64.8 -28% | 84 -7% | 88 -3% | 88 -3% | 78 -14% |
| Color Space (Percent of sRGB) (%) | 100 | 98.6 -1% | 97 -3% | 100 0% | 100 0% | |
| Teljes átlag (program / beállítások) | 6% /
-24% | 19% /
-1% | -13% /
-31% | 7% /
12% | 3% /
9% |
* ... a kisebb jobb
Megjelenítési válaszidők
| ↔ Válaszidő Fekete-fehér | ||
|---|---|---|
| 32 ms ... emelkedés és süllyedés ↘ kombinálva | ↗ 18 ms emelkedés | 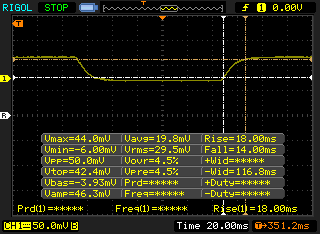 |
| ↘ 14 ms ősz | ||
| A képernyő lassú reakciósebességet mutat tesztjeinkben, és nem lesz kielégítő a játékosok számára. Összehasonlításképpen, az összes tesztelt eszköz 0.1 (minimum) és 240 (maximum) ms között mozog. » 86 % of all devices are better. Ez azt jelenti, hogy a mért válaszidő rosszabb, mint az összes vizsgált eszköz átlaga (19.9 ms). | ||
| ↔ Válaszidő 50% szürke és 80% szürke között | ||
| 51.2 ms ... emelkedés és süllyedés ↘ kombinálva | ↗ 27.2 ms emelkedés | 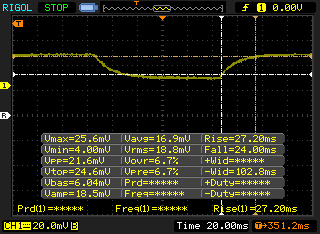 |
| ↘ 24 ms ősz | ||
| A képernyő lassú reakciósebességet mutat tesztjeinkben, és nem lesz kielégítő a játékosok számára. Összehasonlításképpen, az összes tesztelt eszköz 0.165 (minimum) és 636 (maximum) ms között mozog. » 88 % of all devices are better. Ez azt jelenti, hogy a mért válaszidő rosszabb, mint az összes vizsgált eszköz átlaga (31.1 ms). | ||
Képernyő villogása / PWM (impulzusszélesség-moduláció)
| Képernyő villogása / PWM nem érzékelhető |  | ||
Összehasonlításképpen: az összes tesztelt eszköz 52 %-a nem használja a PWM-et a kijelző elsötétítésére. Ha PWM-et észleltek, akkor átlagosan 7798 (minimum: 5 - maximum: 343500) Hz-t mértek. | |||
Cinebench R15: CPU Multi 64Bit | CPU Single 64Bit
Blender: v2.79 BMW27 CPU
7-Zip 18.03: 7z b 4 -mmt1 | 7z b 4
Geekbench 5.5: Single-Core | Multi-Core
HWBOT x265 Benchmark v2.2: 4k Preset
LibreOffice : 20 Documents To PDF
R Benchmark 2.5: Overall mean
| Cinebench R20 / CPU (Multi Core) | |
| MSI Bravo 17 A4DDR | |
| Asus Zephyrus G14 GA401IV | |
| Alienware m17 R2 P41E | |
| Asus Strix Scar 17 G732LXS | |
| MSI GE75 9SG | |
| Átlagos Intel Core i7-10875H (1986 - 4176, n=32) | |
| Dell XPS 17 9700 Core i7 RTX 2060 Max-Q | |
| Acer Nitro 5 AN515-44-R5FT | |
| MSI GE75 Raider 10SE-008US | |
| Dell G5 15 5590 | |
| Asus ROG Zephyrus S GX701GXR | |
| Dell XPS 15 9500 Core i5 | |
| Cinebench R20 / CPU (Single Core) | |
| Asus Zephyrus G14 GA401IV | |
| Asus Strix Scar 17 G732LXS | |
| Átlagos Intel Core i7-10875H (430 - 524, n=32) | |
| Dell XPS 17 9700 Core i7 RTX 2060 Max-Q | |
| MSI Bravo 17 A4DDR | |
| Alienware m17 R2 P41E | |
| MSI GE75 Raider 10SE-008US | |
| Dell XPS 15 9500 Core i5 | |
| MSI GE75 9SG | |
| Acer Nitro 5 AN515-44-R5FT | |
| Asus ROG Zephyrus S GX701GXR | |
| Dell G5 15 5590 | |
| Cinebench R15 / CPU Multi 64Bit | |
| MSI Bravo 17 A4DDR | |
| Asus Zephyrus G14 GA401IV | |
| Alienware m17 R2 P41E | |
| Asus Strix Scar 17 G732LXS | |
| MSI GE75 9SG | |
| Átlagos Intel Core i7-10875H (1003 - 1833, n=38) | |
| Dell XPS 17 9700 Core i7 RTX 2060 Max-Q | |
| Acer Nitro 5 AN515-44-R5FT | |
| MSI GE75 Raider 10SE-008US | |
| Dell G5 15 5590 | |
| Asus ROG Zephyrus S GX701GXR | |
| Dell XPS 15 9500 Core i5 | |
| Cinebench R15 / CPU Single 64Bit | |
| Átlagos Intel Core i7-10875H (190 - 220, n=37) | |
| Asus Strix Scar 17 G732LXS | |
| Dell XPS 17 9700 Core i7 RTX 2060 Max-Q | |
| Alienware m17 R2 P41E | |
| Asus Zephyrus G14 GA401IV | |
| MSI GE75 9SG | |
| MSI Bravo 17 A4DDR | |
| MSI GE75 Raider 10SE-008US | |
| Dell XPS 15 9500 Core i5 | |
| Acer Nitro 5 AN515-44-R5FT | |
| Asus ROG Zephyrus S GX701GXR | |
| Dell G5 15 5590 | |
| Blender / v2.79 BMW27 CPU | |
| Dell XPS 15 9500 Core i5 | |
| MSI GE75 Raider 10SE-008US | |
| Acer Nitro 5 AN515-44-R5FT | |
| Dell XPS 17 9700 Core i7 RTX 2060 Max-Q | |
| Átlagos Intel Core i7-10875H (259 - 535, n=30) | |
| Asus Zephyrus G14 GA401IV | |
| MSI GE75 9SG | |
| Asus Strix Scar 17 G732LXS | |
| MSI Bravo 17 A4DDR | |
| 7-Zip 18.03 / 7z b 4 -mmt1 | |
| Átlagos Intel Core i7-10875H (5071 - 5780, n=31) | |
| Asus Strix Scar 17 G732LXS | |
| Dell XPS 17 9700 Core i7 RTX 2060 Max-Q | |
| MSI GE75 Raider 10SE-008US | |
| MSI GE75 9SG | |
| Dell XPS 15 9500 Core i5 | |
| MSI Bravo 17 A4DDR | |
| Asus Zephyrus G14 GA401IV | |
| Acer Nitro 5 AN515-44-R5FT | |
| 7-Zip 18.03 / 7z b 4 | |
| MSI Bravo 17 A4DDR | |
| Asus Zephyrus G14 GA401IV | |
| MSI GE75 9SG | |
| Asus Strix Scar 17 G732LXS | |
| Átlagos Intel Core i7-10875H (29844 - 49562, n=31) | |
| Dell XPS 17 9700 Core i7 RTX 2060 Max-Q | |
| Acer Nitro 5 AN515-44-R5FT | |
| MSI GE75 Raider 10SE-008US | |
| Dell XPS 15 9500 Core i5 | |
| Geekbench 5.5 / Single-Core | |
| Dell XPS 17 9700 Core i7 RTX 2060 Max-Q | |
| Átlagos Intel Core i7-10875H (1233 - 1371, n=29) | |
| Asus Strix Scar 17 G732LXS | |
| MSI GE75 Raider 10SE-008US | |
| Asus Zephyrus G14 GA401IV | |
| MSI Bravo 17 A4DDR | |
| Dell XPS 15 9500 Core i5 | |
| Acer Nitro 5 AN515-44-R5FT | |
| Geekbench 5.5 / Multi-Core | |
| Asus Strix Scar 17 G732LXS | |
| MSI Bravo 17 A4DDR | |
| Dell XPS 17 9700 Core i7 RTX 2060 Max-Q | |
| Átlagos Intel Core i7-10875H (5715 - 8620, n=29) | |
| Asus Zephyrus G14 GA401IV | |
| MSI GE75 Raider 10SE-008US | |
| Acer Nitro 5 AN515-44-R5FT | |
| Dell XPS 15 9500 Core i5 | |
| HWBOT x265 Benchmark v2.2 / 4k Preset | |
| MSI Bravo 17 A4DDR | |
| Asus Strix Scar 17 G732LXS | |
| Asus Zephyrus G14 GA401IV | |
| MSI GE75 9SG | |
| Átlagos Intel Core i7-10875H (7.27 - 14.1, n=27) | |
| Dell XPS 17 9700 Core i7 RTX 2060 Max-Q | |
| MSI GE75 Raider 10SE-008US | |
| Acer Nitro 5 AN515-44-R5FT | |
| Dell XPS 15 9500 Core i5 | |
| LibreOffice / 20 Documents To PDF | |
| MSI Bravo 17 A4DDR | |
| Acer Nitro 5 AN515-44-R5FT | |
| Dell XPS 15 9500 Core i5 | |
| MSI GE75 Raider 10SE-008US | |
| Asus Strix Scar 17 G732LXS | |
| Átlagos Intel Core i7-10875H (30.2 - 84.3, n=30) | |
| Dell XPS 17 9700 Core i7 RTX 2060 Max-Q | |
| R Benchmark 2.5 / Overall mean | |
| Dell XPS 15 9500 Core i5 | |
| Acer Nitro 5 AN515-44-R5FT | |
| MSI GE75 Raider 10SE-008US | |
| Dell XPS 17 9700 Core i7 RTX 2060 Max-Q | |
| Átlagos Intel Core i7-10875H (0.546 - 0.662, n=29) | |
| Asus Strix Scar 17 G732LXS | |
| MSI Bravo 17 A4DDR | |
* ... a kisebb jobb
| PCMark 8 | |
| Home Score Accelerated v2 | |
| Razer Blade Pro 17 RTX 2070 Max-Q 300 Hz | |
| HP Envy 17t-cg000 | |
| Dell XPS 17 9700 Core i7 RTX 2060 Max-Q | |
| Work Score Accelerated v2 | |
| Razer Blade Pro 17 RTX 2070 Max-Q 300 Hz | |
| HP Envy 17t-cg000 | |
| Dell XPS 17 9700 Core i7 RTX 2060 Max-Q | |
| PCMark 8 Home Score Accelerated v2 | 3649 pontok | |
| PCMark 8 Work Score Accelerated v2 | 4385 pontok | |
| PCMark 10 Score | 5672 pontok | |
Segítség | ||
| DPC Latencies / LatencyMon - interrupt to process latency (max), Web, Youtube, Prime95 | |
| HP Envy 17t-cg000 | |
| Gigabyte Aero 17 HDR XB | |
| Razer Blade Pro 17 RTX 2070 Max-Q 300 Hz | |
| MSI Creator 17 A10SGS | |
| Dell XPS 17 9700 Core i7 RTX 2060 Max-Q | |
| Asus Zephyrus S17 GX701LXS | |
* ... a kisebb jobb
| Dell XPS 17 9700 Core i7 RTX 2060 Max-Q Micron 2200S 1TB MTFDHBA1T0TCK | Razer Blade Pro 17 RTX 2070 Max-Q 300 Hz Lite-On CA5-8D512 | HP Envy 17t-cg000 WDC PC SN520 SDAPNUW-512G | Gigabyte Aero 17 HDR XB Samsung SSD PM981a MZVLB512HBJQ | Apple MacBook Pro 16 2019 i9 5500M Apple SSD AP1024 7171 | Asus ProArt StudioBook Pro 17 W700G3T Samsung SSD PM981 MZVLB1T0HALR | |
|---|---|---|---|---|---|---|
| AS SSD | 19% | 20% | 79% | 39% | 104% | |
| Seq Read (MB/s) | 1141 | 2019 77% | 1161 2% | 1762 54% | 2531 122% | 2958 159% |
| Seq Write (MB/s) | 994 | 1314 32% | 809 -19% | 2309 132% | 2289 130% | 2350 136% |
| 4K Read (MB/s) | 31.98 | 46.61 46% | 40.63 27% | 49.45 55% | 15.85 -50% | 56.6 77% |
| 4K Write (MB/s) | 61 | 90.2 48% | 138.6 127% | 117.1 92% | 39.88 -35% | 106.1 74% |
| 4K-64 Read (MB/s) | 790 | 665 -16% | 857 8% | 1237 57% | 1267 60% | 1836 132% |
| 4K-64 Write (MB/s) | 845 | 813 -4% | 1041 23% | 1986 135% | 1749 107% | 1789 112% |
| Access Time Read * (ms) | 0.063 | 0.058 8% | 0.067 -6% | 0.076 -21% | 0.122 -94% | 0.061 3% |
| Access Time Write * (ms) | 0.679 | 0.167 75% | 0.026 96% | 0.032 95% | 0.095 86% | 0.036 95% |
| Score Read (Points) | 966 | 913 -5% | 1013 5% | 1463 51% | 1536 59% | 2189 127% |
| Score Write (Points) | 1005 | 1034 3% | 1260 25% | 2334 132% | 2018 101% | 2130 112% |
| Score Total (Points) | 2448 | 2392 -2% | 2783 14% | 4581 87% | 4317 76% | 5411 121% |
| Copy ISO MB/s (MB/s) | 1732 | 1715 -1% | 1350 -22% | 1995 15% | ||
| Copy Program MB/s (MB/s) | 717 | 622 -13% | 766 7% | 584 -19% | ||
| Copy Game MB/s (MB/s) | 1343 | 1506 12% | 1190 -11% | 1135 -15% | ||
| CrystalDiskMark 5.2 / 6 | 48% | 11% | 53% | 22% | 53% | |
| Write 4K (MB/s) | 64.1 | 119 86% | 124.2 94% | 123.4 93% | 55.5 -13% | 147.6 130% |
| Read 4K (MB/s) | 39.93 | 51.9 30% | 46.11 15% | 45.59 14% | 16.21 -59% | 47.57 19% |
| Write Seq (MB/s) | 1191 | 2258 90% | 2320 95% | 1959 64% | 2222 87% | |
| Read Seq (MB/s) | 1418 | 2283 61% | 2013 42% | 1763 24% | 2543 79% | |
| Write 4K Q32T1 (MB/s) | 450.3 | 491 9% | 447 -1% | 489.3 9% | 398.5 -12% | 459.2 2% |
| Read 4K Q32T1 (MB/s) | 365 | 540 48% | 350.1 -4% | 559 53% | 648 78% | 515 41% |
| Write Seq Q32T1 (MB/s) | 1563 | 2253 44% | 1463 -6% | 2979 91% | 2727 74% | 2167 39% |
| Read Seq Q32T1 (MB/s) | 2683 | 3172 18% | 1751 -35% | 3432 28% | 3242 21% | 3430 28% |
| Write 4K Q8T8 (MB/s) | 445.5 | |||||
| Read 4K Q8T8 (MB/s) | 926 | |||||
| Teljes átlag (program / beállítások) | 34% /
29% | 16% /
17% | 66% /
68% | 31% /
33% | 79% /
83% |
* ... a kisebb jobb

Disk Throttling: DiskSpd Read Loop, Queue Depth 8
| 3DMark | |
| 1920x1080 Fire Strike Graphics | |
| MSI Creator 17 A10SGS | |
| MSI RTX 2060 Gaming Z 6G | |
| Alienware 17 R5 | |
| Eluktronics RP-15 | |
| Asus TUF A17 FA706IU-AS76 | |
| Átlagos NVIDIA GeForce RTX 2060 Max-Q (14129 - 15650, n=4) | |
| Dell XPS 17 9700 Core i7 RTX 2060 Max-Q | |
| Dell XPS 15 9500 Core i7 4K UHD | |
| Dell XPS 15 7590 9980HK GTX 1650 | |
| 2560x1440 Time Spy Graphics | |
| MSI RTX 2060 Gaming Z 6G | |
| MSI Creator 17 A10SGS | |
| Eluktronics RP-15 | |
| Asus TUF A17 FA706IU-AS76 | |
| Alienware 17 R5 | |
| Átlagos NVIDIA GeForce RTX 2060 Max-Q (5357 - 5914, n=4) | |
| Dell XPS 17 9700 Core i7 RTX 2060 Max-Q | |
| Dell XPS 15 9500 Core i7 4K UHD | |
| Dell XPS 15 7590 9980HK GTX 1650 | |
| 2560x1440 Time Spy Score | |
| MSI RTX 2060 Gaming Z 6G | |
| MSI Creator 17 A10SGS | |
| Eluktronics RP-15 | |
| Asus TUF A17 FA706IU-AS76 | |
| Átlagos NVIDIA GeForce RTX 2060 Max-Q (5390 - 6171, n=4) | |
| Alienware 17 R5 | |
| Dell XPS 17 9700 Core i7 RTX 2060 Max-Q | |
| Dell XPS 15 9500 Core i7 4K UHD | |
| Dell XPS 15 7590 9980HK GTX 1650 | |
| 3DMark 11 | |
| 1280x720 Performance GPU | |
| MSI RTX 2060 Gaming Z 6G | |
| MSI Creator 17 A10SGS | |
| Alienware 17 R5 | |
| Eluktronics RP-15 | |
| Asus TUF A17 FA706IU-AS76 | |
| Átlagos NVIDIA GeForce RTX 2060 Max-Q (18863 - 21105, n=4) | |
| Dell XPS 17 9700 Core i7 RTX 2060 Max-Q | |
| Dell XPS 15 9500 Core i7 4K UHD | |
| Dell XPS 15 7590 9980HK GTX 1650 | |
| 1280x720 Performance Combined | |
| MSI Creator 17 A10SGS | |
| Dell XPS 17 9700 Core i7 RTX 2060 Max-Q | |
| Eluktronics RP-15 | |
| MSI RTX 2060 Gaming Z 6G | |
| Átlagos NVIDIA GeForce RTX 2060 Max-Q (12071 - 15054, n=4) | |
| Asus TUF A17 FA706IU-AS76 | |
| Dell XPS 15 9500 Core i7 4K UHD | |
| Alienware 17 R5 | |
| Dell XPS 15 7590 9980HK GTX 1650 | |
| 3DMark 11 Performance | 18021 pontok | |
| 3DMark Cloud Gate Standard Score | 31845 pontok | |
| 3DMark Fire Strike Score | 13173 pontok | |
| 3DMark Time Spy Score | 5637 pontok | |
Segítség | ||
| The Witcher 3 - 1920x1080 Ultra Graphics & Postprocessing (HBAO+) | |
| Gigabyte Aero 17 HDR XB | |
| MSI RTX 2060 Gaming Z 6G | |
| Dell G5 15 SE 5505 P89F | |
| Átlagos NVIDIA GeForce RTX 2060 Max-Q (51.2 - 62.9, n=4) | |
| Dell XPS 17 9700 Core i7 RTX 2060 Max-Q | |
| Asus TUF A17 FA706IU-AS76 | |
| MSI Bravo 15 A4DCR | |
| MSI GF75 Thin 10SCXR | |
| Asus TUF FX705GM | |
| Shadow of the Tomb Raider - 1920x1080 Highest Preset AA:T | |
| Gigabyte Aero 17 HDR XB | |
| MSI RTX 2060 Gaming Z 6G | |
| Asus TUF A17 FA706IU-AS76 | |
| Átlagos NVIDIA GeForce RTX 2060 Max-Q (65 - 74, n=2) | |
| Dell G5 15 SE 5505 P89F | |
| Dell XPS 17 9700 Core i7 RTX 2060 Max-Q | |
| Asus TUF FX705GM | |
| MSI GF75 Thin 10SCXR | |
| MSI Bravo 15 A4DCR | |
| alacsony | közepes | magas | ultra | 4K | |
|---|---|---|---|---|---|
| The Witcher 3 (2015) | 284.8 | 182.1 | 109 | 56.1 | 24.9 |
| Dota 2 Reborn (2015) | 152 | 140 | 131 | 123 | 75.5 |
| X-Plane 11.11 (2018) | 111 | 97.8 | 79.8 | 63.7 | |
| Shadow of the Tomb Raider (2018) | 118 | 84 | 75 | 65 | 20 |
| Far Cry New Dawn (2019) | 105 | 75 | 70 | 63 | |
| Dirt Rally 2.0 (2019) | 276.7 | 125.3 | 105.3 | 60.5 | 24.4 |
| Control (2019) | 183.7 | 67.1 | 50.4 | ||
| GRID 2019 (2019) | 157.4 | 109.4 | 103.4 | 73.5 | 33.1 |
| Star Wars Jedi Fallen Order (2019) | 92.9 | 88 | 77.8 | ||
| Gears Tactics (2020) | 257.9 | 120.4 | 76.4 | 56.9 | 18.9 |
| Dell XPS 17 9700 Core i7 RTX 2060 Max-Q GeForce RTX 2060 Max-Q, i7-10875H, Micron 2200S 1TB MTFDHBA1T0TCK | Razer Blade Pro 17 RTX 2070 Max-Q 300 Hz GeForce RTX 2070 Max-Q, i7-10875H, Lite-On CA5-8D512 | MSI Creator 17 A10SGS GeForce RTX 2080 Super Max-Q, i7-10875H, Samsung SSD PM981 MZVLB2T0HMLB | HP Envy 17t-cg000 GeForce MX330, i7-1065G7, WDC PC SN520 SDAPNUW-512G | Gigabyte Aero 17 HDR XB GeForce RTX 2070 Super Max-Q, i7-10875H, Samsung SSD PM981a MZVLB512HBJQ | Asus Zephyrus S17 GX701LXS GeForce RTX 2080 Super Max-Q, i7-10875H, Samsung PM981a MZVLB1T0HBLR | |
|---|---|---|---|---|---|---|
| Noise | -4% | -11% | 2% | -16% | -8% | |
| off / környezet * (dB) | 28 | 28.2 -1% | 30 -7% | 28.2 -1% | 30 -7% | 25 11% |
| Idle Minimum * (dB) | 28 | 28.2 -1% | 32 -14% | 28.2 -1% | 35 -25% | 32 -14% |
| Idle Average * (dB) | 28 | 28.2 -1% | 33 -18% | 28.2 -1% | 36 -29% | 35 -25% |
| Idle Maximum * (dB) | 28 | 30.5 -9% | 40 -43% | 29.5 -5% | 38 -36% | 43 -54% |
| Load Average * (dB) | 43.2 | 42.2 2% | 47 -9% | 43.9 -2% | 47 -9% | 44 -2% |
| Witcher 3 ultra * (dB) | 49 | 53 -8% | 46 6% | 43.9 10% | 49 -0% | 41 16% |
| Load Maximum * (dB) | 50.5 | 55.5 -10% | 48 5% | 43.9 13% | 54 -7% | 45 11% |
* ... a kisebb jobb
Zajszint
| Üresjárat |
| 28 / 28 / 28 dB(A) |
| Terhelés |
| 43.2 / 50.5 dB(A) |
 | ||
30 dB csendes 40 dB(A) hallható 50 dB(A) hangos |
||
min: | ||
(-) A felső oldalon a maximális hőmérséklet 53 °C / 127 F, összehasonlítva a 36.8 °C / 98 F átlagával , 21 és 71 °C között a Multimedia osztálynál.
(+) Az alsó maximum 39.2 °C / 103 F-ig melegszik fel, összehasonlítva a 39.1 °C / 102 F átlagával
(+) Üresjáratban a felső oldal átlagos hőmérséklete 31.4 °C / 89 F, összehasonlítva a 31.3 °C / ### eszközátlaggal class_avg_f### F.
(±) A The Witcher 3 játék során a felső oldal átlaghőmérséklete 37.3 °C / 99 F, összehasonlítva a 31.3 °C / ## eszközátlaggal #class_avg_f### F.
(+) A csuklótámasz és az érintőpad eléri a bőr maximális hőmérsékletét (34.2 °C / 93.6 F), ezért nem forrók.
(-) A hasonló eszközök csuklótámasz területének átlagos hőmérséklete 28.7 °C / 83.7 F volt (-5.5 °C / -9.9 F).
Dell XPS 17 9700 Core i7 RTX 2060 Max-Q hangelemzés
(±) | a hangszóró hangereje átlagos, de jó (75.8 dB)
Basszus 100 - 315 Hz
(±) | csökkentett basszus – átlagosan 8.3%-kal alacsonyabb, mint a medián
(±) | a basszus linearitása átlagos (8.6% delta az előző frekvenciához)
Közepes 400-2000 Hz
(+) | kiegyensúlyozott középpontok – csak 2.2% választja el a mediántól
(+) | a középpontok lineárisak (3.8% delta az előző frekvenciához)
Maximum 2-16 kHz
(+) | kiegyensúlyozott csúcsok – csak 2.1% választja el a mediántól
(+) | a csúcsok lineárisak (5.3% delta az előző frekvenciához képest)
Összességében 100 - 16.000 Hz
(+) | általános hangzás lineáris (10.9% eltérés a mediánhoz képest)
Ugyanazon osztályhoz képest
» 16%Ebben az osztályban az összes tesztelt eszköz %-a jobb volt, 3% hasonló, 81%-kal rosszabb
» A legjobb delta értéke 5%, az átlag 17%, a legrosszabb 45% volt
Az összes tesztelt eszközzel összehasonlítva
» 6% az összes tesztelt eszköz jobb volt, 2% hasonló, 92%-kal rosszabb
» A legjobb delta értéke 4%, az átlag 24%, a legrosszabb 134% volt
Apple MacBook 12 (Early 2016) 1.1 GHz hangelemzés
(+) | a hangszórók viszonylag hangosan tudnak játszani (83.6 dB)
Basszus 100 - 315 Hz
(±) | csökkentett basszus – átlagosan 11.3%-kal alacsonyabb, mint a medián
(±) | a basszus linearitása átlagos (14.2% delta az előző frekvenciához)
Közepes 400-2000 Hz
(+) | kiegyensúlyozott középpontok – csak 2.4% választja el a mediántól
(+) | a középpontok lineárisak (5.5% delta az előző frekvenciához)
Maximum 2-16 kHz
(+) | kiegyensúlyozott csúcsok – csak 2% választja el a mediántól
(+) | a csúcsok lineárisak (4.5% delta az előző frekvenciához képest)
Összességében 100 - 16.000 Hz
(+) | általános hangzás lineáris (10.2% eltérés a mediánhoz képest)
Ugyanazon osztályhoz képest
» 7%Ebben az osztályban az összes tesztelt eszköz %-a jobb volt, 2% hasonló, 91%-kal rosszabb
» A legjobb delta értéke 5%, az átlag 18%, a legrosszabb 53% volt
Az összes tesztelt eszközzel összehasonlítva
» 5% az összes tesztelt eszköz jobb volt, 1% hasonló, 94%-kal rosszabb
» A legjobb delta értéke 4%, az átlag 24%, a legrosszabb 134% volt
| Kikapcsolt állapot / Készenlét | |
| Üresjárat | |
| Terhelés |
|
Kulcs:
min: | |
| Dell XPS 17 9700 Core i7 RTX 2060 Max-Q i7-10875H, GeForce RTX 2060 Max-Q, Micron 2200S 1TB MTFDHBA1T0TCK, IPS, 3840x2400, 17" | Acer Aspire Nitro 5 AN517-51-7887 i7-9750H, GeForce GTX 1660 Ti Mobile, WDC PC SN520 SDAPNUW-512G, IPS, 1920x1080, 17.3" | MSI Creator 17 A10SGS i7-10875H, GeForce RTX 2080 Super Max-Q, Samsung SSD PM981 MZVLB2T0HMLB, Mini-LED IPS-Level, 3840x2160, 17.3" | HP Envy 17t-cg000 i7-1065G7, GeForce MX330, WDC PC SN520 SDAPNUW-512G, IPS, 3840x2160, 17.3" | Gigabyte Aero 17 HDR XB i7-10875H, GeForce RTX 2070 Super Max-Q, Samsung SSD PM981a MZVLB512HBJQ, IPS, 3840x2160, 17.3" | Apple MacBook Pro 16 2019 i9 5500M i9-9880H, Radeon Pro 5500M, Apple SSD AP1024 7171, IPS, 3072x1920, 16" | |
|---|---|---|---|---|---|---|
| Power Consumption | 11% | -78% | 24% | -69% | 18% | |
| Idle Minimum * (Watt) | 5.8 | 3.9 33% | 15 -159% | 6.1 -5% | 16 -176% | 3.7 36% |
| Idle Average * (Watt) | 20.6 | 8.9 57% | 20 3% | 13 37% | 19 8% | 12.1 41% |
| Idle Maximum * (Watt) | 21 | 12.2 42% | 42 -100% | 13.5 36% | 30 -43% | 17 19% |
| Load Average * (Watt) | 104.7 | 83 21% | 150 -43% | 72.7 31% | 109 -4% | 91.5 13% |
| Witcher 3 ultra * (Watt) | 99.2 | 130 -31% | 170 -71% | 62.2 37% | 167 -68% | 103 -4% |
| Load Maximum * (Watt) | 107.6 | 168 -56% | 210 -95% | 97.1 10% | 246 -129% | 102.3 5% |
* ... a kisebb jobb
| Dell XPS 17 9700 Core i7 RTX 2060 Max-Q i7-10875H, GeForce RTX 2060 Max-Q, 97 Wh | Razer Blade Pro 17 RTX 2070 Max-Q 300 Hz i7-10875H, GeForce RTX 2070 Max-Q, 70 Wh | MSI Creator 17 A10SGS i7-10875H, GeForce RTX 2080 Super Max-Q, 82 Wh | HP Envy 17t-cg000 i7-1065G7, GeForce MX330, 55 Wh | Gigabyte Aero 17 HDR XB i7-10875H, GeForce RTX 2070 Super Max-Q, 94 Wh | Apple MacBook Pro 16 2019 i9 5500M i9-9880H, Radeon Pro 5500M, 99.8 Wh | |
|---|---|---|---|---|---|---|
| Akkumulátor üzemidő | -49% | -57% | -39% | -26% | -13% | |
| Reader / Idle (h) | 23.8 | 7.2 -70% | 15.4 -35% | 9.9 -58% | ||
| WiFi v1.3 (h) | 9.7 | 4.9 -49% | 4.4 -55% | 4.6 -53% | 6.2 -36% | 12 24% |
| Load (h) | 2 | 1.1 -45% | 1.4 -30% | 2.3 15% | 1 -50% | |
| Witcher 3 ultra (h) | 0.9 |
Pro
Kontra
Összegzés - Egyedülálló
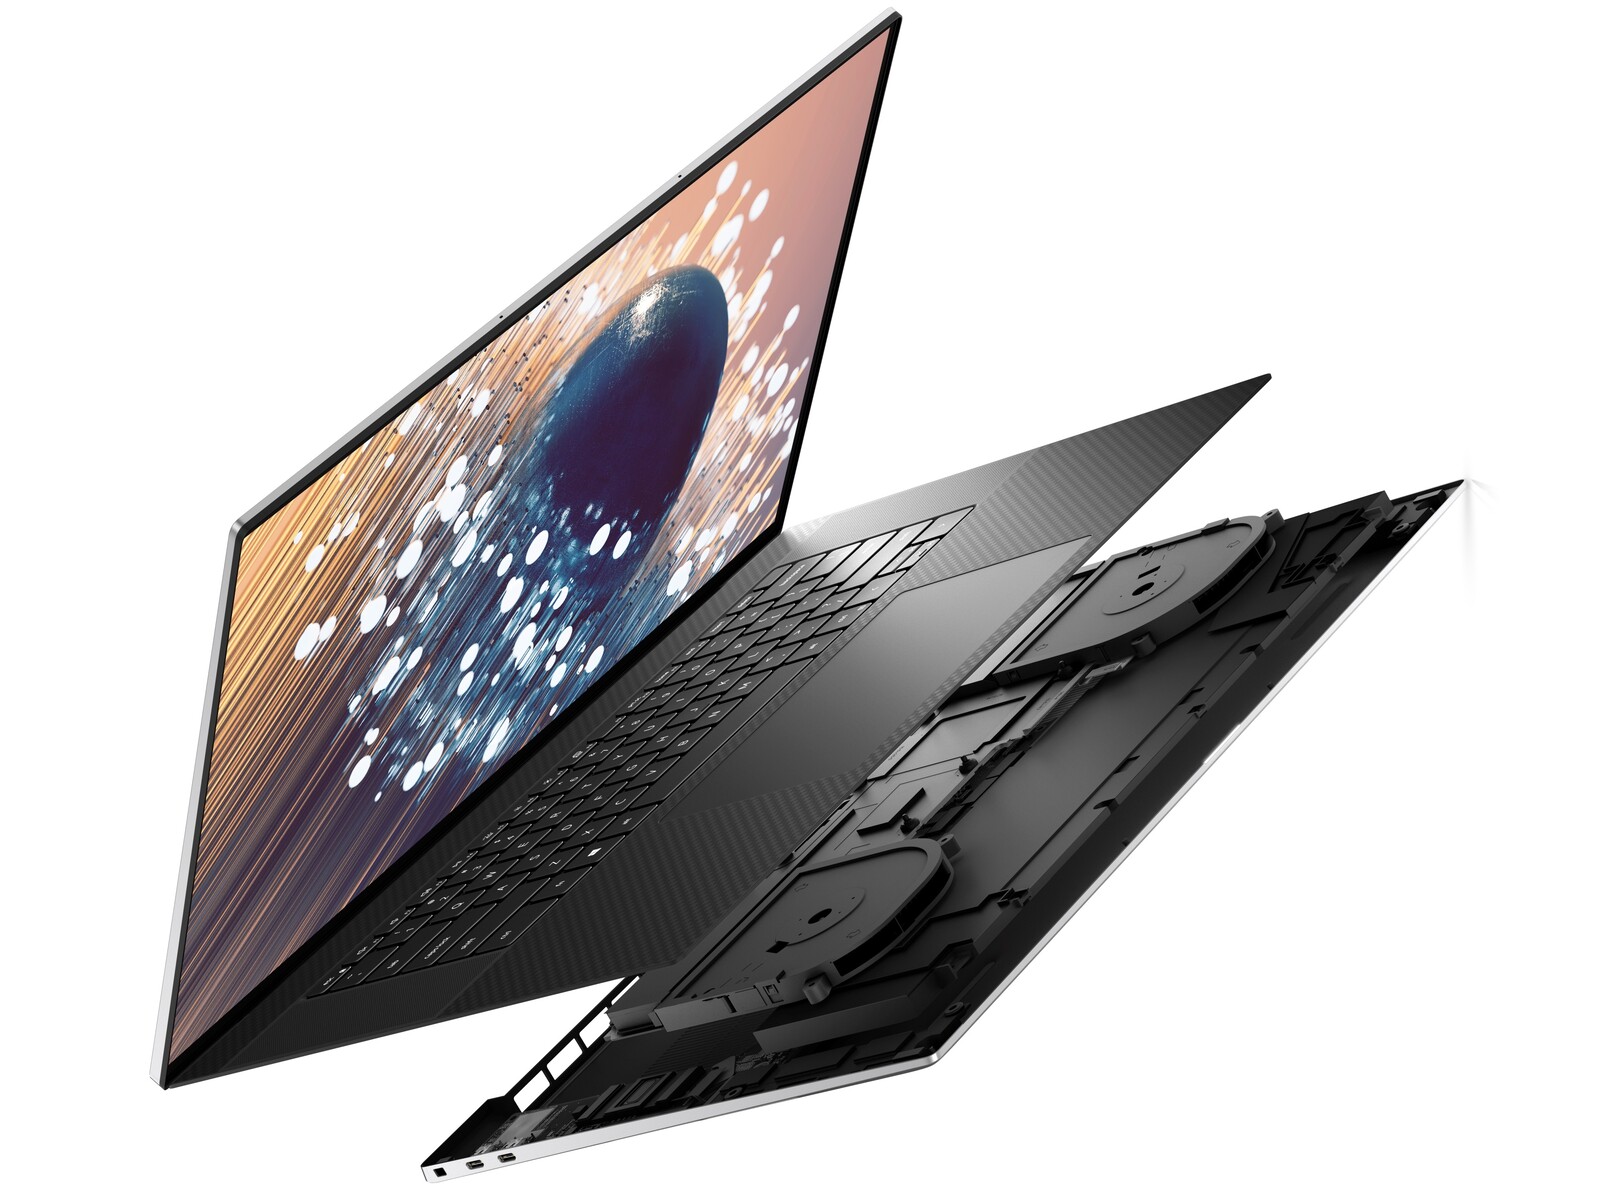
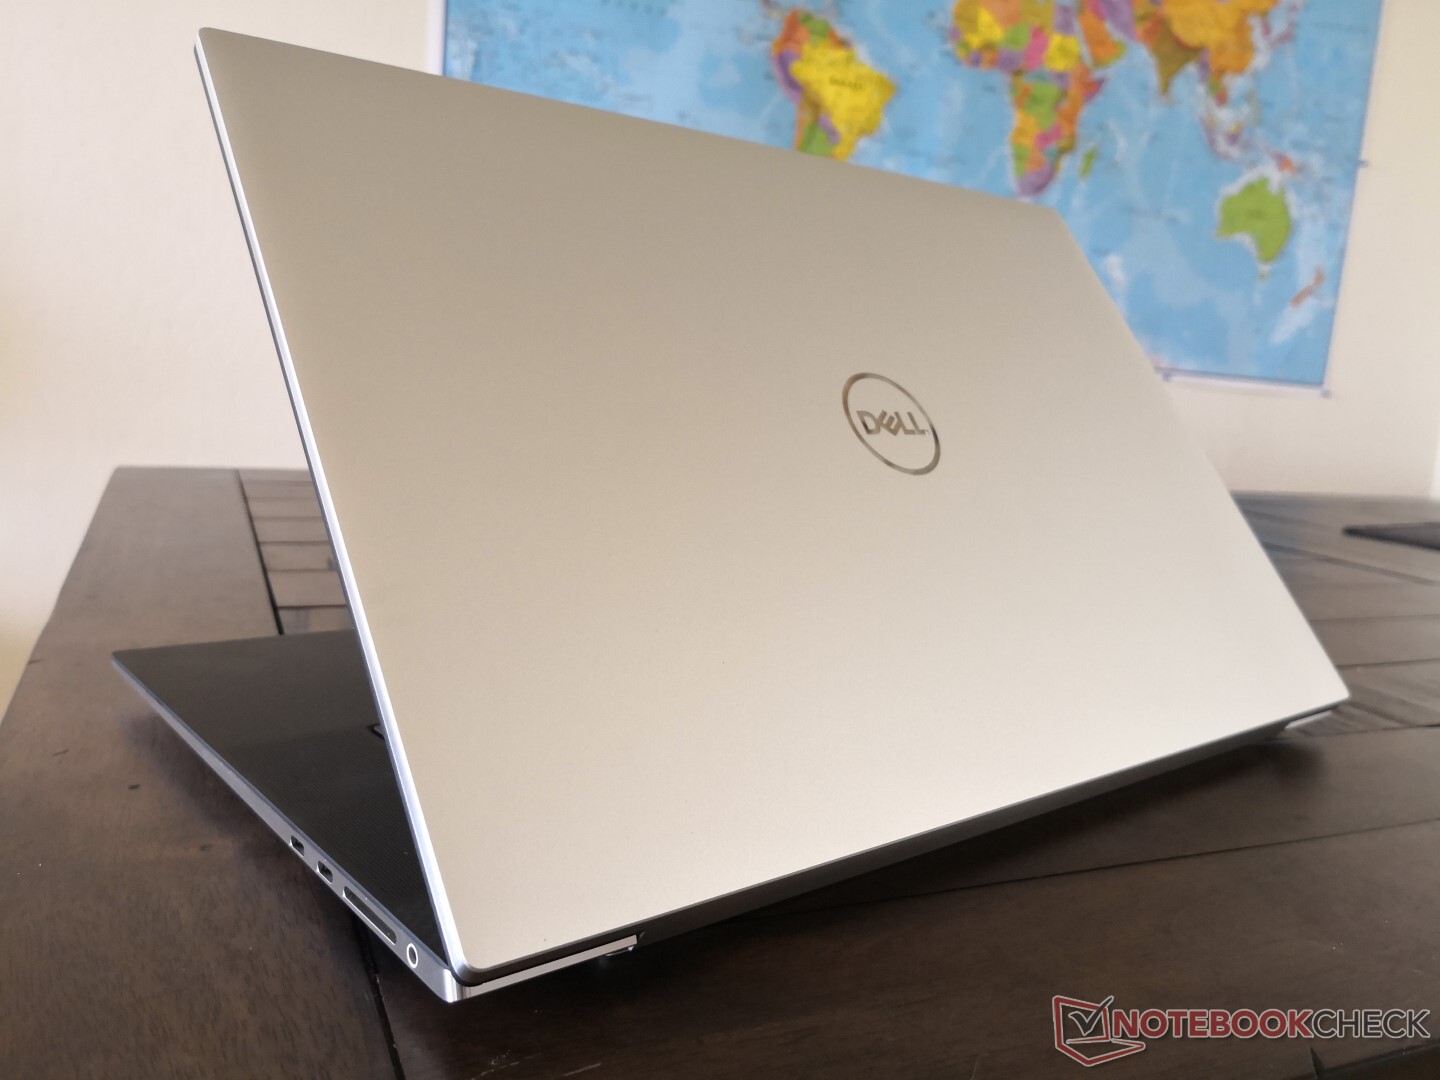
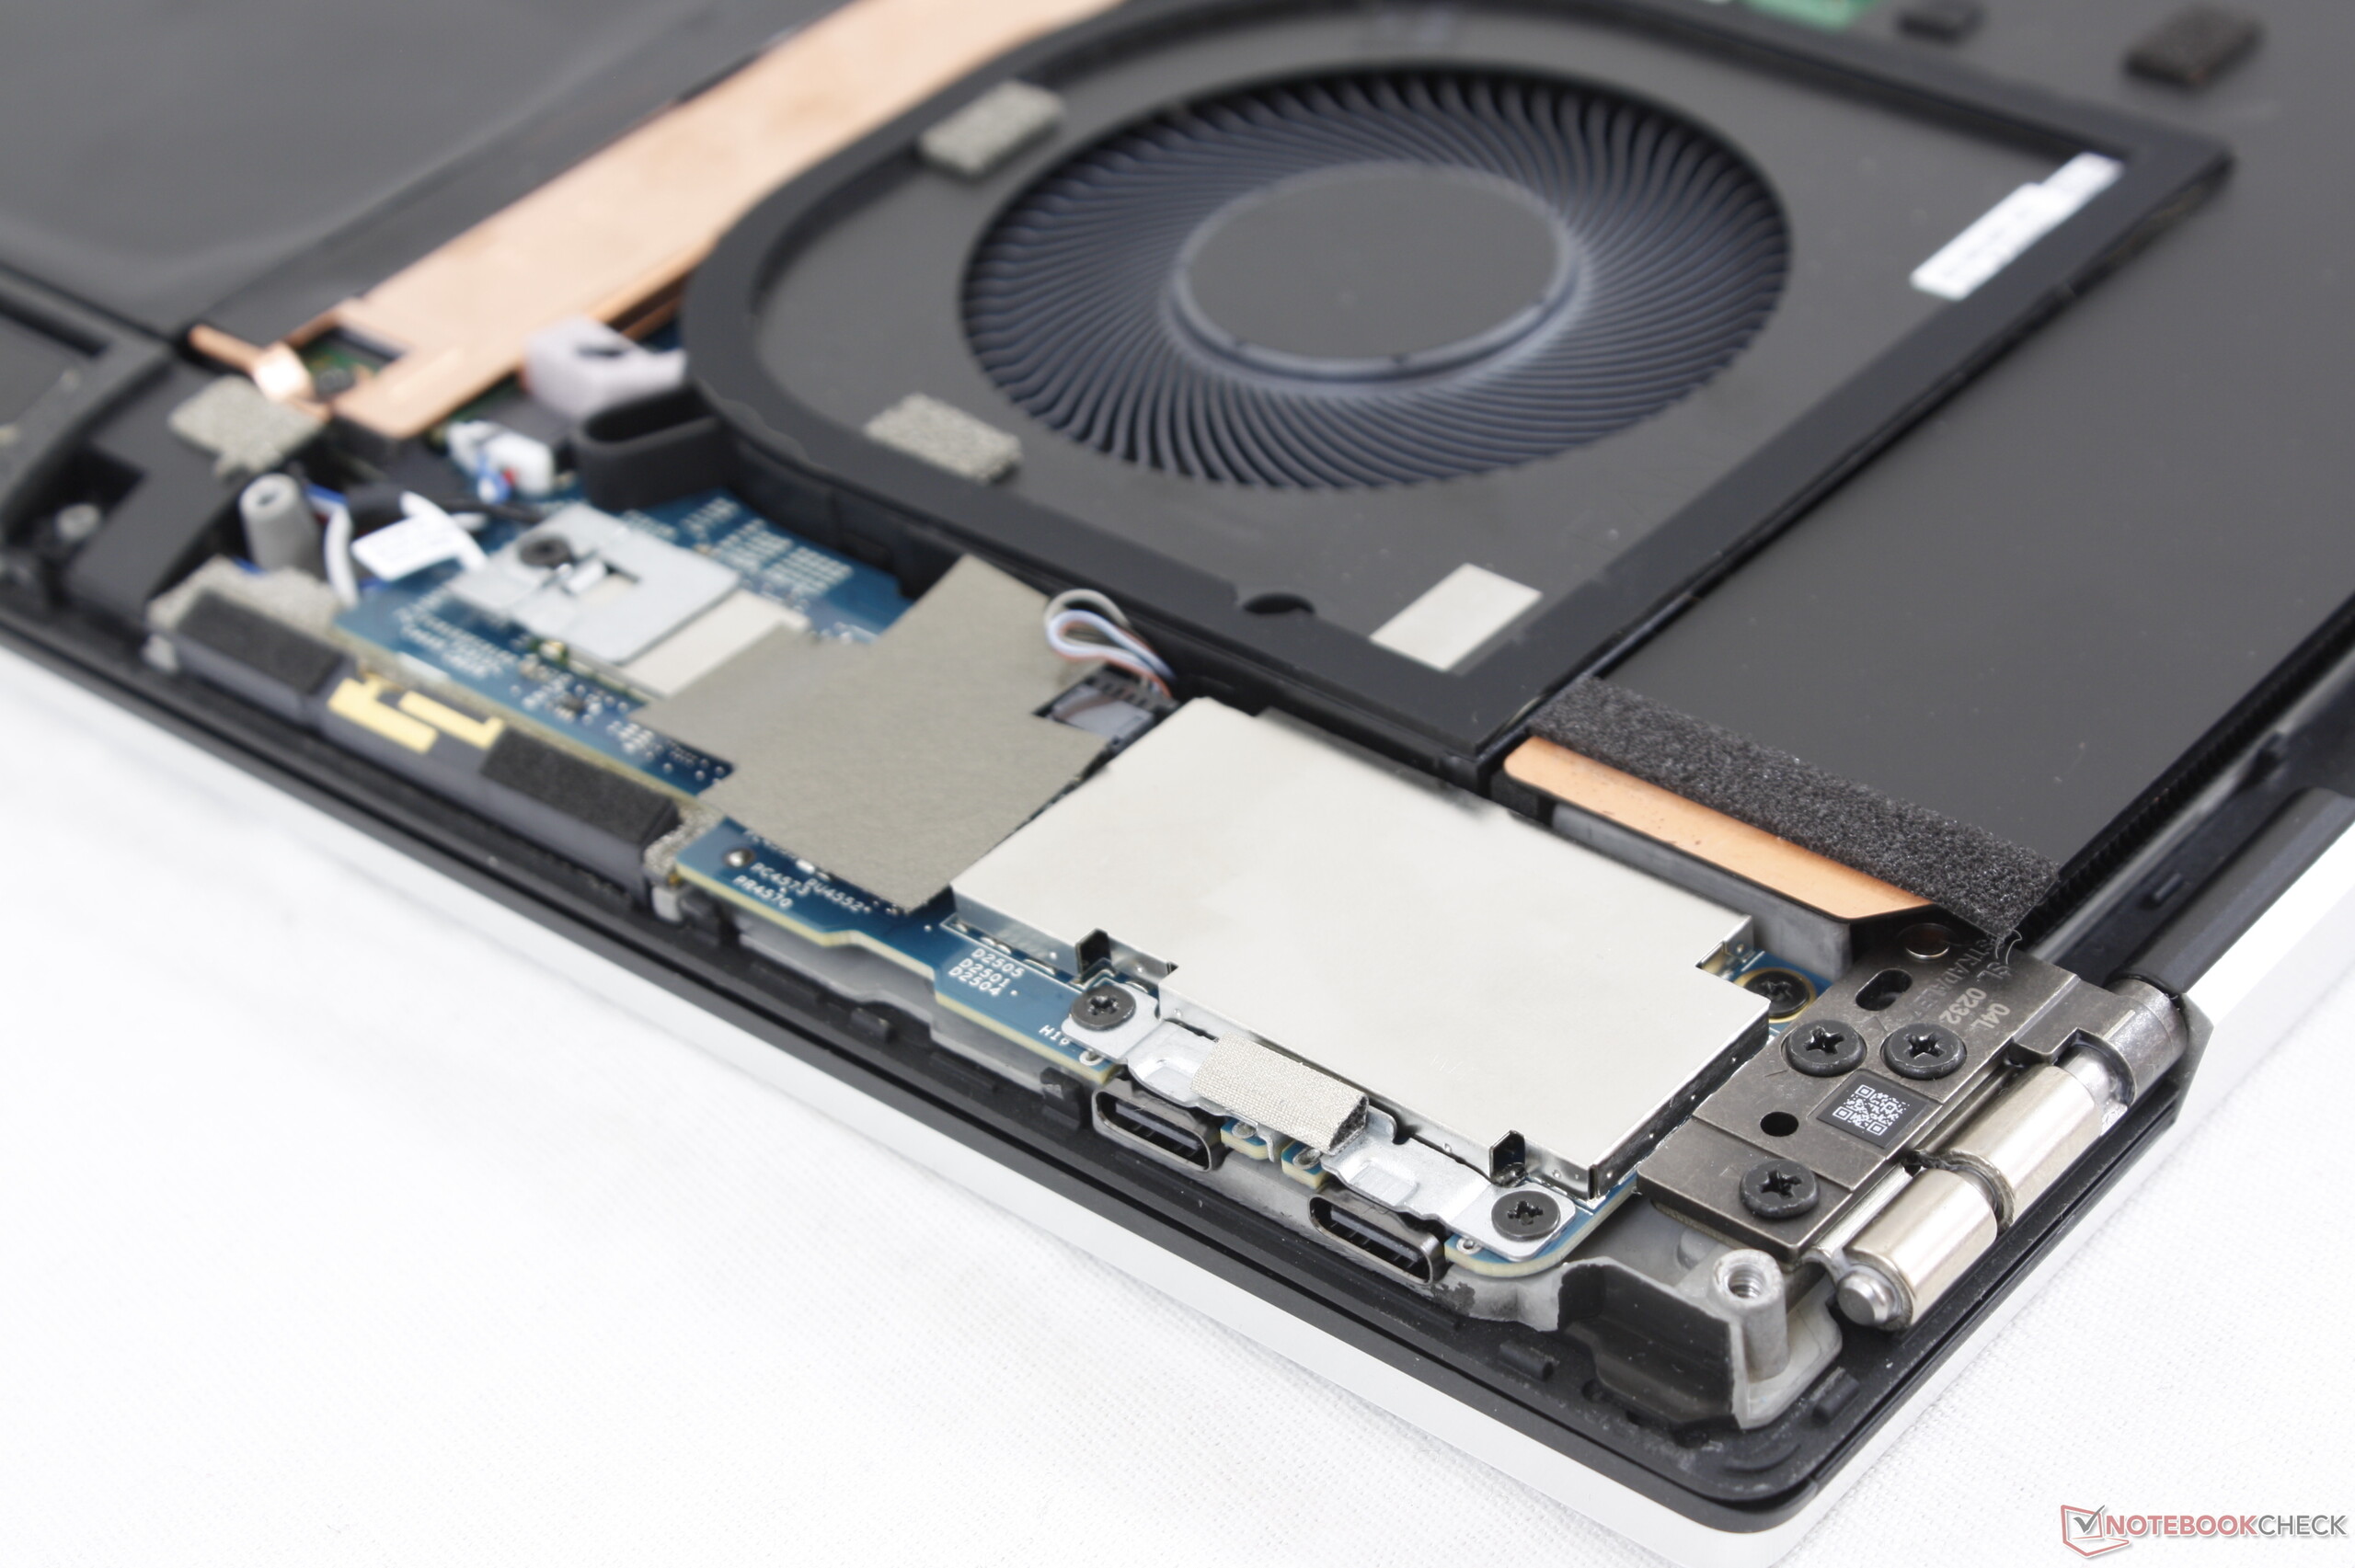
Az XPS 17 dicséretet érdemel, amiért tovább feszegette a határokat, mint a gyártók többsége. Senki más nem rendelkezik egy ultravékony, 17 hüvelykes, 16:10-es laptoppal, amely nyolcmagos Core i7 CPU-val (nemsokára Core i9 lesz) van felszerelve, 99 C-on üzemel teljes terhelés alatt egy GeForce RTX 2060 Max-Q GPU-val, és mindezt egy USB-C adapter hajtja. Még egy gőzkamrás hűtőt is sikerül integrálnia - ez a funkció többnyire csak bizonyos gamer notebookokban található meg. A kockázatok és az adott hadver egészen elképesztőek az alternatívákhoz képest, amelyek általában ennyire nem kockáztatnak.
A rendszerrel töltött időnk után úgy gondoljuk, hogy jó lenne, ha tenne egy lépést hátra, és újra néhány alapra fókuszálna. Megerősíteni a zsanérokat, keményebbé tenni az érintőpad gombjait, integrálni egy webkamera takarót és javítani a töltési rátán - mindezt már elérte sok olyan laptop, amely fele annyiba kerül.
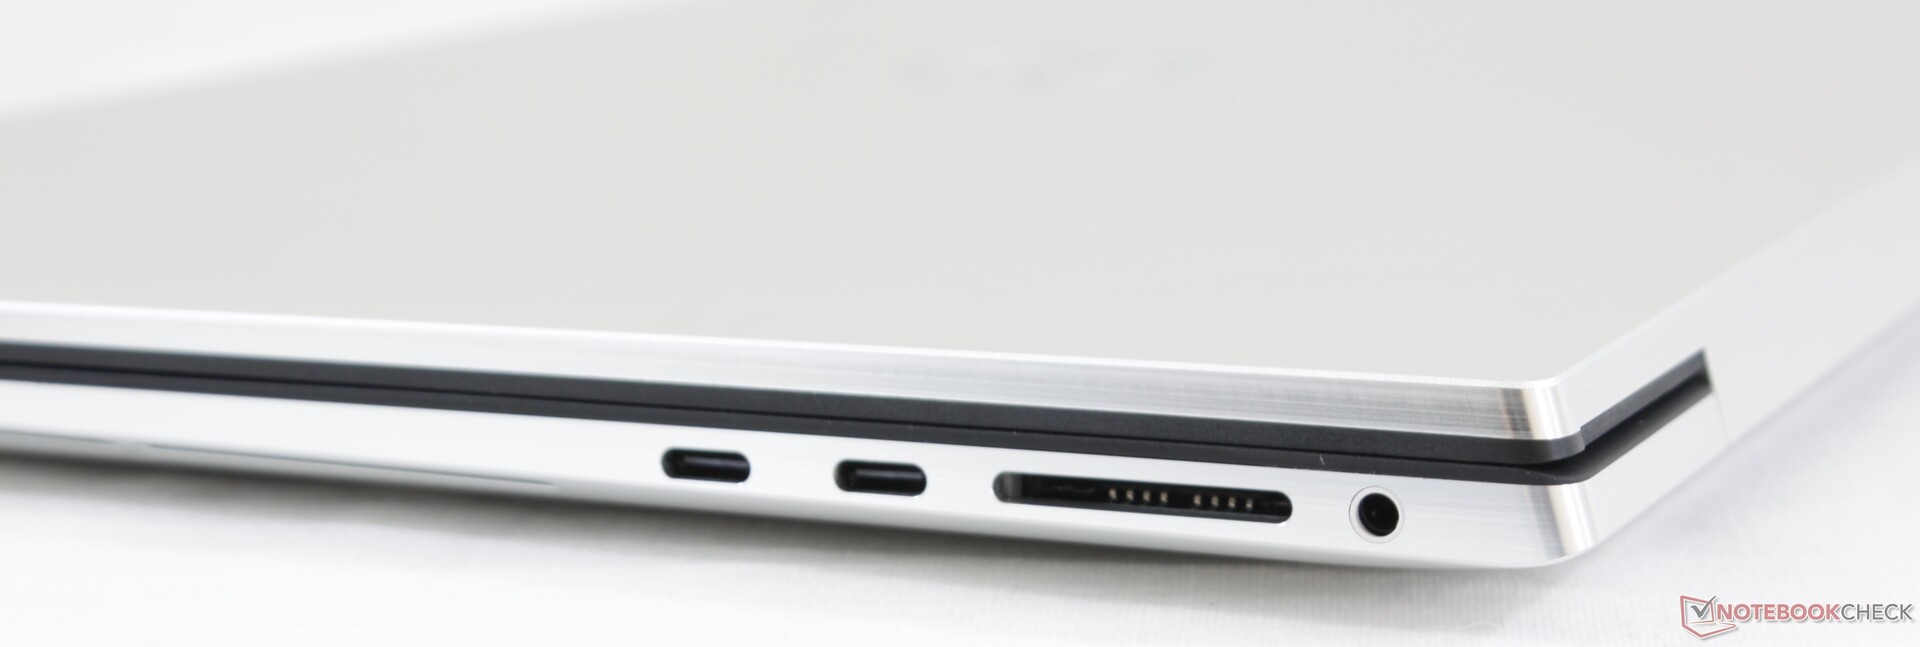
Azok a felhasználók, akik az XPS 17-et hosszabb ideig tartó, nagy terhelésnek szándékoznak kitenni, jobb, ha tudnak néhány hátrányról. Először is az akkumulátor nem biztos, hogy újratölt, mivel az USB-C adapter 130 wattra van korlátozva. Megvan az oka, hogy a GeForce RTX által hajtott laptopok többsége nem USB-C adaptereken fut, és ez azért van, mert a szabadalmaztatott, henger csatlakozós töltők több energiát képesek a nagy igényű rendszerbe nyomni. Másodsorban a fenntartott játékteljesítmény stabilitása nem garantált, mivel visszatérő képkockasebesség-csökkenéseket regisztráltunk. Amikor feltűnő ghostinggal párosul, a felhasználó ne úgy tekintsen rá, mint egy gamer notebookra, a Killer wireless és a GeForce RTX grafika ellenére.
Az XPS 17 a legjobb formáját a „kirobbanó” műveletekben hozza, mint a böngészés vagy videó szerkesztés, ahol a rendszer nincs erősen terhelve órákon keresztül. A kijelző, a dizájn és a teljesítmény/térfogat az, ami a rendszert vonzóbbá teszi, mint a legtöbb más 15.6 hüvelykes és 17.3 hüvelykes megoldás.
Egy egyedülálló 17 hüvelykes erőgép laptop közvetlen versenytárs nélkül. A lenyűgöző hardver és a megnyerő külső vonzani fogja a szemeket, de néhány alapvető aspektus több figyelmet érdemel.
Dell XPS 17 9700 Core i7 RTX 2060 Max-Q
- 07/15/2020 v7 (old)
Allen Ngo
Price comparison

