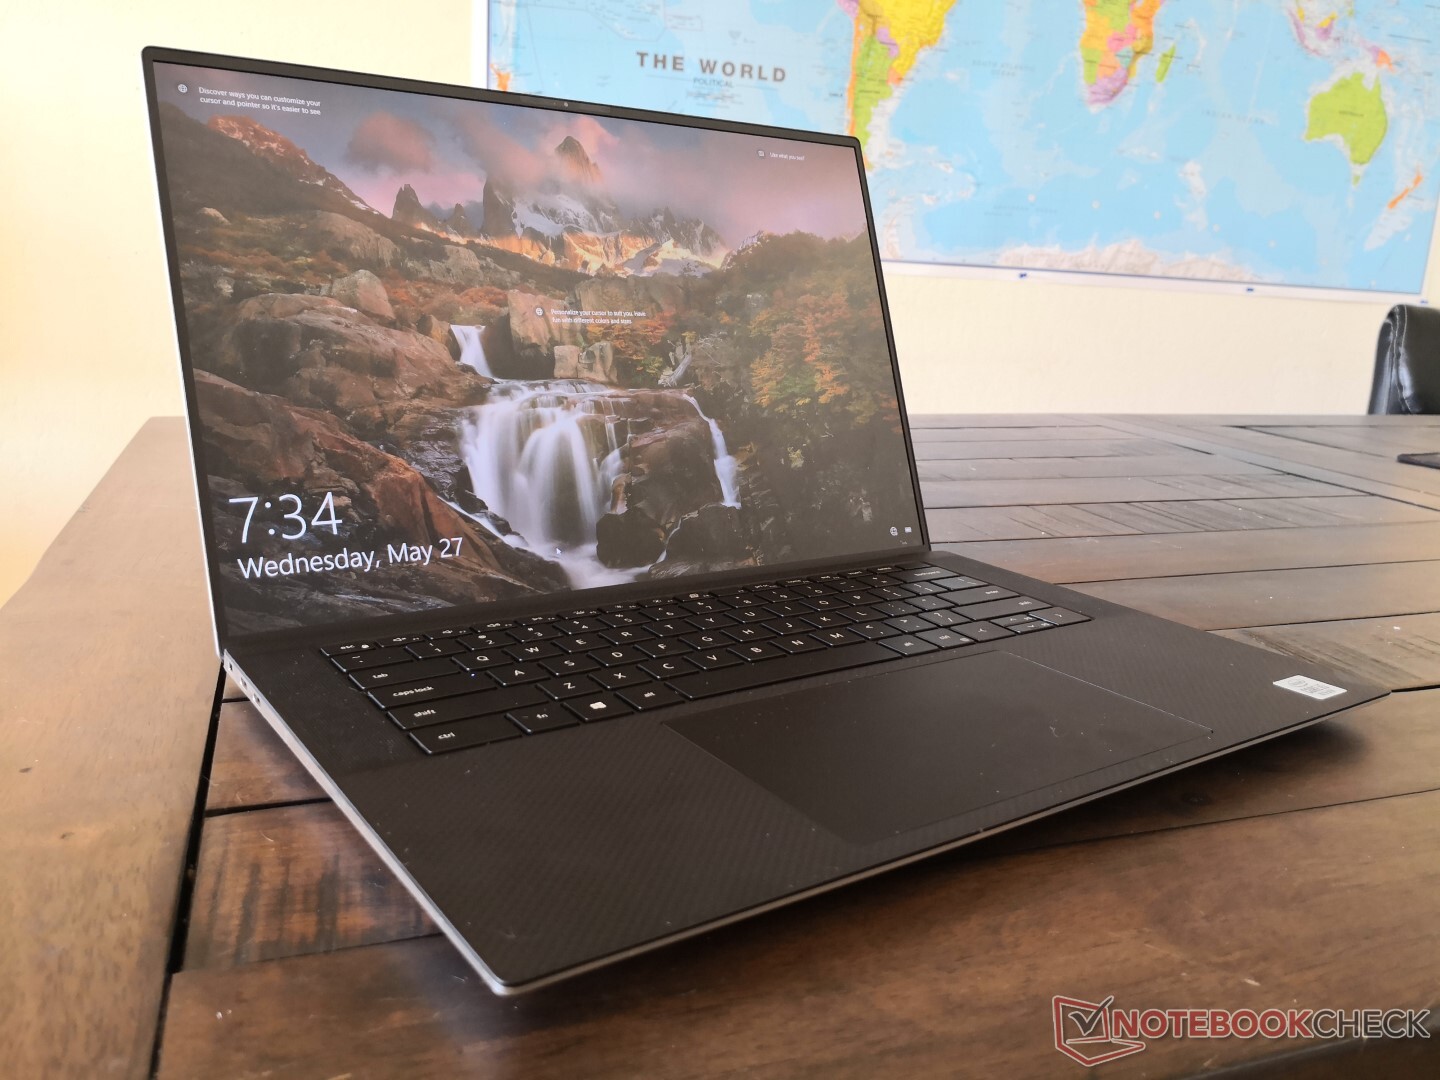
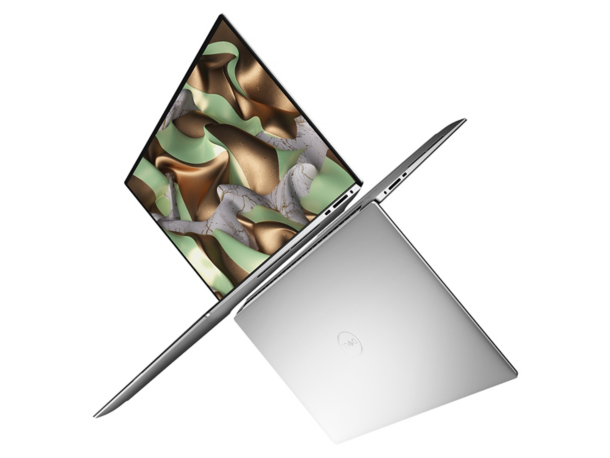
Dell XPS 15 9500 Core i5 rövid értékelés: Most Még Inkább Olyan, Mint a MacBook Pro
Értékelés | Dátum | Modell | Súly | Magasság | Méret | Felbontás | Legjobb ár |
|---|---|---|---|---|---|---|---|
| 86.8 % v7 (old) | 07/2020 | Dell XPS 15 9500 Core i5 i5-10300H, UHD Graphics 630 | 1.8 kg | 18 mm | 15.60" | 1920x1200 | |
| 85.2 % v7 (old) | 06/2020 | Asus ZenBook 15 UX534FTC-A8190T i7-10510U, GeForce GTX 1650 Max-Q | 1.6 kg | 18.9 mm | 15.60" | 1920x1080 | |
| 86 % v7 (old) | 03/2020 | Lenovo Yoga C940-15IRH i7-9750H, GeForce GTX 1650 Max-Q | 2 kg | 19.7 mm | 15.60" | 1920x1080 | |
| 85 % v7 (old) | HP Spectre X360 15-5ZV31AV i7-10510U, GeForce MX250 | 2.1 kg | 19.3 mm | 15.60" | 3840x2160 | ||
| 89.7 % v7 (old) | 01/2020 | Apple MacBook Pro 16 2019 i9 5500M i9-9880H, Radeon Pro 5500M | 2 kg | 16.2 mm | 16.00" | 3072x1920 |
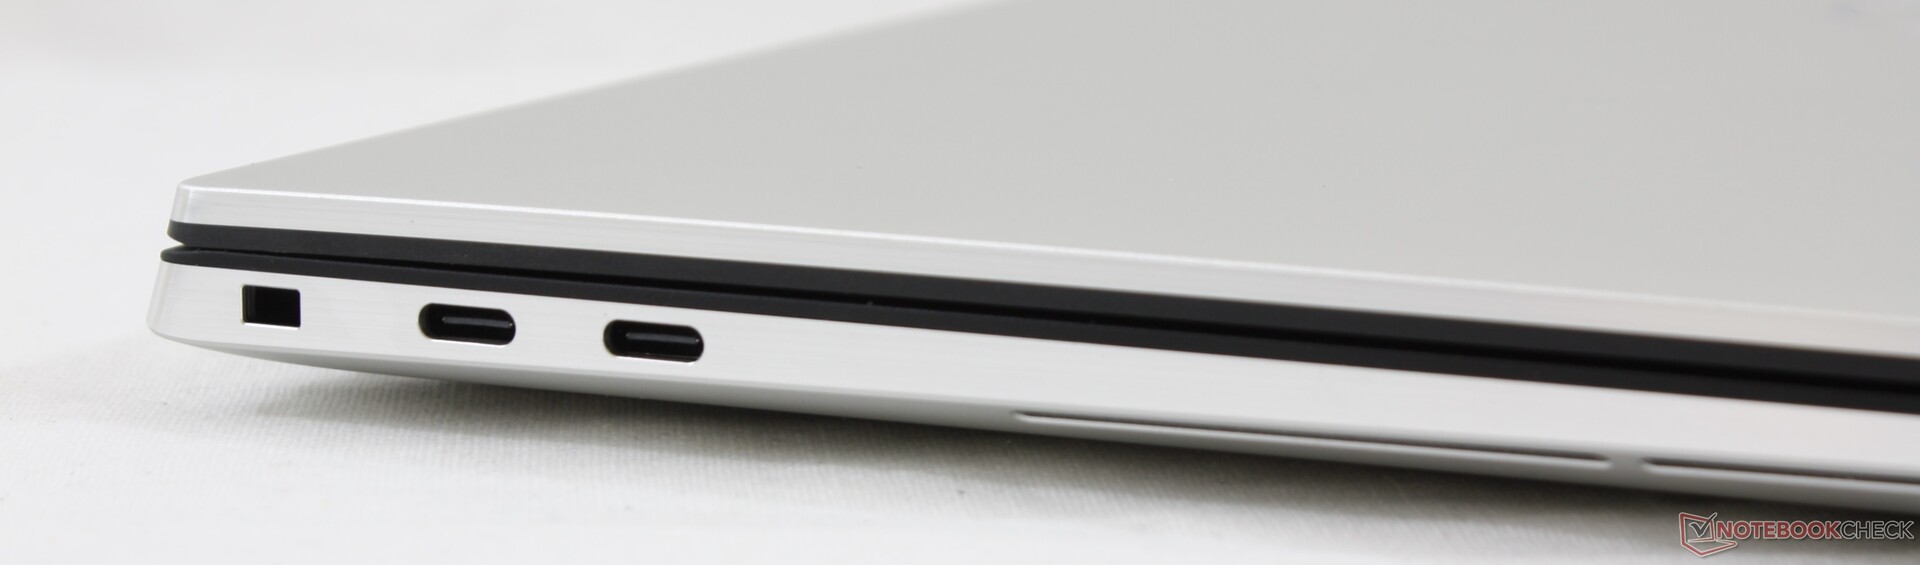
| SD Card Reader | |
| average JPG Copy Test (av. of 3 runs) | |
| Dell XPS 15 9500 Core i5 (Toshiba Exceria Pro SDXC 64 GB UHS-II) | |
| Razer Blade Pro 17 4K UHD 120 Hz (Toshiba Exceria Pro SDXC 64 GB UHS-II) | |
| Dell XPS 15 7590 i5 iGPU FHD (Toshiba Exceria Pro SDXC 64 GB UHS-II) | |
| HP Spectre X360 15-5ZV31AV (Toshiba Exceria Pro M501 UHS-II) | |
| maximum AS SSD Seq Read Test (1GB) | |
| Dell XPS 15 9500 Core i5 (Toshiba Exceria Pro SDXC 64 GB UHS-II) | |
| Razer Blade Pro 17 4K UHD 120 Hz (Toshiba Exceria Pro SDXC 64 GB UHS-II) | |
| Dell XPS 15 7590 i5 iGPU FHD (Toshiba Exceria Pro SDXC 64 GB UHS-II) | |
| HP Spectre X360 15-5ZV31AV (Toshiba Exceria Pro M501 UHS-II) | |
| Networking | |
| iperf3 transmit AX12 | |
| MSI GS66 10SGS | |
| Dell XPS 13 9300 4K UHD | |
| Dell XPS 15 9500 Core i5 | |
| Acer Aspire 5 A515-54G | |
| Asus TUF A17 FA706IU-AS76 | |
| iperf3 receive AX12 | |
| Dell XPS 13 9300 4K UHD | |
| MSI GS66 10SGS | |
| Dell XPS 15 9500 Core i5 | |
| Acer Aspire 5 A515-54G | |
| Asus TUF A17 FA706IU-AS76 | |


| |||||||||||||||||||||||||
Fényerő megoszlás: 85 %
Centrumban: 592 cd/m²
Kontraszt: 1287:1 (Fekete: 0.46 cd/m²)
ΔE ColorChecker Calman: 3.19 | ∀{0.5-29.43 Ø4.71}
calibrated: 2.03
ΔE Greyscale Calman: 3.9 | ∀{0.09-98 Ø4.96}
100% sRGB (Argyll 1.6.3 3D)
71.6% AdobeRGB 1998 (Argyll 1.6.3 3D)
79.6% AdobeRGB 1998 (Argyll 3D)
100% sRGB (Argyll 3D)
81.5% Display P3 (Argyll 3D)
Gamma: 2.25
CCT: 6522 K
| Dell XPS 15 9500 Core i5 Sharp LQ156N1, IPS, 15.6", 1920x1200 | Dell XPS 15 7590 i5 iGPU FHD LQ156M1, IPS, 15.6", 1920x1080 | Asus ZenBook 15 UX534FTC-A8190T BOE CQ NV156FHM-N63, IPS, 15.6", 1920x1080 | Lenovo Yoga C940-15IRH LG Philips LP156WFC-SPU1, IPS, 15.6", 1920x1080 | HP Spectre X360 15-5ZV31AV AU Optronics AUO30EB, IPS, 15.6", 3840x2160 | Apple MacBook Pro 16 2019 i9 5500M APPA044, IPS, 16", 3072x1920 | |
|---|---|---|---|---|---|---|
| Display | -11% | -18% | -17% | -12% | ||
| Display P3 Coverage (%) | 81.5 | 66.5 -18% | 65 -20% | 61.5 -25% | 68.3 -16% | |
| sRGB Coverage (%) | 100 | 98 -2% | 86.2 -14% | 92.7 -7% | 94.3 -6% | |
| AdobeRGB 1998 Coverage (%) | 79.6 | 68.4 -14% | 62.9 -21% | 63.6 -20% | 68.4 -14% | |
| Response Times | -19% | -9% | -21% | -39% | -23% | |
| Response Time Grey 50% / Grey 80% * (ms) | 42 ? | 52.8 ? -26% | 45 ? -7% | 48.4 ? -15% | 56.8 ? -35% | 52.4 ? -25% |
| Response Time Black / White * (ms) | 28.8 ? | 32 ? -11% | 32 ? -11% | 36.4 ? -26% | 40.8 ? -42% | 34.9 ? -21% |
| PWM Frequency (Hz) | 1020 ? | 131700 | ||||
| Screen | 7% | -17% | -6% | -12% | 14% | |
| Brightness middle (cd/m²) | 592 | 588 -1% | 299 -49% | 484.8 -18% | 284.6 -52% | 519 -12% |
| Brightness (cd/m²) | 565 | 555 -2% | 280 -50% | 463 -18% | 285 -50% | 477 -16% |
| Brightness Distribution (%) | 85 | 89 5% | 89 5% | 82 -4% | 85 0% | 86 1% |
| Black Level * (cd/m²) | 0.46 | 0.4 13% | 0.21 54% | 0.26 43% | 0.25 46% | 0.39 15% |
| Contrast (:1) | 1287 | 1470 14% | 1424 11% | 1865 45% | 1138 -12% | 1331 3% |
| Colorchecker dE 2000 * | 3.19 | 2.5 22% | 4.76 -49% | 4.5 -41% | 3.52 -10% | 2.28 29% |
| Colorchecker dE 2000 max. * | 5.45 | 6.3 -16% | 9 -65% | 7.55 -39% | 5.56 -2% | 6.54 -20% |
| Colorchecker dE 2000 calibrated * | 2.03 | 0.6 70% | 1.19 41% | 3 -48% | 0.86 58% | |
| Greyscale dE 2000 * | 3.9 | 4.5 -15% | 3.53 9% | 5.7 -46% | 3.2 18% | 0.9 77% |
| Gamma | 2.25 98% | 2.2 100% | 2.3 96% | 2.45 90% | 2.28 96% | 2145 0% |
| CCT | 6522 100% | 6836 95% | 7228 90% | 6101 107% | 7070 92% | 6572 99% |
| Color Space (Percent of AdobeRGB 1998) (%) | 71.6 | 63.2 -12% | 56 -22% | 58.7 -18% | 61.1 -15% | 78 9% |
| Color Space (Percent of sRGB) (%) | 100 | 98 -2% | 86 -14% | 92.8 -7% | 93.8 -6% | |
| Teljes átlag (program / beállítások) | -8% /
0% | -15% /
-16% | -15% /
-10% | -21% /
-15% | -5% /
8% |
* ... a kisebb jobb
Megjelenítési válaszidők
| ↔ Válaszidő Fekete-fehér | ||
|---|---|---|
| 28.8 ms ... emelkedés és süllyedés ↘ kombinálva | ↗ 15.2 ms emelkedés | 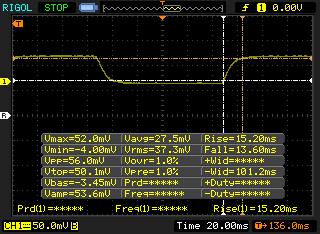 |
| ↘ 13.6 ms ősz | ||
| A képernyő viszonylag lassú reakciósebességet mutat tesztjeinkben, és túl lassú lehet a játékosok számára. Összehasonlításképpen, az összes tesztelt eszköz 0.1 (minimum) és 240 (maximum) ms között mozog. » 76 % of all devices are better. Ez azt jelenti, hogy a mért válaszidő rosszabb, mint az összes vizsgált eszköz átlaga (19.8 ms). | ||
| ↔ Válaszidő 50% szürke és 80% szürke között | ||
| 42 ms ... emelkedés és süllyedés ↘ kombinálva | ↗ 20 ms emelkedés | 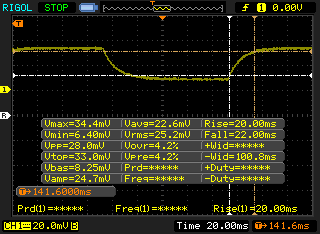 |
| ↘ 22 ms ősz | ||
| A képernyő lassú reakciósebességet mutat tesztjeinkben, és nem lesz kielégítő a játékosok számára. Összehasonlításképpen, az összes tesztelt eszköz 0.165 (minimum) és 636 (maximum) ms között mozog. » 67 % of all devices are better. Ez azt jelenti, hogy a mért válaszidő rosszabb, mint az összes vizsgált eszköz átlaga (31 ms). | ||
Képernyő villogása / PWM (impulzusszélesség-moduláció)
| Képernyő villogása / PWM nem érzékelhető | 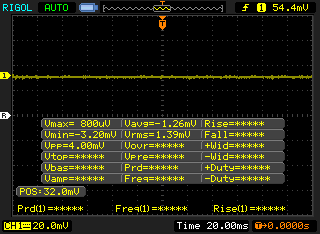 | ||
Összehasonlításképpen: az összes tesztelt eszköz 52 %-a nem használja a PWM-et a kijelző elsötétítésére. Ha PWM-et észleltek, akkor átlagosan 7754 (minimum: 5 - maximum: 343500) Hz-t mértek. | |||
Cinebench R15: CPU Multi 64Bit | CPU Single 64Bit
Blender: v2.79 BMW27 CPU
7-Zip 18.03: 7z b 4 -mmt1 | 7z b 4
Geekbench 5.5: Single-Core | Multi-Core
HWBOT x265 Benchmark v2.2: 4k Preset
LibreOffice : 20 Documents To PDF
R Benchmark 2.5: Overall mean
| Cinebench R20 / CPU (Multi Core) | |
| Eluktronics RP-15 | |
| Gigabyte Aero 15 OLED XB-8DE51B0SP | |
| Dell XPS 15 7590 9980HK GTX 1650 | |
| Acer Predator Triton 500 PT515-52-70N3 | |
| Dell G5 15 5590 | |
| Lenovo IdeaPad S740-15IRH | |
| Gigabyte Aero 15-Y9 | |
| Dell XPS 15 9500 Core i5 | |
| Átlagos Intel Core i5-10300H (1397 - 2240, n=15) | |
| Dell G5 15 5590-PCNJJ | |
| Asus TUF FX505DT-EB73 | |
| HP Pavilion Gaming 15-ec0002ng | |
| Cinebench R20 / CPU (Single Core) | |
| Gigabyte Aero 15 OLED XB-8DE51B0SP | |
| Eluktronics RP-15 | |
| Acer Predator Triton 500 PT515-52-70N3 | |
| Lenovo IdeaPad S740-15IRH | |
| Dell XPS 15 7590 9980HK GTX 1650 | |
| Dell XPS 15 9500 Core i5 | |
| Átlagos Intel Core i5-10300H (312 - 470, n=15) | |
| Dell G5 15 5590-PCNJJ | |
| Dell G5 15 5590 | |
| Gigabyte Aero 15-Y9 | |
| Asus TUF FX505DT-EB73 | |
| HP Pavilion Gaming 15-ec0002ng | |
| Cinebench R15 / CPU Multi 64Bit | |
| Eluktronics RP-15 | |
| Gigabyte Aero 15 OLED XB-8DE51B0SP | |
| Dell XPS 15 7590 9980HK GTX 1650 | |
| Acer Predator Triton 500 PT515-52-70N3 | |
| Gigabyte Aero 15-Y9 | |
| Dell G5 15 5590 | |
| Lenovo IdeaPad S740-15IRH | |
| Dell XPS 15 9500 Core i5 | |
| Átlagos Intel Core i5-10300H (536 - 921, n=17) | |
| Dell G5 15 5590-PCNJJ | |
| Asus TUF FX505DT-EB73 | |
| HP Pavilion Gaming 15-ec0002ng | |
| Lenovo IdeaPad 330-15ICH | |
| Cinebench R15 / CPU Single 64Bit | |
| Gigabyte Aero 15 OLED XB-8DE51B0SP | |
| Dell XPS 15 7590 9980HK GTX 1650 | |
| Gigabyte Aero 15-Y9 | |
| Acer Predator Triton 500 PT515-52-70N3 | |
| Lenovo IdeaPad S740-15IRH | |
| Eluktronics RP-15 | |
| Dell XPS 15 9500 Core i5 | |
| Átlagos Intel Core i5-10300H (108 - 194, n=17) | |
| Lenovo IdeaPad 330-15ICH | |
| Dell G5 15 5590-PCNJJ | |
| Dell G5 15 5590 | |
| Asus TUF FX505DT-EB73 | |
| HP Pavilion Gaming 15-ec0002ng | |
| Blender / v2.79 BMW27 CPU | |
| Átlagos Intel Core i5-10300H (479 - 555, n=14) | |
| Dell XPS 15 9500 Core i5 | |
| Acer Predator Triton 500 PT515-52-70N3 | |
| Gigabyte Aero 15 OLED XB-8DE51B0SP | |
| Eluktronics RP-15 | |
| 7-Zip 18.03 / 7z b 4 -mmt1 | |
| Gigabyte Aero 15 OLED XB-8DE51B0SP | |
| Acer Predator Triton 500 PT515-52-70N3 | |
| Dell XPS 15 9500 Core i5 | |
| Eluktronics RP-15 | |
| Átlagos Intel Core i5-10300H (2945 - 4956, n=14) | |
| 7-Zip 18.03 / 7z b 4 | |
| Eluktronics RP-15 | |
| Gigabyte Aero 15 OLED XB-8DE51B0SP | |
| Acer Predator Triton 500 PT515-52-70N3 | |
| Dell XPS 15 9500 Core i5 | |
| Átlagos Intel Core i5-10300H (15146 - 24841, n=14) | |
| Geekbench 5.5 / Single-Core | |
| Gigabyte Aero 15 OLED XB-8DE51B0SP | |
| Acer Predator Triton 500 PT515-52-70N3 | |
| Eluktronics RP-15 | |
| Dell XPS 15 9500 Core i5 | |
| Átlagos Intel Core i5-10300H (703 - 1241, n=16) | |
| HP Pavilion Gaming 15-ec0002ng | |
| Geekbench 5.5 / Multi-Core | |
| Eluktronics RP-15 | |
| Gigabyte Aero 15 OLED XB-8DE51B0SP | |
| Acer Predator Triton 500 PT515-52-70N3 | |
| Dell XPS 15 9500 Core i5 | |
| Átlagos Intel Core i5-10300H (2783 - 4728, n=16) | |
| HP Pavilion Gaming 15-ec0002ng | |
| HWBOT x265 Benchmark v2.2 / 4k Preset | |
| Eluktronics RP-15 | |
| Gigabyte Aero 15 OLED XB-8DE51B0SP | |
| Acer Predator Triton 500 PT515-52-70N3 | |
| Dell XPS 15 9500 Core i5 | |
| Átlagos Intel Core i5-10300H (6.13 - 7.78, n=14) | |
| LibreOffice / 20 Documents To PDF | |
| Dell XPS 15 9500 Core i5 | |
| Eluktronics RP-15 | |
| Átlagos Intel Core i5-10300H (23.9 - 94, n=14) | |
| Gigabyte Aero 15 OLED XB-8DE51B0SP | |
| Acer Predator Triton 500 PT515-52-70N3 | |
| R Benchmark 2.5 / Overall mean | |
| Átlagos Intel Core i5-10300H (0.625 - 1.088, n=14) | |
| Dell XPS 15 9500 Core i5 | |
| Acer Predator Triton 500 PT515-52-70N3 | |
| Eluktronics RP-15 | |
| Gigabyte Aero 15 OLED XB-8DE51B0SP | |
Cinebench R15: CPU Multi 64Bit | CPU Single 64Bit
Blender: v2.79 BMW27 CPU
7-Zip 18.03: 7z b 4 -mmt1 | 7z b 4
Geekbench 5.5: Single-Core | Multi-Core
HWBOT x265 Benchmark v2.2: 4k Preset
LibreOffice : 20 Documents To PDF
R Benchmark 2.5: Overall mean
* ... a kisebb jobb
| PCMark 10 | |
| Score | |
| Apple MacBook Pro 16 2019 i9 5500M | |
| Lenovo Yoga C940-15IRH | |
| Asus ZenBook 15 UX534FTC-A8190T | |
| Dell XPS 15 9500 Core i5 | |
| Dell XPS 15 7590 i5 iGPU FHD | |
| HP Spectre X360 15-5ZV31AV | |
| Essentials | |
| Lenovo Yoga C940-15IRH | |
| Dell XPS 15 9500 Core i5 | |
| HP Spectre X360 15-5ZV31AV | |
| Dell XPS 15 7590 i5 iGPU FHD | |
| Asus ZenBook 15 UX534FTC-A8190T | |
| Productivity | |
| Asus ZenBook 15 UX534FTC-A8190T | |
| Lenovo Yoga C940-15IRH | |
| Dell XPS 15 9500 Core i5 | |
| Dell XPS 15 7590 i5 iGPU FHD | |
| HP Spectre X360 15-5ZV31AV | |
| Digital Content Creation | |
| Lenovo Yoga C940-15IRH | |
| Asus ZenBook 15 UX534FTC-A8190T | |
| Dell XPS 15 9500 Core i5 | |
| Dell XPS 15 7590 i5 iGPU FHD | |
| HP Spectre X360 15-5ZV31AV | |
| PCMark 8 | |
| Home Score Accelerated v2 | |
| Apple MacBook Pro 16 2019 i9 5500M | |
| Dell XPS 15 7590 i5 iGPU FHD | |
| Lenovo Yoga C940-15IRH | |
| Dell XPS 15 9500 Core i5 | |
| Asus ZenBook 15 UX534FTC-A8190T | |
| HP Spectre X360 15-5ZV31AV | |
| Work Score Accelerated v2 | |
| Lenovo Yoga C940-15IRH | |
| Dell XPS 15 9500 Core i5 | |
| Asus ZenBook 15 UX534FTC-A8190T | |
| Dell XPS 15 7590 i5 iGPU FHD | |
| Apple MacBook Pro 16 2019 i9 5500M | |
| HP Spectre X360 15-5ZV31AV | |
| PCMark 8 Home Score Accelerated v2 | 3842 pontok | |
| PCMark 8 Work Score Accelerated v2 | 5271 pontok | |
| PCMark 10 Score | 4329 pontok | |
Segítség | ||
| DPC Latencies / LatencyMon - interrupt to process latency (max), Web, Youtube, Prime95 | |
| HP ProBook 430 G7-8VU53EA | |
| Dell XPS 15 9500 Core i5 | |
| Razer Blade 15 RZ09-0328 | |
| Asus ZenBook Flip 14 UX463FA-AI039T | |
* ... a kisebb jobb
| Dell XPS 15 9500 Core i5 Toshiba KBG40ZNS256G NVMe | Dell XPS 15 7590 i5 iGPU FHD Toshiba XG6 KXG60ZNV512G | Asus ZenBook 15 UX534FTC-A8190T Samsung SSD PM981 MZVLB1T0HALR | Lenovo Yoga C940-15IRH Intel Optane Memory H10 with Solid State Storage 32GB + 512GB HBRPEKNX0202A(L/H) | HP Spectre X360 15-5ZV31AV Intel SSD 660p 2TB SSDPEKNW020T8 | Apple MacBook Pro 16 2019 i9 5500M Apple SSD AP1024 7171 | |
|---|---|---|---|---|---|---|
| AS SSD | 109% | 112% | 38% | 62% | 122% | |
| Seq Read (MB/s) | 1423 | 2357 66% | 2643 86% | 769 -46% | 1220 -14% | 2531 78% |
| Seq Write (MB/s) | 766 | 1235 61% | 1533 100% | 351.1 -54% | 1152 50% | 2289 199% |
| 4K Read (MB/s) | 42.21 | 43.29 3% | 49.12 16% | 69.1 64% | 52.3 24% | 15.85 -62% |
| 4K Write (MB/s) | 74.8 | 99.7 33% | 134.7 80% | 100.9 35% | 146.6 96% | 39.88 -47% |
| 4K-64 Read (MB/s) | 973 | 1020 5% | 1028 6% | 472 -51% | 652 -33% | 1267 30% |
| 4K-64 Write (MB/s) | 218.8 | 1502 586% | 1353 518% | 948 333% | 847 287% | 1749 699% |
| Access Time Read * (ms) | 0.125 | 0.07 44% | 0.033 74% | 0.071 43% | 0.077 38% | 0.122 2% |
| Access Time Write * (ms) | 0.552 | 0.039 93% | 0.028 95% | 0.137 75% | 0.106 81% | 0.095 83% |
| Score Read (Points) | 1157 | 1299 12% | 1342 16% | 618 -47% | 826 -29% | 1536 33% |
| Score Write (Points) | 370 | 1726 366% | 1641 344% | 1084 193% | 1109 200% | 2018 445% |
| Score Total (Points) | 2094 | 3640 74% | 3622 73% | 2024 -3% | 2371 13% | 4317 106% |
| Copy ISO MB/s (MB/s) | 1151 | 2145 86% | 2226 93% | 839 -27% | 2070 80% | 1995 73% |
| Copy Program MB/s (MB/s) | 499.4 | 565 13% | 506 1% | 455.8 -9% | 571 14% | 584 17% |
| Copy Game MB/s (MB/s) | 733 | 1320 80% | 1230 68% | 969 32% | 1219 66% | 1135 55% |
| CrystalDiskMark 5.2 / 6 | 32% | 48% | 25% | 25% | 33% | |
| Write 4K (MB/s) | 93.3 | 93.6 0% | 138.1 48% | 102.2 10% | 151.5 62% | 55.5 -41% |
| Read 4K (MB/s) | 45.9 | 41.87 -9% | 45.89 0% | 114.3 149% | 59.3 29% | 16.21 -65% |
| Write Seq (MB/s) | 1211 | 1698 40% | 2147 77% | 468.3 -61% | 1424 18% | 1959 62% |
| Read Seq (MB/s) | 1633 | 1978 21% | 2188 34% | 1236 -24% | 1609 -1% | 1763 8% |
| Write 4K Q32T1 (MB/s) | 273.1 | 383.1 40% | 427.8 57% | 556 104% | 393.6 44% | 398.5 46% |
| Read 4K Q32T1 (MB/s) | 356 | 326.9 -8% | 404 13% | 421.6 18% | 369.4 4% | 648 82% |
| Write Seq Q32T1 (MB/s) | 1198 | 2778 132% | 2396 100% | 1264 6% | 1946 62% | 2727 128% |
| Read Seq Q32T1 (MB/s) | 2269 | 3119 37% | 3454 52% | 2239 -1% | 1934 -15% | 3242 43% |
| Teljes átlag (program / beállítások) | 71% /
81% | 80% /
89% | 32% /
34% | 44% /
49% | 78% /
90% |
* ... a kisebb jobb

Disk Throttling: DiskSpd Read Loop, Queue Depth 8
| 3DMark 11 | |
| 1280x720 Performance GPU | |
| Dell XPS 15 7590 9980HK GTX 1650 | |
| Dell XPS 15 9575 FY00N | |
| MSI Modern 15 A10RB | |
| Dell XPS 13 9300 Core i7-1065G7 | |
| Asus VivoBook S15 S530UN-BQ097T | |
| Microsoft Surface Laptop 3 13 Core i5-1035G7 | |
| Chuwi AeroBook Plus | |
| Dell XPS 15 9500 Core i5 | |
| Átlagos Intel UHD Graphics 630 (642 - 2025, n=12) | |
| Asus Vivobook 15 F512DA-SH31 | |
| Acer Extensa 15 EX215-51-56UX | |
| 1280x720 Performance Combined | |
| Dell XPS 15 7590 9980HK GTX 1650 | |
| Dell XPS 15 9575 FY00N | |
| MSI Modern 15 A10RB | |
| Asus VivoBook S15 S530UN-BQ097T | |
| Dell XPS 13 9300 Core i7-1065G7 | |
| Microsoft Surface Laptop 3 13 Core i5-1035G7 | |
| Chuwi AeroBook Plus | |
| Átlagos Intel UHD Graphics 630 (1647 - 2181, n=12) | |
| Dell XPS 15 9500 Core i5 | |
| Asus Vivobook 15 F512DA-SH31 | |
| Acer Extensa 15 EX215-51-56UX | |
| 3DMark 11 Performance | 1985 pontok | |
| 3DMark Cloud Gate Standard Score | 9619 pontok | |
| 3DMark Fire Strike Score | 1095 pontok | |
| 3DMark Time Spy Score | 441 pontok | |
Segítség | ||
| alacsony | közepes | magas | ultra | |
|---|---|---|---|---|
| The Witcher 3 (2015) | 17.3 | 10.8 | ||
| Dota 2 Reborn (2015) | 79 | 50 | 19.7 | 17.4 |
| X-Plane 11.11 (2018) | 22.4 | 14.3 | 12.8 |
| Dell XPS 15 9500 Core i5 UHD Graphics 630, i5-10300H, Toshiba KBG40ZNS256G NVMe | Dell XPS 15 7590 i5 iGPU FHD UHD Graphics 630, i5-9300H, Toshiba XG6 KXG60ZNV512G | Asus ZenBook 15 UX534FTC-A8190T GeForce GTX 1650 Max-Q, i7-10510U, Samsung SSD PM981 MZVLB1T0HALR | Lenovo Yoga C940-15IRH GeForce GTX 1650 Max-Q, i7-9750H, Intel Optane Memory H10 with Solid State Storage 32GB + 512GB HBRPEKNX0202A(L/H) | HP Spectre X360 15-5ZV31AV GeForce MX250, i7-10510U, Intel SSD 660p 2TB SSDPEKNW020T8 | Apple MacBook Pro 16 2019 i9 5500M Radeon Pro 5500M, i9-9880H, Apple SSD AP1024 7171 | |
|---|---|---|---|---|---|---|
| Noise | -4% | -6% | -13% | -7% | -15% | |
| off / környezet * (dB) | 28 | 29.3 -5% | 30.3 -8% | 28.7 -2% | 30.1 -8% | 29.8 -6% |
| Idle Minimum * (dB) | 28 | 29.3 -5% | 30.3 -8% | 28.7 -2% | 30.1 -8% | 29.9 -7% |
| Idle Average * (dB) | 28 | 29.3 -5% | 30.3 -8% | 28.8 -3% | 30.1 -8% | 29.9 -7% |
| Idle Maximum * (dB) | 28 | 29.8 -6% | 30.9 -10% | 28.8 -3% | 30.1 -8% | 29.9 -7% |
| Load Average * (dB) | 28 | 32.4 -16% | 31.3 -12% | 45 -61% | 30.1 -8% | 43 -54% |
| Load Maximum * (dB) | 41.9 | 37.2 11% | 38.2 9% | 44.7 -7% | 42 -0% | 46.1 -10% |
| Witcher 3 ultra * (dB) | 38.1 | 44.7 | 39.7 | 45.4 |
* ... a kisebb jobb
Zajszint
| Üresjárat |
| 28 / 28 / 28 dB(A) |
| Terhelés |
| 28 / 41.9 dB(A) |
 | ||
30 dB csendes 40 dB(A) hallható 50 dB(A) hangos |
||
min: | ||
(±) A felső oldalon a maximális hőmérséklet 42.4 °C / 108 F, összehasonlítva a 36.8 °C / 98 F átlagával , 21 és 71 °C között a Multimedia osztálynál.
(+) Az alsó maximum 39.6 °C / 103 F-ig melegszik fel, összehasonlítva a 39.1 °C / 102 F átlagával
(+) Üresjáratban a felső oldal átlagos hőmérséklete 23.2 °C / 74 F, összehasonlítva a 31.3 °C / ### eszközátlaggal class_avg_f### F.
(+) A csuklótámasz és az érintőpad hűvösebb, mint a bőr hőmérséklete, maximum 28.4 °C / 83.1 F, ezért hűvös tapintású.
(±) A hasonló eszközök csuklótámasz területének átlagos hőmérséklete 28.7 °C / 83.7 F volt (+0.3 °C / 0.6 F).
Dell XPS 15 9500 Core i5 hangelemzés
(+) | a hangszórók viszonylag hangosan tudnak játszani (84.2 dB)
Basszus 100 - 315 Hz
(+) | jó basszus – csak 4.6% választja el a mediántól
(±) | a basszus linearitása átlagos (10% delta az előző frekvenciához)
Közepes 400-2000 Hz
(+) | kiegyensúlyozott középpontok – csak 3.3% választja el a mediántól
(+) | a középpontok lineárisak (4.5% delta az előző frekvenciához)
Maximum 2-16 kHz
(+) | kiegyensúlyozott csúcsok – csak 2.4% választja el a mediántól
(+) | a csúcsok lineárisak (4.3% delta az előző frekvenciához képest)
Összességében 100 - 16.000 Hz
(+) | általános hangzás lineáris (7.7% eltérés a mediánhoz képest)
Ugyanazon osztályhoz képest
» 6%Ebben az osztályban az összes tesztelt eszköz %-a jobb volt, 2% hasonló, 91%-kal rosszabb
» A legjobb delta értéke 5%, az átlag 17%, a legrosszabb 45% volt
Az összes tesztelt eszközzel összehasonlítva
» 1% az összes tesztelt eszköz jobb volt, 0% hasonló, 98%-kal rosszabb
» A legjobb delta értéke 4%, az átlag 23%, a legrosszabb 134% volt
Apple MacBook 12 (Early 2016) 1.1 GHz hangelemzés
(+) | a hangszórók viszonylag hangosan tudnak játszani (83.6 dB)
Basszus 100 - 315 Hz
(±) | csökkentett basszus – átlagosan 11.3%-kal alacsonyabb, mint a medián
(±) | a basszus linearitása átlagos (14.2% delta az előző frekvenciához)
Közepes 400-2000 Hz
(+) | kiegyensúlyozott középpontok – csak 2.4% választja el a mediántól
(+) | a középpontok lineárisak (5.5% delta az előző frekvenciához)
Maximum 2-16 kHz
(+) | kiegyensúlyozott csúcsok – csak 2% választja el a mediántól
(+) | a csúcsok lineárisak (4.5% delta az előző frekvenciához képest)
Összességében 100 - 16.000 Hz
(+) | általános hangzás lineáris (10.2% eltérés a mediánhoz képest)
Ugyanazon osztályhoz képest
» 7%Ebben az osztályban az összes tesztelt eszköz %-a jobb volt, 2% hasonló, 90%-kal rosszabb
» A legjobb delta értéke 5%, az átlag 18%, a legrosszabb 53% volt
Az összes tesztelt eszközzel összehasonlítva
» 5% az összes tesztelt eszköz jobb volt, 1% hasonló, 94%-kal rosszabb
» A legjobb delta értéke 4%, az átlag 23%, a legrosszabb 134% volt
| Kikapcsolt állapot / Készenlét | |
| Üresjárat | |
| Terhelés |
|
Kulcs:
min: | |
| Dell XPS 15 9500 Core i5 i5-10300H, UHD Graphics 630, Toshiba KBG40ZNS256G NVMe, IPS, 1920x1200, 15.6" | Dell XPS 15 7590 i5 iGPU FHD i5-9300H, UHD Graphics 630, Toshiba XG6 KXG60ZNV512G, IPS, 1920x1080, 15.6" | Asus ZenBook 15 UX534FTC-A8190T i7-10510U, GeForce GTX 1650 Max-Q, Samsung SSD PM981 MZVLB1T0HALR, IPS, 1920x1080, 15.6" | Lenovo Yoga C940-15IRH i7-9750H, GeForce GTX 1650 Max-Q, Intel Optane Memory H10 with Solid State Storage 32GB + 512GB HBRPEKNX0202A(L/H), IPS, 1920x1080, 15.6" | HP Spectre X360 15-5ZV31AV i7-10510U, GeForce MX250, Intel SSD 660p 2TB SSDPEKNW020T8, IPS, 3840x2160, 15.6" | Apple MacBook Pro 16 2019 i9 5500M i9-9880H, Radeon Pro 5500M, Apple SSD AP1024 7171, IPS, 3072x1920, 16" | |
|---|---|---|---|---|---|---|
| Power Consumption | -20% | -15% | -95% | -31% | -65% | |
| Idle Minimum * (Watt) | 2.9 | 3.79 -31% | 2.8 3% | 5.2 -79% | 5.2 -79% | 3.7 -28% |
| Idle Average * (Watt) | 7.6 | 6.9 9% | 7.7 -1% | 10.7 -41% | 8.5 -12% | 12.1 -59% |
| Idle Maximum * (Watt) | 8 | 9.2 -15% | 9.4 -18% | 24.3 -204% | 8.7 -9% | 17 -113% |
| Load Average * (Watt) | 41.7 | 62 -49% | 57 -37% | 84.4 -102% | 65.6 -57% | 91.5 -119% |
| Load Maximum * (Watt) | 94.8 | 108 -14% | 116 -22% | 142.8 -51% | 92.4 3% | 102.3 -8% |
| Witcher 3 ultra * (Watt) | 62 | 83.9 | 56.5 | 103 |
* ... a kisebb jobb
| Dell XPS 15 9500 Core i5 i5-10300H, UHD Graphics 630, 56 Wh | Dell XPS 15 7590 i5 iGPU FHD i5-9300H, UHD Graphics 630, 97 Wh | Asus ZenBook 15 UX534FTC-A8190T i7-10510U, GeForce GTX 1650 Max-Q, 71 Wh | Lenovo Yoga C940-15IRH i7-9750H, GeForce GTX 1650 Max-Q, 69 Wh | HP Spectre X360 15-5ZV31AV i7-10510U, GeForce MX250, 84 Wh | Apple MacBook Pro 16 2019 i9 5500M i9-9880H, Radeon Pro 5500M, 99.8 Wh | |
|---|---|---|---|---|---|---|
| Akkumulátor üzemidő | 29% | 29% | -21% | 28% | -4% | |
| Reader / Idle (h) | 26.4 | 27.2 3% | 18.2 -31% | 22.6 -14% | ||
| WiFi v1.3 (h) | 9.3 | 14.1 52% | 12.4 33% | 9.7 4% | 10.8 16% | 12 29% |
| Load (h) | 1.6 | 1.7 6% | 2.4 50% | 1 -37% | 2.9 81% | 1 -37% |
| Witcher 3 ultra (h) | 0.9 |
Pro
Kontra
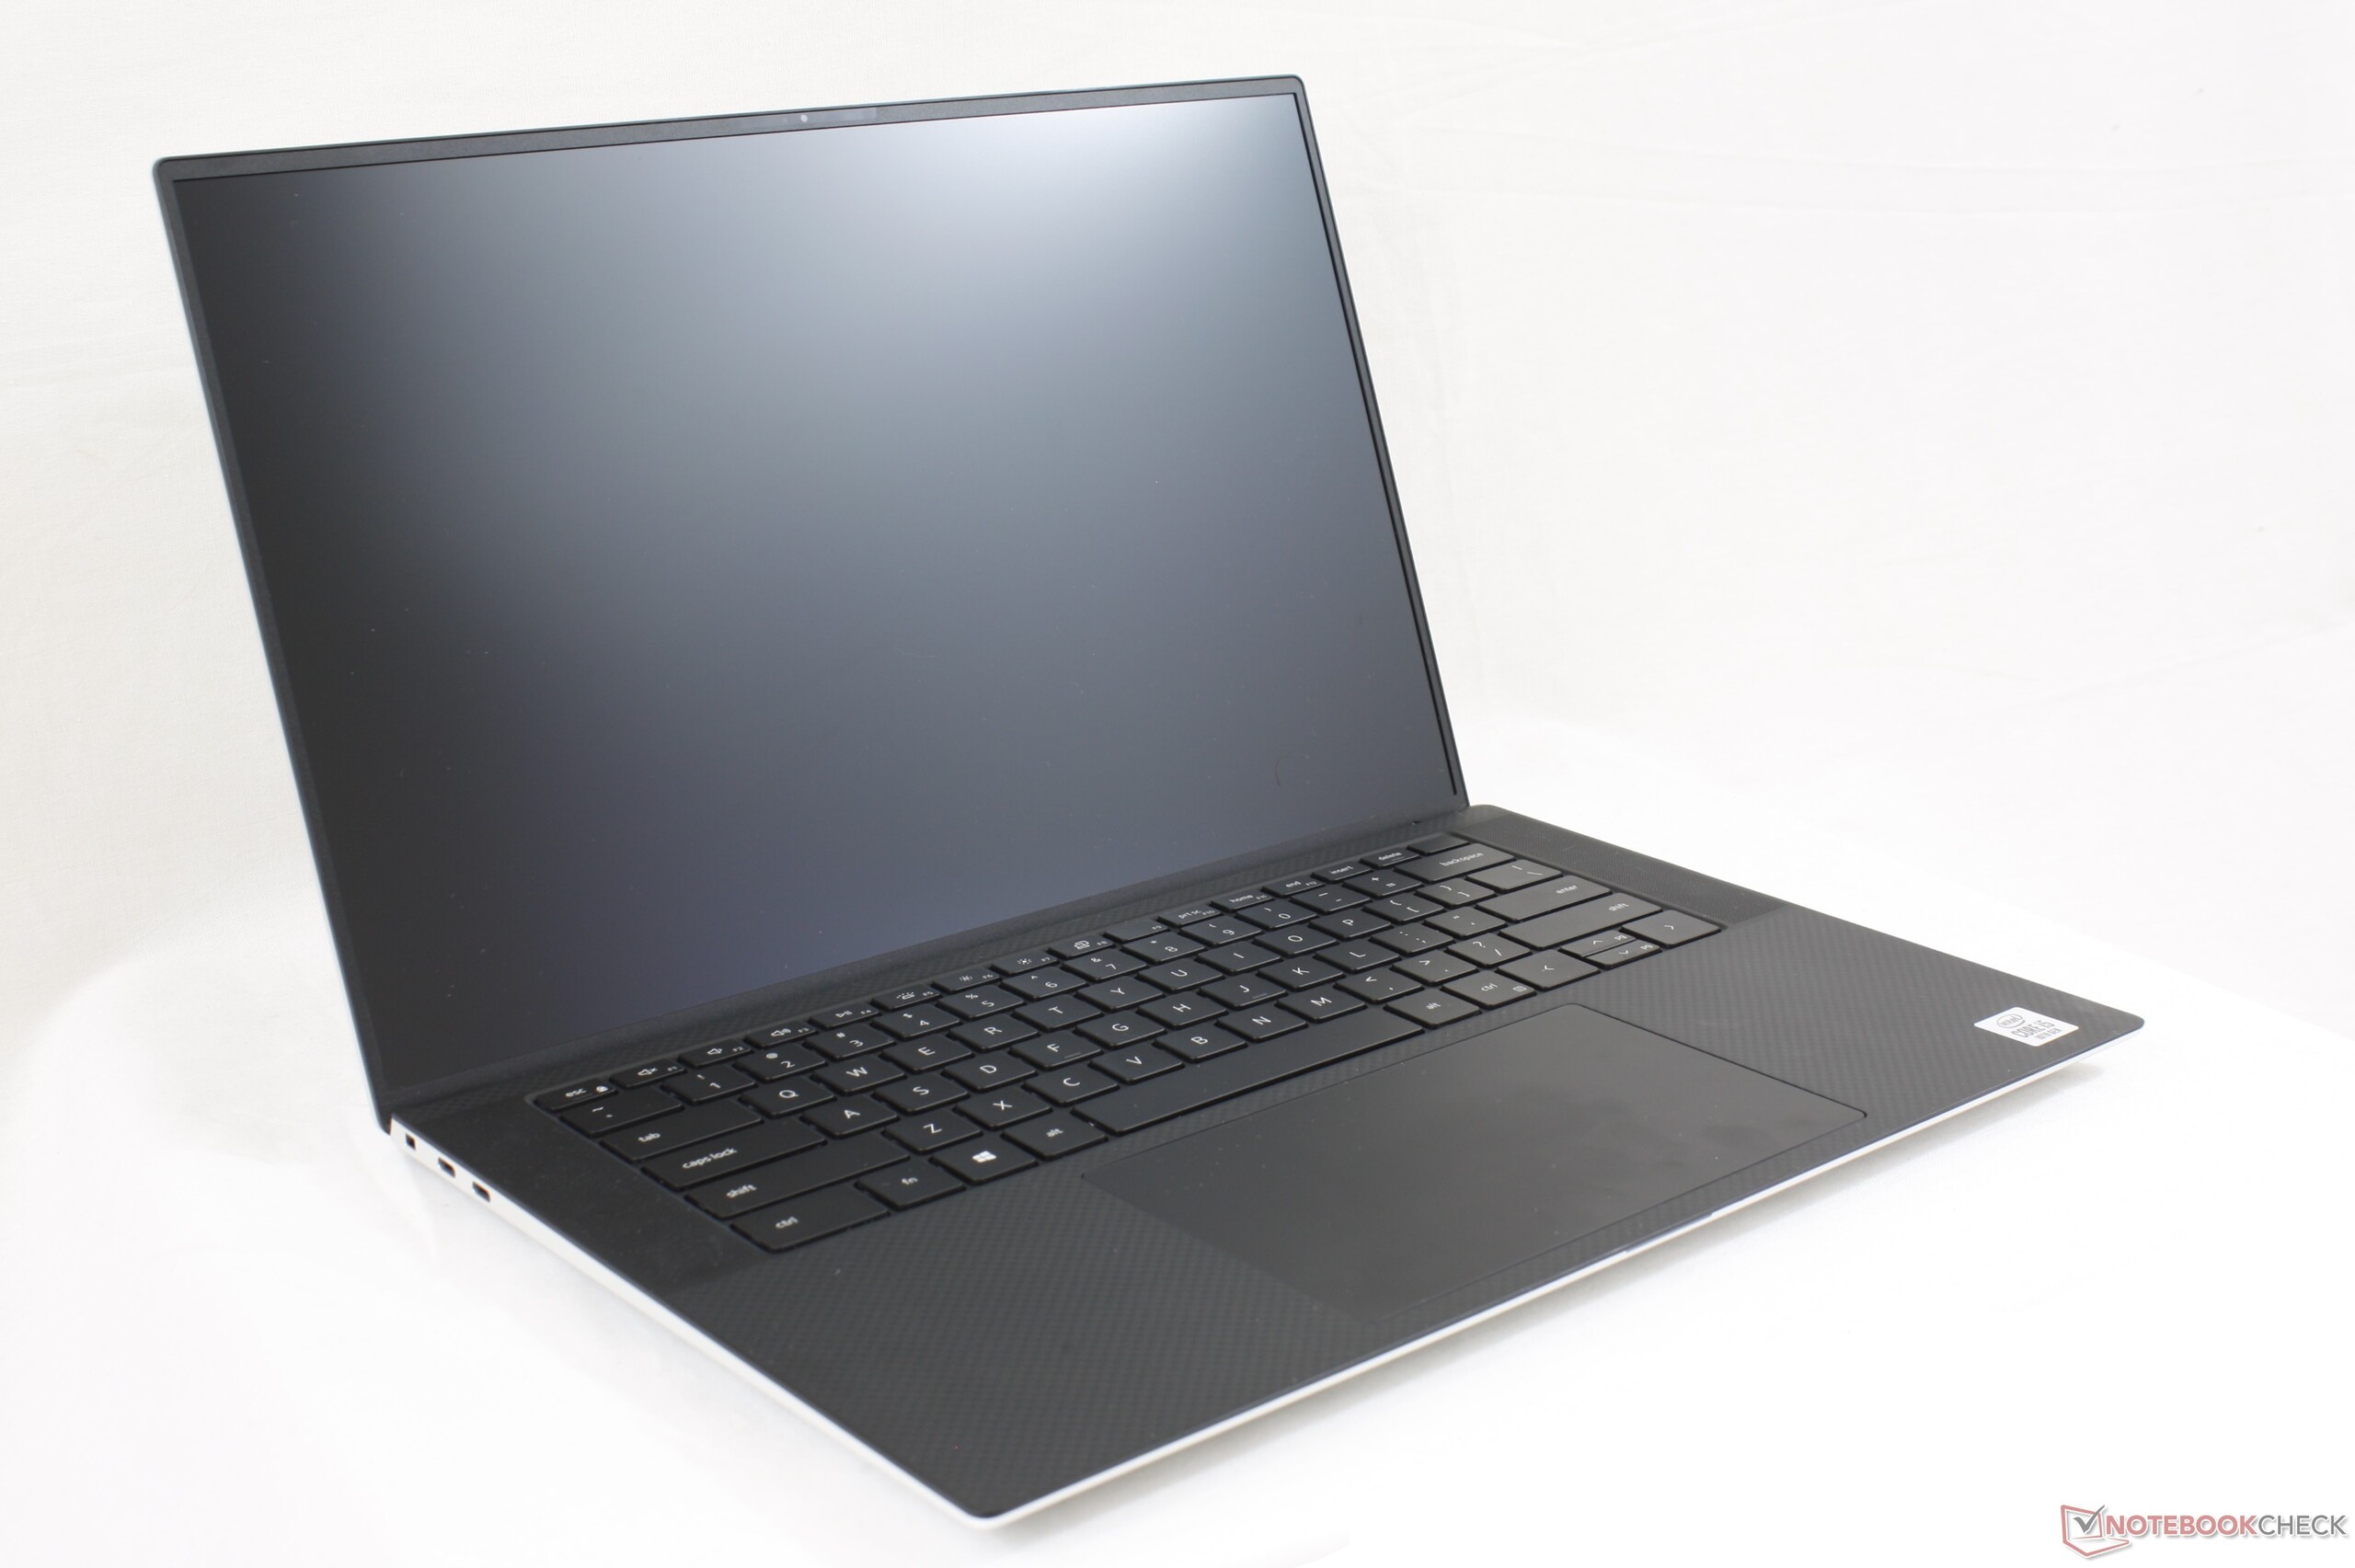
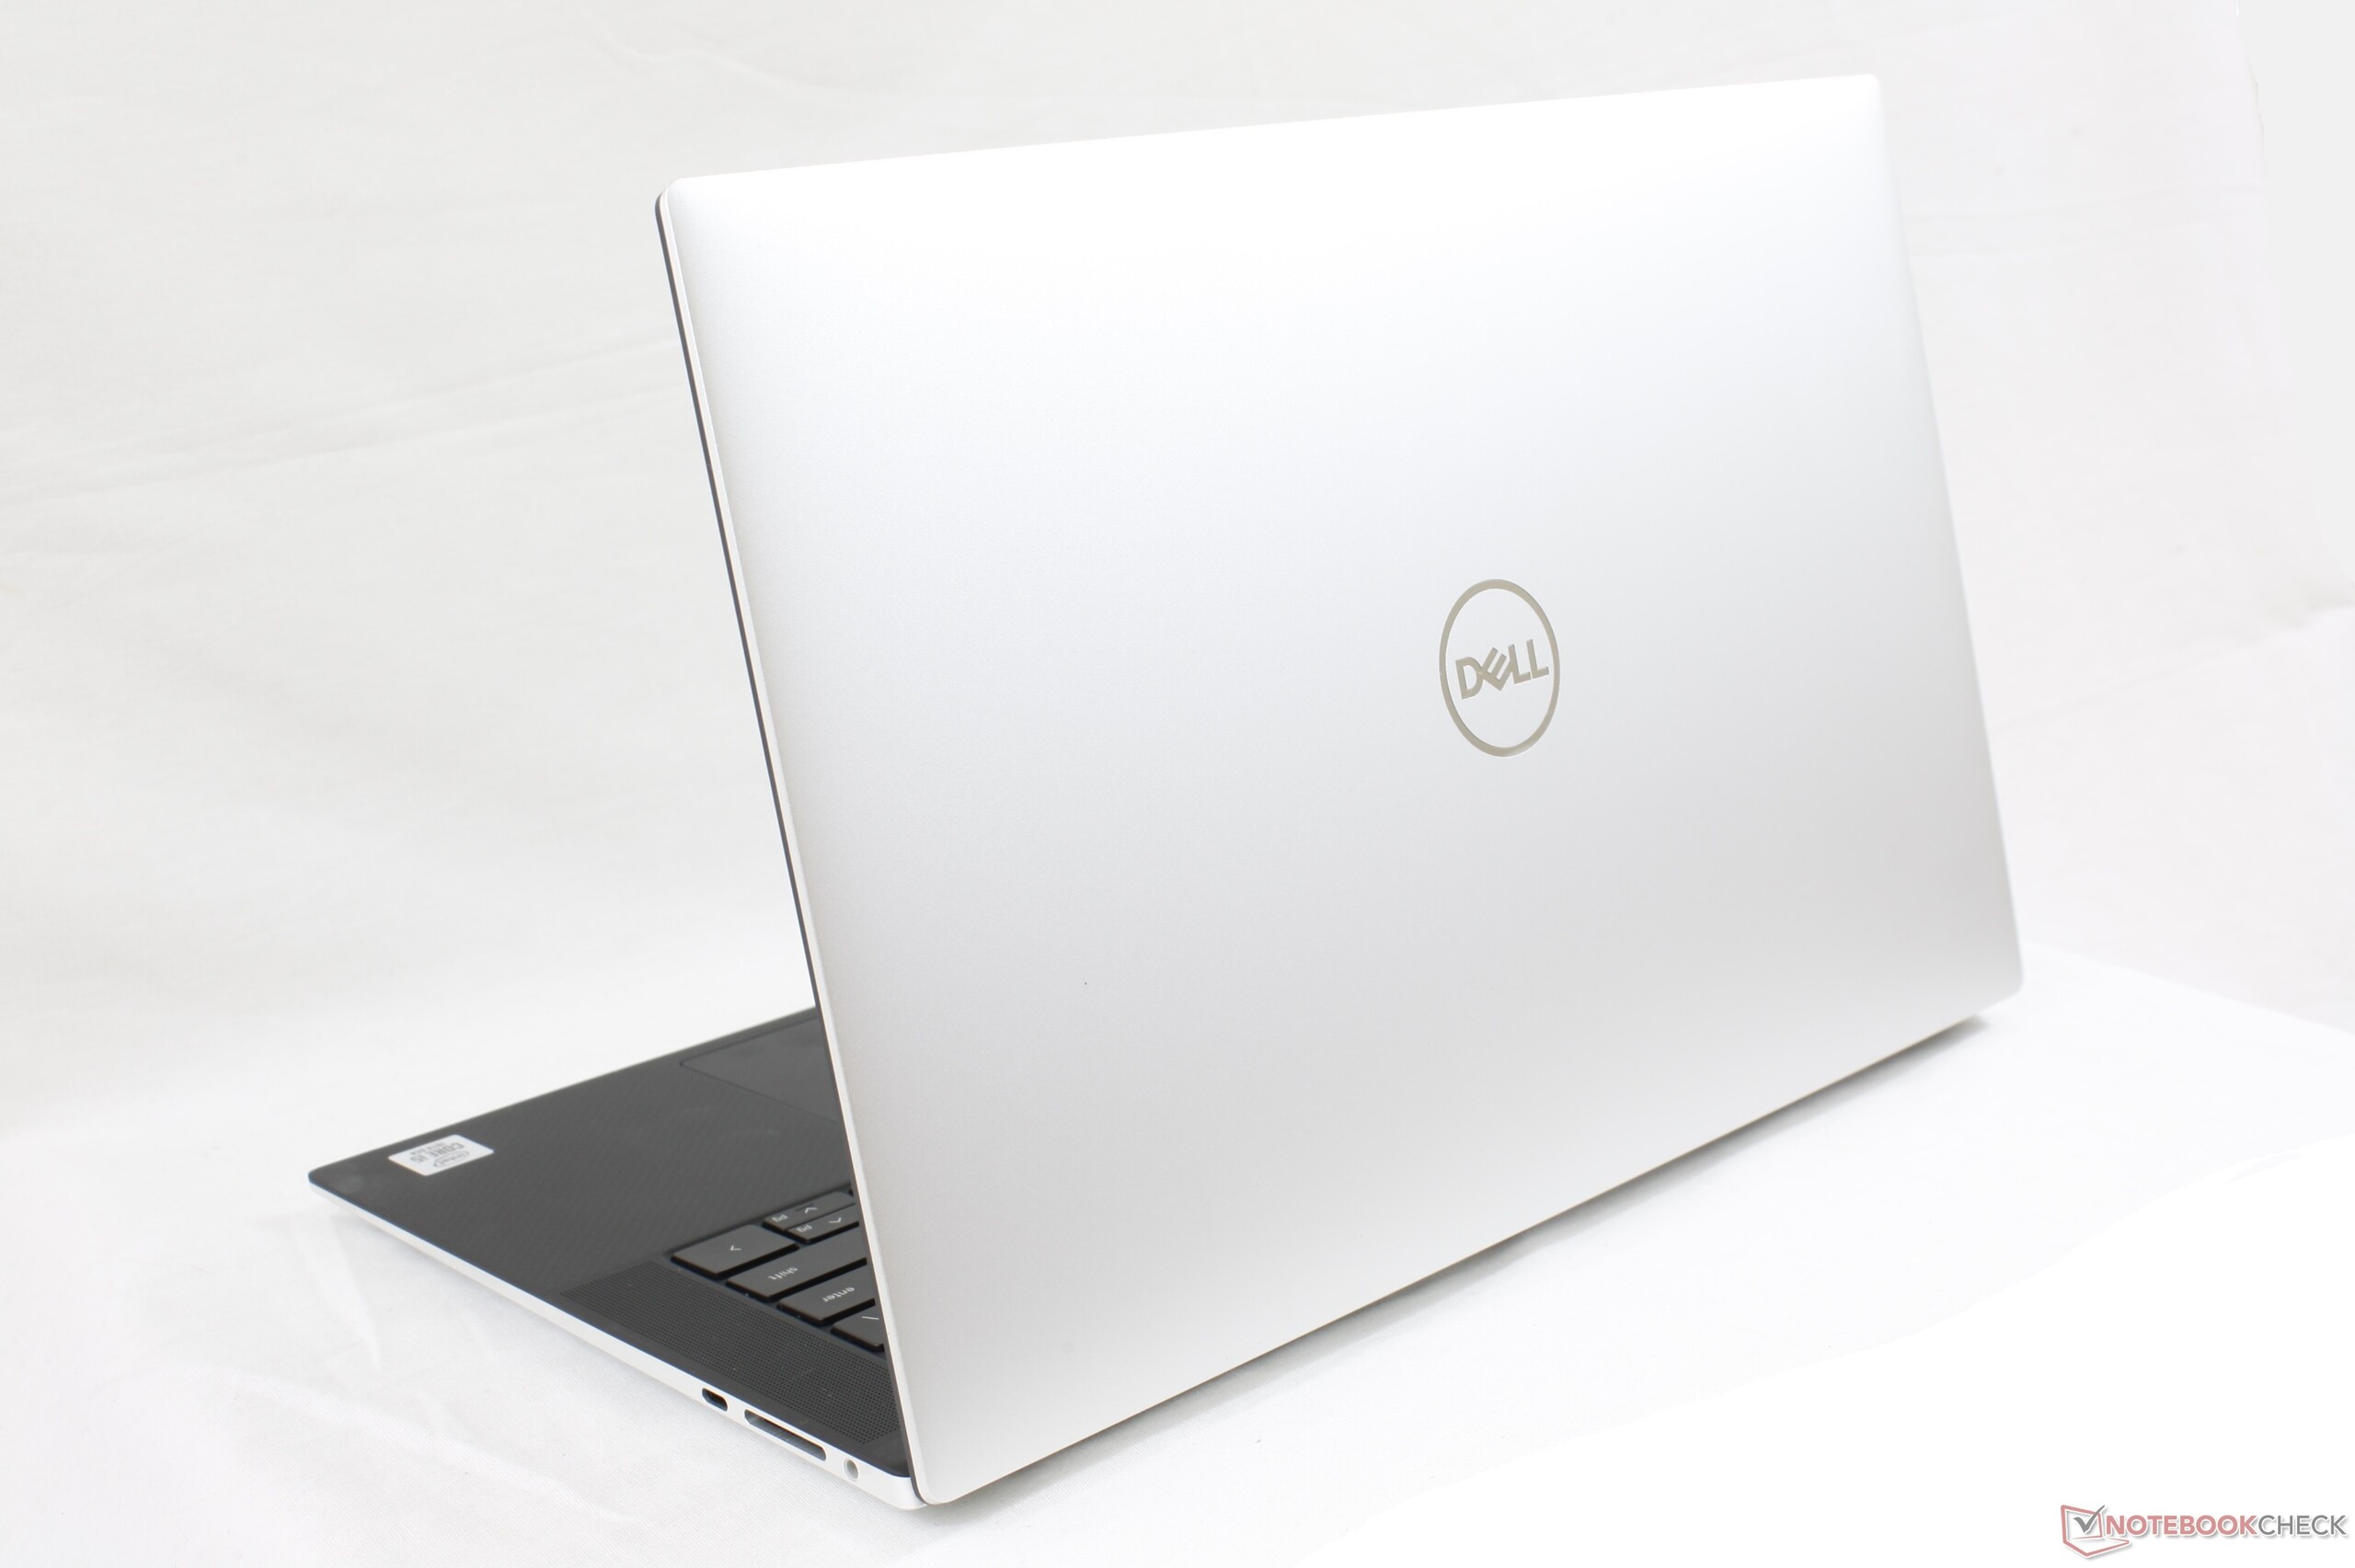
Összegzés - Nagyobb Képernyő egy Még Kisebb Házban
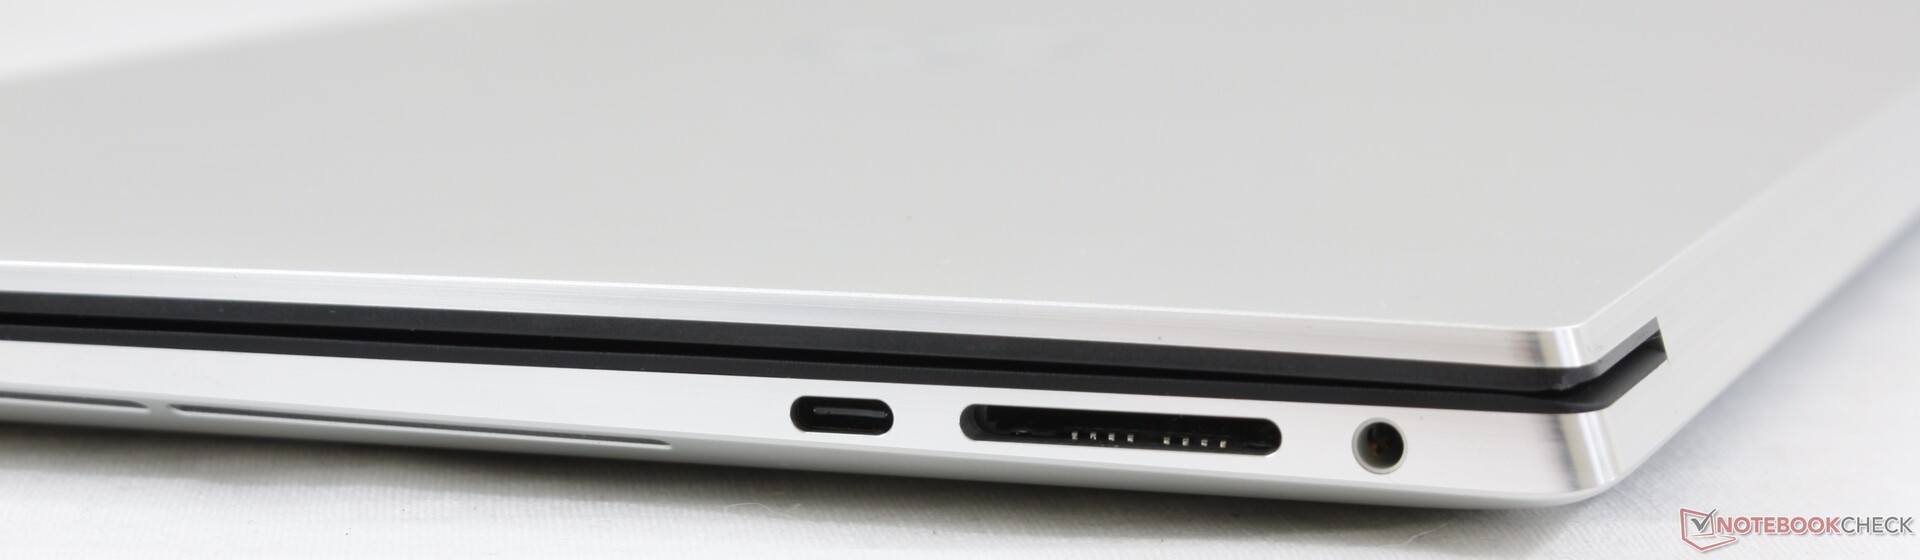
Az átlagos felhasználó szempontjából a frissített XPS 15 szinte hibátlan. A világos 16:10-es kijelző, a jobb billentyű visszajelzés, a nagy érintőpad, a kibővített audió rendszer, a hosszú üzemidő, a csendes ventilátorok, a bővíthető RAM és az új másodlagos M.2 hely mind hozzájárulnak ahhoz, hogy a rendszert öröm legyen használni. Aki eddig halogatta egy XPS 15 beszerzését, az most jobb, ha megfontolja, mivel ez a új revízió jelentős továbbfejlesztéseken ment keresztül a régi dizájnhoz képest. A HDMI és az USB-A kihagyása elkerülhetetlenül zavaró lesz, de minden csomagban kapunk adaptereket, és ez a MacBook Pro-ról nem mondható el.
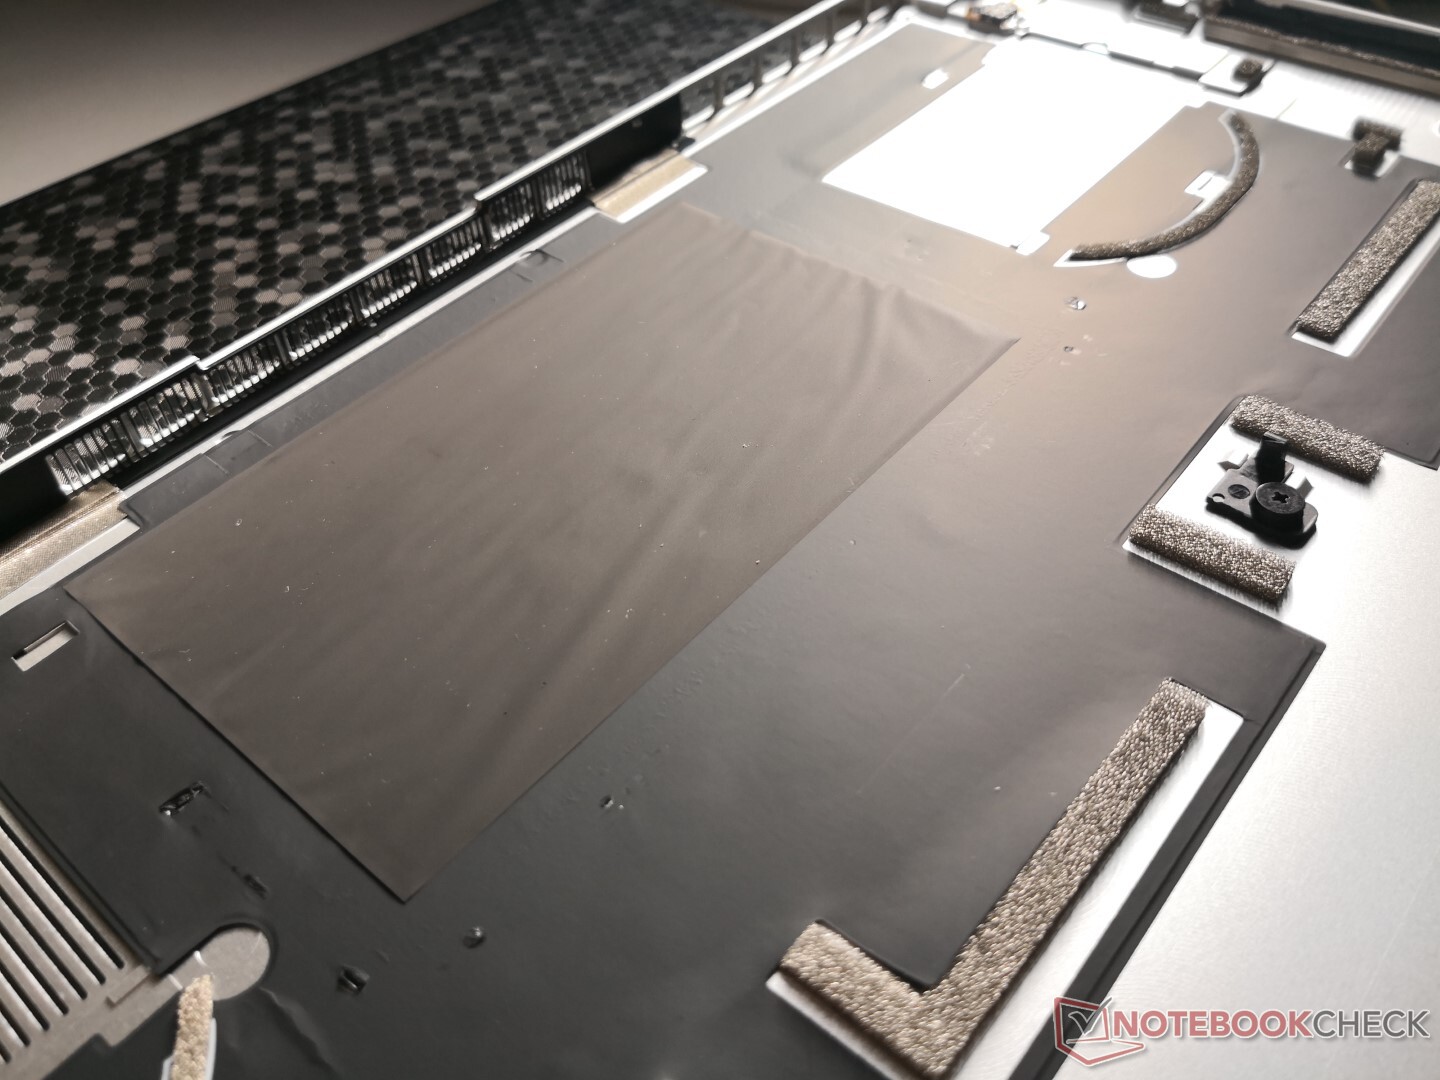
Egy rajongó szemszögéből nézve viszont úgy tűnik, hogy a hűtőrendszer különösebben nem változott. A belső hőmérséklet már a mi négymagos Core i5 alap konfigurációnkon is 90 C fölött van, ami azt jelenti, hogy a magasabb kategóriájú, nyolcmagos Core i7 GeForce GTX konfiguráció még ennél is forróbb és hangosabb lesz. Aki nem rajongott a korábbi generációs modell elég átlagos hűtési megoldásáért, azt valószínűleg ez az új modell sem fogja meggyőzni. Továbbá a WLAN modul és a billentyűzet szervizelése most bonyolultabb, mint azelőtt, mivel a komponenseit erősebben beépítették az alaplapba.
Nemsokára újra meg fogjuk vizsgálni az XPS 15 9500-at különböző konfigurációkban, hogy egy átfogóbb képet kaphassunk a teljes modellről. De az 1300 dolláros kezdő árával a Dell zászlóshajó rendszere szinte minden szempontból jól teljesít, és az első benyomás nagyszerű.
Dell XPS 15 9500 Core i5
- 06/09/2020 v7 (old)
Allen Ngo
Price comparison

