Dell XPS 13 9300 4K UHD Laptop rövid értékelés: A 16:10 az Új 16:9
Értékelés | Dátum | Modell | Súly | Magasság | Méret | Felbontás | Legjobb ár |
|---|---|---|---|---|---|---|---|
| 88 % v7 (old) | 07/2020 | Dell XPS 13 9300 4K UHD i7-1065G7, Iris Plus Graphics G7 (Ice Lake 64 EU) | 1.2 kg | 14.8 mm | 13.40" | 3840x2400 | |
| 86.3 % v7 (old) | 12/2019 | Dell XPS 13 7390 2-in-1 Core i7 i7-1065G7, Iris Plus Graphics G7 (Ice Lake 64 EU) | 1.3 kg | 13 mm | 13.40" | 1920x1200 | |
| 85.9 % v7 (old) | 01/2020 | Dell XPS 13 7390 Core i7-10710U i7-10710U, UHD Graphics 620 | 1.2 kg | 11.6 mm | 13.30" | 3840x2160 | |
| 90.6 % v7 (old) | 02/2021 | Apple MacBook Pro 13 2019 2TB3 i5-8257U, Iris Plus Graphics 645 | 1.4 kg | 14.9 mm | 13.30" | 2560x1600 | |
| 83.9 % v7 (old) | 12/2019 | Microsoft Surface Laptop 3 15 i7-1065G7 i7-1065G7, Iris Plus Graphics G7 (Ice Lake 64 EU) | 1.5 kg | 14.7 mm | 15.00" | 2496x1664 | |
| 83.7 % v7 (old) | 01/2020 | Razer Blade Stealth 13, Core i7-1065G7 i7-1065G7, GeForce GTX 1650 Max-Q | 1.5 kg | 15.3 mm | 13.30" | 3840x2160 |
| SD Card Reader | |
| average JPG Copy Test (av. of 3 runs) | |
| Dell XPS 13 9300 4K UHD (Toshiba Exceria Pro M501 64 GB UHS-II) | |
| Dell XPS 13 7390 Core i7-10710U (Toshiba Exceria Pro M501 64 GB UHS-II) | |
| HP Spectre x360 13-aw0013dx (Toshiba Exceria Pro M501 microSDXC 64GB) | |
| Dell XPS 13 7390 2-in-1 Core i7 (Toshiba Exceria Pro M501 64 GB UHS-II) | |
| Asus ZenBook Duo UX481FL (Toshiba Exceria Pro M501 microSDXC 64GB) | |
| maximum AS SSD Seq Read Test (1GB) | |
| Dell XPS 13 9300 4K UHD (Toshiba Exceria Pro M501 64 GB UHS-II) | |
| Dell XPS 13 7390 Core i7-10710U (Toshiba Exceria Pro M501 64 GB UHS-II) | |
| Dell XPS 13 7390 2-in-1 Core i7 (Toshiba Exceria Pro M501 64 GB UHS-II) | |
| HP Spectre x360 13-aw0013dx (Toshiba Exceria Pro M501 microSDXC 64GB) | |
| Asus ZenBook Duo UX481FL (Toshiba Exceria Pro M501 microSDXC 64GB) | |
| Networking | |
| iperf3 transmit AX12 | |
| Asus ZenBook Duo UX481FL | |
| MSI GP65 10SFK-047US | |
| Gigabyte Aero 17 HDR XB | |
| Dell XPS 13 9300 4K UHD | |
| iperf3 receive AX12 | |
| Gigabyte Aero 17 HDR XB | |
| Dell XPS 13 9300 4K UHD | |
| Asus ZenBook Duo UX481FL | |
| MSI GP65 10SFK-047US | |

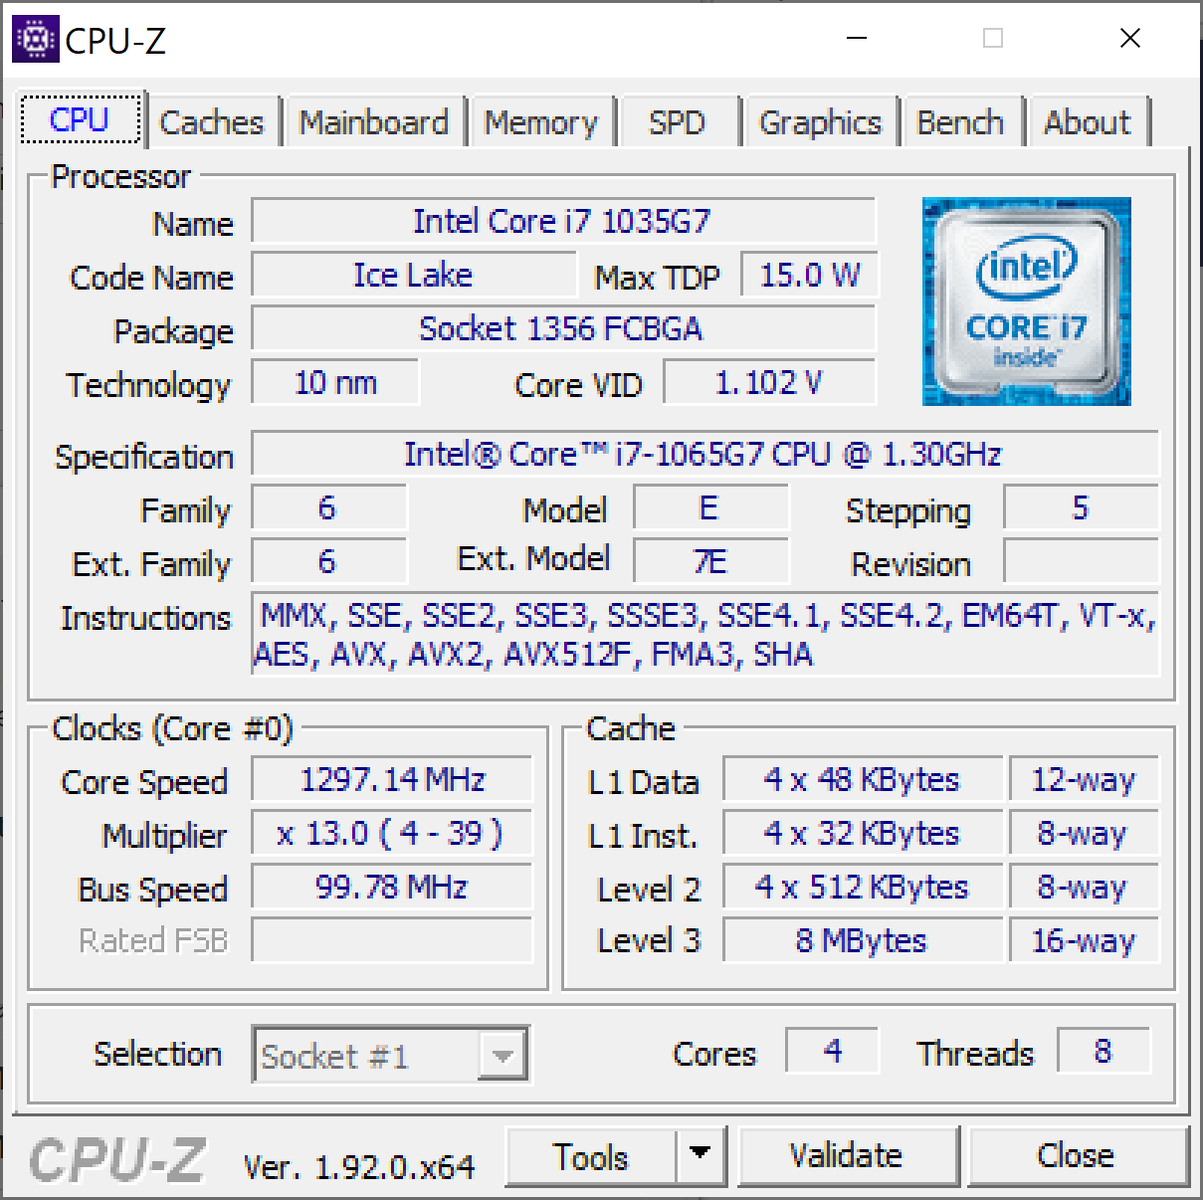
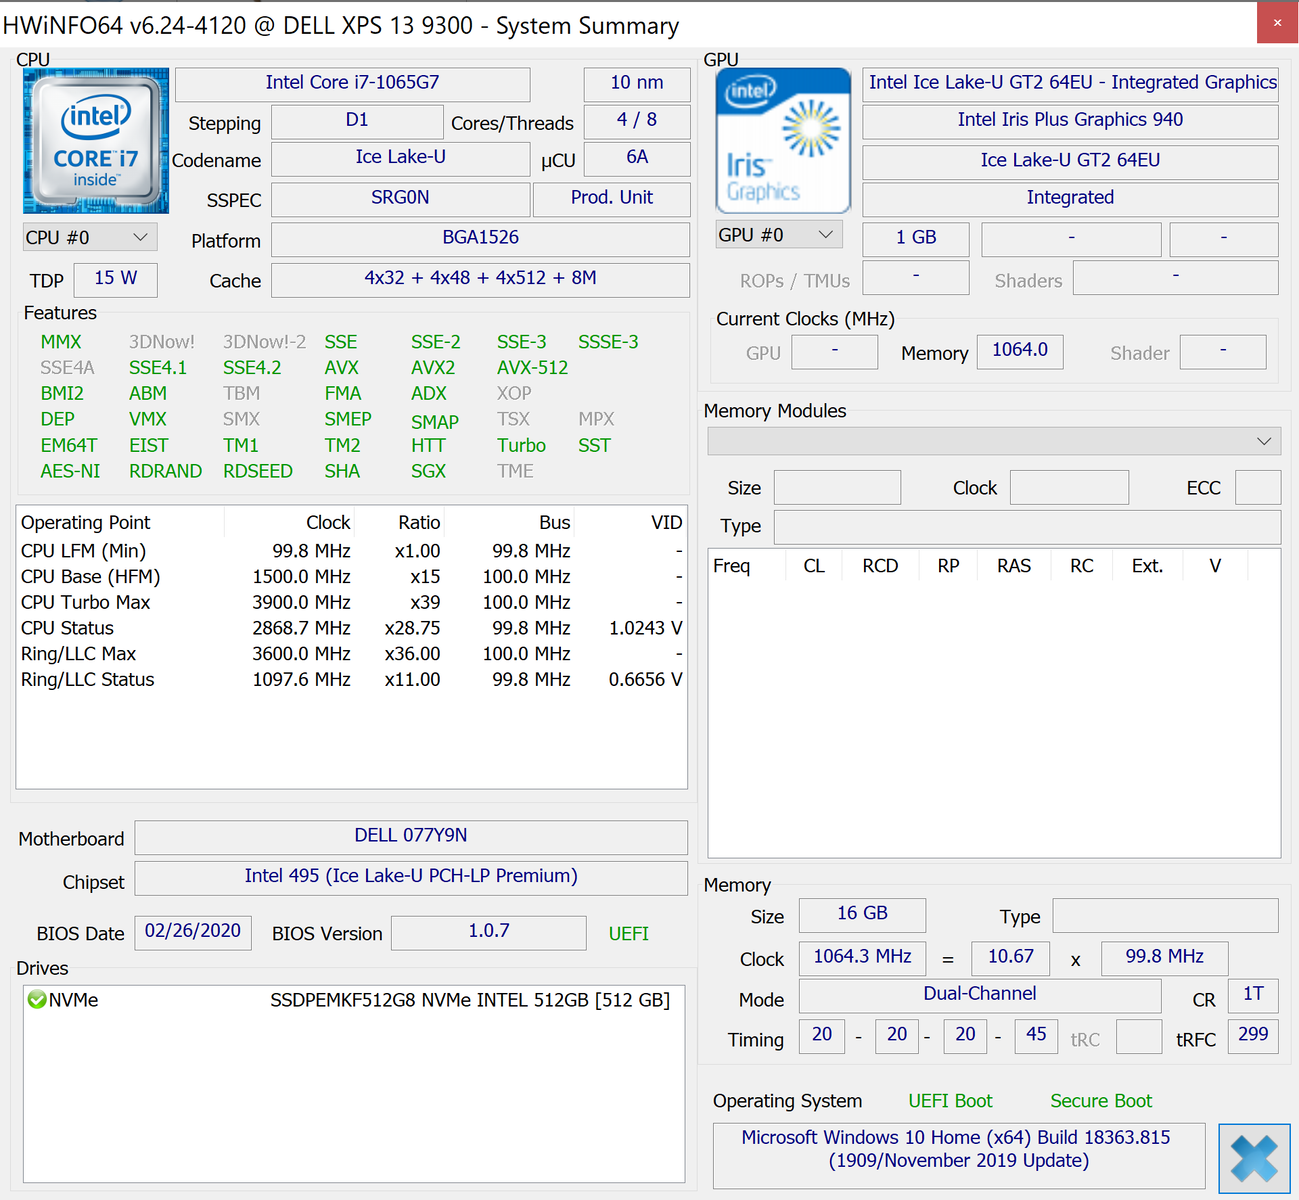
, i7-1065G7, Intel SSDPEMKF512G8 NVMe SSD")
, i7-1065G7, Intel SSDPEMKF512G8 NVMe SSD")
| |||||||||||||||||||||||||
Fényerő megoszlás: 94 %
Centrumban: 414 cd/m²
Kontraszt: 1479:1 (Fekete: 0.28 cd/m²)
ΔE ColorChecker Calman: 3.06 | ∀{0.5-29.43 Ø4.71}
calibrated: 3.5
ΔE Greyscale Calman: 3 | ∀{0.09-98 Ø4.96}
91.4% sRGB (Argyll 1.6.3 3D)
61.1% AdobeRGB 1998 (Argyll 1.6.3 3D)
66.6% AdobeRGB 1998 (Argyll 3D)
91.4% sRGB (Argyll 3D)
64.5% Display P3 (Argyll 3D)
Gamma: 2.42
CCT: 6840 K
| Dell XPS 13 9300 4K UHD Sharp LQ134R1, IPS, 13.4", 3840x2400 | Dell XPS 13 9300 Core i7-1065G7 Sharp LQ134N1, IPS, 13.4", 1920x1200 | Dell XPS 13 7390 2-in-1 Core i7 Sharp LQ134N1, IPS, 13.4", 1920x1200 | Dell XPS 13 7390 Core i7-10710U AU Optronics B133ZAN, Dell P/N: 90NTH, IPS, 13.3", 3840x2160 | Apple MacBook Pro 13 2019 2TB3 APPA03D, IPS, 13.3", 2560x1600 | Microsoft Surface Laptop 3 13 Core i5-1035G7 Sharp LQ135P1JX51, IPS, 13.5", 2256x1504 | |
|---|---|---|---|---|---|---|
| Display | 4% | 8% | -1% | 29% | 4% | |
| Display P3 Coverage (%) | 64.5 | 66.3 3% | 69.9 8% | 63.4 -2% | 96.1 49% | 65.7 2% |
| sRGB Coverage (%) | 91.4 | 97.3 6% | 99.2 9% | 93.7 3% | 99.4 9% | 98.6 8% |
| AdobeRGB 1998 Coverage (%) | 66.6 | 68.5 3% | 71.5 7% | 64.3 -3% | 85.6 29% | 67.8 2% |
| Response Times | -25% | -14% | -28% | -30% | -53% | |
| Response Time Grey 50% / Grey 80% * (ms) | 41.6 ? | 50 ? -20% | 47.6 ? -14% | 51.6 ? -24% | 50.4 ? -21% | 59.2 ? -42% |
| Response Time Black / White * (ms) | 25.6 ? | 33.2 ? -30% | 29.2 ? -14% | 33.6 ? -31% | 35.2 ? -38% | 41.6 ? -63% |
| PWM Frequency (Hz) | 2500 ? | 2500 ? | 116300 ? | 21740 ? | ||
| Screen | 1% | 16% | -29% | 29% | 21% | |
| Brightness middle (cd/m²) | 414 | 607.6 47% | 549.8 33% | 408.2 -1% | 603 46% | 403.4 -3% |
| Brightness (cd/m²) | 401 | 595 48% | 520 30% | 399 0% | 577 44% | 397 -1% |
| Brightness Distribution (%) | 94 | 96 2% | 86 -9% | 89 -5% | 92 -2% | 89 -5% |
| Black Level * (cd/m²) | 0.28 | 0.4 -43% | 0.39 -39% | 0.39 -39% | 0.35 -25% | 0.34 -21% |
| Contrast (:1) | 1479 | 1519 3% | 1410 -5% | 1047 -29% | 1723 16% | 1186 -20% |
| Colorchecker dE 2000 * | 3.06 | 3.23 -6% | 2.12 31% | 4.6 -50% | 1.7 44% | 0.94 69% |
| Colorchecker dE 2000 max. * | 6.5 | 8.67 -33% | 3.66 44% | 11.84 -82% | 3.1 52% | 2.92 55% |
| Colorchecker dE 2000 calibrated * | 3.5 | 1.01 71% | 1.37 61% | 2.03 42% | 0.7 80% | 0.99 72% |
| Greyscale dE 2000 * | 3 | 5.5 -83% | 2.6 13% | 7.5 -150% | 2.1 30% | 0.9 70% |
| Gamma | 2.42 91% | 2.12 104% | 2.3 96% | 2.12 104% | 2.18 101% | 2.13 103% |
| CCT | 6840 95% | 6413 101% | 6884 94% | 7966 82% | 6843 95% | 6620 98% |
| Color Space (Percent of AdobeRGB 1998) (%) | 61.1 | 63 3% | 65.4 7% | 59.5 -3% | 76.7 26% | 62.3 2% |
| Color Space (Percent of sRGB) (%) | 91.4 | 97.5 7% | 99.7 9% | 93.5 2% | 99.4 9% | 98.7 8% |
| Teljes átlag (program / beállítások) | -7% /
-1% | 3% /
11% | -19% /
-23% | 9% /
22% | -9% /
8% |
* ... a kisebb jobb
Megjelenítési válaszidők
| ↔ Válaszidő Fekete-fehér | ||
|---|---|---|
| 25.6 ms ... emelkedés és süllyedés ↘ kombinálva | ↗ 15.6 ms emelkedés | 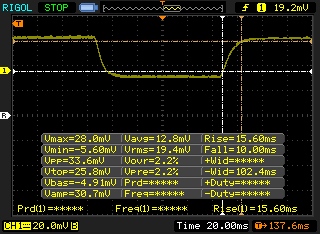 |
| ↘ 10 ms ősz | ||
| A képernyő viszonylag lassú reakciósebességet mutat tesztjeinkben, és túl lassú lehet a játékosok számára. Összehasonlításképpen, az összes tesztelt eszköz 0.1 (minimum) és 240 (maximum) ms között mozog. » 61 % of all devices are better. Ez azt jelenti, hogy a mért válaszidő rosszabb, mint az összes vizsgált eszköz átlaga (19.8 ms). | ||
| ↔ Válaszidő 50% szürke és 80% szürke között | ||
| 41.6 ms ... emelkedés és süllyedés ↘ kombinálva | ↗ 23.2 ms emelkedés | 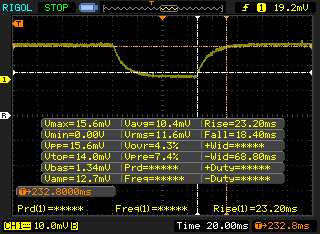 |
| ↘ 18.4 ms ősz | ||
| A képernyő lassú reakciósebességet mutat tesztjeinkben, és nem lesz kielégítő a játékosok számára. Összehasonlításképpen, az összes tesztelt eszköz 0.165 (minimum) és 636 (maximum) ms között mozog. » 67 % of all devices are better. Ez azt jelenti, hogy a mért válaszidő rosszabb, mint az összes vizsgált eszköz átlaga (31 ms). | ||
Képernyő villogása / PWM (impulzusszélesség-moduláció)
| Képernyő villogása / PWM nem érzékelhető | 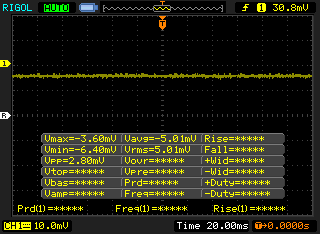 | ||
Összehasonlításképpen: az összes tesztelt eszköz 52 %-a nem használja a PWM-et a kijelző elsötétítésére. Ha PWM-et észleltek, akkor átlagosan 7754 (minimum: 5 - maximum: 343500) Hz-t mértek. | |||
Cinebench R15: CPU Single 64Bit | CPU Multi 64Bit
Blender: v2.79 BMW27 CPU
7-Zip 18.03: 7z b 4 -mmt1 | 7z b 4
Geekbench 5.5: Single-Core | Multi-Core
HWBOT x265 Benchmark v2.2: 4k Preset
LibreOffice : 20 Documents To PDF
R Benchmark 2.5: Overall mean
| Cinebench R20 / CPU (Multi Core) | |
| Dell XPS 13 7390 Core i7-10710U | |
| Acer Aspire 7 A715-74G-50U5 | |
| Dell XPS 13 9300 i5 FHD | |
| Átlagos Intel Core i7-1065G7 (1081 - 2024, n=31) | |
| Huawei MateBook D 14-53010TVS | |
| Huawei MateBook D 14-53010TVS | |
| Dell Inspiron 15 5000 5585 | |
| Asus ZenBook Duo UX481FL | |
| Dell XPS 13 9300 4K UHD | |
| Acer Aspire 5 A515-54G | |
| HP Envy 13-aq0003ng | |
| Dynabook Portege A30-E-174 | |
| Dell XPS 13 7390 2-in-1 Core i3 | |
| Cinebench R20 / CPU (Single Core) | |
| Dell XPS 13 7390 Core i7-10710U | |
| Dell XPS 13 9300 4K UHD | |
| Asus ZenBook Duo UX481FL | |
| Átlagos Intel Core i7-1065G7 (358 - 474, n=31) | |
| Acer Aspire 7 A715-74G-50U5 | |
| Dell XPS 13 9300 i5 FHD | |
| Acer Aspire 5 A515-54G | |
| Dell XPS 13 7390 2-in-1 Core i3 | |
| Dynabook Portege A30-E-174 | |
| HP Envy 13-aq0003ng | |
| Dell Inspiron 15 5000 5585 | |
| Huawei MateBook D 14-53010TVS | |
| Huawei MateBook D 14-53010TVS | |
| Cinebench R15 / CPU Single 64Bit | |
| Dell XPS 13 9300 4K UHD | |
| Dell XPS 13 7390 Core i7-10710U | |
| Asus ZenBook Duo UX481FL | |
| Átlagos Intel Core i7-1065G7 (141 - 190, n=35) | |
| HP Envy 13-aq0003ng | |
| Acer Aspire 7 A715-74G-50U5 | |
| Dell XPS 13 9300 i5 FHD | |
| Acer Aspire 5 A515-54G | |
| Dell XPS 13 7390 2-in-1 Core i3 | |
| Dynabook Portege A30-E-174 | |
| Huawei MateBook D 14-53010TVS | |
| Dell Inspiron 15 5000 5585 | |
| Cinebench R15 / CPU Multi 64Bit | |
| Dell XPS 13 7390 Core i7-10710U | |
| Acer Aspire 7 A715-74G-50U5 | |
| Asus ZenBook Duo UX481FL | |
| Dell XPS 13 9300 4K UHD | |
| Huawei MateBook D 14-53010TVS | |
| Dell Inspiron 15 5000 5585 | |
| Dell XPS 13 9300 i5 FHD | |
| Dell XPS 13 9300 i5 FHD | |
| Átlagos Intel Core i7-1065G7 (288 - 836, n=36) | |
| Acer Aspire 5 A515-54G | |
| HP Envy 13-aq0003ng | |
| Dynabook Portege A30-E-174 | |
| Dell XPS 13 7390 2-in-1 Core i3 | |
| Blender / v2.79 BMW27 CPU | |
| Dell XPS 13 7390 2-in-1 Core i3 | |
| Átlagos Intel Core i7-1065G7 (675 - 1650, n=23) | |
| Acer Aspire 5 A515-54G | |
| Asus ZenBook Duo UX481FL | |
| Dell XPS 13 9300 i5 FHD | |
| Huawei MateBook D 14-53010TVS | |
| Huawei MateBook D 14-53010TVS | |
| Dell XPS 13 9300 4K UHD | |
| Dell XPS 13 7390 Core i7-10710U | |
| 7-Zip 18.03 / 7z b 4 -mmt1 | |
| Asus ZenBook Duo UX481FL | |
| Dell XPS 13 9300 4K UHD | |
| Dell XPS 13 7390 Core i7-10710U | |
| Átlagos Intel Core i7-1065G7 (3289 - 4589, n=24) | |
| Acer Aspire 5 A515-54G | |
| Dell XPS 13 9300 i5 FHD | |
| Dell XPS 13 7390 2-in-1 Core i3 | |
| Huawei MateBook D 14-53010TVS | |
| Huawei MateBook D 14-53010TVS | |
| 7-Zip 18.03 / 7z b 4 | |
| Dell XPS 13 7390 Core i7-10710U | |
| Dell XPS 13 9300 4K UHD | |
| Asus ZenBook Duo UX481FL | |
| Dell XPS 13 9300 i5 FHD | |
| Acer Aspire 5 A515-54G | |
| Huawei MateBook D 14-53010TVS | |
| Huawei MateBook D 14-53010TVS | |
| Átlagos Intel Core i7-1065G7 (10406 - 22898, n=24) | |
| Dell XPS 13 7390 2-in-1 Core i3 | |
| Geekbench 5.5 / Single-Core | |
| Dell XPS 13 9300 4K UHD | |
| Átlagos Intel Core i7-1065G7 (948 - 1348, n=18) | |
| Asus ZenBook Duo UX481FL | |
| Dell XPS 13 9300 i5 FHD | |
| Acer Aspire 5 A515-54G | |
| Huawei MateBook D 14-53010TVS | |
| Huawei MateBook D 14-53010TVS | |
| Geekbench 5.5 / Multi-Core | |
| Dell XPS 13 9300 4K UHD | |
| Dell XPS 13 9300 i5 FHD | |
| Átlagos Intel Core i7-1065G7 (2464 - 4855, n=18) | |
| Asus ZenBook Duo UX481FL | |
| Acer Aspire 5 A515-54G | |
| Huawei MateBook D 14-53010TVS | |
| Huawei MateBook D 14-53010TVS | |
| HWBOT x265 Benchmark v2.2 / 4k Preset | |
| Dell XPS 13 9300 4K UHD | |
| Dell XPS 13 7390 Core i7-10710U | |
| Asus ZenBook Duo UX481FL | |
| Átlagos Intel Core i7-1065G7 (2.2 - 6.38, n=22) | |
| Acer Aspire 5 A515-54G | |
| Dell XPS 13 9300 i5 FHD | |
| Huawei MateBook D 14-53010TVS | |
| Huawei MateBook D 14-53010TVS | |
| Dell XPS 13 7390 2-in-1 Core i3 | |
| LibreOffice / 20 Documents To PDF | |
| Dell XPS 13 9300 4K UHD | |
| Asus ZenBook Duo UX481FL | |
| Acer Aspire 5 A515-54G | |
| Átlagos Intel Core i7-1065G7 (46.9 - 85.3, n=19) | |
| R Benchmark 2.5 / Overall mean | |
| Asus ZenBook Duo UX481FL | |
| Huawei MateBook D 14-53010TVS | |
| Huawei MateBook D 14-53010TVS | |
| Dell XPS 13 9300 i5 FHD | |
| Acer Aspire 5 A515-54G | |
| Átlagos Intel Core i7-1065G7 (0.661 - 0.798, n=18) | |
| Dell XPS 13 9300 4K UHD | |
* ... a kisebb jobb
| PCMark 8 Home Score Accelerated v2 | 3397 pontok | |
| PCMark 8 Work Score Accelerated v2 | 4314 pontok | |
| PCMark 10 Score | 4451 pontok | |
Segítség | ||
| DPC Latencies / LatencyMon - interrupt to process latency (max), Web, Youtube, Prime95 | |
| Dell XPS 13 9300 4K UHD | |
* ... a kisebb jobb
| Dell XPS 13 9300 4K UHD Intel SSDPEMKF512G8 NVMe SSD | Dell XPS 13 9300 Core i7-1065G7 Intel SSDPEMKF512G8 NVMe SSD | Dell XPS 13 7390 2-in-1 Core i7 Toshiba BG4 KBG40ZPZ512G | Dell XPS 13 7390 Core i7-10710U SK Hynix PC601 NVMe 512 GB | Apple MacBook Pro 13 2019 2TB3 Apple SSD AP0256 | |
|---|---|---|---|---|---|
| AS SSD | 1% | -21% | 22% | -77% | |
| Seq Read (MB/s) | 1821 | 1956 7% | 1801 -1% | 1804 -1% | 974 -47% |
| Seq Write (MB/s) | 931 | 1227 32% | 1125 21% | 1000 7% | 1340 44% |
| 4K Read (MB/s) | 56.4 | 63 12% | 39.7 -30% | 45.1 -20% | 11.35 -80% |
| 4K Write (MB/s) | 127.2 | 156.6 23% | 67 -47% | 115 -10% | 15.95 -87% |
| 4K-64 Read (MB/s) | 462.6 | 475.6 3% | 1253 171% | 893 93% | 643 39% |
| 4K-64 Write (MB/s) | 541 | 539 0% | 209 -61% | 732 35% | 163 -70% |
| Access Time Read * (ms) | 0.04 | 0.042 -5% | 0.069 -73% | 0.044 -10% | 0.316 -690% |
| Access Time Write * (ms) | 0.123 | 0.105 15% | 0.625 -408% | 0.095 23% | 0.258 -110% |
| Score Read (Points) | 701 | 734 5% | 1472 110% | 1119 60% | 752 7% |
| Score Write (Points) | 762 | 818 7% | 388 -49% | 947 24% | 313 -59% |
| Score Total (Points) | 1797 | 1915 7% | 2583 44% | 2608 45% | 1465 -18% |
| Copy ISO MB/s (MB/s) | 1068 | 1022 -4% | 1293 21% | 1515 42% | 1404 31% |
| Copy Program MB/s (MB/s) | 446.4 | 302.8 -32% | 560 25% | 535 20% | 406.9 -9% |
| Copy Game MB/s (MB/s) | 1163 | 491.4 -58% | 927 -20% | 1211 4% | 850 -27% |
| CrystalDiskMark 5.2 / 6 | 20% | 1% | 27% | ||
| Write 4K (MB/s) | 126.2 | 186.8 48% | 106.7 -15% | 134 6% | |
| Read 4K (MB/s) | 61.1 | 71.4 17% | 49.94 -18% | 42.91 -30% | |
| Write Seq (MB/s) | 1049 | 1203 15% | 1223 17% | 1841 76% | |
| Read Seq (MB/s) | 2231 | 2600 17% | 1801 -19% | 1707 -23% | |
| Write 4K Q32T1 (MB/s) | 410.1 | 514 25% | 325.3 -21% | 394.7 -4% | |
| Read 4K Q32T1 (MB/s) | 418.9 | 570 36% | 551 32% | 398.5 -5% | |
| Write Seq Q32T1 (MB/s) | 784 | 786 0% | 1224 56% | 2250 187% | |
| Read Seq Q32T1 (MB/s) | 2964 | 2947 -1% | 2350 -21% | 3265 10% | |
| Teljes átlag (program / beállítások) | 11% /
8% | -10% /
-13% | 25% /
24% | -77% /
-77% |
* ... a kisebb jobb

Disk Throttling: DiskSpd Read Loop, Queue Depth 8
| 3DMark 11 | |
| 1280x720 Performance GPU | |
| Razer Blade Stealth 13, Core i7-1065G7 | |
| MSI Modern 14 A10RB-459US | |
| Dell XPS 13 9300 Core i7-1065G7 | |
| Dell XPS 13 9300 4K UHD | |
| Dell Inspiron 15 5000 5585 | |
| Átlagos Intel Iris Plus Graphics G7 (Ice Lake 64 EU) (2112 - 4630, n=28) | |
| Asus Zenbook 14 UX433FN-A6023T | |
| Dell XPS 13 9300 i5 FHD | |
| Dell XPS 13 7390 Core i7-10710U | |
| HP Pavilion x360 15-dq0065cl | |
| Dell XPS 15 7590 i5 iGPU FHD | |
| 1280x720 Performance Combined | |
| Razer Blade Stealth 13, Core i7-1065G7 | |
| MSI Modern 14 A10RB-459US | |
| Dell XPS 13 9300 Core i7-1065G7 | |
| Asus Zenbook 14 UX433FN-A6023T | |
| Dell Inspiron 15 5000 5585 | |
| Átlagos Intel Iris Plus Graphics G7 (Ice Lake 64 EU) (1319 - 4163, n=28) | |
| Dell XPS 13 9300 4K UHD | |
| Dell XPS 13 9300 i5 FHD | |
| Dell XPS 13 7390 Core i7-10710U | |
| Dell XPS 15 7590 i5 iGPU FHD | |
| HP Pavilion x360 15-dq0065cl | |
| 3DMark 11 Performance | 4478 pontok | |
| 3DMark Cloud Gate Standard Score | 12940 pontok | |
| 3DMark Fire Strike Score | 2707 pontok | |
| 3DMark Time Spy Score | 847 pontok | |
Segítség | ||
| alacsony | közepes | magas | ultra | |
|---|---|---|---|---|
| Dota 2 Reborn (2015) | 80.2 | 48.6 | 30.1 | 27.6 |
| X-Plane 11.11 (2018) | 27.6 | 15.2 | 17.3 |
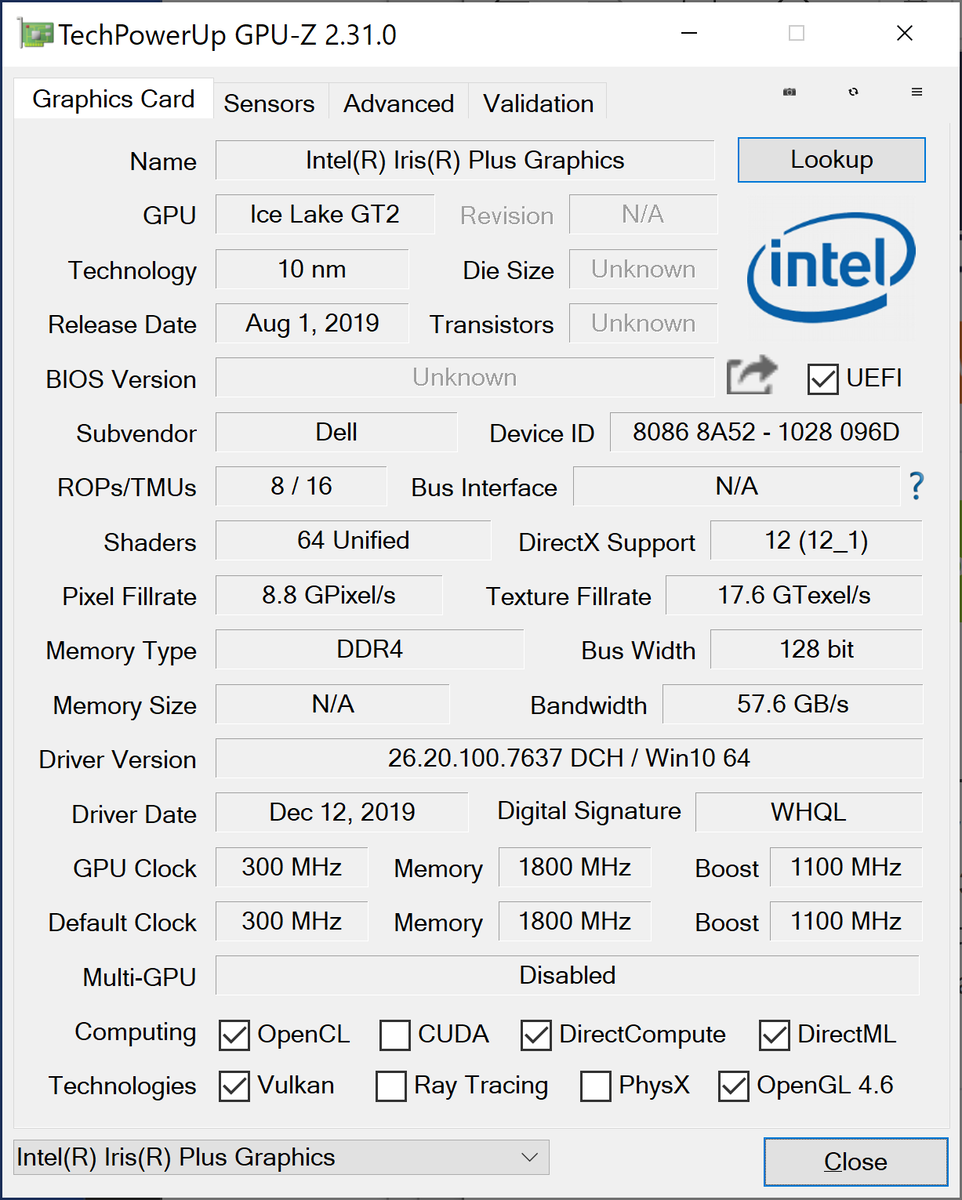
| Dell XPS 13 9300 4K UHD Iris Plus Graphics G7 (Ice Lake 64 EU), i7-1065G7, Intel SSDPEMKF512G8 NVMe SSD | Dell XPS 13 9300 Core i7-1065G7 Iris Plus Graphics G7 (Ice Lake 64 EU), i7-1065G7, Intel SSDPEMKF512G8 NVMe SSD | Dell XPS 13 7390 2-in-1 Core i7 Iris Plus Graphics G7 (Ice Lake 64 EU), i7-1065G7, Toshiba BG4 KBG40ZPZ512G | Dell XPS 13 7390 Core i7-10710U UHD Graphics 620, i7-10710U, SK Hynix PC601 NVMe 512 GB | Apple MacBook Pro 13 2019 2TB3 Iris Plus Graphics 645, i5-8257U, Apple SSD AP0256 | Microsoft Surface Laptop 3 13 Core i5-1035G7 Iris Plus Graphics G7 (Ice Lake 64 EU), i5-1035G7, SK hynix BC501 HFM256GDGTNG | |
|---|---|---|---|---|---|---|
| Noise | 2% | 0% | -1% | 0% | 3% | |
| off / környezet * (dB) | 29 | 28.3 2% | 28.1 3% | 28 3% | 29.5 -2% | 28.5 2% |
| Idle Minimum * (dB) | 29 | 28.3 2% | 28.1 3% | 28 3% | 29.5 -2% | 28.5 2% |
| Idle Average * (dB) | 29 | 28.3 2% | 28.1 3% | 28 3% | 29.5 -2% | 28.5 2% |
| Idle Maximum * (dB) | 29 | 28.3 2% | 28.1 3% | 28 3% | 29.5 -2% | 28.5 2% |
| Load Average * (dB) | 33.5 | 32.5 3% | 31.7 5% | 33.7 -1% | 31.1 7% | 28.5 15% |
| Witcher 3 ultra * (dB) | 40.5 | 39.3 3% | 43.4 -7% | 40.4 -0% | ||
| Load Maximum * (dB) | 40.5 | 39.3 3% | 43.4 -7% | 46.5 -15% | 39.3 3% | 40.4 -0% |
* ... a kisebb jobb
Zajszint
| Üresjárat |
| 29 / 29 / 29 dB(A) |
| Terhelés |
| 33.5 / 40.5 dB(A) |
 | ||
30 dB csendes 40 dB(A) hallható 50 dB(A) hangos |
||
min: | ||
(-) A felső oldalon a maximális hőmérséklet 48.4 °C / 119 F, összehasonlítva a 35.9 °C / 97 F átlagával , 21.4 és 59 °C között a Subnotebook osztálynál.
(±) Az alsó maximum 44.4 °C / 112 F-ig melegszik fel, összehasonlítva a 39.2 °C / 103 F átlagával
(+) Üresjáratban a felső oldal átlagos hőmérséklete 27.3 °C / 81 F, összehasonlítva a 30.8 °C / ### eszközátlaggal class_avg_f### F.
(+) A csuklótámasz és az érintőpad eléri a bőr maximális hőmérsékletét (32 °C / 89.6 F), ezért nem forrók.
(-) A hasonló eszközök csuklótámasz területének átlagos hőmérséklete 28.2 °C / 82.8 F volt (-3.8 °C / -6.8 F).
| Kikapcsolt állapot / Készenlét | |
| Üresjárat | |
| Terhelés |
|
Kulcs:
min: | |
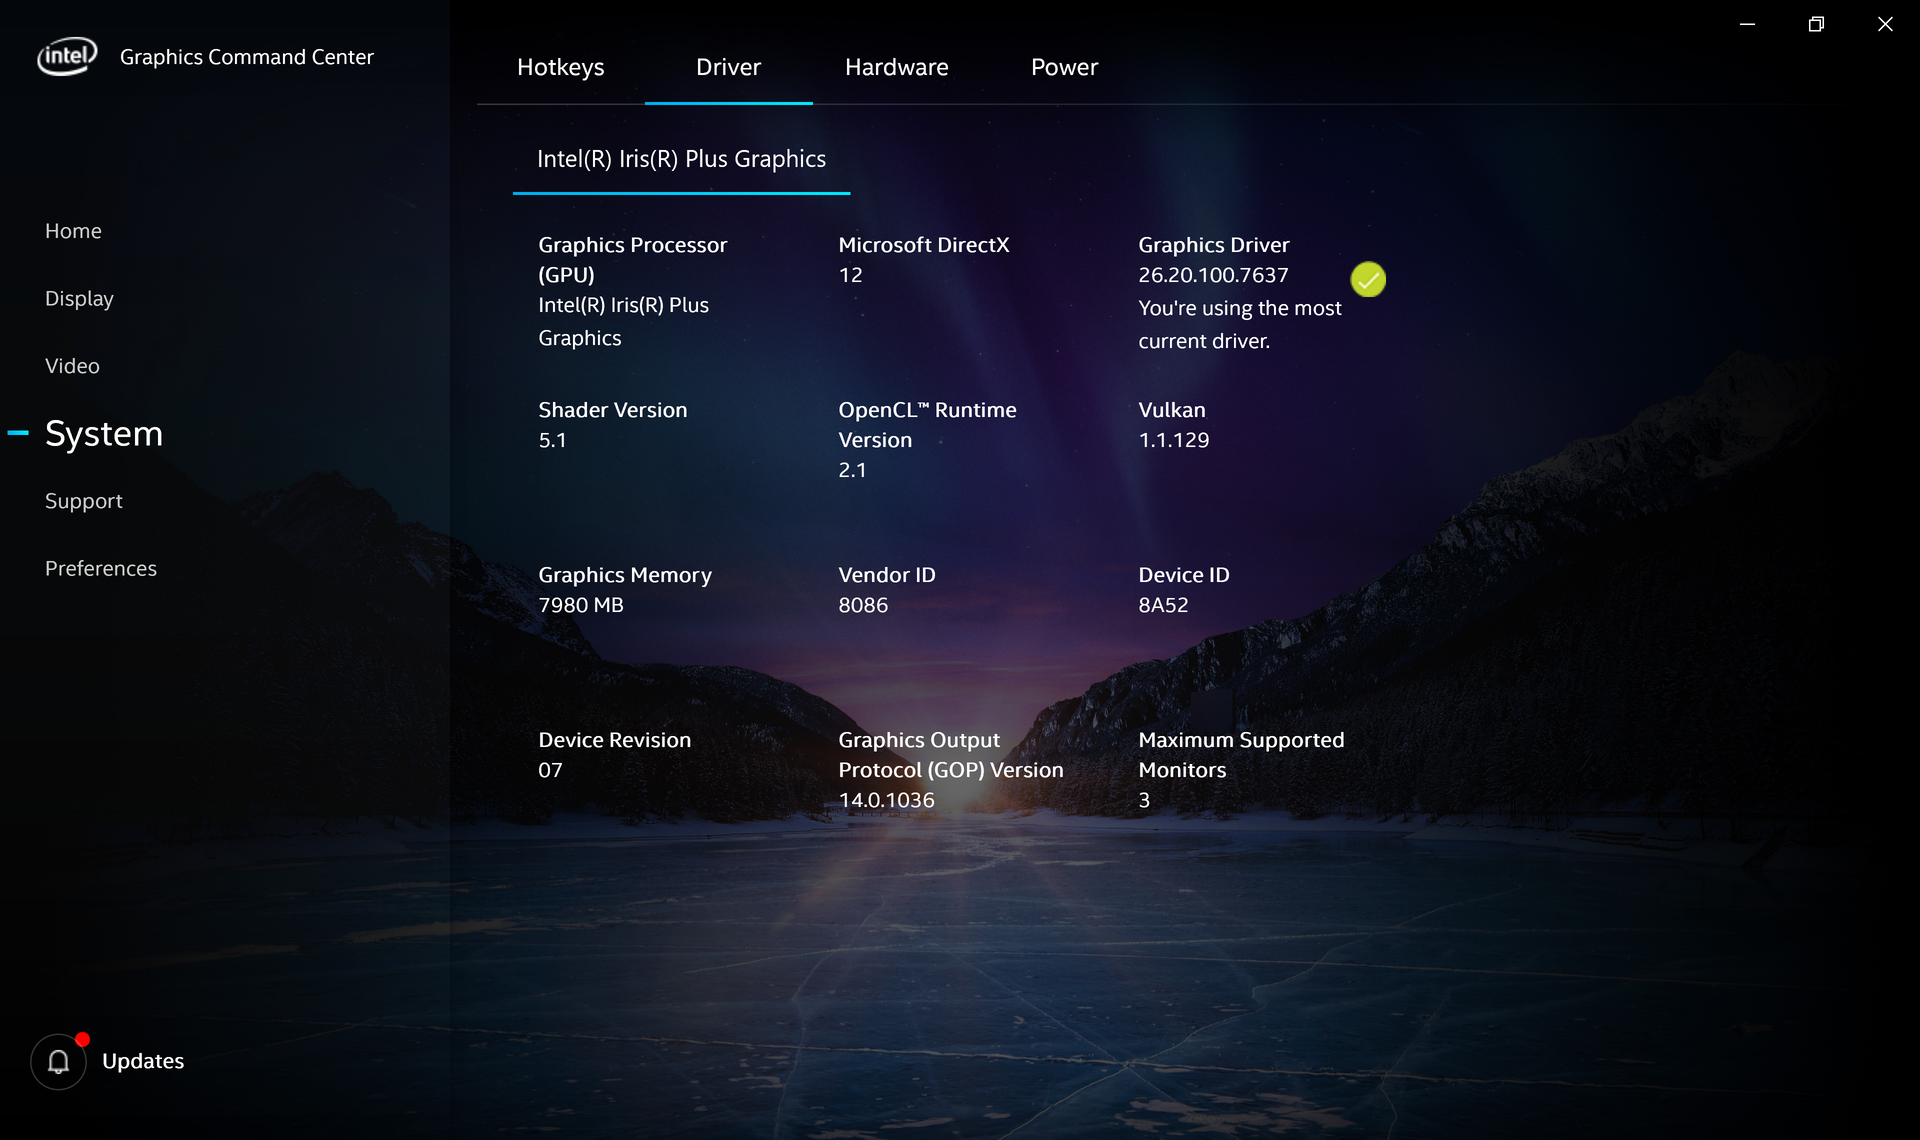
| Dell XPS 13 9300 4K UHD i7-1065G7, Iris Plus Graphics G7 (Ice Lake 64 EU), Intel SSDPEMKF512G8 NVMe SSD, IPS, 3840x2400, 13.4" | Dell XPS 13 9300 Core i7-1065G7 i7-1065G7, Iris Plus Graphics G7 (Ice Lake 64 EU), Intel SSDPEMKF512G8 NVMe SSD, IPS, 1920x1200, 13.4" | Dell XPS 13 7390 2-in-1 Core i7 i7-1065G7, Iris Plus Graphics G7 (Ice Lake 64 EU), Toshiba BG4 KBG40ZPZ512G, IPS, 1920x1200, 13.4" | Dell XPS 13 7390 Core i7-10710U i7-10710U, UHD Graphics 620, SK Hynix PC601 NVMe 512 GB, IPS, 3840x2160, 13.3" | Apple MacBook Pro 13 2019 2TB3 i5-8257U, Iris Plus Graphics 645, Apple SSD AP0256, IPS, 2560x1600, 13.3" | Microsoft Surface Laptop 3 13 Core i5-1035G7 i5-1035G7, Iris Plus Graphics G7 (Ice Lake 64 EU), SK hynix BC501 HFM256GDGTNG, IPS, 2256x1504, 13.5" | |
|---|---|---|---|---|---|---|
| Power Consumption | 16% | 20% | 4% | 13% | 4% | |
| Idle Minimum * (Watt) | 5.3 | 4.2 21% | 2.6 51% | 4.7 11% | 2.1 60% | 4.4 17% |
| Idle Average * (Watt) | 7.8 | 6.9 12% | 5.3 32% | 8.3 -6% | 6.9 12% | 7.5 4% |
| Idle Maximum * (Watt) | 9.8 | 7.5 23% | 7 29% | 9 8% | 7.8 20% | 7.8 20% |
| Load Average * (Watt) | 46 | 33.3 28% | 43.1 6% | 42 9% | 42 9% | 41.9 9% |
| Witcher 3 ultra * (Watt) | 43 | 37.1 14% | 43.1 -0% | 40.8 5% | ||
| Load Maximum * (Watt) | 48.3 | 48.4 -0% | 49 -1% | 49 -1% | 64.5 -34% | 63.9 -32% |
* ... a kisebb jobb
| Dell XPS 13 9300 4K UHD i7-1065G7, Iris Plus Graphics G7 (Ice Lake 64 EU), 52 Wh | Dell XPS 13 9300 Core i7-1065G7 i7-1065G7, Iris Plus Graphics G7 (Ice Lake 64 EU), 52 Wh | Dell XPS 13 7390 2-in-1 Core i7 i7-1065G7, Iris Plus Graphics G7 (Ice Lake 64 EU), 51 Wh | Dell XPS 13 7390 Core i7-10710U i7-10710U, UHD Graphics 620, 52 Wh | Apple MacBook Pro 13 2019 2TB3 i5-8257U, Iris Plus Graphics 645, 58.2 Wh | Microsoft Surface Laptop 3 13 Core i5-1035G7 i5-1035G7, Iris Plus Graphics G7 (Ice Lake 64 EU), 45 Wh | |
|---|---|---|---|---|---|---|
| Akkumulátor üzemidő | 11% | -21% | -26% | 14% | -27% | |
| WiFi v1.3 (h) | 11.4 | 12.7 11% | 9 -21% | 8.4 -26% | 13 14% | 8.3 -27% |
| Reader / Idle (h) | 34.4 | |||||
| Load (h) | 1.9 |
Pro
Kontra
A Dell XPS 13 9300 egyedülálló, abból a szempontból, hogy jelenleg az egyike (ha nem az egyetlen) azon Windows „kagylóhéj” subnotebookoknak, amelyek 16:10-es 4K UHD érintőképernyővel rendelkeznek. Aki a 4K UHD opción gondolkodik az alap FHD opció helyett, annak érdemes tudnia néhány előnyről és hátrányról.
Először az előnyökről: A sűrűbb febontás és az élesebb képernyő mellett a 4K opció gyorsabb fekete-fehér és szürke-szürke válaszidőkre képes, mint a FHD opció, kevésbé észrevehető ghosting-gal. Az impulzusszélesség-moduláció teljes mértékben hiányzik, míg ez a jelenség a FHD modelleknél megtalálható. A kontraszt és a színtér gyakorlatilag azonosak a FHD panellel, ami azt jelenti, hogy a felhasználók semmit sem veszítenek azzal, hogy a nagyobb felbontású kijelzőt választják.
A 4K opció legfőbb hátránya az, hogy nem annyira világos, mint a FHD opció. Beltéri használatban nincs különösebb eltérés, viszont ha kültérben való használatban gondolkodunk, akkor minden nit extra fényerősség hasznos lehet. Az üzemidő szintén egy-két órával kevesebb, de ez csak egy csekély veszteség az XPS 13 eleve hosszú üzemidejét tekintve.
A 4K néhány váratlan előnnyel rendelkezik a FHD verzióval szemben, mint pl. a gyorsabb válaszidők és az impulzusszélesség-moduláció hiánya. Aki szeret útközben dolgozni, annak viszont a FHD verzió megfelelőbb lehet, egyszerűen azért, mert 50 százalékkal nagyobb fényerejű, mint a 4K opció.
Dell XPS 13 9300 4K UHD
- 05/15/2020 v7 (old)
Allen Ngo
Price comparison

