Dell XPS 13 9300 Laptop rövid értékelés: - Kisebb, de lassabb CPU
Értékelés | Dátum | Modell | Súly | Magasság | Méret | Felbontás | Legjobb ár |
|---|---|---|---|---|---|---|---|
| 88.8 % v7 (old) | 06/2020 | Dell XPS 13 9300 i5 FHD i5-1035G1, UHD Graphics G1 (Ice Lake 32 EU) | 1.2 kg | 14.8 mm | 13.40" | 1920x1200 | |
| 90.6 % v7 (old) | 02/2021 | Apple MacBook Pro 13 2019 2TB3 i5-8257U, Iris Plus Graphics 645 | 1.4 kg | 14.9 mm | 13.30" | 2560x1600 | |
| 87 % v7 (old) | 02/2020 | Acer Swift 3 SF313-52-71Y7 i7-1065G7, Iris Plus Graphics G7 (Ice Lake 64 EU) | 1.2 kg | 16.6 mm | 13.50" | 2256x1504 | |
| 90.3 % v6 (old) | 06/2019 | Lenovo ThinkPad X390-20Q1S02M00 i5-8265U, UHD Graphics 620 | 1.3 kg | 16.9 mm | 13.30" | 1920x1080 | |
| 88 % v6 (old) | 05/2019 | Dell XPS 13 9380 2019 i5-8265U, UHD Graphics 620 | 1.2 kg | 11.6 mm | 13.30" | 3840x2160 | |
| 86.3 % v7 (old) | 12/2019 | Dell XPS 13 7390 2-in-1 Core i7 i7-1065G7, Iris Plus Graphics G7 (Ice Lake 64 EU) | 1.3 kg | 13 mm | 13.40" | 1920x1200 |
| SD Card Reader | |
| average JPG Copy Test (av. of 3 runs) | |
| Dell XPS 13 9380 2019 (Toshiba Exceria Pro SDXC 64 GB UHS-II) | |
| Dell XPS 13 9300 i5 FHD (Toshiba Exceria Pro M501 64 GB UHS-II) | |
| Dell XPS 13 7390 2-in-1 Core i7 (Toshiba Exceria Pro M501 64 GB UHS-II) | |
| Lenovo ThinkPad X390-20Q1S02M00 (Toshiba Exceria Pro M501) | |
| Az osztály átlaga Subnotebook (23.7 - 188, n=9, az elmúlt 2 évben) | |
| maximum AS SSD Seq Read Test (1GB) | |
| Dell XPS 13 9300 i5 FHD (Toshiba Exceria Pro M501 64 GB UHS-II) | |
| Dell XPS 13 9380 2019 (Toshiba Exceria Pro SDXC 64 GB UHS-II) | |
| Dell XPS 13 7390 2-in-1 Core i7 (Toshiba Exceria Pro M501 64 GB UHS-II) | |
| Az osztály átlaga Subnotebook (24.9 - 195, n=8, az elmúlt 2 évben) | |
| Lenovo ThinkPad X390-20Q1S02M00 (Toshiba Exceria Pro M501) | |

| |||||||||||||||||||||||||
Fényerő megoszlás: 91 %
Centrumban: 528 cd/m²
Kontraszt: 1769:1 (Fekete: 0.35 cd/m²)
ΔE ColorChecker Calman: 3 | ∀{0.5-29.43 Ø4.72}
calibrated: 1
ΔE Greyscale Calman: 5.2 | ∀{0.09-98 Ø4.97}
99.3% sRGB (Argyll 1.6.3 3D)
66.9% AdobeRGB 1998 (Argyll 1.6.3 3D)
73.5% AdobeRGB 1998 (Argyll 3D)
99.4% sRGB (Argyll 3D)
71.5% Display P3 (Argyll 3D)
Gamma: 2.14
CCT: 6340 K
| Dell XPS 13 9300 i5 FHD SHP14CB, IPS, 1920x1200, 13.4" | Apple MacBook Pro 13 2019 2TB3 APPA03D, IPS, 2560x1600, 13.3" | Acer Swift 3 SF313-52-71Y7 BOE, NE135FBM-N41, IPS, 2256x1504, 13.5" | Lenovo ThinkPad X390-20Q1S02M00 LP133WF7-SPB1, IPS LED, 1920x1080, 13.3" | Dell XPS 13 9380 2019 ID: AUO 282B B133ZAN Dell: 90NTH, IPS, 3840x2160, 13.3" | Dell XPS 13 7390 2-in-1 Core i7 Sharp LQ134N1, IPS, 1920x1200, 13.4" | |
|---|---|---|---|---|---|---|
| Display | 17% | -2% | -7% | -9% | -2% | |
| Display P3 Coverage (%) | 71.5 | 96.1 34% | 70.1 -2% | 65.3 -9% | 64.7 -10% | 69.9 -2% |
| sRGB Coverage (%) | 99.4 | 99.4 0% | 99.8 0% | 95.9 -4% | 93.1 -6% | 99.2 0% |
| AdobeRGB 1998 Coverage (%) | 73.5 | 85.6 16% | 71.2 -3% | 66.6 -9% | 65.3 -11% | 71.5 -3% |
| Response Times | 5% | 8% | 1% | -3% | 17% | |
| Response Time Grey 50% / Grey 80% * (ms) | 60 ? | 50.4 ? 16% | 55 ? 8% | 57.6 ? 4% | 58 ? 3% | 47.6 ? 21% |
| Response Time Black / White * (ms) | 33.2 ? | 35.2 ? -6% | 31 ? 7% | 34 ? -2% | 36 ? -8% | 29.2 ? 12% |
| PWM Frequency (Hz) | 2500 ? | 116300 ? | 208 ? | 2500 ? | ||
| Screen | 18% | -13% | -1% | -22% | 3% | |
| Brightness middle (cd/m²) | 619 | 603 -3% | 474 -23% | 356 -42% | 404 -35% | 549.8 -11% |
| Brightness (cd/m²) | 591 | 577 -2% | 426 -28% | 336 -43% | 389 -34% | 520 -12% |
| Brightness Distribution (%) | 91 | 92 1% | 82 -10% | 88 -3% | 85 -7% | 86 -5% |
| Black Level * (cd/m²) | 0.35 | 0.35 -0% | 0.29 17% | 0.16 54% | 0.37 -6% | 0.39 -11% |
| Contrast (:1) | 1769 | 1723 -3% | 1634 -8% | 2225 26% | 1092 -38% | 1410 -20% |
| Colorchecker dE 2000 * | 3 | 1.7 43% | 2.38 21% | 3.6 -20% | 3.72 -24% | 2.12 29% |
| Colorchecker dE 2000 max. * | 8.2 | 3.1 62% | 5.88 28% | 5.5 33% | 7.38 10% | 3.66 55% |
| Colorchecker dE 2000 calibrated * | 1 | 0.7 30% | 2.69 -169% | 1.1 -10% | 2.06 -106% | 1.37 -37% |
| Greyscale dE 2000 * | 5.2 | 2.1 60% | 3.75 28% | 4.7 10% | 4.44 15% | 2.6 50% |
| Gamma | 2.14 103% | 2.18 101% | 2.37 93% | 2.48 89% | 2.34 94% | 2.3 96% |
| CCT | 6340 103% | 6843 95% | 6466 101% | 6374 102% | 7095 92% | 6884 94% |
| Color Space (Percent of AdobeRGB 1998) (%) | 66.9 | 76.7 15% | 65 -3% | 61.3 -8% | 60 -10% | 65.4 -2% |
| Color Space (Percent of sRGB) (%) | 99.3 | 99.4 0% | 100 1% | 95.7 -4% | 93 -6% | 99.7 0% |
| Teljes átlag (program / beállítások) | 13% /
16% | -2% /
-9% | -2% /
-2% | -11% /
-17% | 6% /
4% |
* ... a kisebb jobb
Megjelenítési válaszidők
| ↔ Válaszidő Fekete-fehér | ||
|---|---|---|
| 33.2 ms ... emelkedés és süllyedés ↘ kombinálva | ↗ 16.4 ms emelkedés | 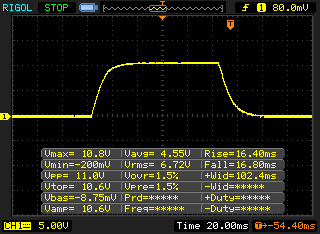 |
| ↘ 16.8 ms ősz | ||
| A képernyő lassú reakciósebességet mutat tesztjeinkben, és nem lesz kielégítő a játékosok számára. Összehasonlításképpen, az összes tesztelt eszköz 0.1 (minimum) és 240 (maximum) ms között mozog. » 90 % of all devices are better. Ez azt jelenti, hogy a mért válaszidő rosszabb, mint az összes vizsgált eszköz átlaga (19.8 ms). | ||
| ↔ Válaszidő 50% szürke és 80% szürke között | ||
| 60 ms ... emelkedés és süllyedés ↘ kombinálva | ↗ 28.4 ms emelkedés | 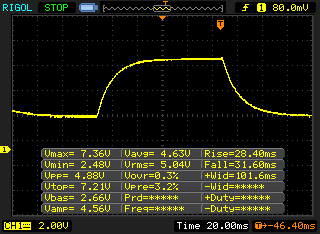 |
| ↘ 31.6 ms ősz | ||
| A képernyő lassú reakciósebességet mutat tesztjeinkben, és nem lesz kielégítő a játékosok számára. Összehasonlításképpen, az összes tesztelt eszköz 0.165 (minimum) és 636 (maximum) ms között mozog. » 96 % of all devices are better. Ez azt jelenti, hogy a mért válaszidő rosszabb, mint az összes vizsgált eszköz átlaga (31 ms). | ||
Képernyő villogása / PWM (impulzusszélesség-moduláció)
| Képernyő villogása / PWM észlelve | 2500 Hz | ≤ 20 % fényerő beállítása | 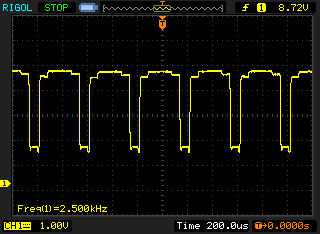 |
A kijelző háttérvilágítása 2500 Hz-en villog (a legrosszabb esetben, pl. PWM használatával) Villódzás észlelve a 20 % vagy annál kisebb fényerő-beállításnál. E fényerő-beállítás felett nem lehet villogás vagy PWM. A 2500 Hz frekvenciája meglehetősen magas, így a legtöbb PWM-re érzékeny felhasználó nem észlel semmilyen villogást. Összehasonlításképpen: az összes tesztelt eszköz 52 %-a nem használja a PWM-et a kijelző elsötétítésére. Ha PWM-et észleltek, akkor átlagosan 7753 (minimum: 5 - maximum: 343500) Hz-t mértek. | |||


| PCMark 8 Home Score Accelerated v2 | 3988 pontok | |
| PCMark 8 Creative Score Accelerated v2 | 5194 pontok | |
| PCMark 8 Work Score Accelerated v2 | 4832 pontok | |
| PCMark 10 Score | 4122 pontok | |
Segítség | ||

| 3DMark 11 Performance | 2875 pontok | |
| 3DMark Ice Storm Standard Score | 60637 pontok | |
| 3DMark Cloud Gate Standard Score | 11119 pontok | |
| 3DMark Fire Strike Score | 1673 pontok | |
| 3DMark Time Spy Score | 542 pontok | |
Segítség | ||
| alacsony | közepes | magas | ultra | |
|---|---|---|---|---|
| BioShock Infinite (2013) | 74.3 | 46.8 | 40.4 | 14.4 |
| The Witcher 3 (2015) | 35 | 21.6 | 11.5 | |
| Dota 2 Reborn (2015) | 83.4 | 49.7 | 26.2 | 24.2 |
| X-Plane 11.11 (2018) | 21.9 | 14.7 | 14.2 | |
| F1 2019 (2019) | 43 | 17 | 15 |
Zajszint
| Üresjárat |
| 29.3 / 29.3 / 29.3 dB(A) |
| Terhelés |
| 30 / 32.4 dB(A) |
 | ||
30 dB csendes 40 dB(A) hallható 50 dB(A) hangos |
||
min: | ||
| Dell XPS 13 9300 i5 FHD UHD Graphics G1 (Ice Lake 32 EU), i5-1035G1, Toshiba XG6 KXG60ZNV512G | Apple MacBook Pro 13 2019 2TB3 Iris Plus Graphics 645, i5-8257U, Apple SSD AP0256 | Acer Swift 3 SF313-52-71Y7 Iris Plus Graphics G7 (Ice Lake 64 EU), i7-1065G7, Intel SSD 660p 1TB SSDPEKNW010T8 | Lenovo ThinkPad X390-20Q1S02M00 UHD Graphics 620, i5-8265U, Intel SSD Pro 7600p SSDPEKKF512G8L | Dell XPS 13 9380 2019 UHD Graphics 620, i5-8265U, SK hynix PC401 HFS256GD9TNG | Dell XPS 13 7390 2-in-1 Core i7 Iris Plus Graphics G7 (Ice Lake 64 EU), i7-1065G7, Toshiba BG4 KBG40ZPZ512G | |
|---|---|---|---|---|---|---|
| Noise | -5% | -3% | -4% | -7% | -4% | |
| off / környezet * (dB) | 29.3 | 29.5 -1% | 30.3 -3% | 29.2 -0% | 30.4 -4% | 28.1 4% |
| Idle Minimum * (dB) | 29.3 | 29.5 -1% | 30.3 -3% | 29.2 -0% | 30.4 -4% | 28.1 4% |
| Idle Average * (dB) | 29.3 | 29.5 -1% | 30.3 -3% | 29.2 -0% | 30.4 -4% | 28.1 4% |
| Idle Maximum * (dB) | 29.3 | 29.5 -1% | 30.3 -3% | 29.2 -0% | 30.4 -4% | 28.1 4% |
| Load Average * (dB) | 30 | 31.1 -4% | 31.7 -6% | 34.8 -16% | 31.7 -6% | 31.7 -6% |
| Load Maximum * (dB) | 32.4 | 39.3 -21% | 32.7 -1% | 34.8 -7% | 38.1 -18% | 43.4 -34% |
| Witcher 3 ultra * (dB) | 43.4 |
* ... a kisebb jobb
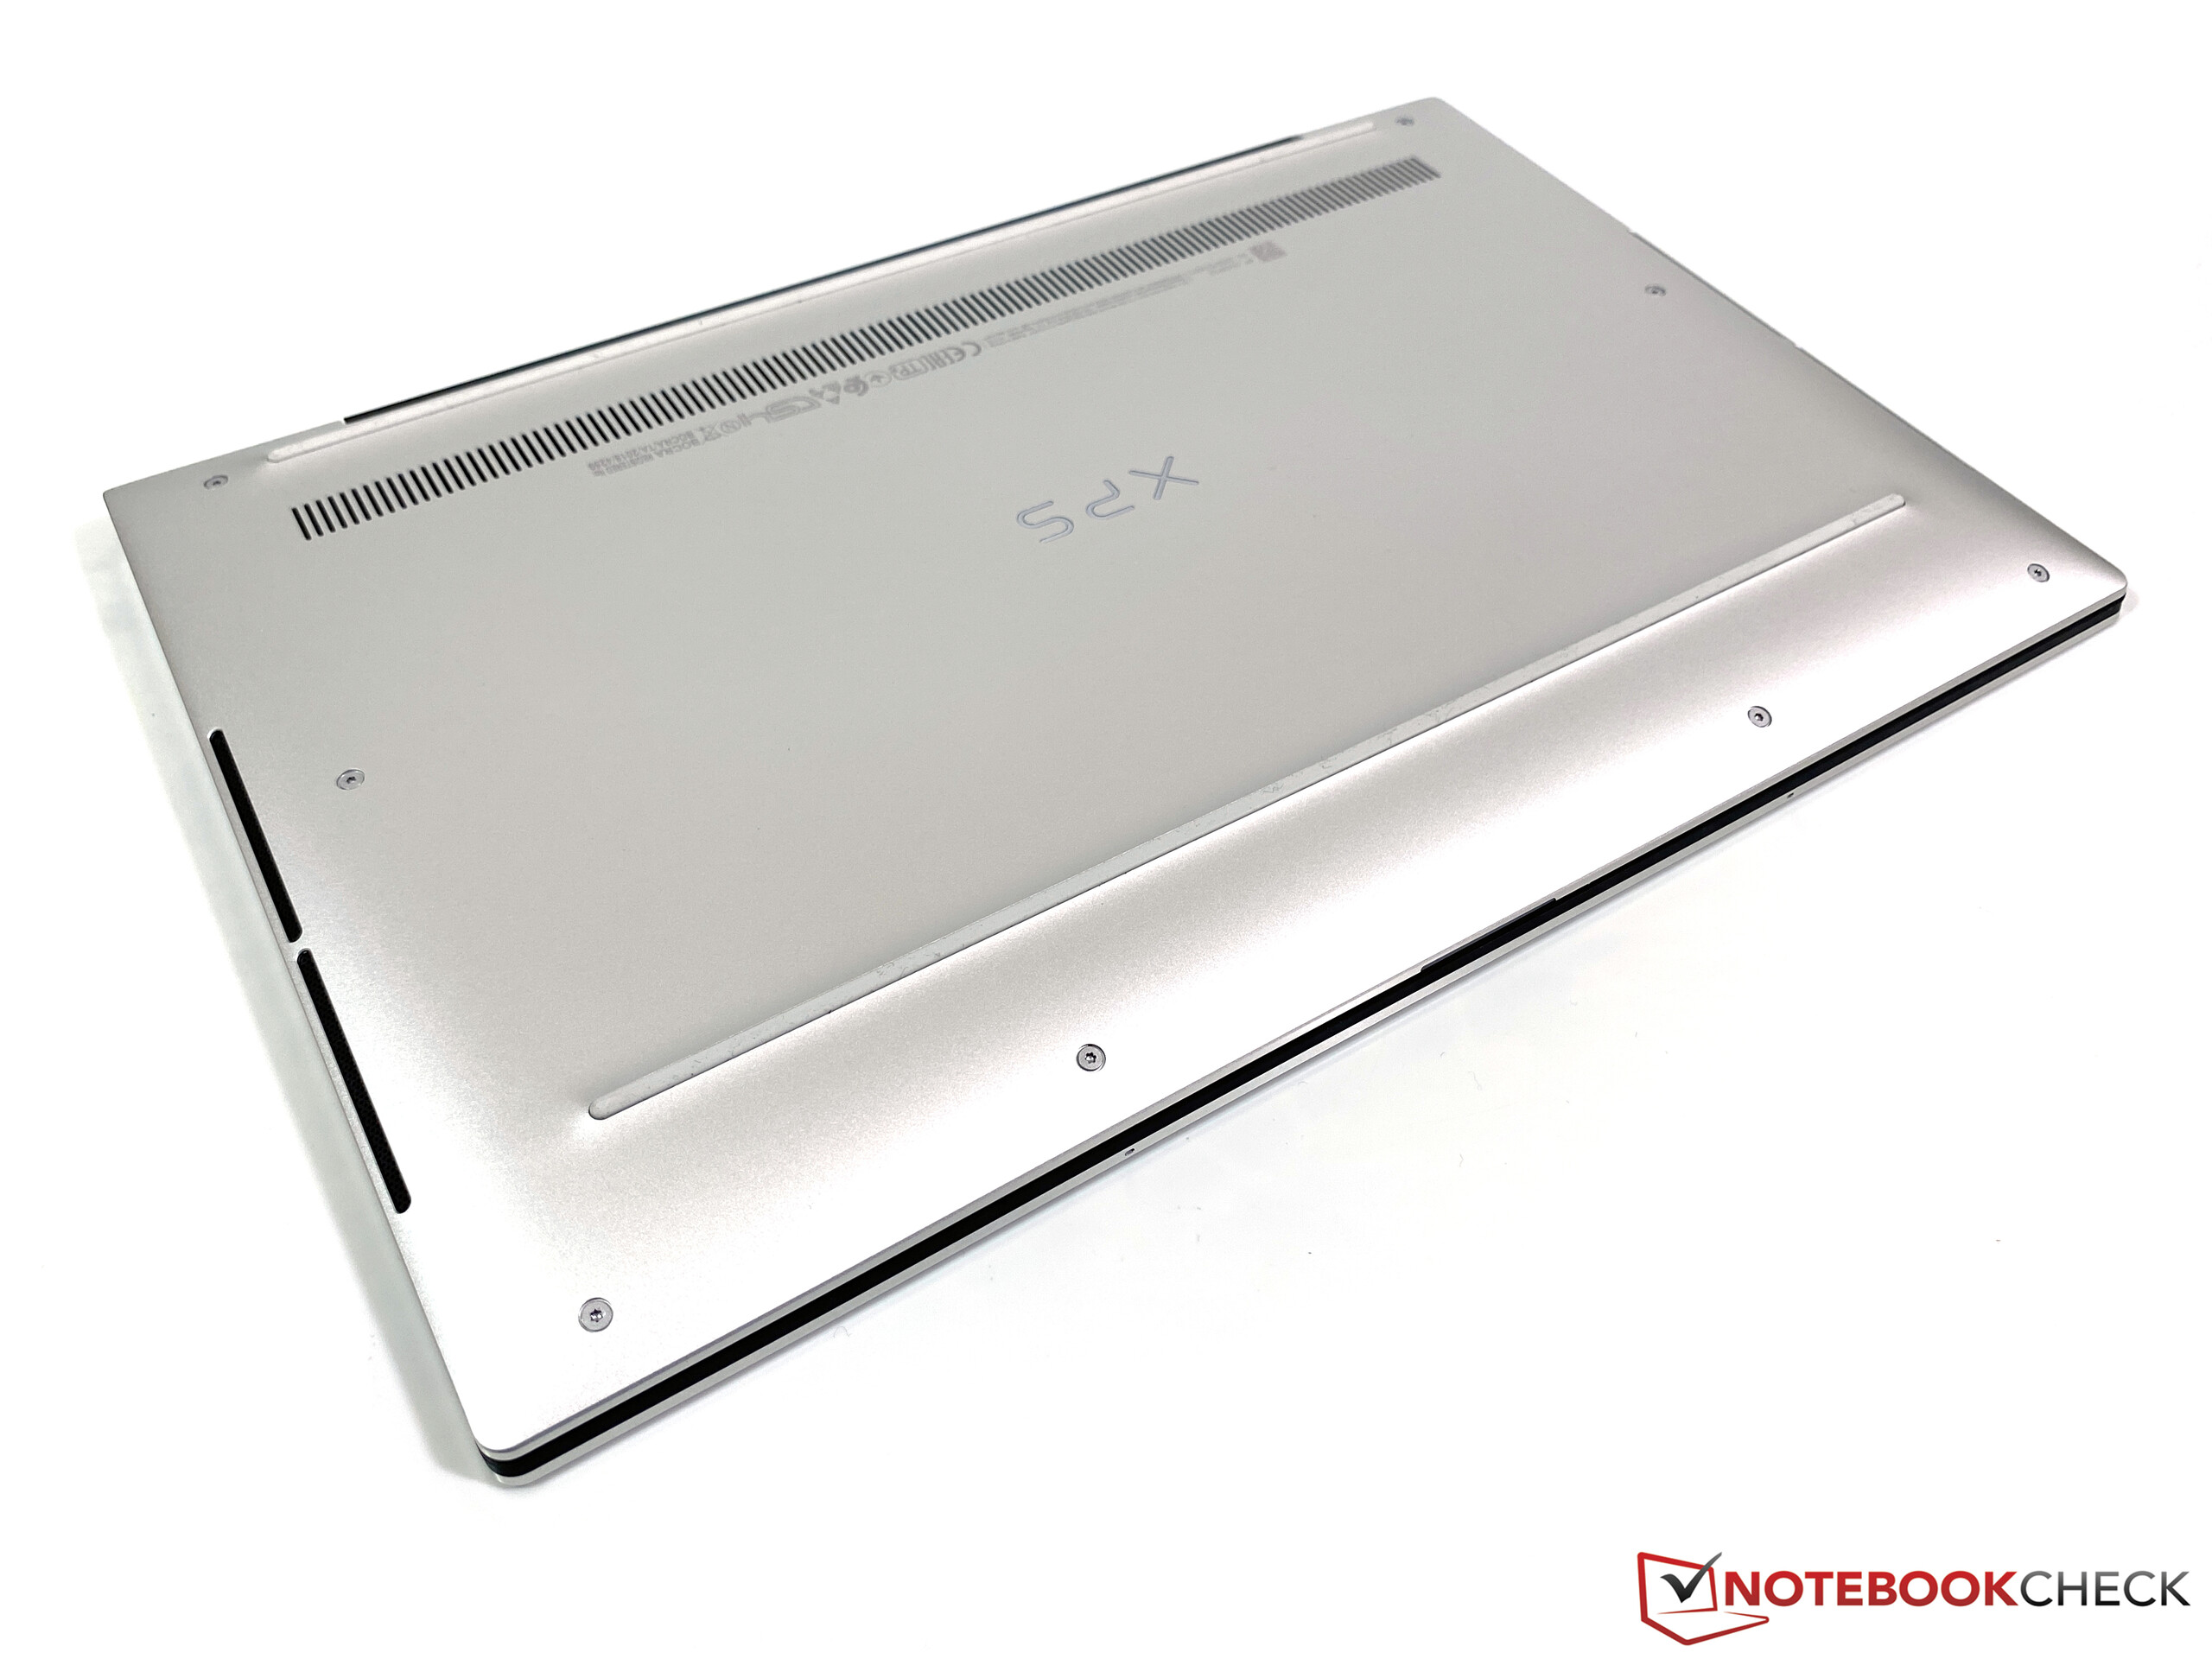
(-) A felső oldalon a maximális hőmérséklet 50.8 °C / 123 F, összehasonlítva a 35.9 °C / 97 F átlagával , 21.4 és 59 °C között a Subnotebook osztálynál.
(±) Az alsó maximum 42.2 °C / 108 F-ig melegszik fel, összehasonlítva a 39.2 °C / 103 F átlagával
(+) Üresjáratban a felső oldal átlagos hőmérséklete 23.6 °C / 74 F, összehasonlítva a 30.8 °C / ### eszközátlaggal class_avg_f### F.
(+) A csuklótámasz és az érintőpad hűvösebb, mint a bőr hőmérséklete, maximum 30.1 °C / 86.2 F, ezért hűvös tapintású.
(±) A hasonló eszközök csuklótámasz területének átlagos hőmérséklete 28.2 °C / 82.8 F volt (-1.9 °C / -3.4 F).
Dell XPS 13 9300 i5 FHD hangelemzés
(±) | a hangszóró hangereje átlagos, de jó (78.4 dB)
Basszus 100 - 315 Hz
(±) | csökkentett basszus – átlagosan 9.4%-kal alacsonyabb, mint a medián
(±) | a basszus linearitása átlagos (12.5% delta az előző frekvenciához)
Közepes 400-2000 Hz
(±) | magasabb középértékek – átlagosan 6.7%-kal magasabb, mint a medián
(+) | a középpontok lineárisak (5.6% delta az előző frekvenciához)
Maximum 2-16 kHz
(+) | kiegyensúlyozott csúcsok – csak 4% választja el a mediántól
(+) | a csúcsok lineárisak (5% delta az előző frekvenciához képest)
Összességében 100 - 16.000 Hz
(±) | az általános hang linearitása átlagos (19.8% eltérés a mediánhoz képest)
Ugyanazon osztályhoz képest
» 63%Ebben az osztályban az összes tesztelt eszköz %-a jobb volt, 7% hasonló, 31%-kal rosszabb
» A legjobb delta értéke 5%, az átlag 18%, a legrosszabb 53% volt
Az összes tesztelt eszközzel összehasonlítva
» 50% az összes tesztelt eszköz jobb volt, 7% hasonló, 42%-kal rosszabb
» A legjobb delta értéke 4%, az átlag 23%, a legrosszabb 134% volt
Apple MacBook Pro 13 2019 2TB3 hangelemzés
(±) | a hangszóró hangereje átlagos, de jó (79.1 dB)
Basszus 100 - 315 Hz
(±) | csökkentett basszus – átlagosan 10.7%-kal alacsonyabb, mint a medián
(±) | a basszus linearitása átlagos (8.7% delta az előző frekvenciához)
Közepes 400-2000 Hz
(+) | kiegyensúlyozott középpontok – csak 4.6% választja el a mediántól
(+) | a középpontok lineárisak (3.8% delta az előző frekvenciához)
Maximum 2-16 kHz
(+) | kiegyensúlyozott csúcsok – csak 2.3% választja el a mediántól
(+) | a csúcsok lineárisak (4.7% delta az előző frekvenciához képest)
Összességében 100 - 16.000 Hz
(±) | az általános hang linearitása átlagos (15.6% eltérés a mediánhoz képest)
Ugyanazon osztályhoz képest
» 36%Ebben az osztályban az összes tesztelt eszköz %-a jobb volt, 5% hasonló, 59%-kal rosszabb
» A legjobb delta értéke 5%, az átlag 18%, a legrosszabb 53% volt
Az összes tesztelt eszközzel összehasonlítva
» 23% az összes tesztelt eszköz jobb volt, 5% hasonló, 72%-kal rosszabb
» A legjobb delta értéke 4%, az átlag 23%, a legrosszabb 134% volt
| Kikapcsolt állapot / Készenlét | |
| Üresjárat | |
| Terhelés |
|
Kulcs:
min: | |
| Dell XPS 13 9300 i5 FHD i5-1035G1, UHD Graphics G1 (Ice Lake 32 EU), Toshiba XG6 KXG60ZNV512G, IPS, 1920x1200, 13.4" | Apple MacBook Pro 13 2019 2TB3 i5-8257U, Iris Plus Graphics 645, Apple SSD AP0256, IPS, 2560x1600, 13.3" | Acer Swift 3 SF313-52-71Y7 i7-1065G7, Iris Plus Graphics G7 (Ice Lake 64 EU), Intel SSD 660p 1TB SSDPEKNW010T8, IPS, 2256x1504, 13.5" | Lenovo ThinkPad X390-20Q1S02M00 i5-8265U, UHD Graphics 620, Intel SSD Pro 7600p SSDPEKKF512G8L, IPS LED, 1920x1080, 13.3" | Dell XPS 13 9380 2019 i5-8265U, UHD Graphics 620, SK hynix PC401 HFS256GD9TNG, IPS, 3840x2160, 13.3" | Dell XPS 13 7390 2-in-1 Core i7 i7-1065G7, Iris Plus Graphics G7 (Ice Lake 64 EU), Toshiba BG4 KBG40ZPZ512G, IPS, 1920x1200, 13.4" | Átlagos Intel UHD Graphics G1 (Ice Lake 32 EU) | Az osztály átlaga Subnotebook | |
|---|---|---|---|---|---|---|---|---|
| Power Consumption | 0% | 36% | -6% | -18% | 10% | 1% | -9% | |
| Idle Minimum * (Watt) | 3.4 | 2.1 38% | 1.8 47% | 3.4 -0% | 4.8 -41% | 2.6 24% | 4.13 ? -21% | 3.78 ? -11% |
| Idle Average * (Watt) | 6 | 6.9 -15% | 4.6 23% | 5.6 7% | 8.6 -43% | 5.3 12% | 7.07 ? -18% | 6.57 ? -10% |
| Idle Maximum * (Watt) | 10.2 | 7.8 24% | 6.1 40% | 8.7 15% | 10.4 -2% | 7 31% | 8.36 ? 18% | 7.94 ? 22% |
| Load Average * (Watt) | 36.6 | 42 -15% | 27.4 25% | 43.6 -19% | 37.9 -4% | 43.1 -18% | 30.6 ? 16% | 41.9 ? -14% |
| Load Maximum * (Watt) | 49.3 | 64.5 -31% | 27 45% | 65 -32% | 48.5 2% | 49 1% | 45.6 ? 8% | 64.4 ? -31% |
| Witcher 3 ultra * (Watt) | 43.1 |
* ... a kisebb jobb
| Dell XPS 13 9300 i5 FHD i5-1035G1, UHD Graphics G1 (Ice Lake 32 EU), 52 Wh | Apple MacBook Pro 13 2019 2TB3 i5-8257U, Iris Plus Graphics 645, 58.2 Wh | Acer Swift 3 SF313-52-71Y7 i7-1065G7, Iris Plus Graphics G7 (Ice Lake 64 EU), 54.5 Wh | Lenovo ThinkPad X390-20Q1S02M00 i5-8265U, UHD Graphics 620, 48 Wh | Dell XPS 13 9380 2019 i5-8265U, UHD Graphics 620, 52 Wh | Dell XPS 13 7390 2-in-1 Core i7 i7-1065G7, Iris Plus Graphics G7 (Ice Lake 64 EU), 51 Wh | Az osztály átlaga Subnotebook | |
|---|---|---|---|---|---|---|---|
| Akkumulátor üzemidő | 11% | -24% | -31% | -29% | -23% | -5% | |
| H.264 (h) | 14.4 | 10.5 -27% | 12.7 -12% | 15.4 ? 7% | |||
| WiFi v1.3 (h) | 11.7 | 13 11% | 10.3 -12% | 8.3 -29% | 8.3 -29% | 9 -23% | 14 ? 20% |
| Load (h) | 3.4 | 2.3 -32% | 1.6 -53% | 2.4 -29% | 1.969 ? -42% | ||
| Reader / Idle (h) | 21.4 | 17.2 | 28.6 ? |
Pro
Kontra
Verdict – XPS 13 9300 is overall better than before, but also more expensive
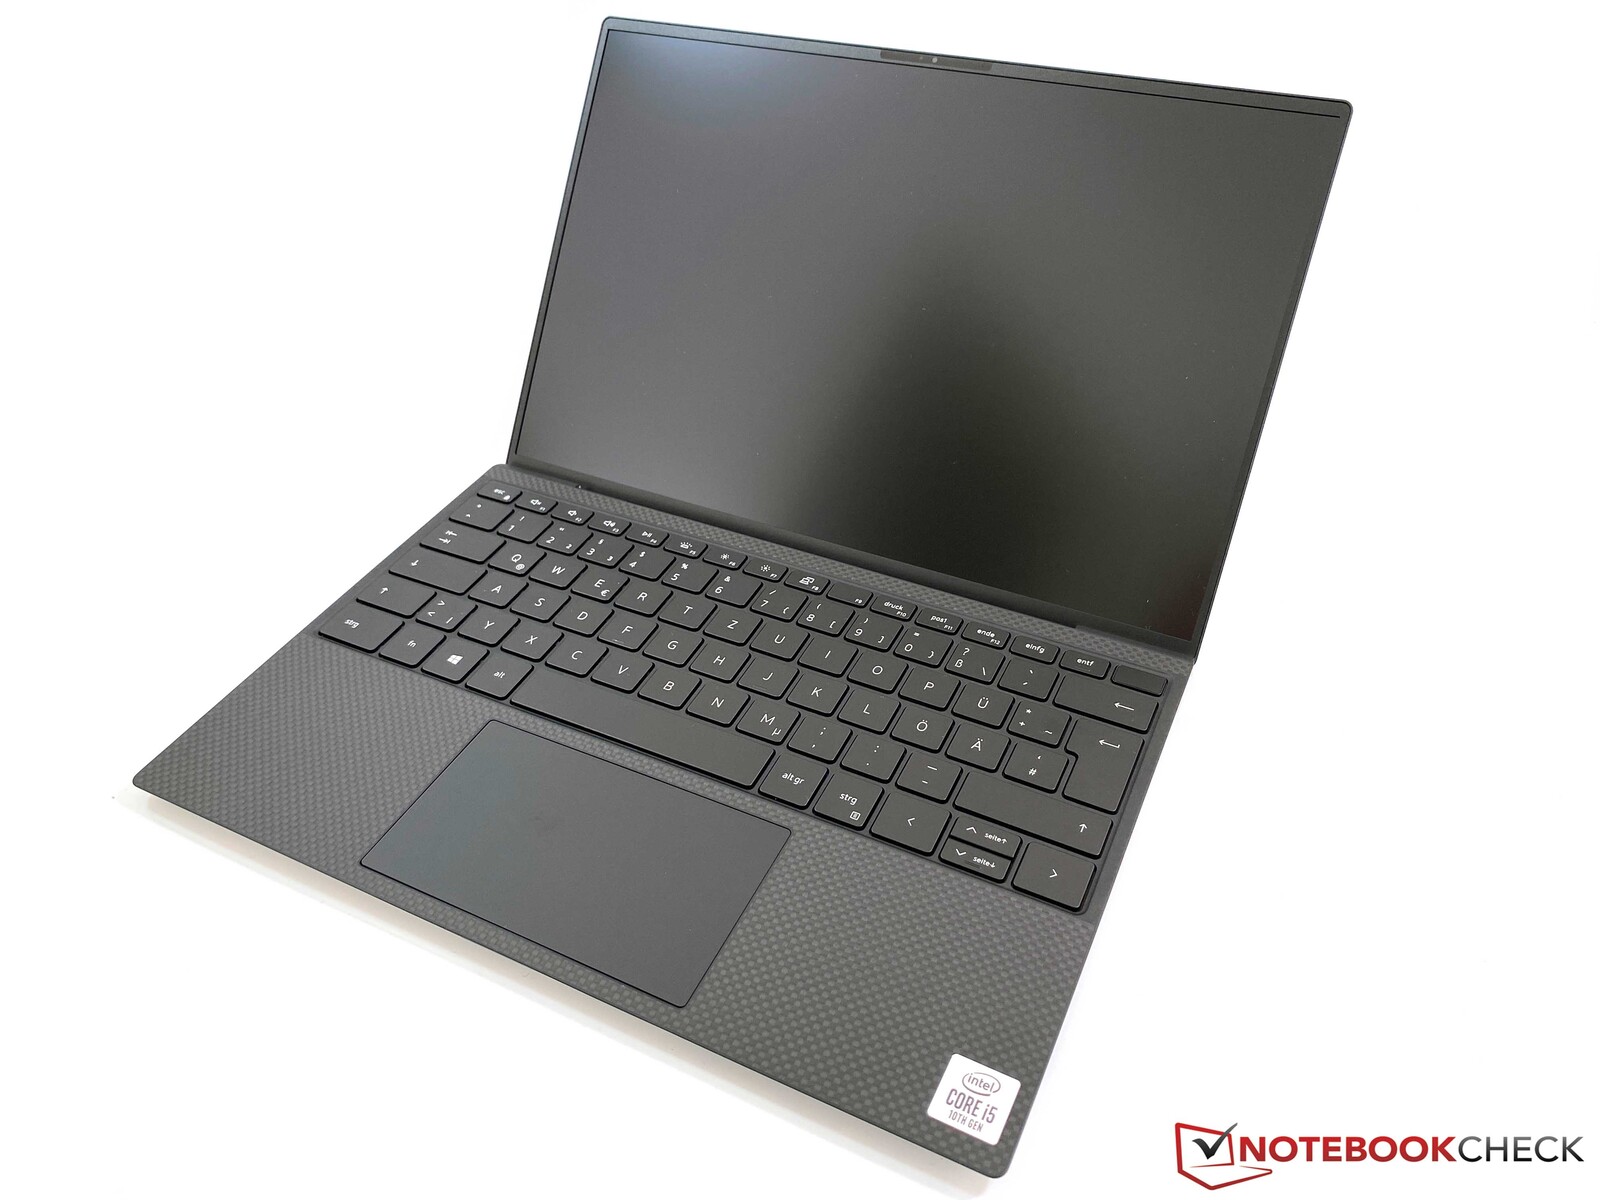
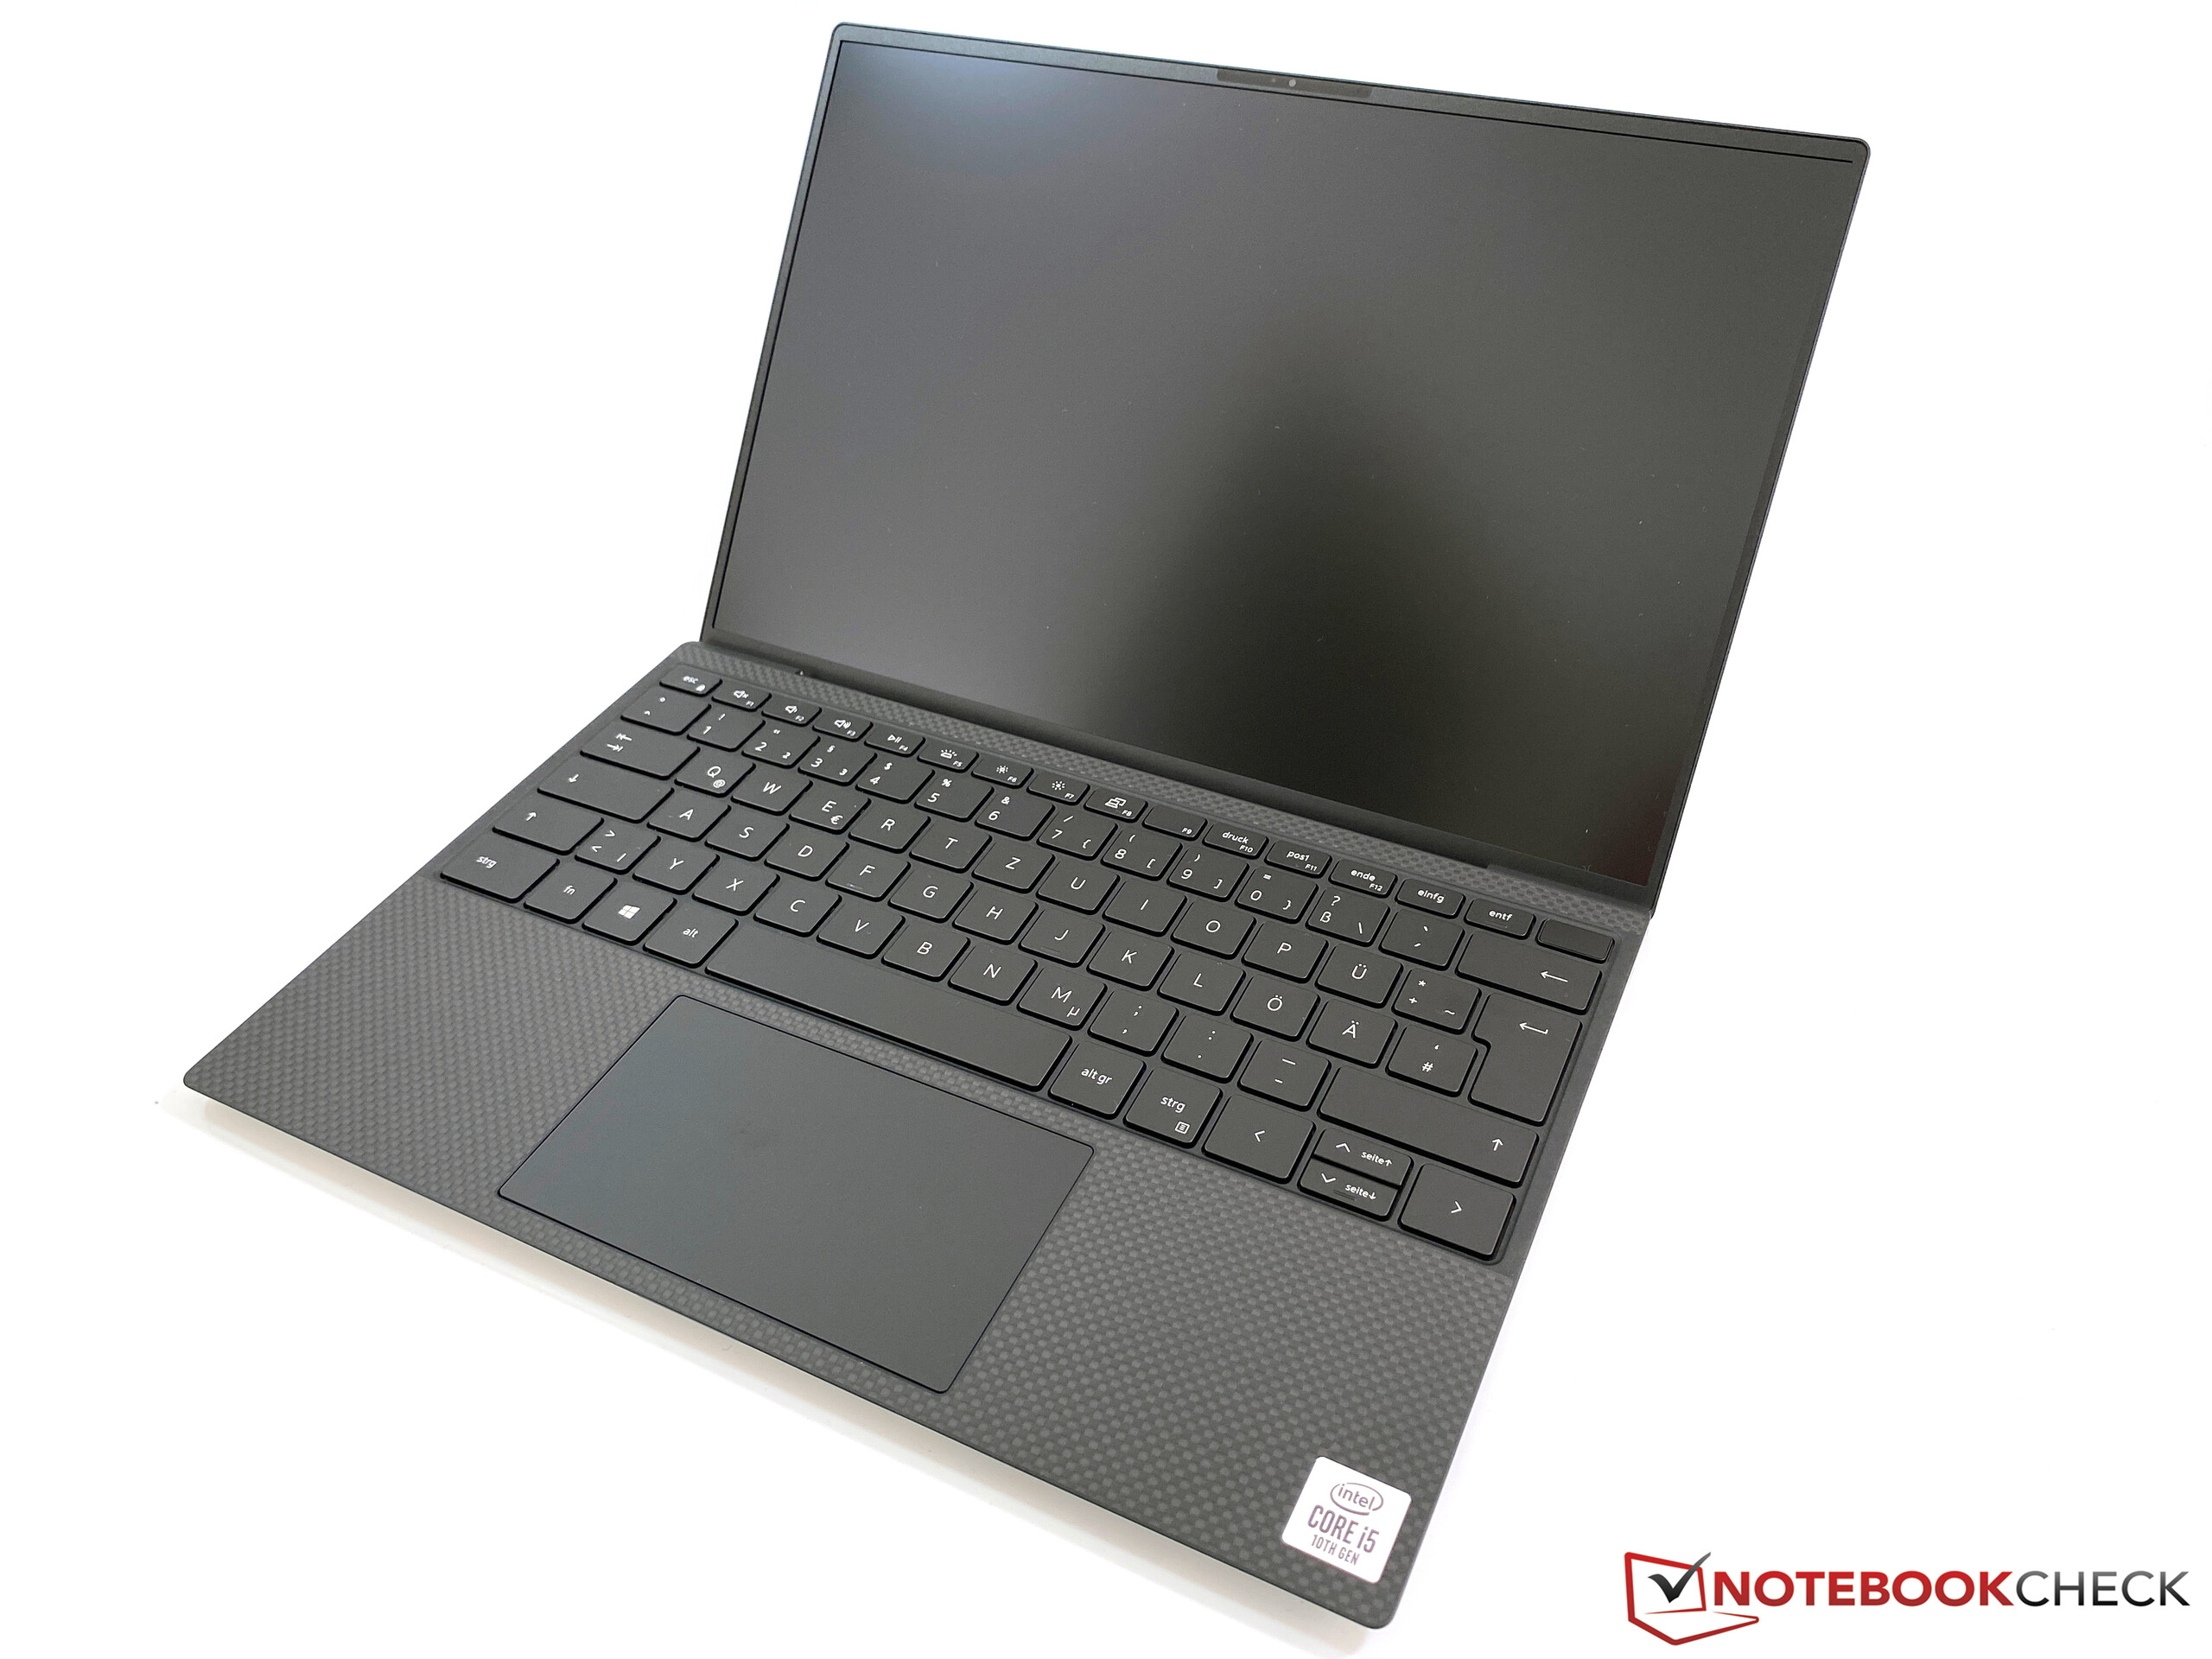
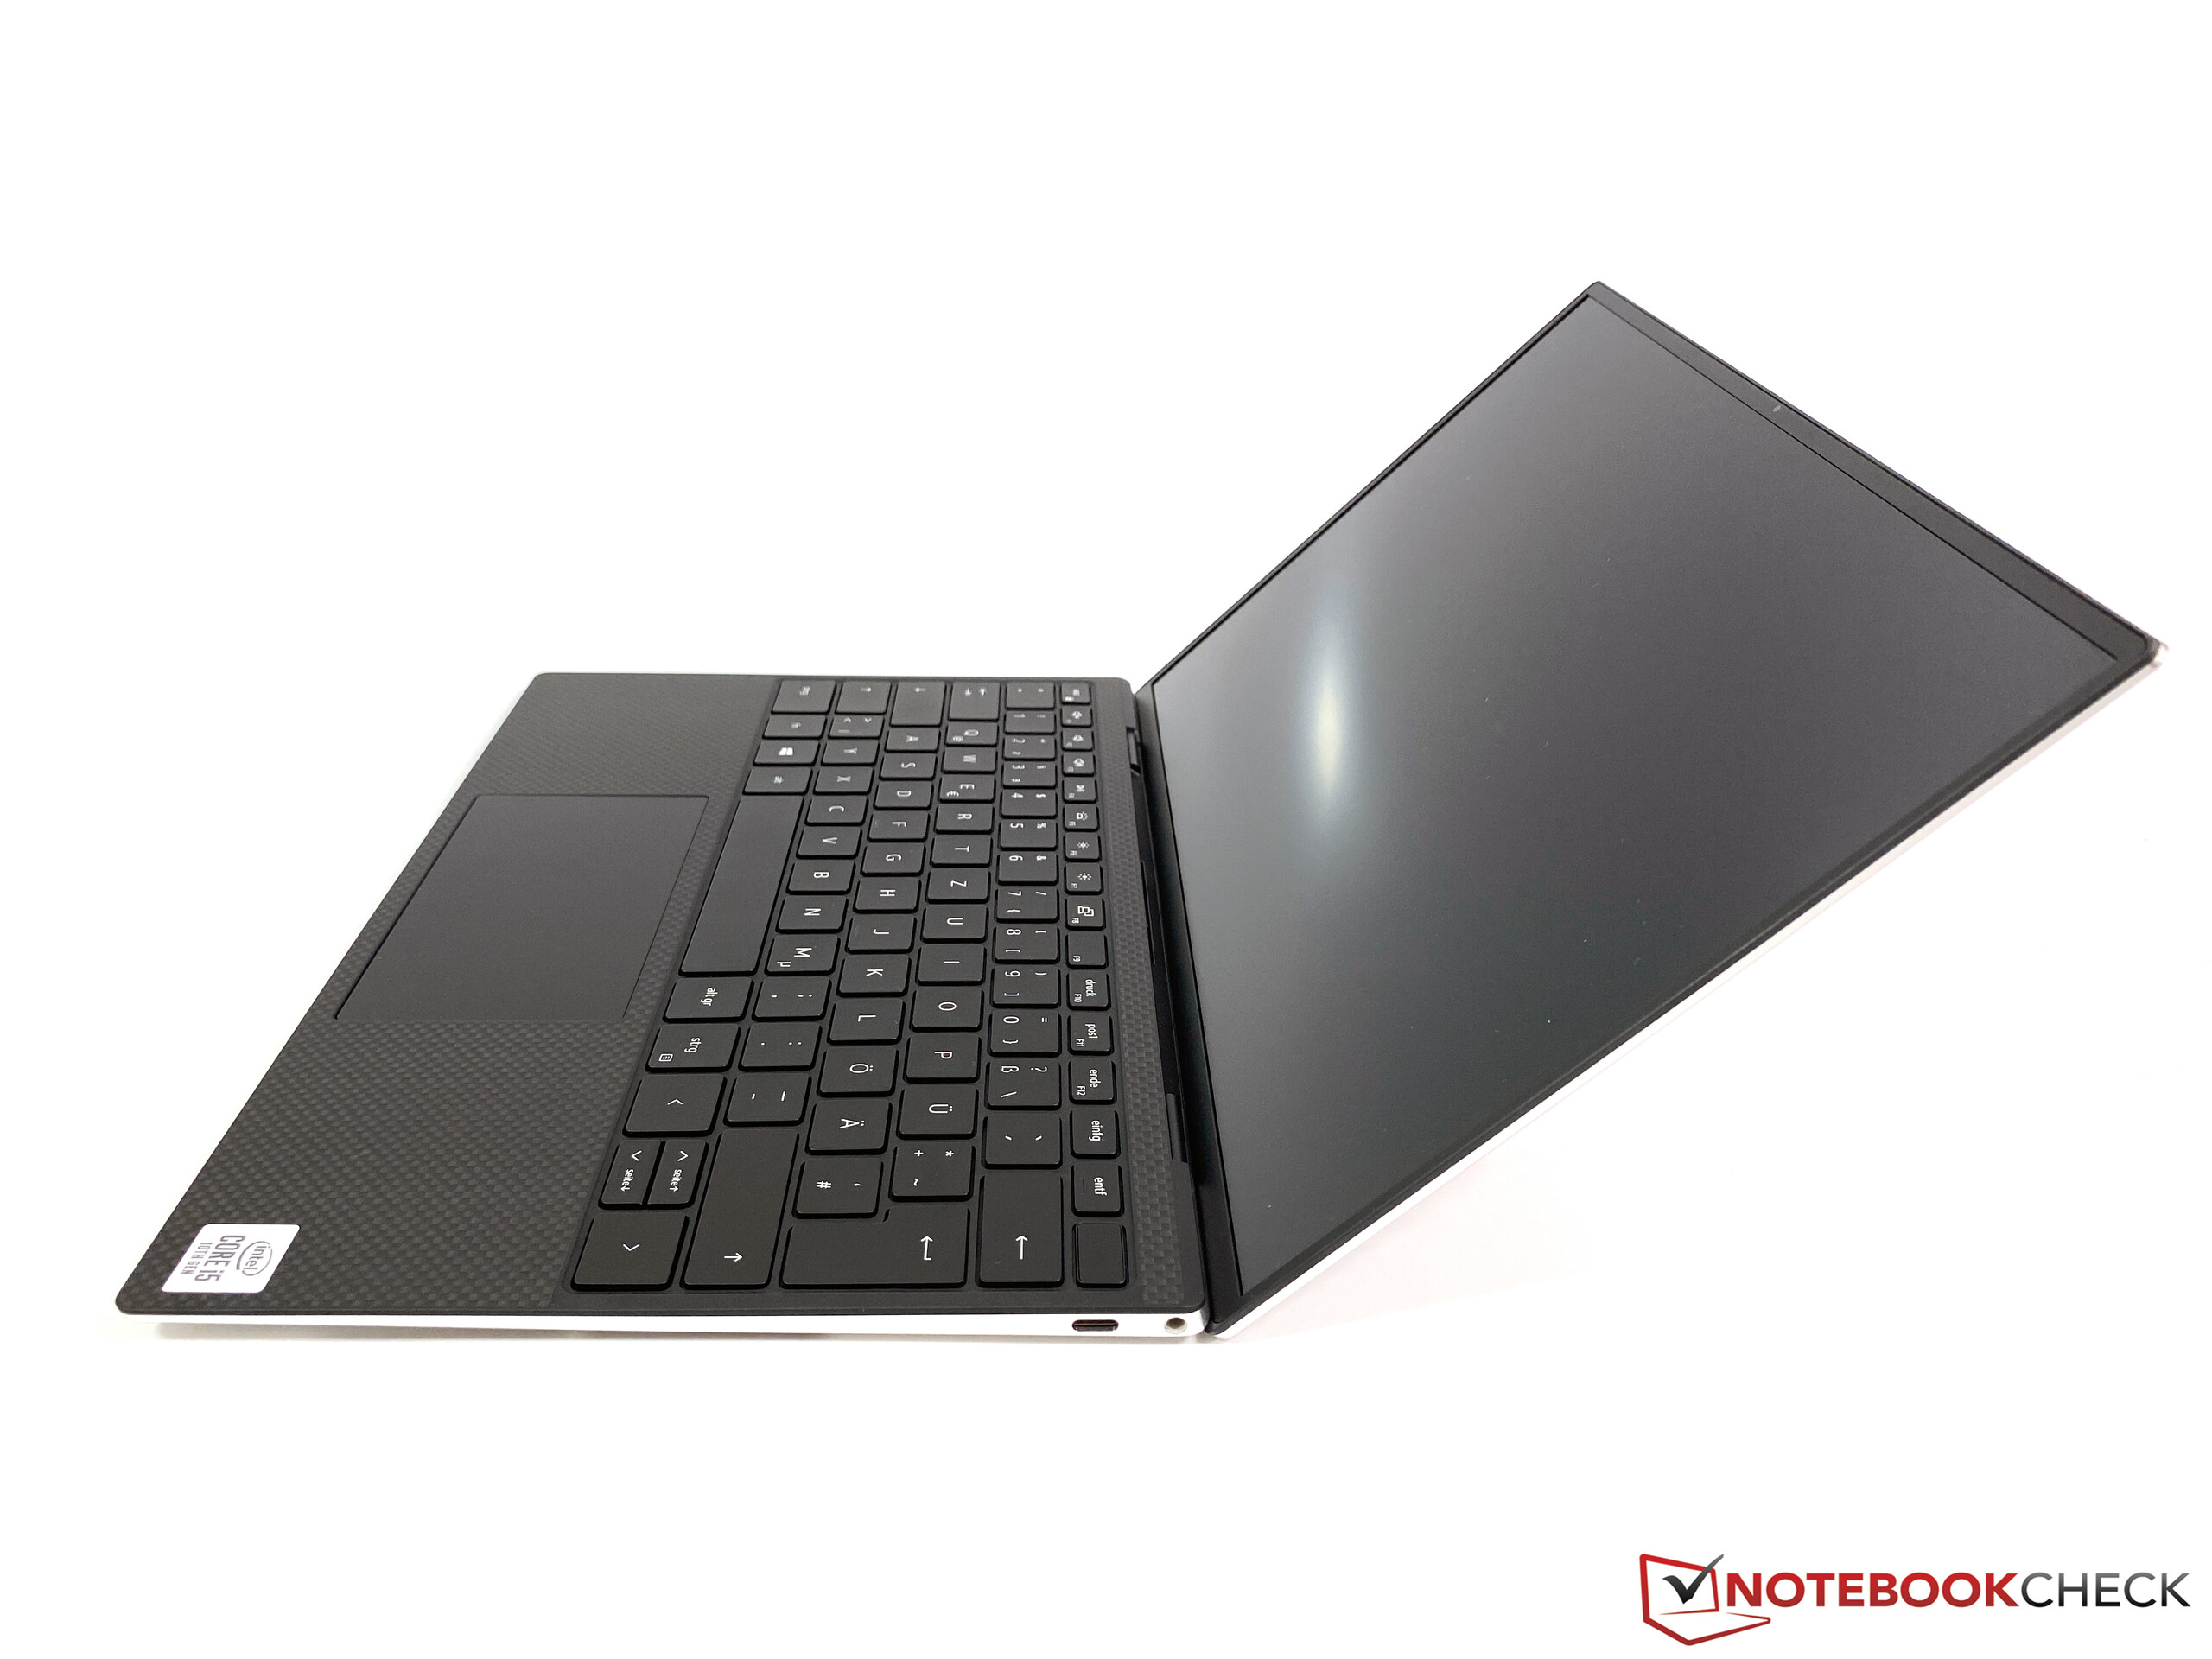
Összességében, az új XPS 13 9300 nagyon jó benyomást keltett a tesztünkben. A ház jól megépített, egyszerre rendkívül kompakt és szilárd. A matt 16:10-es kijelző meggyőző, kivéve a lassú válaszidőt, de ajánljuk a kalibrálását. A két hangszóró szintén abszolút elegendő.
A teljesítmény egy kétélű kard, mivel a CPU teljesítménye kisebb az elődjéhez képest. Ez minden bizonnyal nem egy ideális fejlemény, de őszintén szólva a Core i5 teljesítménye sok felhasználónak még így is több mint elegendő, főleg a gyors SSD-vel kombinálva. Az iGPU teljesítménye szintén javult, ezért néhány játék is futtatható vele. Ezzel az opcionális Core i7-hez érkezünk egy még gyorsabb iGPU-val. Nyers CPU-teljesítményben nem valószínű, hogy előnyben van, de az iGPU egy jelentős frissítés, és érdemes ránézni.
Az új Dell XPS 13 9300 nagyon jó utódja a népszerű subnotebooknak. Nem találtunk semmilyen negatívumot a tesztünk során, de az új modell nem egy jó alku az 1500 eurós belépőszintű árával.
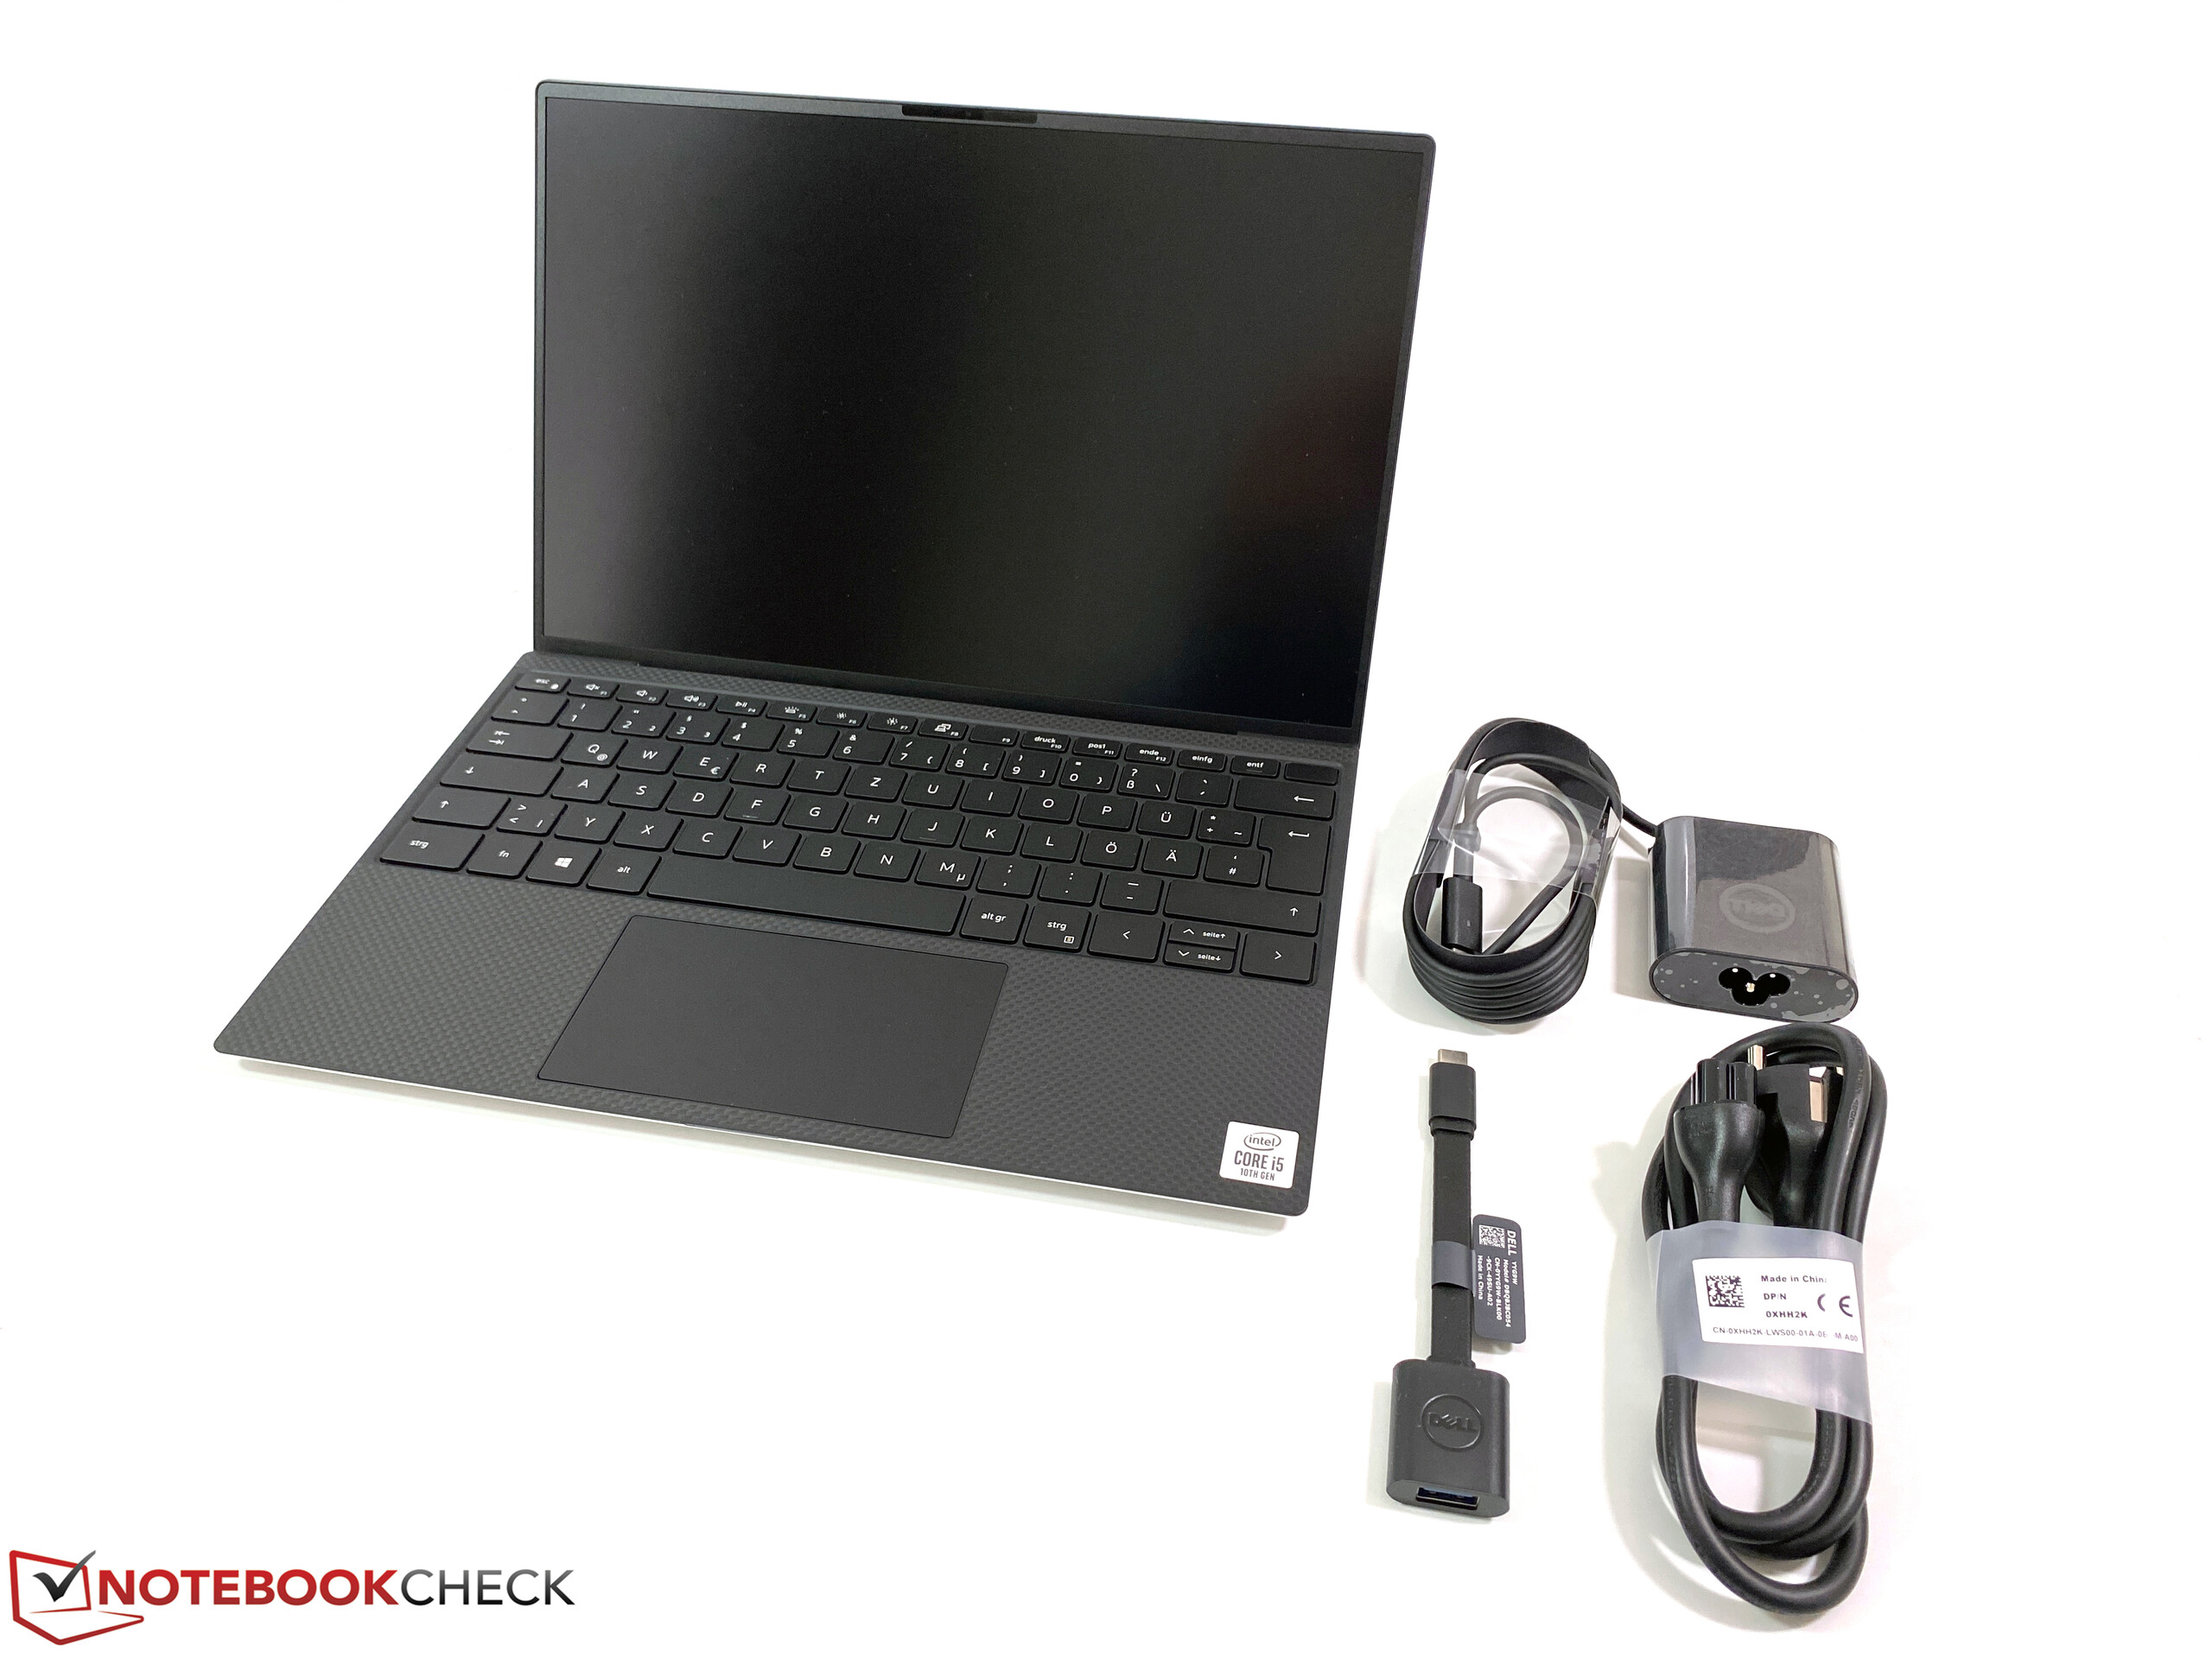
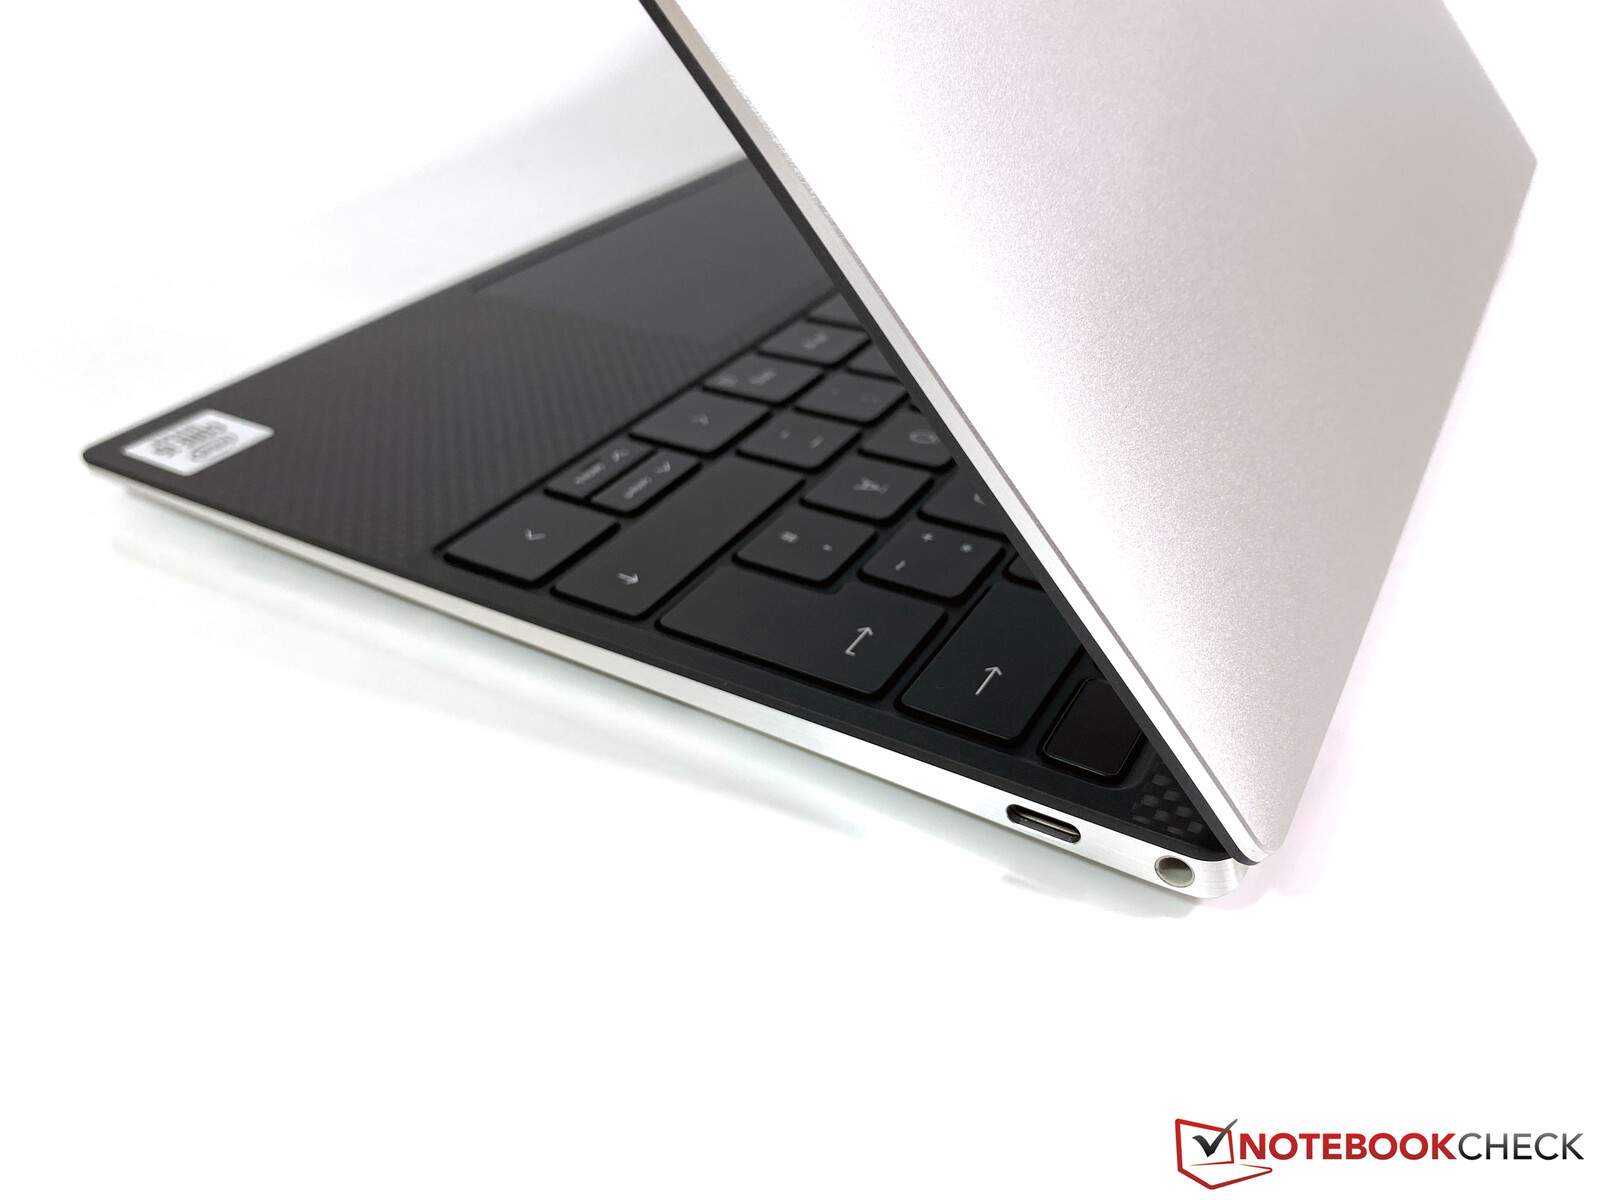
A 16:10-es kijelző visszatérése értékelendő, és a gyors kártyaolvasó is tetszik, viszont szívesen láttunk volna még egy USB portot. A gyorsabb Core i7-tel és UHD panellel felszerelt XPS 13 9300-at nemsokára szintén értékelni fogjuk.
Dell XPS 13 9300 i5 FHD
- 03/19/2020 v7 (old)
Andreas Osthoff
Price comparison

