Lenovo IdeaPad S740-15IRH Laptop rövid értékelés: Az Eddigi legjobb és legdrágább IdeaPad
Értékelés | Dátum | Modell | Súly | Magasság | Méret | Felbontás | Legjobb ár |
|---|---|---|---|---|---|---|---|
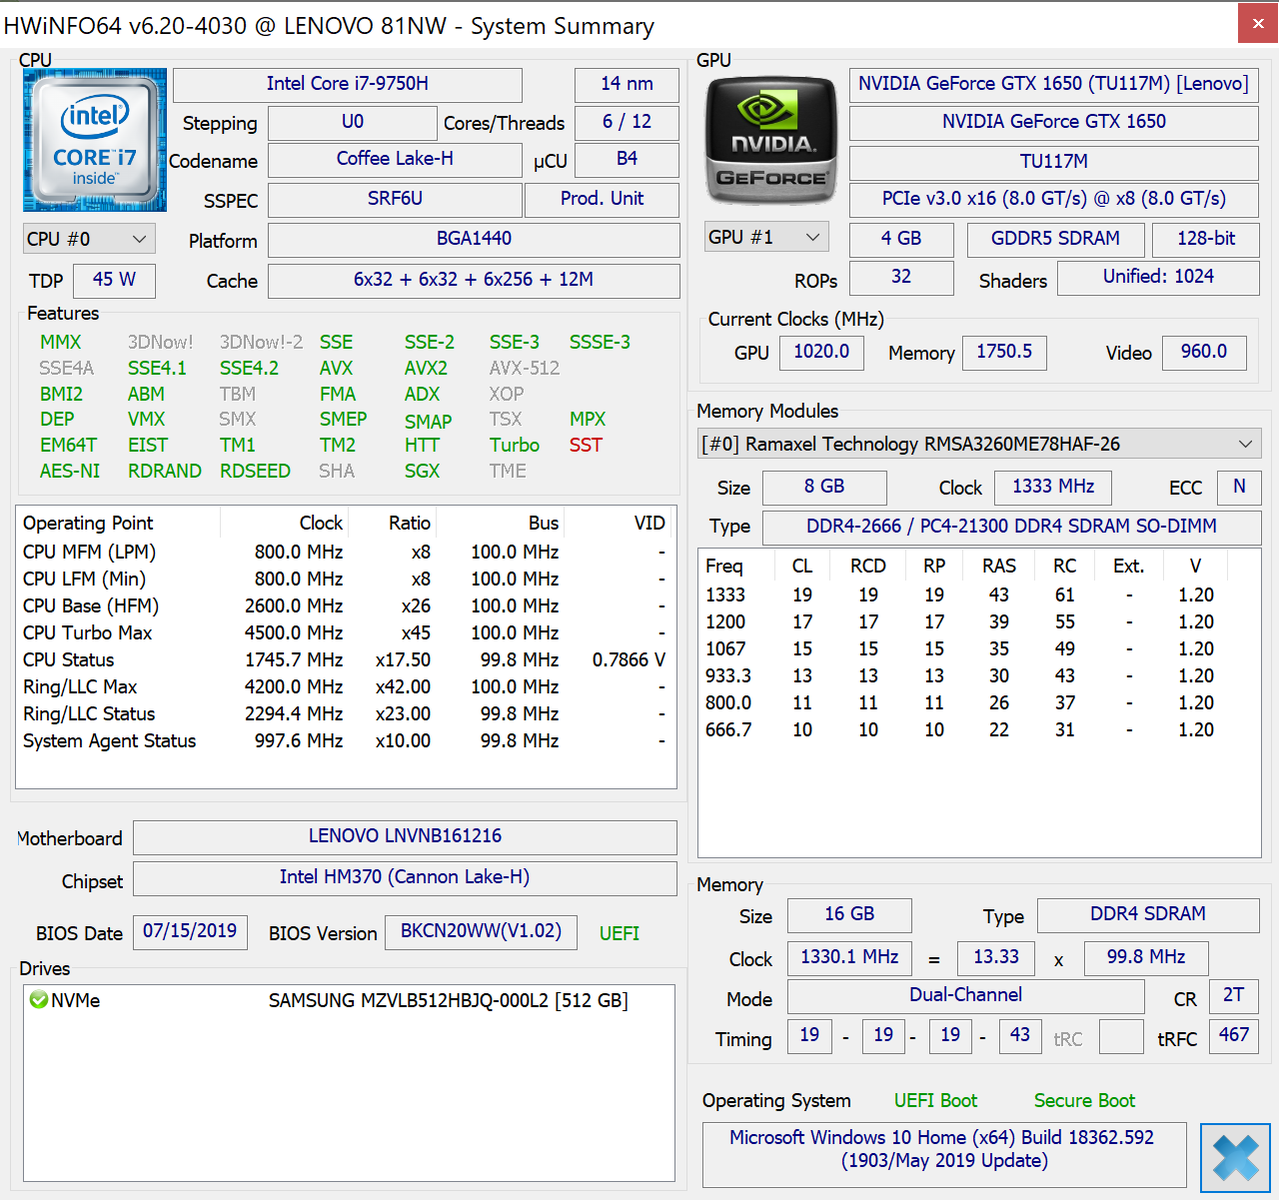
| 85.5 % v7 (old) | 04/2020 | Lenovo IdeaPad S740-15IRH i7-9750H, GeForce GTX 1650 Max-Q | 1.9 kg | 19.95 mm | 15.60" | 3840x2160 | |
| 87.8 % v7 (old) | 09/2019 | Dell XPS 15 7590 9980HK GTX 1650 i9-9980HK, GeForce GTX 1650 Mobile | 2 kg | 17 mm | 15.60" | 3840x2160 | |
| 85 % v7 (old) | HP Spectre X360 15-5ZV31AV i7-10510U, GeForce MX250 | 2.1 kg | 19.3 mm | 15.60" | 3840x2160 | ||
| 82.7 % v6 (old) | 08/2018 | Lenovo Yoga 730-15IKB i5-8550U, GeForce GTX 1050 Mobile | 1.9 kg | 17.2 mm | 15.60" | 3840x2160 | |
| 83.1 % v7 (old) | 12/2019 | Asus ZenBook 15 UX534FT-DB77 i7-8565U, GeForce GTX 1650 Max-Q | 1.7 kg | 18.9 mm | 15.60" | 1920x1080 |
| SD Card Reader | |
| average JPG Copy Test (av. of 3 runs) | |
| Dell XPS 15 7590 9980HK GTX 1650 (Toshiba Exceria Pro SDXC 64 GB UHS-II) | |
| HP Spectre X360 15-5ZV31AV (Toshiba Exceria Pro M501 UHS-II) | |
| MSI Prestige 15 A10SC (Toshiba Exceria Pro M501 UHS-II) | |
| Lenovo IdeaPad S740-15IRH (Toshiba Exceria Pro M501 UHS-II) | |
| Asus ZenBook 15 UX534FT-DB77 (Toshiba Exceria Pro SDXC 64 GB UHS-II) | |
| maximum AS SSD Seq Read Test (1GB) | |
| MSI Prestige 15 A10SC (Toshiba Exceria Pro M501 UHS-II) | |
| Dell XPS 15 7590 9980HK GTX 1650 (Toshiba Exceria Pro SDXC 64 GB UHS-II) | |
| HP Spectre X360 15-5ZV31AV (Toshiba Exceria Pro M501 UHS-II) | |
| Lenovo IdeaPad S740-15IRH (Toshiba Exceria Pro M501 UHS-II) | |
| Asus ZenBook 15 UX534FT-DB77 (Toshiba Exceria Pro SDXC 64 GB UHS-II) | |
| Networking | |
| iperf3 transmit AX12 | |
| MSI Prestige 15 A10SC | |
| Lenovo Yoga 730-15IKB | |
| iperf3 receive AX12 | |
| MSI Prestige 15 A10SC | |
| Lenovo Yoga 730-15IKB | |
| |||||||||||||||||||||||||
Fényerő megoszlás: 83 %
Centrumban: 475.8 cd/m²
Kontraszt: 1220:1 (Fekete: 0.39 cd/m²)
ΔE ColorChecker Calman: 2.36 | ∀{0.5-29.43 Ø4.72}
calibrated: 1.62
ΔE Greyscale Calman: 3.8 | ∀{0.09-98 Ø4.97}
91.7% sRGB (Argyll 1.6.3 3D)
58% AdobeRGB 1998 (Argyll 1.6.3 3D)
63.1% AdobeRGB 1998 (Argyll 3D)
90.5% sRGB (Argyll 3D)
61.2% Display P3 (Argyll 3D)
Gamma: 2.28
CCT: 7046 K
| Lenovo IdeaPad S740-15IRH BOE HF NE156QUM-N55, IPS, 15.6", 3840x2160 | Dell XPS 15 7590 9980HK GTX 1650 Samsung 156WR04, SDCA029, OLED, 15.6", 3840x2160 | HP Spectre X360 15-5ZV31AV AU Optronics AUO30EB, IPS, 15.6", 3840x2160 | Lenovo Yoga 730-15IKB BOE HF NV156QUM-N51, IPS, 15.6", 3840x2160 | Asus ZenBook 15 UX534FT-DB77 BOE NV156FHM-N63, IPS, 15.6", 1920x1080 | MSI Prestige 15 A10SC Sharp LQ156D1JW42, IPS, 15.6", 3840x2160 | |
|---|---|---|---|---|---|---|
| Display | 33% | 8% | 5% | 3% | 32% | |
| Display P3 Coverage (%) | 61.2 | 88.1 44% | 68.3 12% | 68.7 12% | 66.6 9% | 82 34% |
| sRGB Coverage (%) | 90.5 | 99.6 10% | 94.3 4% | 90 -1% | 87.7 -3% | 98.3 9% |
| AdobeRGB 1998 Coverage (%) | 63.1 | 91.8 45% | 68.4 8% | 65.8 4% | 64.1 2% | 96.2 52% |
| Response Times | 93% | -46% | 12% | -12% | -50% | |
| Response Time Grey 50% / Grey 80% * (ms) | 40.4 ? | 2.3 ? 94% | 56.8 ? -41% | 34 ? 16% | 41.2 ? -2% | 60 ? -49% |
| Response Time Black / White * (ms) | 27.2 ? | 2.4 ? 91% | 40.8 ? -50% | 25 ? 8% | 33.2 ? -22% | 41.2 ? -51% |
| PWM Frequency (Hz) | 59.5 ? | 961 ? | 26040 ? | |||
| Screen | -22% | -13% | -19% | -39% | -8% | |
| Brightness middle (cd/m²) | 475.8 | 421.2 -11% | 284.6 -40% | 309 -35% | 312.6 -34% | 464.5 -2% |
| Brightness (cd/m²) | 439 | 417 -5% | 285 -35% | 299 -32% | 290 -34% | 451 3% |
| Brightness Distribution (%) | 83 | 94 13% | 85 2% | 84 1% | 85 2% | 92 11% |
| Black Level * (cd/m²) | 0.39 | 0.25 36% | 0.29 26% | 0.31 21% | 0.5 -28% | |
| Contrast (:1) | 1220 | 1138 -7% | 1066 -13% | 1008 -17% | 929 -24% | |
| Colorchecker dE 2000 * | 2.36 | 6.06 -157% | 3.52 -49% | 3.9 -65% | 5.78 -145% | 3.36 -42% |
| Colorchecker dE 2000 max. * | 6.29 | 11.89 -89% | 5.56 12% | 7.5 -19% | 8.86 -41% | 7.06 -12% |
| Colorchecker dE 2000 calibrated * | 1.62 | 3 -85% | 3.78 -133% | 3.42 -111% | ||
| Greyscale dE 2000 * | 3.8 | 2.8 26% | 3.2 16% | 4.58 -21% | 5.4 -42% | 1.3 66% |
| Gamma | 2.28 96% | 2.15 102% | 2.28 96% | 2.43 91% | 2.21 100% | 2.14 103% |
| CCT | 7046 92% | 6235 104% | 7070 92% | 7344 89% | 7864 83% | 6596 99% |
| Color Space (Percent of AdobeRGB 1998) (%) | 58 | 81 40% | 61.1 5% | 39 -33% | 57.1 -2% | 84.8 46% |
| Color Space (Percent of sRGB) (%) | 91.7 | 99.6 9% | 93.8 2% | 90 -2% | 87.4 -5% | 98.3 7% |
| Teljes átlag (program / beállítások) | 35% /
8% | -17% /
-13% | -1% /
-10% | -16% /
-28% | -9% /
-6% |
* ... a kisebb jobb
Megjelenítési válaszidők
| ↔ Válaszidő Fekete-fehér | ||
|---|---|---|
| 27.2 ms ... emelkedés és süllyedés ↘ kombinálva | ↗ 14.8 ms emelkedés | 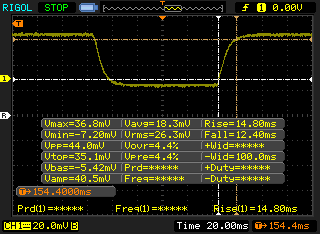 |
| ↘ 12.4 ms ősz | ||
| A képernyő viszonylag lassú reakciósebességet mutat tesztjeinkben, és túl lassú lehet a játékosok számára. Összehasonlításképpen, az összes tesztelt eszköz 0.1 (minimum) és 240 (maximum) ms között mozog. » 69 % of all devices are better. Ez azt jelenti, hogy a mért válaszidő rosszabb, mint az összes vizsgált eszköz átlaga (19.8 ms). | ||
| ↔ Válaszidő 50% szürke és 80% szürke között | ||
| 40.4 ms ... emelkedés és süllyedés ↘ kombinálva | ↗ 18 ms emelkedés | 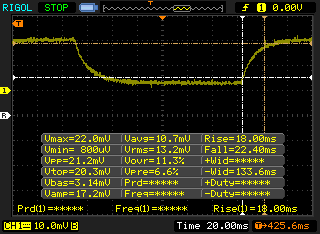 |
| ↘ 22 ms ősz | ||
| A képernyő lassú reakciósebességet mutat tesztjeinkben, és nem lesz kielégítő a játékosok számára. Összehasonlításképpen, az összes tesztelt eszköz 0.165 (minimum) és 636 (maximum) ms között mozog. » 64 % of all devices are better. Ez azt jelenti, hogy a mért válaszidő rosszabb, mint az összes vizsgált eszköz átlaga (31 ms). | ||
Képernyő villogása / PWM (impulzusszélesség-moduláció)
| Képernyő villogása / PWM nem érzékelhető |  | ||
Összehasonlításképpen: az összes tesztelt eszköz 52 %-a nem használja a PWM-et a kijelző elsötétítésére. Ha PWM-et észleltek, akkor átlagosan 7769 (minimum: 5 - maximum: 343500) Hz-t mértek. | |||
| Cinebench R11.5 | |
| CPU Single 64Bit | |
| Corsair One i160 | |
| Dell XPS 13 7390 Core i7-10710U | |
| MSI GE75 9SG | |
| Átlagos Intel Core i7-9750H (1.96 - 2.19, n=10) | |
| Asus Zephyrus GX501 | |
| Asus ROG Zephyrus G15 GA502DU | |
| CPU Multi 64Bit | |
| Corsair One i160 | |
| MSI GE75 9SG | |
| Átlagos Intel Core i7-9750H (11.3 - 14.1, n=10) | |
| Dell XPS 13 7390 Core i7-10710U | |
| Asus ROG Zephyrus G15 GA502DU | |
| Asus Zephyrus GX501 | |
| Cinebench R10 | |
| Rendering Multiple CPUs 32Bit | |
| Corsair One i160 | |
| MSI GE75 9SG | |
| Medion Erazer X15805 | |
| Átlagos Intel Core i7-9750H (28251 - 36304, n=13) | |
| Dell XPS 13 7390 Core i7-10710U | |
| Asus Zephyrus GX501 | |
| Asus ROG Zephyrus G15 GA502DU | |
| Rendering Single 32Bit | |
| Corsair One i160 | |
| Medion Erazer X15805 | |
| Dell XPS 13 7390 Core i7-10710U | |
| MSI GE75 9SG | |
| Átlagos Intel Core i7-9750H (6659 - 7214, n=13) | |
| Asus Zephyrus GX501 | |
| Asus ROG Zephyrus G15 GA502DU | |
| wPrime 2.10 - 1024m | |
| Asus ROG Zephyrus G15 GA502DU | |
| Dell XPS 13 7390 Core i7-10710U | |
| Átlagos Intel Core i7-9750H (n=1) | |
| MSI GE75 9SG | |
| Corsair One i160 | |
* ... a kisebb jobb
| PCMark 8 | |
| Home Score Accelerated v2 | |
| Átlagos Intel Core i7-9750H, NVIDIA GeForce GTX 1650 Max-Q (3548 - 4069, n=2) | |
| Dell XPS 15 7590 9980HK GTX 1650 | |
| Asus ZenBook 15 UX534FT-DB77 | |
| Lenovo IdeaPad S740-15IRH | |
| MSI Prestige 15 A10SC | |
| Lenovo Yoga 730-15IKB | |
| HP Spectre X360 15-5ZV31AV | |
| Work Score Accelerated v2 | |
| Asus ZenBook 15 UX534FT-DB77 | |
| Átlagos Intel Core i7-9750H, NVIDIA GeForce GTX 1650 Max-Q (4555 - 5359, n=2) | |
| Dell XPS 15 7590 9980HK GTX 1650 | |
| HP Spectre X360 15-5ZV31AV | |
| Lenovo IdeaPad S740-15IRH | |
| MSI Prestige 15 A10SC | |
| Lenovo Yoga 730-15IKB | |
| PCMark 8 Home Score Accelerated v2 | 3548 pontok | |
| PCMark 8 Work Score Accelerated v2 | 4555 pontok | |
| PCMark 10 Score | 4629 pontok | |
Segítség | ||
| Lenovo IdeaPad S740-15IRH Samsung SSD PM981 MZVLB512HAJQ | Dell XPS 15 7590 9980HK GTX 1650 Toshiba XG6 KXG60ZNV1T02 | HP Spectre X360 15-5ZV31AV Intel SSD 660p 2TB SSDPEKNW020T8 | Lenovo Yoga 730-15IKB SK Hynix PC401 512GB M.2 (HFS512GD9TNG) | Asus ZenBook 15 UX534FT-DB77 Samsung SSD PM981 MZVLB1T0HALR | MSI Prestige 15 A10SC Samsung SSD PM981 MZVLB1T0HALR | |
|---|---|---|---|---|---|---|
| AS SSD | 4% | -24% | -26% | -4% | 4% | |
| Seq Read (MB/s) | 1791 | 1723 -4% | 1220 -32% | 2158 20% | 1887 5% | 1274 -29% |
| Seq Write (MB/s) | 1466 | 1386 -5% | 1152 -21% | 680 -54% | 1432 -2% | 1395 -5% |
| 4K Read (MB/s) | 47.24 | 43.25 -8% | 52.3 11% | 44.74 -5% | 52.3 11% | 50.3 6% |
| 4K Write (MB/s) | 96.9 | 98.3 1% | 146.6 51% | 123 27% | 146 51% | 119.8 24% |
| 4K-64 Read (MB/s) | 1077 | 1078 0% | 652 -39% | 623 -42% | 969 -10% | 1599 48% |
| 4K-64 Write (MB/s) | 1997 | 1456 -27% | 847 -58% | 486 -76% | 1375 -31% | 1455 -27% |
| Access Time Read * (ms) | 0.047 | 0.05 -6% | 0.077 -64% | 0.044 6% | 0.034 28% | 0.044 6% |
| Access Time Write * (ms) | 0.116 | 0.039 66% | 0.106 9% | 0.051 56% | 0.075 35% | 0.092 21% |
| Score Read (Points) | 1303 | 1294 -1% | 826 -37% | 884 -32% | 1210 -7% | 1777 36% |
| Score Write (Points) | 2241 | 1693 -24% | 1109 -51% | 677 -70% | 1664 -26% | 1714 -24% |
| Score Total (Points) | 4203 | 3638 -13% | 2371 -44% | 1951 -54% | 3483 -17% | 4411 5% |
| Copy ISO MB/s (MB/s) | 2127 | 3182 50% | 2070 -3% | 1641 -23% | 1375 -35% | 2830 33% |
| Copy Program MB/s (MB/s) | 828 | 984 19% | 571 -31% | 390 -53% | 468 -43% | 609 -26% |
| Copy Game MB/s (MB/s) | 1639 | 1824 11% | 1219 -26% | 574 -65% | 1287 -21% | 1424 -13% |
| CrystalDiskMark 5.2 / 6 | 5% | 1% | 12% | 13% | -5% | |
| Write 4K (MB/s) | 91.6 | 104.3 14% | 151.5 65% | 164.9 80% | 141.6 55% | 150.8 65% |
| Read 4K (MB/s) | 38.61 | 45.23 17% | 59.3 54% | 50.5 31% | 45.28 17% | 47.3 23% |
| Write Seq (MB/s) | 1991 | 1729 -13% | 1424 -28% | 1262 -37% | 1975 -1% | 981 -51% |
| Read Seq (MB/s) | 1827 | 1861 2% | 1609 -12% | 2054 12% | 2272 24% | 976 -47% |
| Write 4K Q32T1 (MB/s) | 490.3 | 509 4% | 393.6 -20% | 477.6 -3% | 458.6 -6% | 442.7 -10% |
| Read 4K Q32T1 (MB/s) | 292 | 388.5 33% | 369.4 27% | 550 88% | 391.4 34% | 499.7 71% |
| Write Seq Q32T1 (MB/s) | 2974 | 2813 -5% | 1946 -35% | 1400 -53% | 2393 -20% | 1706 -43% |
| Read Seq Q32T1 (MB/s) | 3449 | 2906 -16% | 1934 -44% | 2672 -23% | 3464 0% | 1758 -49% |
| Teljes átlag (program / beállítások) | 5% /
4% | -12% /
-15% | -7% /
-12% | 5% /
2% | -1% /
1% |
* ... a kisebb jobb

| 3DMark | |
| 1920x1080 Fire Strike Graphics | |
| Walmart EVOO Gaming 17 | |
| Schenker XMG Neo 15 XNE15M19 | |
| HP Omen 15-dc0015ng | |
| HP Gaming Pavilion 15-dk0009ng | |
| Asus Zephyrus S GX531GM | |
| MSI GT72S-6QEG16SR421BW | |
| Gainward GeForce GTX 1650 4 GB | |
| Lenovo IdeaPad S740-15IRH | |
| Átlagos NVIDIA GeForce GTX 1650 Max-Q (6985 - 8618, n=12) | |
| HP Spectre x360 15-df0126ng | |
| Lenovo Yoga 730-15IKB | |
| Asus Zenbook 14 UX433FN-A6023T | |
| 2560x1440 Time Spy Graphics | |
| Walmart EVOO Gaming 17 | |
| Schenker XMG Neo 15 XNE15M19 | |
| HP Gaming Pavilion 15-dk0009ng | |
| HP Omen 15-dc0015ng | |
| Asus Zephyrus S GX531GM | |
| Gainward GeForce GTX 1650 4 GB | |
| Lenovo IdeaPad S740-15IRH | |
| Átlagos NVIDIA GeForce GTX 1650 Max-Q (2836 - 3238, n=10) | |
| MSI GT72S-6QEG16SR421BW | |
| HP Spectre x360 15-df0126ng | |
| Lenovo Yoga 730-15IKB | |
| Asus Zenbook 14 UX433FN-A6023T | |
| 3DMark 11 | |
| 1280x720 Performance GPU | |
| Walmart EVOO Gaming 17 | |
| Schenker XMG Neo 15 XNE15M19 | |
| HP Omen 15-dc0015ng | |
| HP Gaming Pavilion 15-dk0009ng | |
| Gainward GeForce GTX 1650 4 GB | |
| Asus Zephyrus S GX531GM | |
| MSI GT72S-6QEG16SR421BW | |
| Lenovo IdeaPad S740-15IRH | |
| Átlagos NVIDIA GeForce GTX 1650 Max-Q (10248 - 12259, n=14) | |
| HP Spectre x360 15-df0126ng | |
| Lenovo Yoga 730-15IKB | |
| Asus Zenbook 14 UX433FN-A6023T | |
| 1280x720 Performance Combined | |
| Walmart EVOO Gaming 17 | |
| HP Gaming Pavilion 15-dk0009ng | |
| HP Omen 15-dc0015ng | |
| Schenker XMG Neo 15 XNE15M19 | |
| Gainward GeForce GTX 1650 4 GB | |
| Lenovo IdeaPad S740-15IRH | |
| MSI GT72S-6QEG16SR421BW | |
| Átlagos NVIDIA GeForce GTX 1650 Max-Q (6409 - 10846, n=13) | |
| HP Spectre x360 15-df0126ng | |
| Asus Zephyrus S GX531GM | |
| Lenovo Yoga 730-15IKB | |
| Asus Zenbook 14 UX433FN-A6023T | |
| 3DMark 11 Performance | 11966 pontok | |
| 3DMark Ice Storm Standard Score | 42968 pontok | |
| 3DMark Cloud Gate Standard Score | 25731 pontok | |
| 3DMark Fire Strike Score | 7545 pontok | |
| 3DMark Time Spy Score | 3373 pontok | |
Segítség | ||
| Shadow of the Tomb Raider - 1920x1080 Highest Preset AA:T | |
| MSI RTX 2060 Gaming Z 6G | |
| HP Pavilion Gaming 17-cd0085cl | |
| MSI GF65 9SD | |
| Asus TUF FX705GM | |
| Gainward GeForce GTX 1650 4 GB | |
| Lenovo IdeaPad S740-15IRH | |
| Asus G752VY | |
| Átlagos NVIDIA GeForce GTX 1650 Max-Q (33 - 45, n=6) | |
| Asus TUF FX705GE-EW096T | |
| Xiaomi Mi Notebook Pro i7 | |
| The Witcher 3 - 1920x1080 Ultra Graphics & Postprocessing (HBAO+) | |
| MSI RTX 2060 Gaming Z 6G | |
| MSI GF65 9SD | |
| HP Pavilion Gaming 17-cd0085cl | |
| Gainward GeForce GTX 1650 4 GB | |
| Asus TUF FX705GM | |
| Dell G3 3590 | |
| Lenovo IdeaPad S740-15IRH | |
| Átlagos NVIDIA GeForce GTX 1650 Max-Q (27.5 - 36.5, n=11) | |
| Asus TUF FX705GE-EW096T | |
| Xiaomi Mi Notebook Pro i7 | |
| alacsony | közepes | magas | ultra | |
|---|---|---|---|---|
| BioShock Infinite (2013) | 323.6 | 238.3 | 206.8 | 81.7 |
| The Witcher 3 (2015) | 188 | 114.8 | 60.4 | 34.4 |
| Shadow of the Tomb Raider (2018) | 117 | 56 | 47 | 41 |
| Lenovo IdeaPad S740-15IRH GeForce GTX 1650 Max-Q, i7-9750H, Samsung SSD PM981 MZVLB512HAJQ | Dell XPS 15 7590 9980HK GTX 1650 GeForce GTX 1650 Mobile, i9-9980HK, Toshiba XG6 KXG60ZNV1T02 | HP Spectre X360 15-5ZV31AV GeForce MX250, i7-10510U, Intel SSD 660p 2TB SSDPEKNW020T8 | Lenovo Yoga 730-15IKB GeForce GTX 1050 Mobile, i5-8550U, SK Hynix PC401 512GB M.2 (HFS512GD9TNG) | Asus ZenBook 15 UX534FT-DB77 GeForce GTX 1650 Max-Q, i7-8565U, Samsung SSD PM981 MZVLB1T0HALR | MSI Prestige 15 A10SC GeForce GTX 1650 Max-Q, i7-10710U, Samsung SSD PM981 MZVLB1T0HALR | |
|---|---|---|---|---|---|---|
| Noise | -2% | 4% | 1% | 6% | 3% | |
| off / környezet * (dB) | 28.5 | 28.2 1% | 30.1 -6% | 30.5 -7% | 28.4 -0% | 29.3 -3% |
| Idle Minimum * (dB) | 28.5 | 28.2 1% | 30.1 -6% | 30.5 -7% | 28.4 -0% | 30.1 -6% |
| Idle Average * (dB) | 28.5 | 28.2 1% | 30.1 -6% | 30.5 -7% | 28.4 -0% | 30.2 -6% |
| Idle Maximum * (dB) | 28.5 | 30.4 -7% | 30.1 -6% | 30.5 -7% | 28.4 -0% | 30.2 -6% |
| Load Average * (dB) | 45 | 43.8 3% | 30.1 33% | 37.5 17% | 33.9 25% | 31.5 30% |
| Witcher 3 ultra * (dB) | 43.9 | 47.2 -8% | 39.7 10% | 39.8 9% | 37 16% | |
| Load Maximum * (dB) | 44.7 | 47.2 -6% | 42 6% | 37.5 16% | 40.2 10% | 47 -5% |
* ... a kisebb jobb
Zajszint
| Üresjárat |
| 28.5 / 28.5 / 28.5 dB(A) |
| Terhelés |
| 45 / 44.7 dB(A) |
 | ||
30 dB csendes 40 dB(A) hallható 50 dB(A) hangos |
||
min: | ||
(-) A felső oldalon a maximális hőmérséklet 46.2 °C / 115 F, összehasonlítva a 36.8 °C / 98 F átlagával , 21 és 71 °C között a Multimedia osztálynál.
(-) Az alsó maximum 50 °C / 122 F-ig melegszik fel, összehasonlítva a 39.1 °C / 102 F átlagával
(+) Üresjáratban a felső oldal átlagos hőmérséklete 31.2 °C / 88 F, összehasonlítva a 31.3 °C / ### eszközátlaggal class_avg_f### F.
(±) A The Witcher 3 játék során a felső oldal átlaghőmérséklete 32.8 °C / 91 F, összehasonlítva a 31.3 °C / ## eszközátlaggal #class_avg_f### F.
(+) A csuklótámasz és az érintőpad hűvösebb, mint a bőr hőmérséklete, maximum 30.2 °C / 86.4 F, ezért hűvös tapintású.
(±) A hasonló eszközök csuklótámasz területének átlagos hőmérséklete 28.7 °C / 83.7 F volt (-1.5 °C / -2.7 F).
Lenovo IdeaPad S740-15IRH hangelemzés
(±) | a hangszóró hangereje átlagos, de jó (78.8 dB)
Basszus 100 - 315 Hz
(±) | csökkentett basszus – átlagosan 10.8%-kal alacsonyabb, mint a medián
(-) | A basszus nem lineáris (15.2% delta az előző frekvenciához)
Közepes 400-2000 Hz
(±) | magasabb középértékek – átlagosan 5.1%-kal magasabb, mint a medián
(±) | a középpontok linearitása átlagos (7.2% delta az előző gyakorisághoz)
Maximum 2-16 kHz
(+) | kiegyensúlyozott csúcsok – csak 2.1% választja el a mediántól
(±) | a csúcsok linearitása átlagos (11.3% delta az előző gyakorisághoz)
Összességében 100 - 16.000 Hz
(±) | az általános hang linearitása átlagos (18.5% eltérés a mediánhoz képest)
Ugyanazon osztályhoz képest
» 57%Ebben az osztályban az összes tesztelt eszköz %-a jobb volt, 7% hasonló, 36%-kal rosszabb
» A legjobb delta értéke 5%, az átlag 17%, a legrosszabb 45% volt
Az összes tesztelt eszközzel összehasonlítva
» 41% az összes tesztelt eszköz jobb volt, 8% hasonló, 51%-kal rosszabb
» A legjobb delta értéke 4%, az átlag 24%, a legrosszabb 134% volt
Apple MacBook 12 (Early 2016) 1.1 GHz hangelemzés
(+) | a hangszórók viszonylag hangosan tudnak játszani (83.6 dB)
Basszus 100 - 315 Hz
(±) | csökkentett basszus – átlagosan 11.3%-kal alacsonyabb, mint a medián
(±) | a basszus linearitása átlagos (14.2% delta az előző frekvenciához)
Közepes 400-2000 Hz
(+) | kiegyensúlyozott középpontok – csak 2.4% választja el a mediántól
(+) | a középpontok lineárisak (5.5% delta az előző frekvenciához)
Maximum 2-16 kHz
(+) | kiegyensúlyozott csúcsok – csak 2% választja el a mediántól
(+) | a csúcsok lineárisak (4.5% delta az előző frekvenciához képest)
Összességében 100 - 16.000 Hz
(+) | általános hangzás lineáris (10.2% eltérés a mediánhoz képest)
Ugyanazon osztályhoz képest
» 7%Ebben az osztályban az összes tesztelt eszköz %-a jobb volt, 2% hasonló, 91%-kal rosszabb
» A legjobb delta értéke 5%, az átlag 18%, a legrosszabb 53% volt
Az összes tesztelt eszközzel összehasonlítva
» 5% az összes tesztelt eszköz jobb volt, 1% hasonló, 94%-kal rosszabb
» A legjobb delta értéke 4%, az átlag 24%, a legrosszabb 134% volt
| Kikapcsolt állapot / Készenlét | |
| Üresjárat | |
| Terhelés |
|
Kulcs:
min: | |
| Lenovo IdeaPad S740-15IRH i7-9750H, GeForce GTX 1650 Max-Q, Samsung SSD PM981 MZVLB512HAJQ, IPS, 3840x2160, 15.6" | Dell XPS 15 7590 9980HK GTX 1650 i9-9980HK, GeForce GTX 1650 Mobile, Toshiba XG6 KXG60ZNV1T02, OLED, 3840x2160, 15.6" | HP Spectre X360 15-5ZV31AV i7-10510U, GeForce MX250, Intel SSD 660p 2TB SSDPEKNW020T8, IPS, 3840x2160, 15.6" | Lenovo Yoga 730-15IKB i5-8550U, GeForce GTX 1050 Mobile, SK Hynix PC401 512GB M.2 (HFS512GD9TNG), IPS, 3840x2160, 15.6" | Asus ZenBook 15 UX534FT-DB77 i7-8565U, GeForce GTX 1650 Max-Q, Samsung SSD PM981 MZVLB1T0HALR, IPS, 1920x1080, 15.6" | MSI Prestige 15 A10SC i7-10710U, GeForce GTX 1650 Max-Q, Samsung SSD PM981 MZVLB1T0HALR, IPS, 3840x2160, 15.6" | |
|---|---|---|---|---|---|---|
| Power Consumption | 31% | 56% | 61% | 41% | 43% | |
| Idle Minimum * (Watt) | 28.6 | 6.2 78% | 5.2 82% | 4.8 83% | 5 83% | 6.1 79% |
| Idle Average * (Watt) | 26.5 | 9.6 64% | 8.5 68% | 10.1 62% | 13.2 50% | 13.2 50% |
| Idle Maximum * (Watt) | 32.1 | 21.2 34% | 8.7 73% | 10.7 67% | 24 25% | 19.2 40% |
| Load Average * (Watt) | 112.2 | 104.3 7% | 65.6 42% | 44 61% | 70 38% | 75 33% |
| Witcher 3 ultra * (Watt) | 90.1 | 91.7 -2% | 56.5 37% | 63.3 30% | 74 18% | |
| Load Maximum * (Watt) | 138.8 | 135.3 3% | 92.4 33% | 94.7 32% | 114 18% | 89.7 35% |
* ... a kisebb jobb
| Lenovo IdeaPad S740-15IRH i7-9750H, GeForce GTX 1650 Max-Q, 69 Wh | Dell XPS 15 7590 9980HK GTX 1650 i9-9980HK, GeForce GTX 1650 Mobile, 97 Wh | HP Spectre X360 15-5ZV31AV i7-10510U, GeForce MX250, 84 Wh | Lenovo Yoga 730-15IKB i5-8550U, GeForce GTX 1050 Mobile, 51.5 Wh | Asus ZenBook 15 UX534FT-DB77 i7-8565U, GeForce GTX 1650 Max-Q, 71 Wh | MSI Prestige 15 A10SC i7-10710U, GeForce GTX 1650 Max-Q, 82 Wh | |
|---|---|---|---|---|---|---|
| Akkumulátor üzemidő | 127% | 139% | -8% | 127% | 79% | |
| Reader / Idle (h) | 12.4 | 15.2 23% | 22.6 82% | 11.6 -6% | 21.5 73% | 19.1 54% |
| WiFi v1.3 (h) | 9 | 7.8 -13% | 10.8 20% | 6.2 -31% | 8.4 -7% | 7.6 -16% |
| Load (h) | 0.7 | 3.3 371% | 2.9 314% | 0.8 14% | 2.9 314% | 2.1 200% |
Pro
Kontra
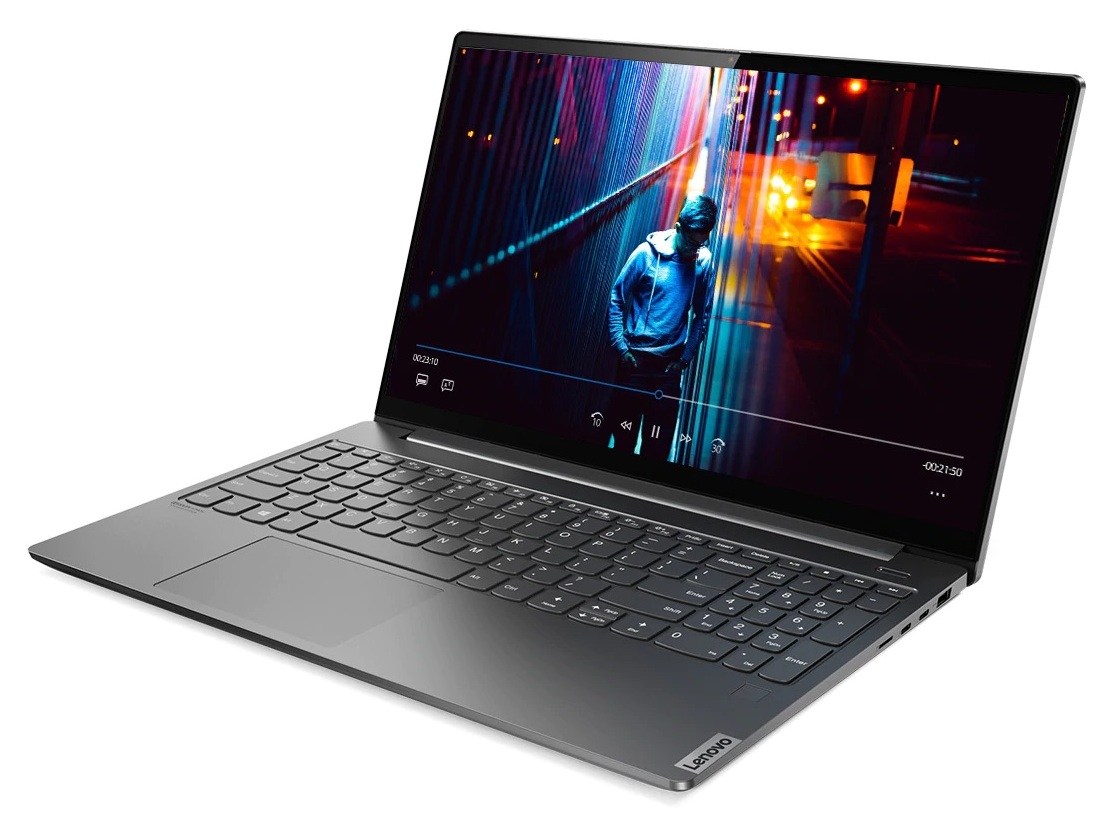
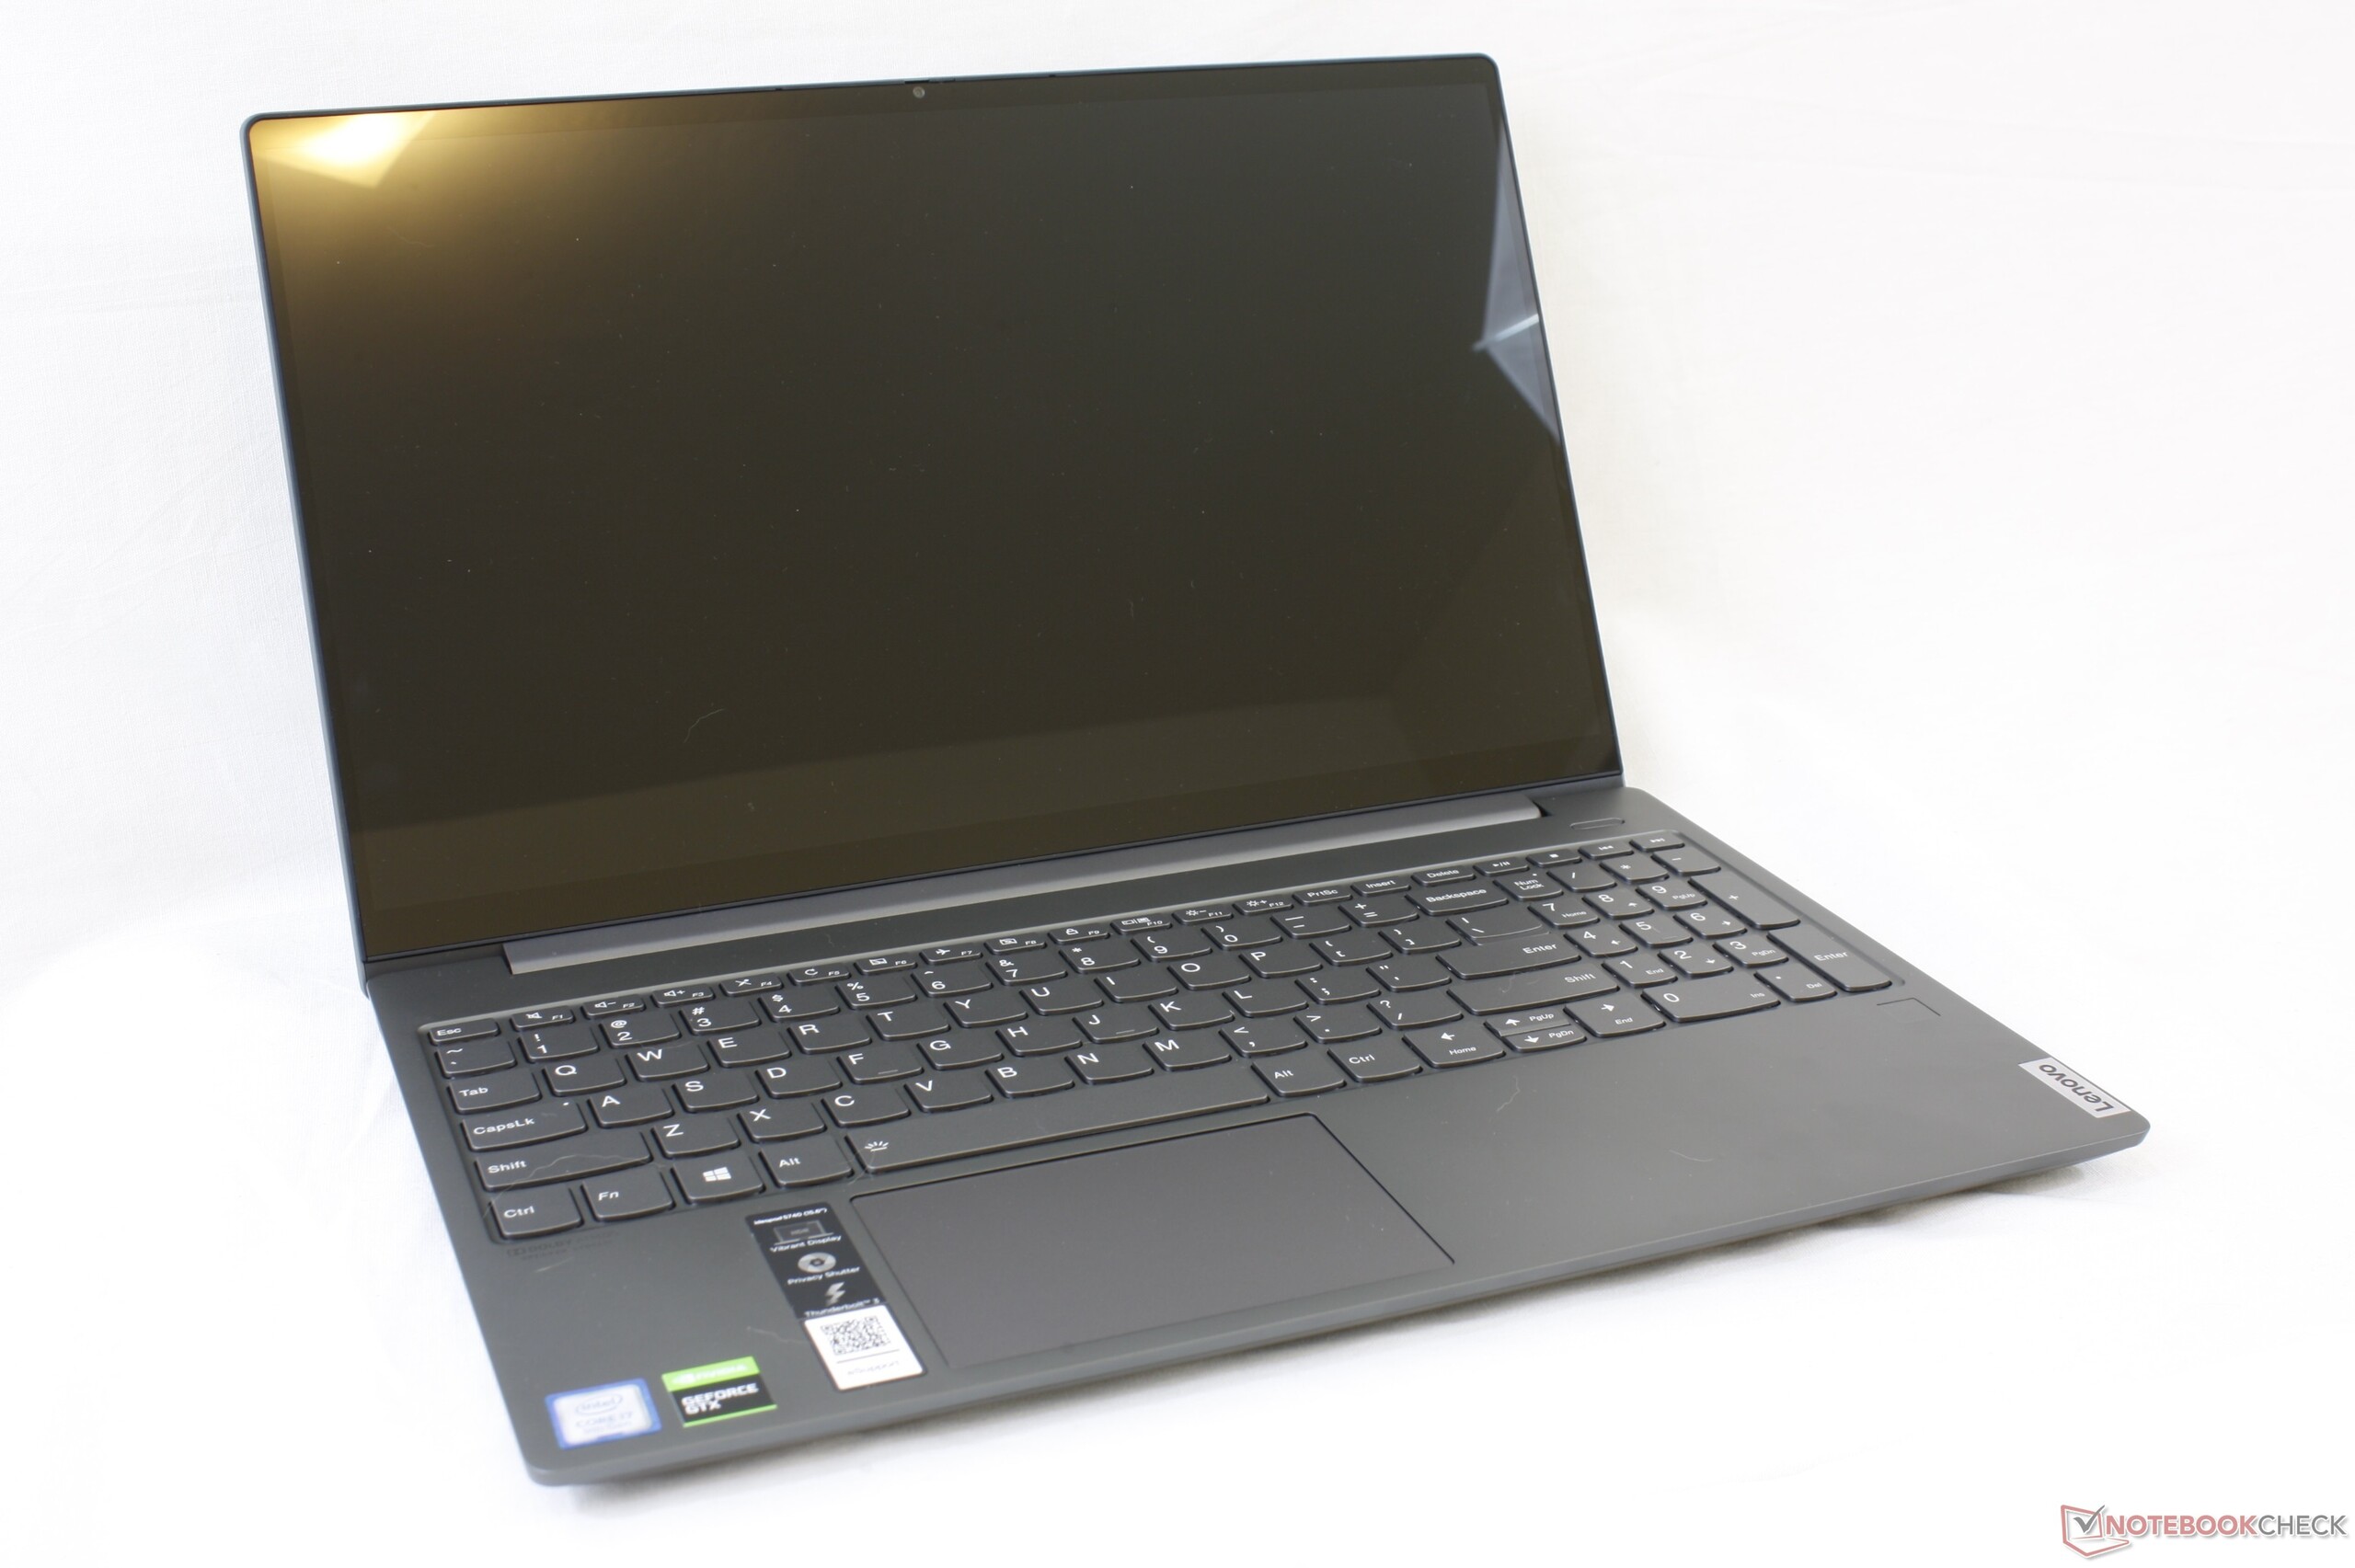
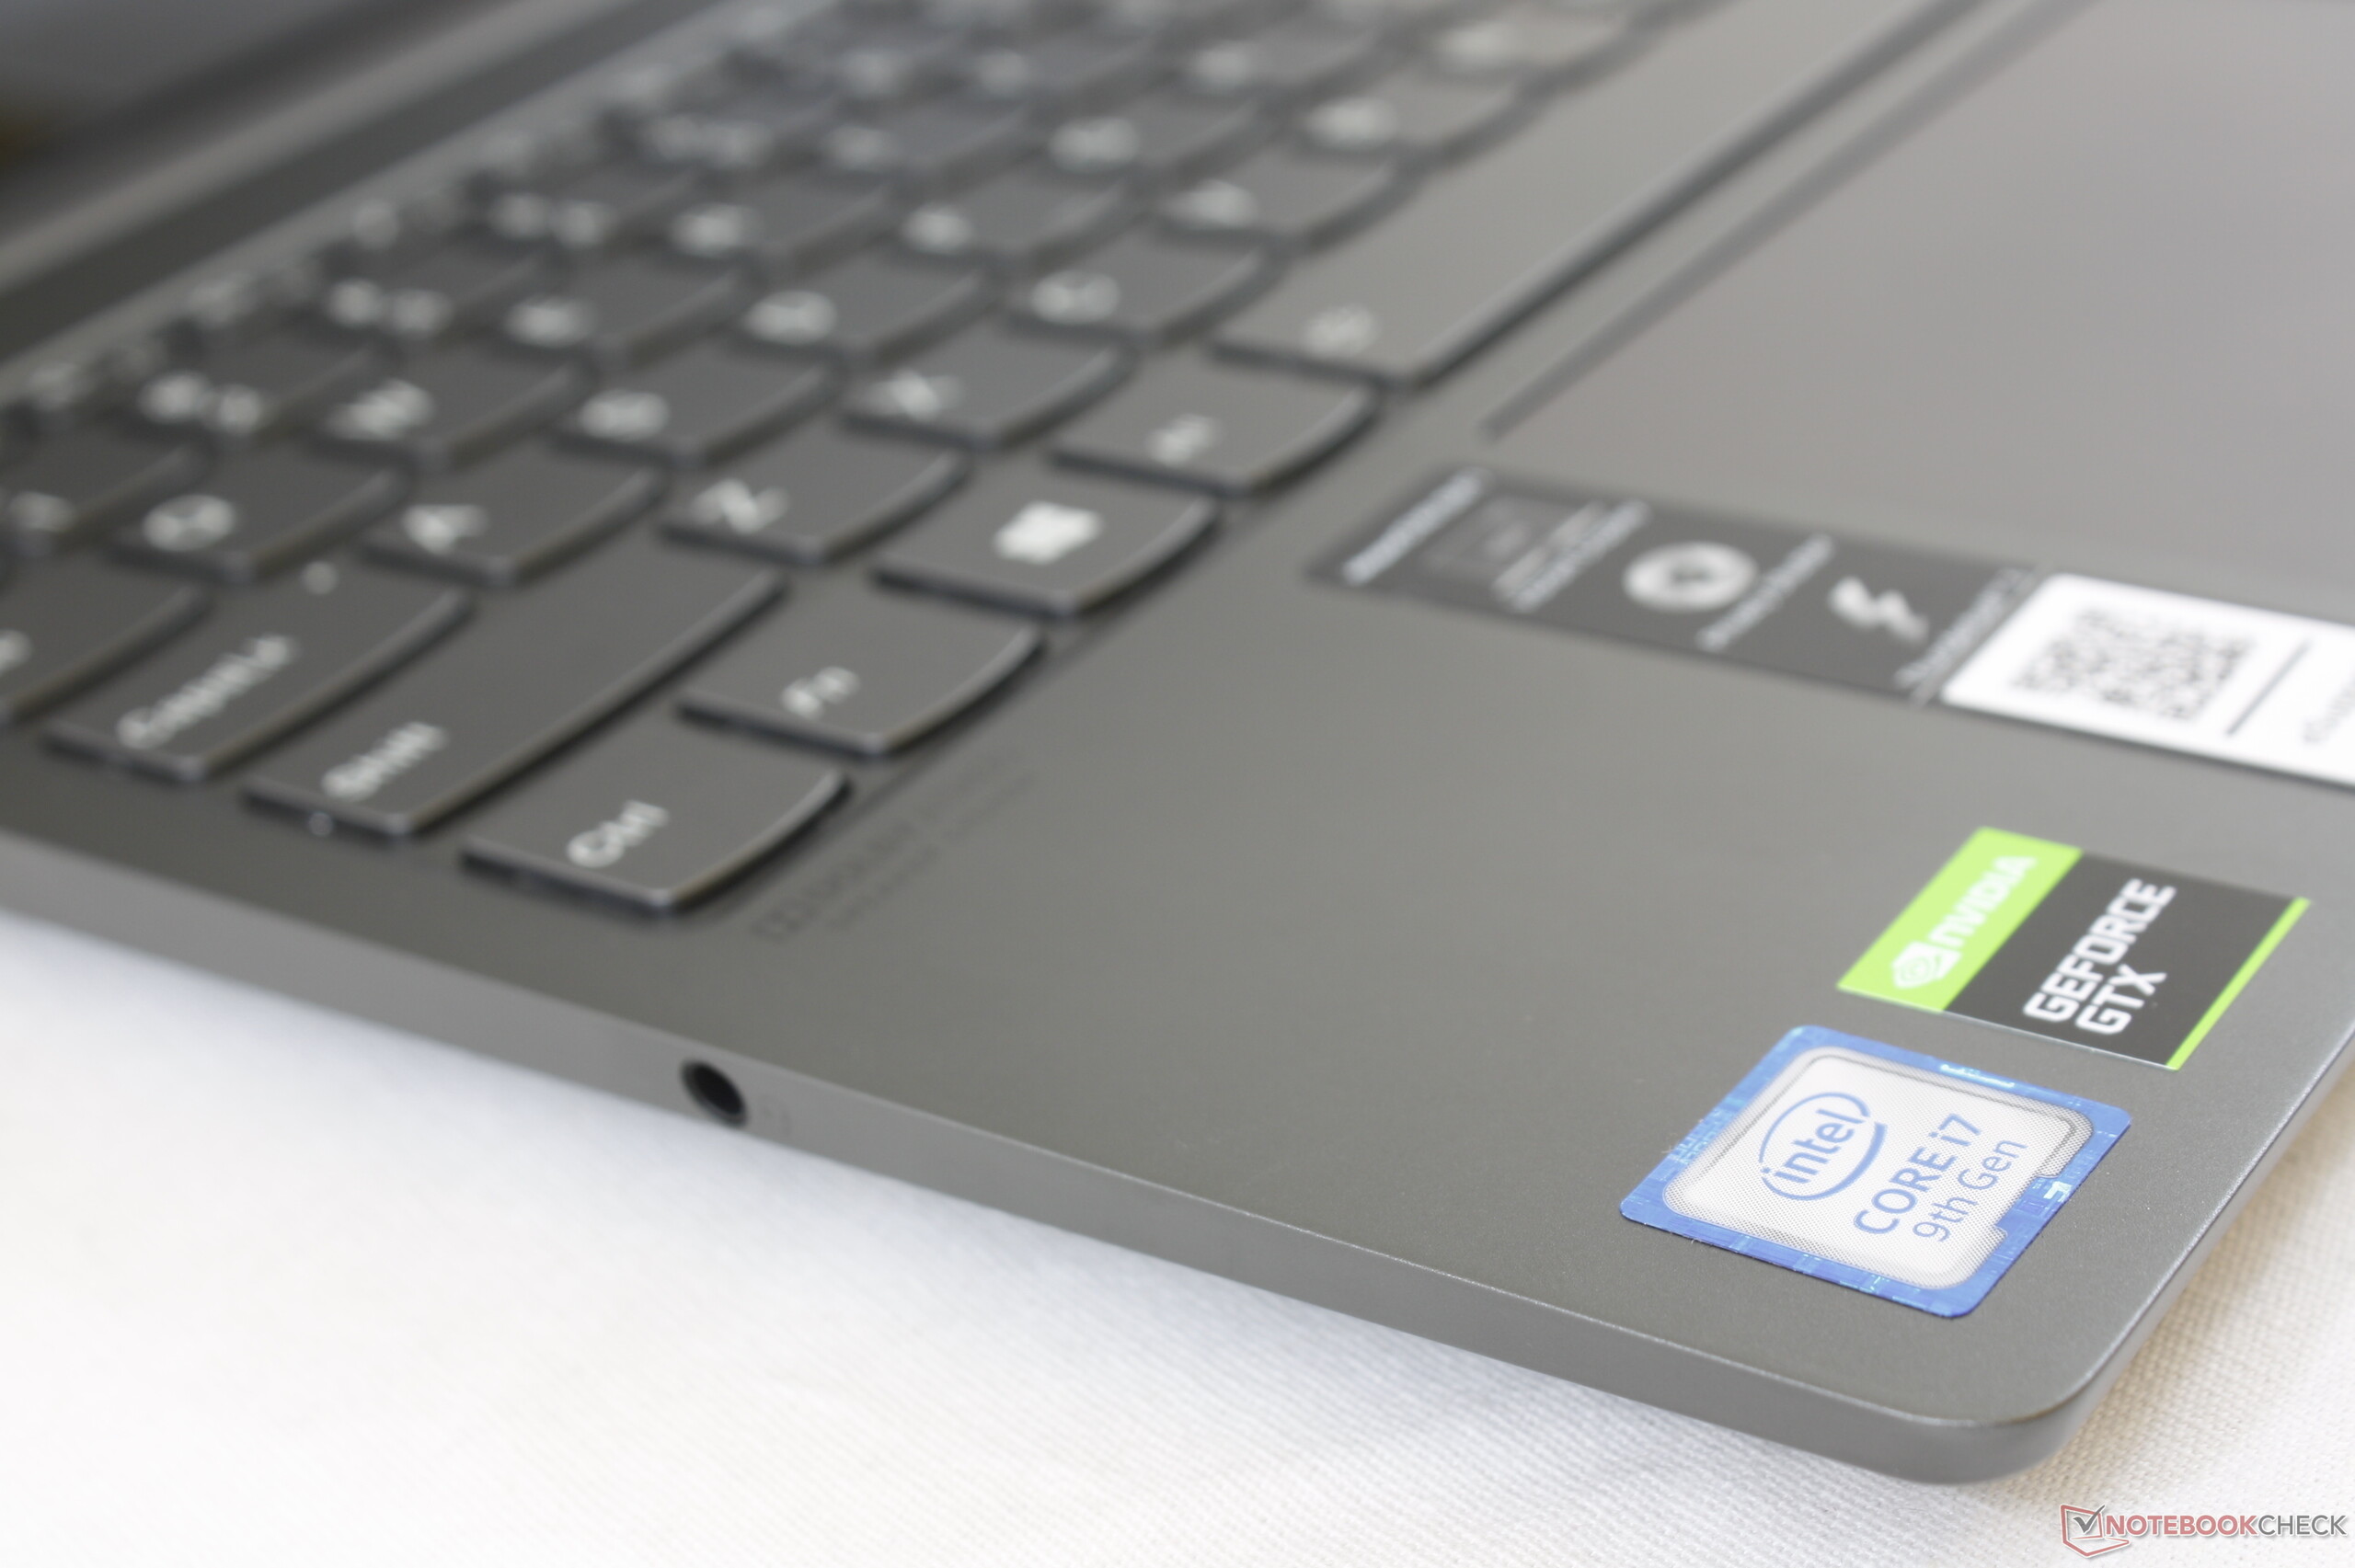
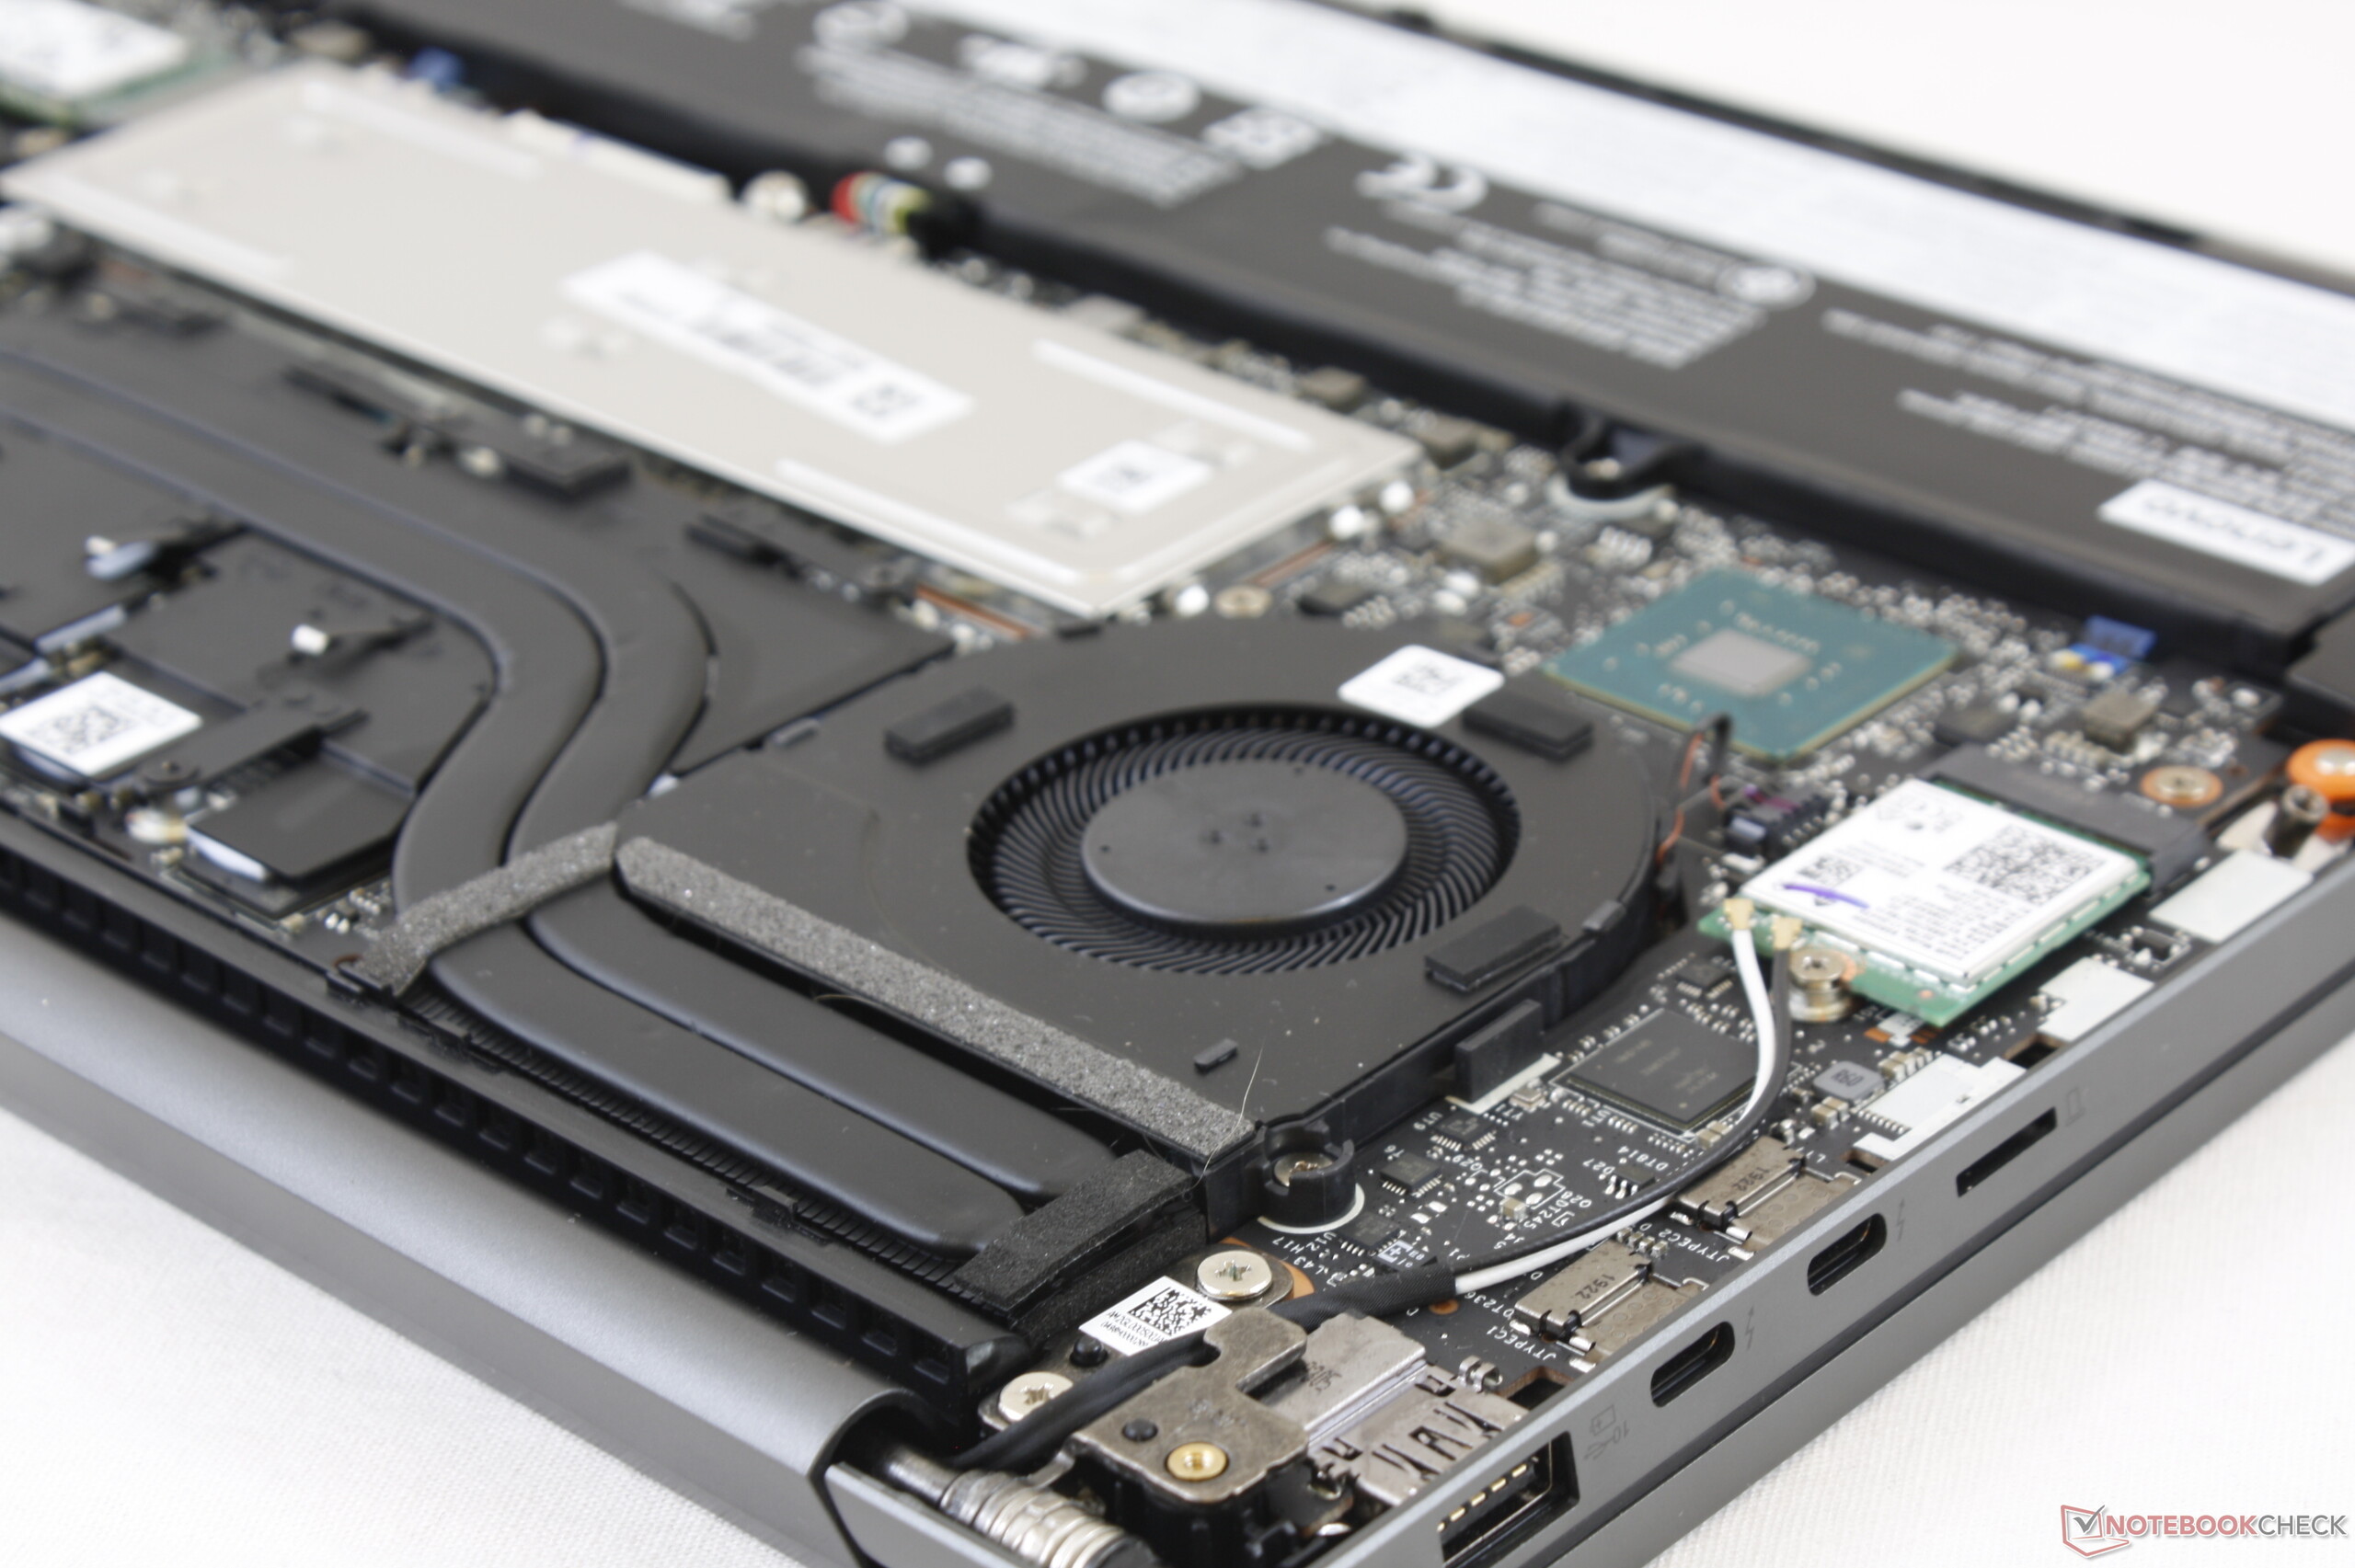
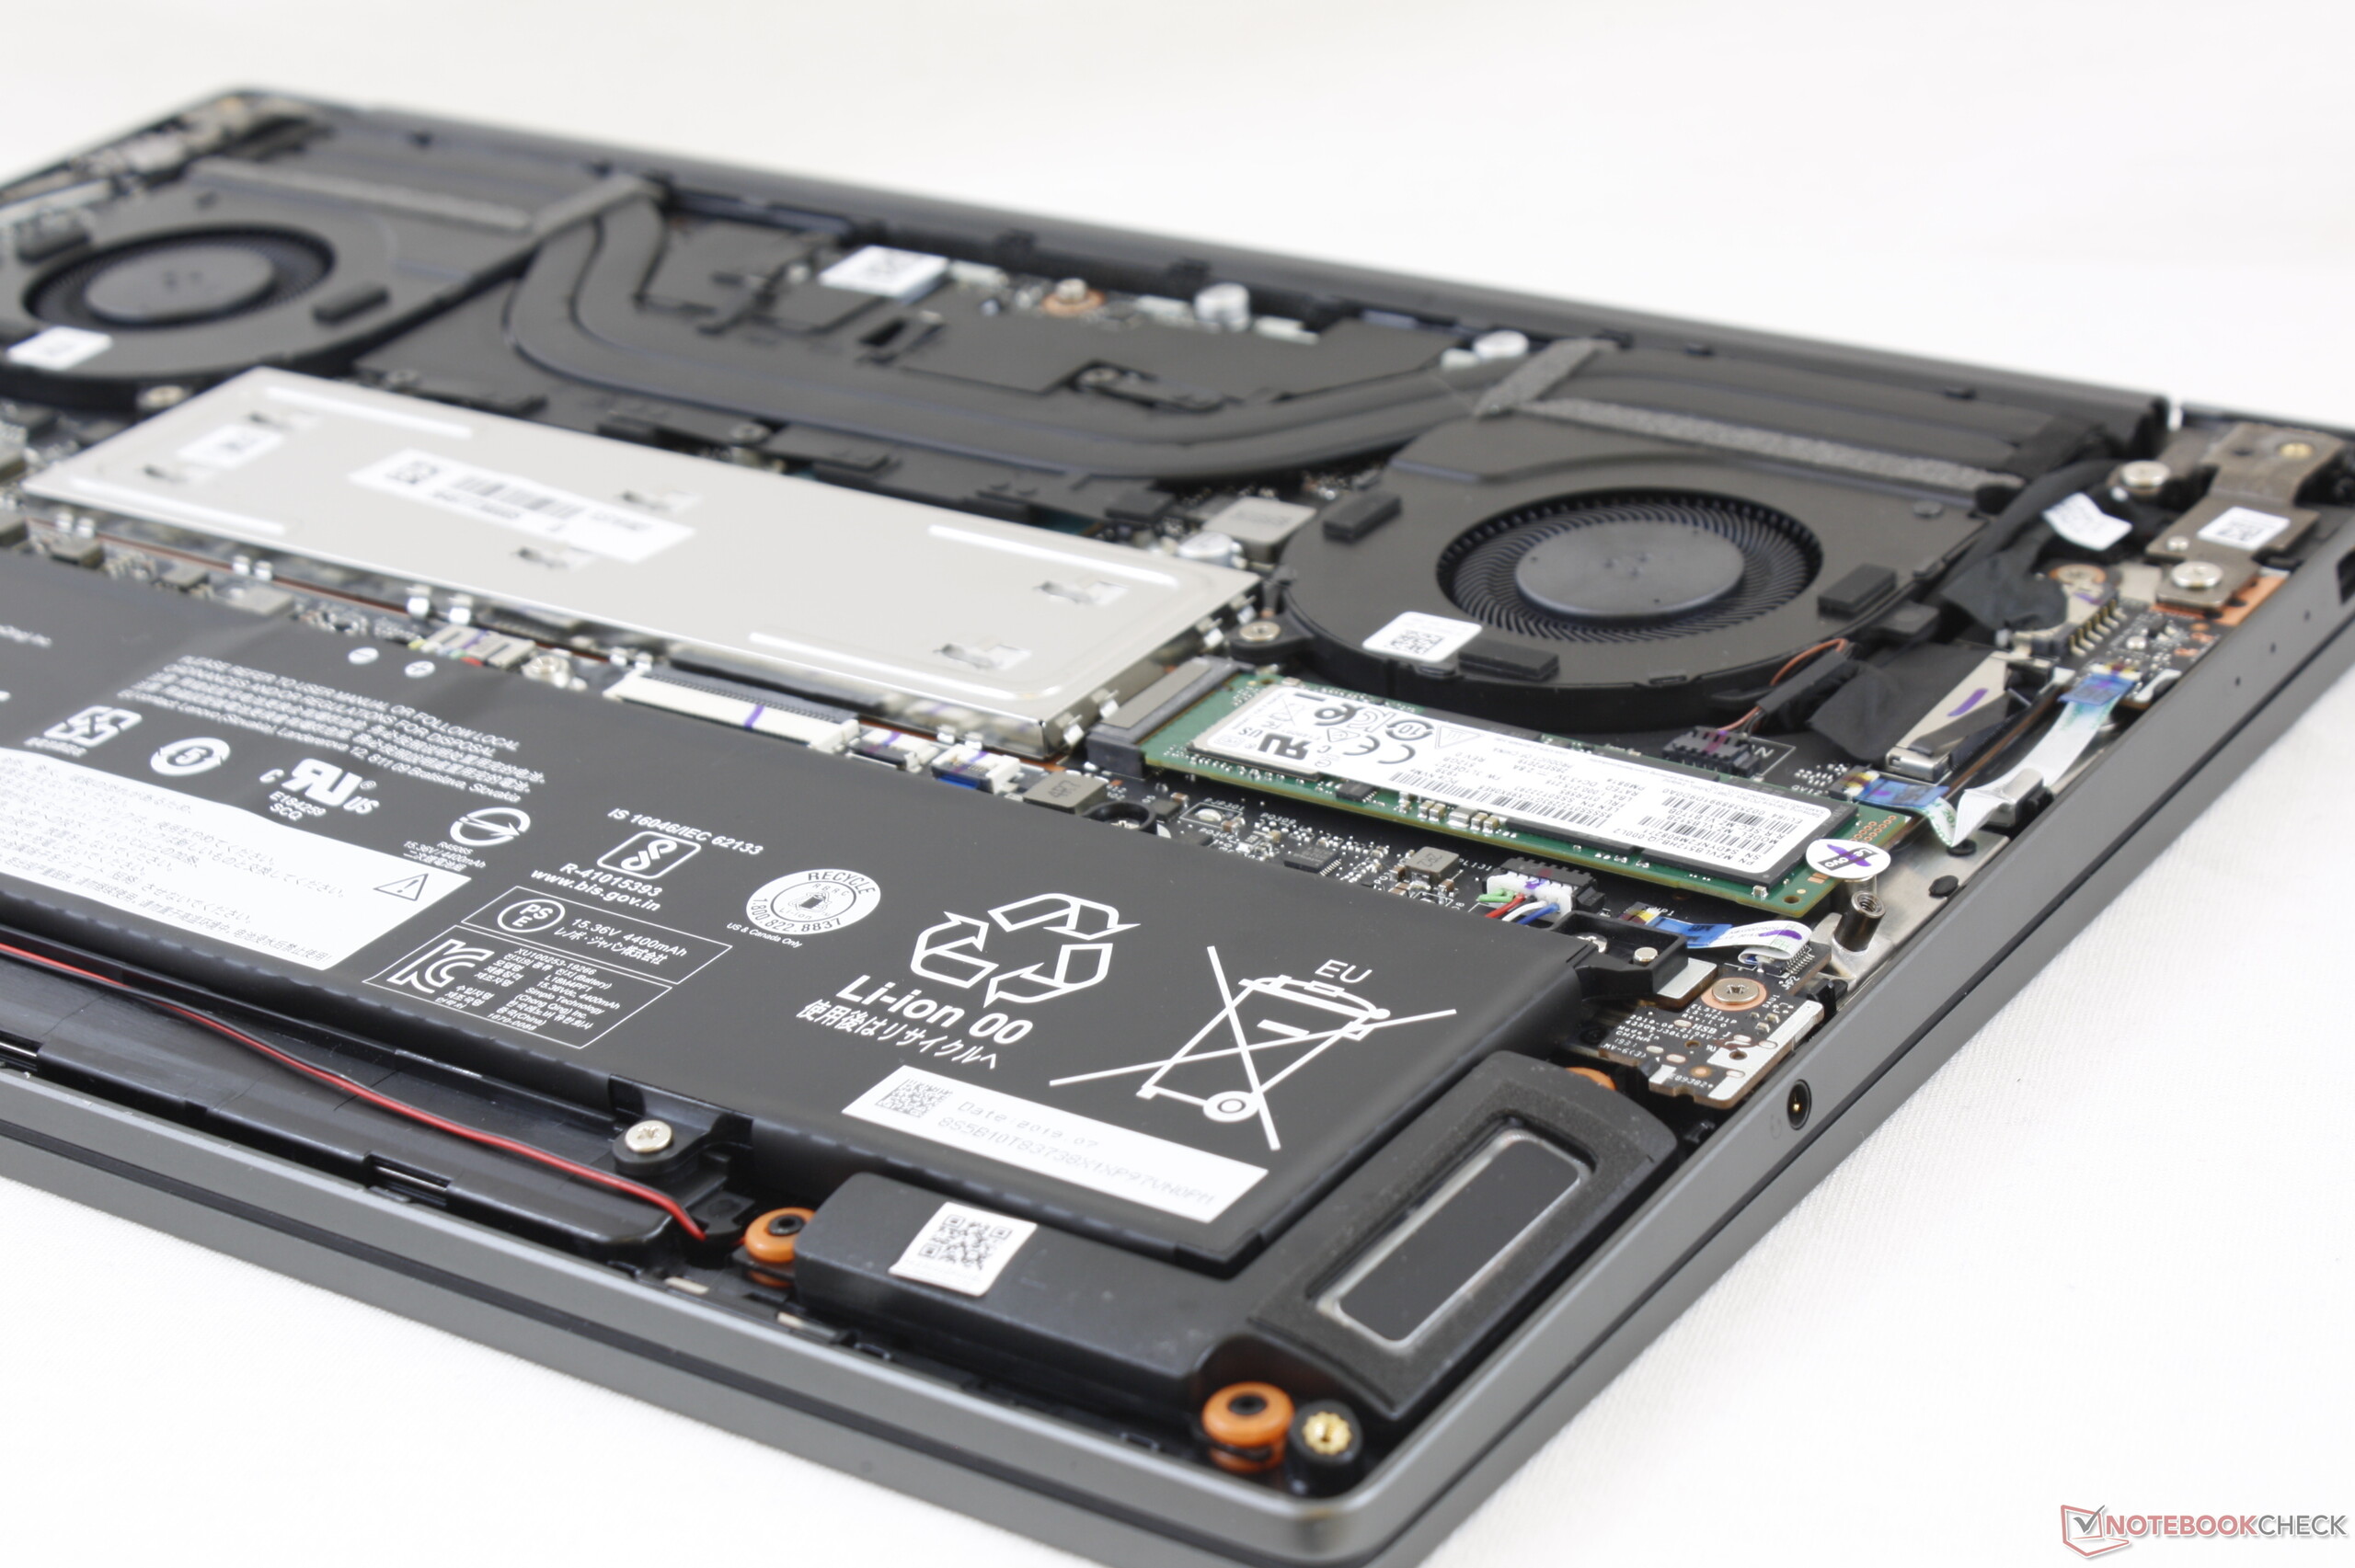
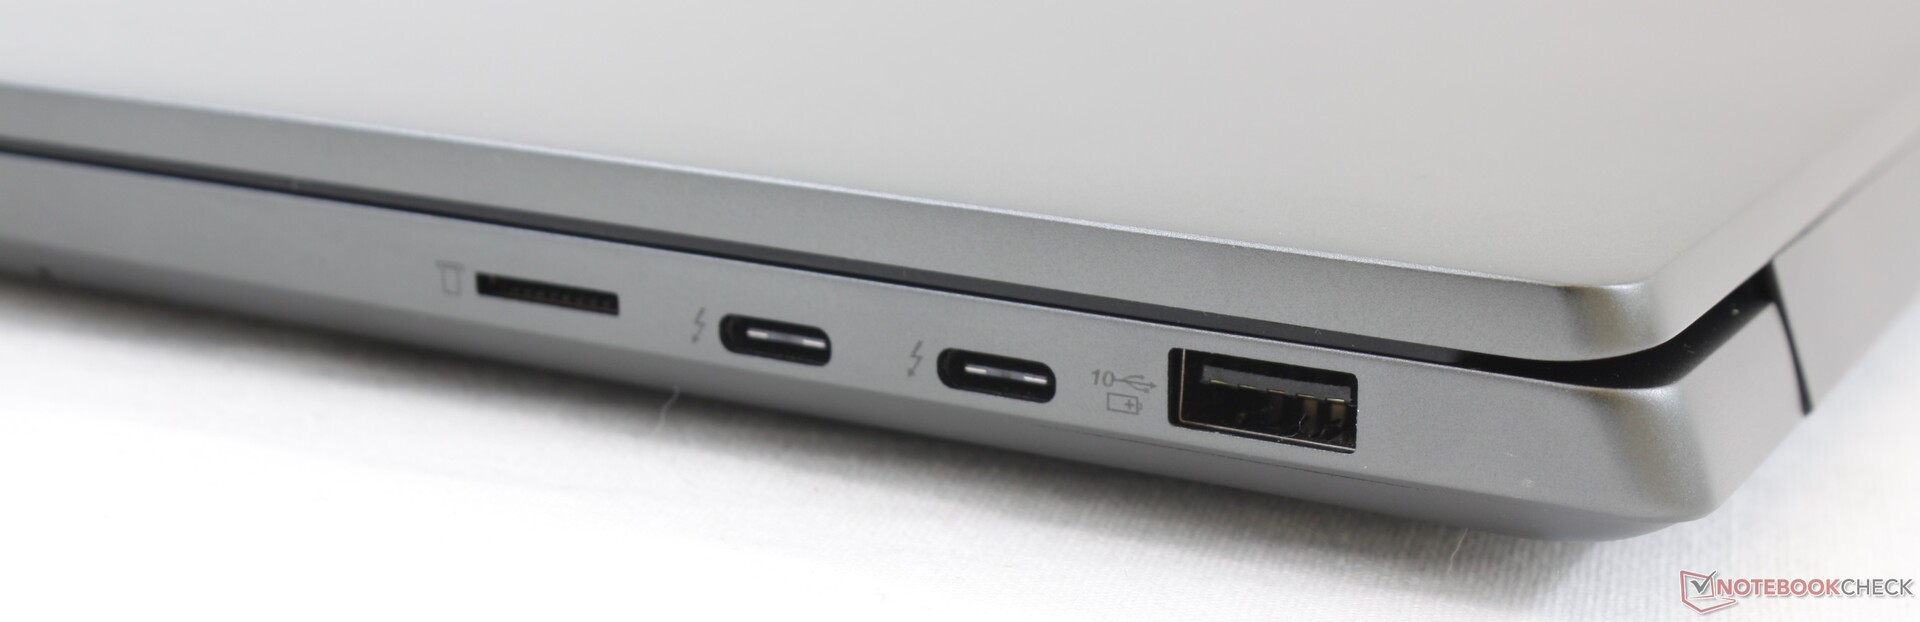
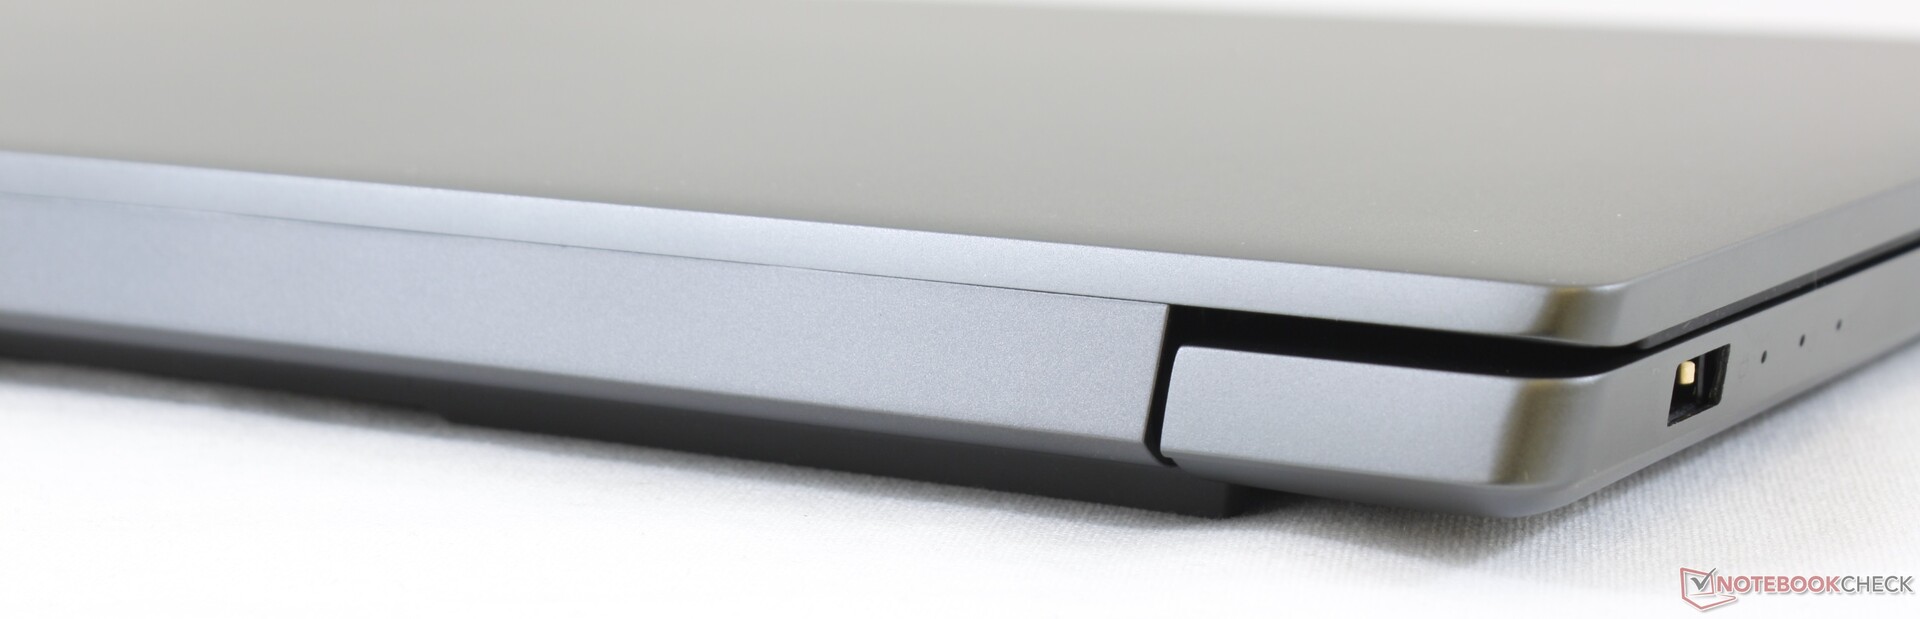
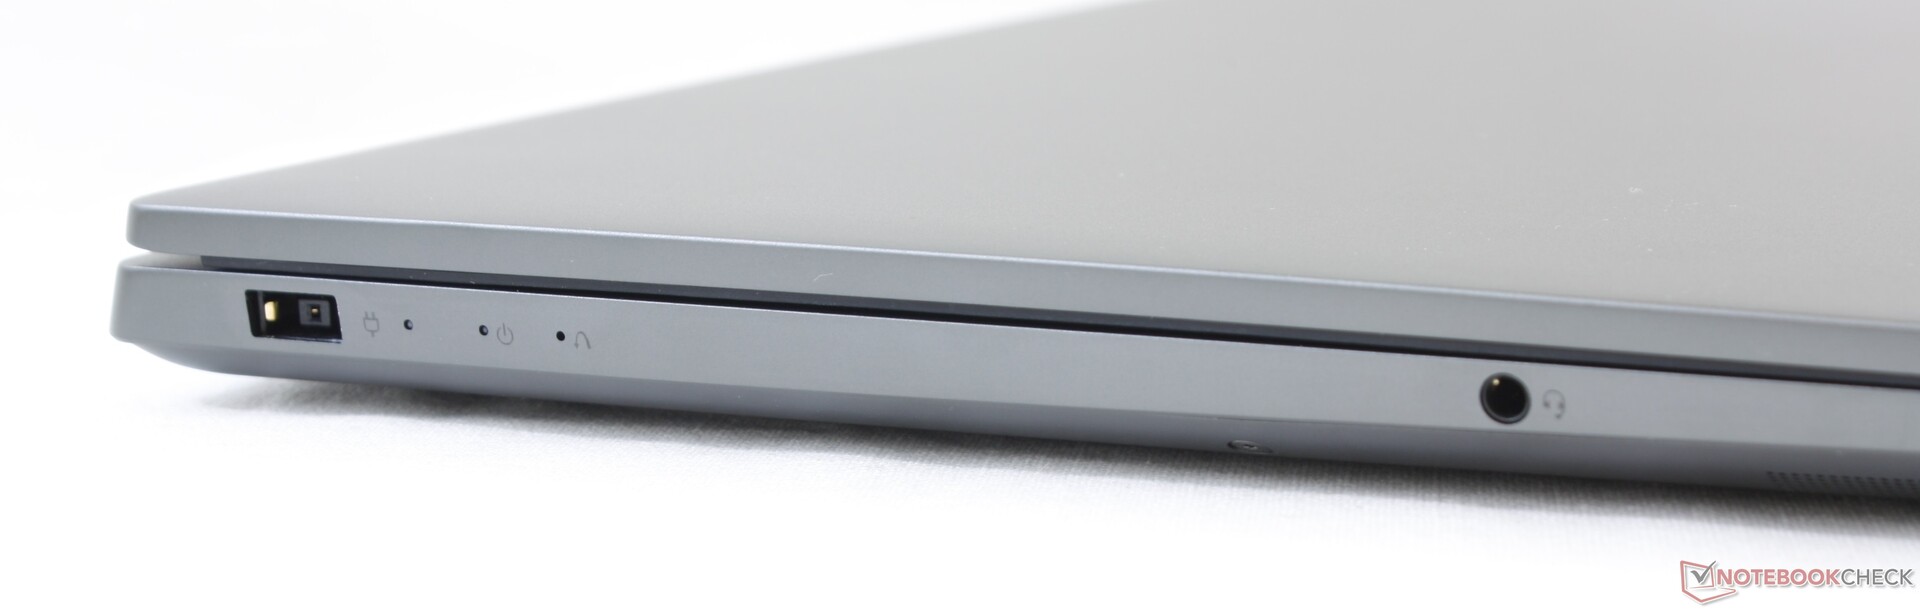
A Lenovo IdeaPad S740 középkategóriás és csúcskategóriás alkatrészek egyvelege. A Core i7 CPU, GeForce GTX GPU, világos 4K UHD kijelző, Samsung SSD, két Thunderbolt 3 port, és vékony keretek felveszik a versenyt a Dell XPS 15 és a HP Spectre x360 15-tel, amelyekkel a Lenovo versengeni próbál. Mindeközben, a lapos billentyűzet, a korlátozott portválaszték és az aránylag hajlékony váz inkább egy olcsó IdeaPad-ot tükröznek. A Lenovo valamivel olcsóbb, mint a Dell és a HP, ha ugyanazzal a Core i7-9750H CPU-val és GTX 1650/1650 Max-Q GPU-val van konfigurálva, viszont rosszabb gépelési élményt és gyengébb felépítést kapunk vele.
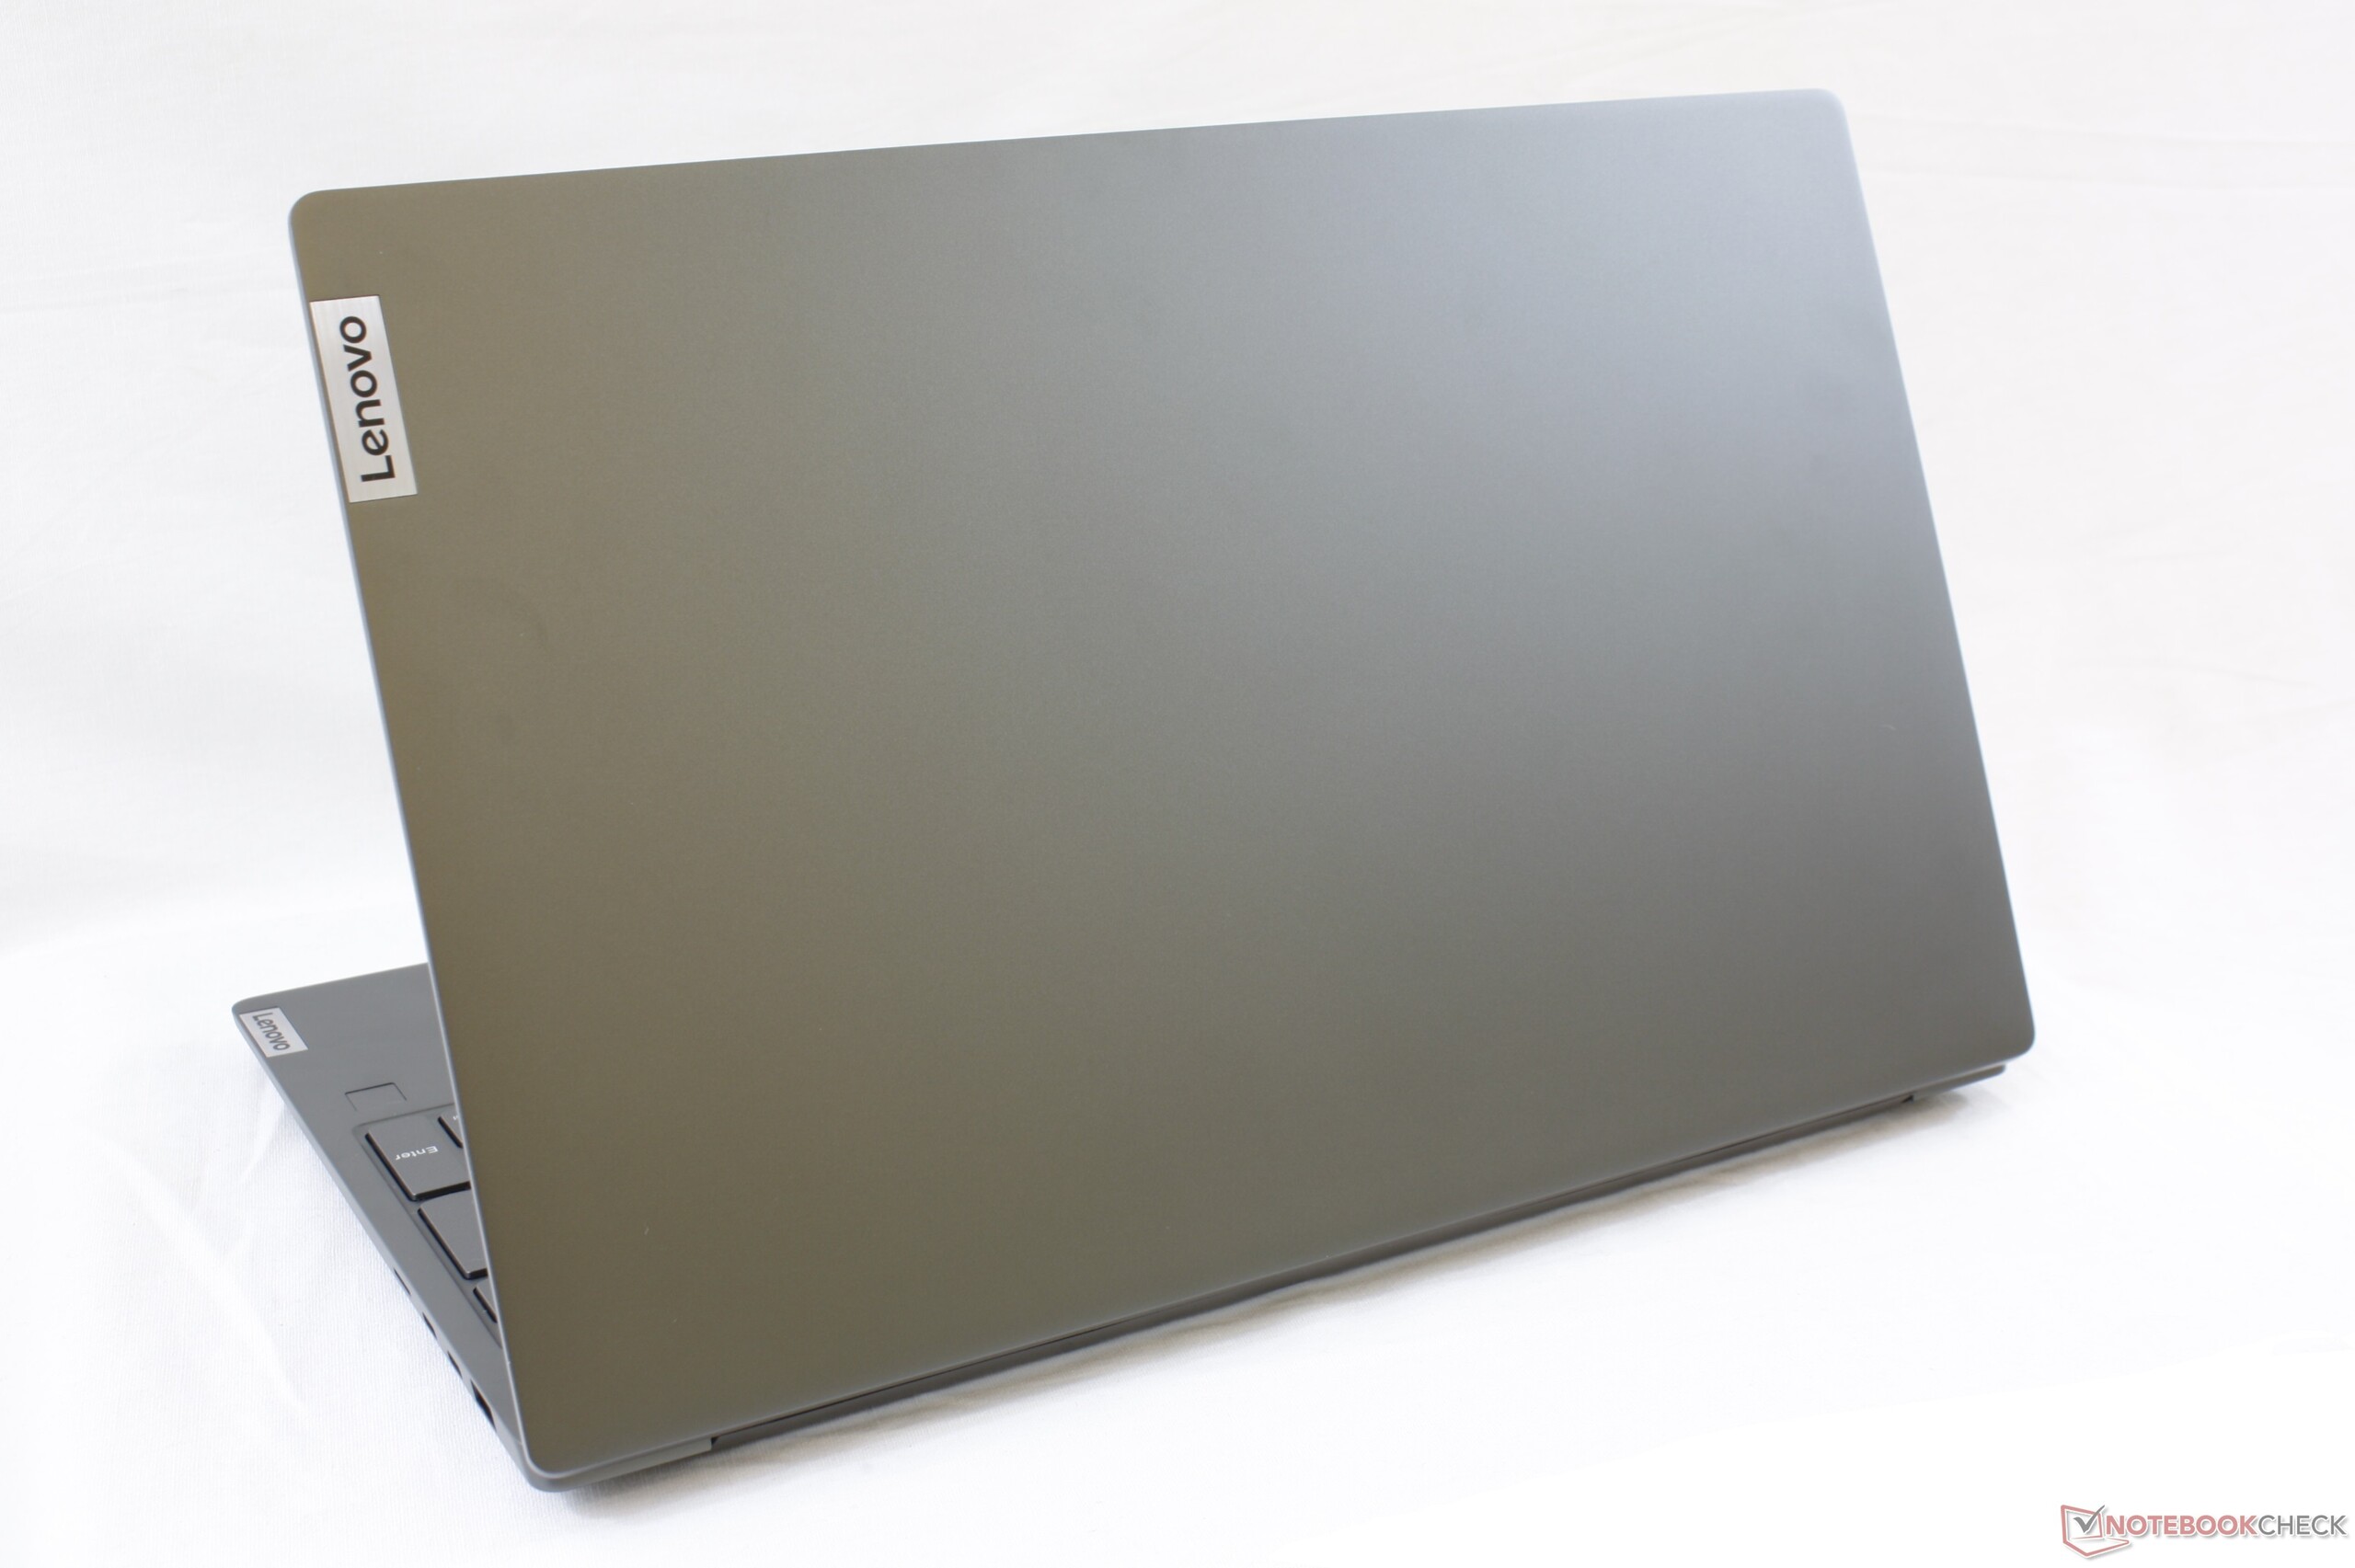
Más IdeaPad modellekhez képest viszont az S740 egyértelműen kategóriájának a csúcsa, mind vizuálisan, mind pedig a teljesítményt illetően. Erős, mint egy belépőszintű gamer gép, anélkül, hogy vaskos vagy rikító megjelenésű lenne, ami ezeket gyakran jellemzi. Így a rendszer nagyobb egyensúlyt teremt a játék, az iroda, az utazás és az ár között, mint más alternatívák ebben az árban.
Drágább, mint a tipikus IdeaPad, ugyanakkor olcsóbb, mint a Dell XPS vagy a HP Spectre. Az IdeaPad S740 azoknak való, akik szeretnék egy csúcskategóriás multimédiás gép teljesítményét, anélkül, hogy túl sokat feláldoznának a látvány és a hordozhatóság terén.
Lenovo IdeaPad S740-15IRH
- 01/25/2020 v7 (old)
Allen Ngo
Price comparison

