MSI GE75 Raider 9SG (Core i9-9880H, RTX 2080) Laptop rövid értékelés

| SD Card Reader | |
| average JPG Copy Test (av. of 3 runs) | |
| Dell XPS 15 9570 Core i9 UHD (Toshiba Exceria Pro SDXC 64 GB UHS-II) | |
| MSI GT75 8RG-090 Titan (Toshiba Exceria Pro SDXC 64 GB UHS-II) | |
| MSI GE75 9SG (Toshiba Exceria Pro SDXC 64 GB UHS-II) | |
| MSI GE73 8RF-008 Raider RGB (Toshiba Exceria Pro SDXC 64 GB UHS-II) | |
| maximum AS SSD Seq Read Test (1GB) | |
| Dell XPS 15 9570 Core i9 UHD (Toshiba Exceria Pro SDXC 64 GB UHS-II) | |
| MSI GT75 8RG-090 Titan (Toshiba Exceria Pro SDXC 64 GB UHS-II) | |
| MSI GE75 9SG (Toshiba Exceria Pro SDXC 64 GB UHS-II) | |
| MSI GE73 8RF-008 Raider RGB (Toshiba Exceria Pro SDXC 64 GB UHS-II) | |
| Networking | |
| iperf3 transmit AX12 | |
| MSI GT75 8RG-090 Titan | |
| MSI GE75 9SG | |
| Acer Predator Triton 700 | |
| Asus TUF FX705DY-AU072 | |
| iperf3 receive AX12 | |
| MSI GT75 8RG-090 Titan | |
| Acer Predator Triton 700 | |
| MSI GE75 9SG | |
| Asus TUF FX705DY-AU072 | |
| |||||||||||||||||||||||||
Fényerő megoszlás: 89 %
Centrumban: 400.7 cd/m²
Kontraszt: 1179:1 (Fekete: 0.34 cd/m²)
ΔE ColorChecker Calman: 1.33 | ∀{0.5-29.43 Ø4.71}
calibrated: 1.39
ΔE Greyscale Calman: 1.3 | ∀{0.09-98 Ø4.96}
92.1% sRGB (Argyll 1.6.3 3D)
58.2% AdobeRGB 1998 (Argyll 1.6.3 3D)
63.5% AdobeRGB 1998 (Argyll 3D)
92% sRGB (Argyll 3D)
61.5% Display P3 (Argyll 3D)
Gamma: 2.24
CCT: 6735 K
| MSI GE75 9SG Chi Mei N173HCE-G33, AHVA, 17.3", 1920x1080 | Asus TUF FX705DY-AU072 AU Optronics B173HAN04.2, IPS, 17.3", 1920x1080 | Asus Zephyrus S GX701GX B173HAN04.0 (AUO409D), IPS, 17.3", 1920x1080 | MSI GT75 8RG-090 Titan CMN N173HHE-G32 (CMN1747), TN, 17.3", 1920x1080 | Acer Predator Triton 700 AUO B156HAN04.2 (AUO42ED), IPS, 15.6", 1920x1080 | MSI GE73 8RF-008 Raider RGB Chi Mei N173HHE-G32 (CMN1747), TN WLED, 17.3", 1920x1080 | |
|---|---|---|---|---|---|---|
| Display | -1% | 31% | -1% | 31% | ||
| Display P3 Coverage (%) | 61.5 | 62.9 2% | 90.9 48% | 62.5 2% | 90.8 48% | |
| sRGB Coverage (%) | 92 | 87.8 -5% | 100 9% | 88.7 -4% | 99.9 9% | |
| AdobeRGB 1998 Coverage (%) | 63.5 | 63.9 1% | 86.2 36% | 63.5 0% | 85.8 35% | |
| Response Times | -383% | -23% | 2% | -435% | -198% | |
| Response Time Grey 50% / Grey 80% * (ms) | 7.2 ? | 40 ? -456% | 7.2 ? -0% | 8 ? -11% | 44.8 ? -522% | 28 ? -289% |
| Response Time Black / White * (ms) | 6.6 ? | 27 ? -309% | 9.6 ? -45% | 5.6 ? 15% | 29.6 ? -348% | 13.6 ? -106% |
| PWM Frequency (Hz) | 26040 ? | 26000 ? | 25000 ? | |||
| Screen | -34% | -17% | -14% | -94% | -40% | |
| Brightness middle (cd/m²) | 400.7 | 322 -20% | 288 -28% | 240 -40% | 291 -27% | 273 -32% |
| Brightness (cd/m²) | 372 | 303 -19% | 287 -23% | 248 -33% | 277 -26% | 273 -27% |
| Brightness Distribution (%) | 89 | 84 -6% | 91 2% | 83 -7% | 84 -6% | 90 1% |
| Black Level * (cd/m²) | 0.34 | 0.32 6% | 0.2 41% | 0.22 35% | 0.22 35% | 0.26 24% |
| Contrast (:1) | 1179 | 1006 -15% | 1440 22% | 1091 -7% | 1323 12% | 1050 -11% |
| Colorchecker dE 2000 * | 1.33 | 2.97 -123% | 2.33 -75% | 2.14 -61% | 5.52 -315% | 3.52 -165% |
| Colorchecker dE 2000 max. * | 3.51 | 5.08 -45% | 5.34 -52% | 5.04 -44% | 10.72 -205% | 6.34 -81% |
| Colorchecker dE 2000 calibrated * | 1.39 | 2.29 -65% | 2.47 -78% | 1.54 -11% | 2.09 -50% | |
| Greyscale dE 2000 * | 1.3 | 2.26 -74% | 1.19 8% | 1.62 -25% | 6.59 -407% | 3.11 -139% |
| Gamma | 2.24 98% | 2.45 90% | 2.41 91% | 2.28 96% | 2.44 90% | 2.43 91% |
| CCT | 6735 97% | 6892 94% | 6710 97% | 6846 95% | 7816 83% | 6999 93% |
| Color Space (Percent of AdobeRGB 1998) (%) | 58.2 | 57 -2% | 57 -2% | 77 32% | 58 0% | 76 31% |
| Color Space (Percent of sRGB) (%) | 92.1 | 87 -6% | 88 -4% | 100 9% | 89 -3% | 100 9% |
| Teljes átlag (program / beállítások) | -209% /
-87% | -14% /
-15% | 6% /
-3% | -177% /
-121% | -69% /
-46% |
* ... a kisebb jobb
Megjelenítési válaszidők
| ↔ Válaszidő Fekete-fehér | ||
|---|---|---|
| 6.6 ms ... emelkedés és süllyedés ↘ kombinálva | ↗ 3.2 ms emelkedés | 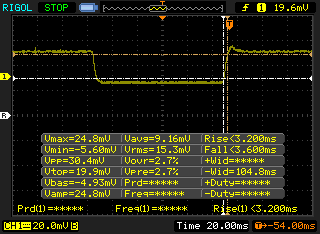 |
| ↘ 3.4 ms ősz | ||
| A képernyő tesztjeinkben nagyon gyors reakciósebességet mutatott, és nagyon jól használható gyors tempójú játékokhoz. Összehasonlításképpen, az összes tesztelt eszköz 0.1 (minimum) és 240 (maximum) ms között mozog. » 21 % of all devices are better. Ez azt jelenti, hogy a mért válaszidő jobb, mint az összes vizsgált eszköz átlaga (19.8 ms). | ||
| ↔ Válaszidő 50% szürke és 80% szürke között | ||
| 7.2 ms ... emelkedés és süllyedés ↘ kombinálva | ↗ 3.8 ms emelkedés | 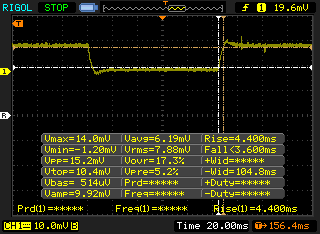 |
| ↘ 3.4 ms ősz | ||
| A képernyő tesztjeinkben nagyon gyors reakciósebességet mutatott, és nagyon jól használható gyors tempójú játékokhoz. Összehasonlításképpen, az összes tesztelt eszköz 0.165 (minimum) és 636 (maximum) ms között mozog. » 20 % of all devices are better. Ez azt jelenti, hogy a mért válaszidő jobb, mint az összes vizsgált eszköz átlaga (31 ms). | ||
Képernyő villogása / PWM (impulzusszélesség-moduláció)
| Képernyő villogása / PWM észlelve | 26040 Hz | ≤ 10 % fényerő beállítása | 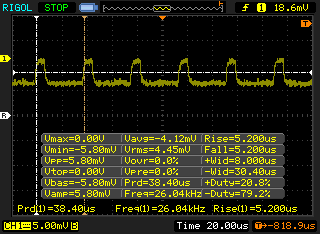 |
A kijelző háttérvilágítása 26040 Hz-en villog (a legrosszabb esetben, pl. PWM használatával) Villódzás észlelve a 10 % vagy annál kisebb fényerő-beállításnál. E fényerő-beállítás felett nem lehet villogás vagy PWM. A 26040 Hz frekvenciája meglehetősen magas, így a legtöbb PWM-re érzékeny felhasználó nem észlel semmilyen villogást. Összehasonlításképpen: az összes tesztelt eszköz 52 %-a nem használja a PWM-et a kijelző elsötétítésére. Ha PWM-et észleltek, akkor átlagosan 7757 (minimum: 5 - maximum: 343500) Hz-t mértek. | |||
| Cinebench R15 | |
| CPU Single 64Bit | |
| Eurocom Sky X7C i9-9900K | |
| MSI GT75 8RG-090 Titan | |
| Eurocom Sky X4C | |
| Átlagos Intel Core i9-9880H (181 - 198, n=11) | |
| Eurocom Tornado F5 | |
| MSI GE75 9SG | |
| MSI GE75 8SG Raider | |
| Acer Aspire Nitro 5 AN515-54-53Z2 | |
| Gigabyte Aero 15 Classic-XA | |
| Asus TUF FX705DY-AU072 | |
| CPU Multi 64Bit | |
| Eurocom Sky X7C i9-9900K | |
| MSI GE75 9SG | |
| Átlagos Intel Core i9-9880H (1317 - 1721, n=11) | |
| MSI GT75 8RG-090 Titan | |
| Eurocom Sky X4C | |
| Gigabyte Aero 15 Classic-XA | |
| MSI GE75 8SG Raider | |
| Eurocom Tornado F5 | |
| Acer Aspire Nitro 5 AN515-54-53Z2 | |
| Asus TUF FX705DY-AU072 | |
| Cinebench R20 | |
| CPU (Multi Core) | |
| MSI GE75 9SG | |
| Átlagos Intel Core i9-9880H (2953 - 3712, n=7) | |
| Gigabyte Aero 15 Classic-XA | |
| Asus TUF FX705DY-AU072 | |
| CPU (Single Core) | |
| Átlagos Intel Core i9-9880H (441 - 474, n=7) | |
| MSI GE75 9SG | |
| Gigabyte Aero 15 Classic-XA | |
| Asus TUF FX705DY-AU072 | |
| PCMark 10 | |
| Score | |
| MSI GT75 8RG-090 Titan | |
| Aorus X9 DT | |
| MSI GE75 9SG | |
| MSI GE75 8SG Raider | |
| Asus TUF FX705DY-AU072 | |
| Essentials | |
| Aorus X9 DT | |
| MSI GT75 8RG-090 Titan | |
| MSI GE75 9SG | |
| MSI GE75 8SG Raider | |
| Asus TUF FX705DY-AU072 | |
| Productivity | |
| MSI GT75 8RG-090 Titan | |
| MSI GE75 9SG | |
| Aorus X9 DT | |
| MSI GE75 8SG Raider | |
| Asus TUF FX705DY-AU072 | |
| Digital Content Creation | |
| Aorus X9 DT | |
| MSI GT75 8RG-090 Titan | |
| MSI GE75 9SG | |
| MSI GE75 8SG Raider | |
| Asus TUF FX705DY-AU072 | |
| PCMark 8 | |
| Home Score Accelerated v2 | |
| Aorus X9 DT | |
| MSI GT75 8RG-090 Titan | |
| MSI GE75 8SG Raider | |
| MSI GE75 9SG | |
| Asus TUF FX705DY-AU072 | |
| Work Score Accelerated v2 | |
| Aorus X9 DT | |
| MSI GE75 9SG | |
| MSI GT75 8RG-090 Titan | |
| MSI GE75 8SG Raider | |
| Asus TUF FX705DY-AU072 | |
| PCMark 8 Home Score Accelerated v2 | 4550 pontok | |
| PCMark 8 Work Score Accelerated v2 | 6004 pontok | |
| PCMark 10 Score | 6306 pontok | |
Segítség | ||
| MSI GE75 9SG Samsung SSD PM981 MZVLB1T0HALR | Asus TUF FX705DY-AU072 Kingston RBUSNS8154P3512GJ | Asus Zephyrus S GX701GX Samsung SSD PM981 MZVLB1T0HALR | MSI GT75 8RG-090 Titan 2x Samsung PM961 MZVLW256HEHP (RAID 0) | Acer Predator Triton 700 2x SK Hynix Canvas SC300 512GB M.2 (HFS512G39MND) (RAID 0) | MSI GE73 8RF-008 Raider RGB Toshiba HG6 THNSNJ256G8NY | |
|---|---|---|---|---|---|---|
| AS SSD | -28% | 9% | 10% | -2% | -84% | |
| Seq Read (MB/s) | 1358 | 1419 4% | 911 -33% | 3058 125% | 2517 85% | 511 -62% |
| Seq Write (MB/s) | 2381 | 828 -65% | 2347 -1% | 2196 -8% | 2372 0% | 425.7 -82% |
| 4K Read (MB/s) | 27.02 | 35.71 32% | 53 96% | 38.37 42% | 41.47 53% | 14.07 -48% |
| 4K Write (MB/s) | 89.2 | 86.8 -3% | 122.5 37% | 97.7 10% | 93 4% | 38.34 -57% |
| 4K-64 Read (MB/s) | 1642 | 848 -48% | 1577 -4% | 1347 -18% | 1057 -36% | 351.4 -79% |
| 4K-64 Write (MB/s) | 1799 | 708 -61% | 1734 -4% | 1236 -31% | 913 -49% | 172.7 -90% |
| Access Time Read * (ms) | 0.067 | 0.063 6% | 0.08 -19% | 0.056 16% | 0.062 7% | 0.235 -251% |
| Access Time Write * (ms) | 0.05 | 0.044 12% | 0.031 38% | 0.038 24% | 0.041 18% | 0.097 -94% |
| Score Read (Points) | 1805 | 1026 -43% | 1721 -5% | 1691 -6% | 1350 -25% | 417 -77% |
| Score Write (Points) | 2127 | 878 -59% | 2091 -2% | 1553 -27% | 1243 -42% | 254 -88% |
| Score Total (Points) | 4899 | 2405 -51% | 4771 -3% | 4066 -17% | 3282 -33% | 881 -82% |
| Copy ISO MB/s (MB/s) | 3193 | 687 -78% | 412.5 -87% | |||
| Copy Program MB/s (MB/s) | 198.2 | 234.7 18% | 192.9 -3% | |||
| Copy Game MB/s (MB/s) | 1054 | 474.7 -55% | 295.5 -72% |
* ... a kisebb jobb

| 3DMark | |
| 1920x1080 Fire Strike Graphics | |
| MSI RTX 2080 Gaming X Trio | |
| MSI GE75 8SG Raider | |
| MSI GE75 9SG | |
| Asus Zephyrus S GX701GX | |
| Schenker XMG Ultra 17 | |
| Acer Predator Triton 700 | |
| MSI GE73 8RF-008 Raider RGB | |
| Gigabyte Aero 15 Classic-XA | |
| MSI GL73 8SE-010US | |
| Schenker Compact 15 | |
| Acer Aspire Nitro 5 AN515-54-53Z2 | |
| Dell XPS 15 9570 Core i9 UHD | |
| Asus TUF FX705DY-AU072 | |
| 2560x1440 Time Spy Graphics | |
| MSI RTX 2080 Gaming X Trio | |
| MSI GE75 8SG Raider | |
| MSI GE75 9SG | |
| Asus Zephyrus S GX701GX | |
| Schenker XMG Ultra 17 | |
| Gigabyte Aero 15 Classic-XA | |
| MSI GL73 8SE-010US | |
| MSI GE73 8RF-008 Raider RGB | |
| Schenker Compact 15 | |
| Asus TUF FX705DY-AU072 | |
| 2560x1440 Port Royal Graphics | |
| MSI GE75 9SG | |
| Asus Zephyrus S GX701GX | |
| Gigabyte Aero 15 Classic-XA | |
| MSI GL73 8SE-010US | |
| 2560x1440 Time Spy Score | |
| MSI RTX 2080 Gaming X Trio | |
| MSI GE75 9SG | |
| MSI GE75 8SG Raider | |
| Asus Zephyrus S GX701GX | |
| Schenker XMG Ultra 17 | |
| Gigabyte Aero 15 Classic-XA | |
| MSI GE73 8RF-008 Raider RGB | |
| MSI GL73 8SE-010US | |
| Schenker Compact 15 | |
| Asus TUF FX705DY-AU072 | |
| 3DMark 11 | |
| 1280x720 Performance GPU | |
| MSI RTX 2080 Gaming X Trio | |
| MSI GE75 9SG | |
| MSI GE75 8SG Raider | |
| Asus Zephyrus S GX701GX | |
| Schenker XMG Ultra 17 | |
| Acer Predator Triton 700 | |
| MSI GE73 8RF-008 Raider RGB | |
| Gigabyte Aero 15 Classic-XA | |
| MSI GL73 8SE-010US | |
| Schenker Compact 15 | |
| Acer Aspire Nitro 5 AN515-54-53Z2 | |
| Dell XPS 15 9570 Core i9 UHD | |
| Asus TUF FX705DY-AU072 | |
| 1280x720 Performance Combined | |
| MSI GE75 9SG | |
| MSI RTX 2080 Gaming X Trio | |
| Schenker Compact 15 | |
| Schenker XMG Ultra 17 | |
| Asus Zephyrus S GX701GX | |
| Gigabyte Aero 15 Classic-XA | |
| MSI GE75 8SG Raider | |
| MSI GE73 8RF-008 Raider RGB | |
| Acer Aspire Nitro 5 AN515-54-53Z2 | |
| MSI GL73 8SE-010US | |
| Acer Predator Triton 700 | |
| Dell XPS 15 9570 Core i9 UHD | |
| Asus TUF FX705DY-AU072 | |
| 3DMark 06 Standard Score | 39973 pontok | |
| 3DMark 11 Performance | 27116 pontok | |
| 3DMark Cloud Gate Standard Score | 41840 pontok | |
| 3DMark Fire Strike Score | 18947 pontok | |
| 3DMark Time Spy Score | 9266 pontok | |
Segítség | ||
| Shadow of the Tomb Raider - 1920x1080 Highest Preset AA:T | |
| MSI RTX 2080 Gaming X Trio | |
| MSI GE75 9SG | |
| Átlagos NVIDIA GeForce RTX 2080 Mobile (69 - 124, n=7) | |
| MSI GE75 8SG Raider | |
| Asus Zephyrus S GX701GX | |
| MSI GL73 8SE-010US | |
| Schenker Compact 15 | |
| Acer Aspire Nitro 5 AN515-54-53Z2 | |
| alacsony | közepes | magas | ultra | |
|---|---|---|---|---|
| BioShock Infinite (2013) | 341.4 | 303.9 | 280.7 | 190.9 |
| The Witcher 3 (2015) | 289.7 | 250.1 | 173 | 95.3 |
| Rise of the Tomb Raider (2016) | 250.6 | 187.2 | 161.7 | 144.3 |
| Shadow of the Tomb Raider (2018) | 146 | 120 | 115 | 109 |
| MSI GE75 9SG GeForce RTX 2080 Mobile, i9-9880H, Samsung SSD PM981 MZVLB1T0HALR | MSI GE75 8SG Raider GeForce RTX 2080 Mobile, i7-8750H, Kingston RBUSNS8154P3512GJ | Aorus X9 DT GeForce GTX 1080 Mobile, i9-8950HK, Transcend TS1TMTE850 | Asus Zephyrus S GX701GX GeForce RTX 2080 Max-Q, i7-8750H, Samsung SSD PM981 MZVLB1T0HALR | MSI GT75 8RG-090 Titan GeForce GTX 1080 Mobile, i9-8950HK, 2x Samsung PM961 MZVLW256HEHP (RAID 0) | MSI GE73 8RF-008 Raider RGB GeForce GTX 1070 Mobile, i7-8750H, Toshiba HG6 THNSNJ256G8NY | |
|---|---|---|---|---|---|---|
| Noise | -9% | -18% | -1% | -9% | -3% | |
| off / környezet * (dB) | 28.2 | 30 -6% | 30 -6% | 29 -3% | 30 -6% | 30 -6% |
| Idle Minimum * (dB) | 30.4 | 30 1% | 36 -18% | 29 5% | 32 -5% | 32 -5% |
| Idle Average * (dB) | 30.4 | 34 -12% | 37 -22% | 32 -5% | 34 -12% | 33 -9% |
| Idle Maximum * (dB) | 33.4 | 37 -11% | 43 -29% | 33 1% | 37 -11% | 34 -2% |
| Load Average * (dB) | 37.1 | 52 -40% | 50 -35% | 47 -27% | 43 -16% | 41 -11% |
| Witcher 3 ultra * (dB) | 54.2 | 53 2% | 57 -5% | 49 10% | 57 -5% | 50 8% |
| Load Maximum * (dB) | 56.4 | 54 4% | 61 -8% | 51 10% | 62 -10% | 54 4% |
* ... a kisebb jobb
Zajszint
| Üresjárat |
| 30.4 / 30.4 / 33.4 dB(A) |
| Terhelés |
| 37.1 / 56.4 dB(A) |
 | ||
30 dB csendes 40 dB(A) hallható 50 dB(A) hangos |
||
min: | ||
(-) A felső oldalon a maximális hőmérséklet 48.8 °C / 120 F, összehasonlítva a 40.4 °C / 105 F átlagával , 21.2 és 68.8 °C között a Gaming osztálynál.
(-) Az alsó maximum 52 °C / 126 F-ig melegszik fel, összehasonlítva a 43.2 °C / 110 F átlagával
(+) Üresjáratban a felső oldal átlagos hőmérséklete 31.8 °C / 89 F, összehasonlítva a 33.9 °C / ### eszközátlaggal class_avg_f### F.
(-) A The Witcher 3 játék során a felső oldal átlaghőmérséklete 40 °C / 104 F, összehasonlítva a 33.9 °C / ## eszközátlaggal #class_avg_f### F.
(+) A csuklótámasz és az érintőpad eléri a bőr maximális hőmérsékletét (32 °C / 89.6 F), ezért nem forrók.
(-) A hasonló eszközök csuklótámasz területének átlagos hőmérséklete 28.8 °C / 83.8 F volt (-3.2 °C / -5.8 F).
MSI GE75 9SG hangelemzés
(+) | a hangszórók viszonylag hangosan tudnak játszani (92.8 dB)
Basszus 100 - 315 Hz
(±) | csökkentett basszus – átlagosan 12.2%-kal alacsonyabb, mint a medián
(±) | a basszus linearitása átlagos (8.7% delta az előző frekvenciához)
Közepes 400-2000 Hz
(±) | magasabb középértékek – átlagosan 6.7%-kal magasabb, mint a medián
(±) | a középpontok linearitása átlagos (11.5% delta az előző gyakorisághoz)
Maximum 2-16 kHz
(+) | kiegyensúlyozott csúcsok – csak 2.9% választja el a mediántól
(±) | a csúcsok linearitása átlagos (7.6% delta az előző gyakorisághoz)
Összességében 100 - 16.000 Hz
(±) | az általános hang linearitása átlagos (16.5% eltérés a mediánhoz képest)
Ugyanazon osztályhoz képest
» 42%Ebben az osztályban az összes tesztelt eszköz %-a jobb volt, 7% hasonló, 51%-kal rosszabb
» A legjobb delta értéke 6%, az átlag 18%, a legrosszabb 132% volt
Az összes tesztelt eszközzel összehasonlítva
» 28% az összes tesztelt eszköz jobb volt, 6% hasonló, 66%-kal rosszabb
» A legjobb delta értéke 4%, az átlag 23%, a legrosszabb 134% volt
Apple MacBook 12 (Early 2016) 1.1 GHz hangelemzés
(+) | a hangszórók viszonylag hangosan tudnak játszani (83.6 dB)
Basszus 100 - 315 Hz
(±) | csökkentett basszus – átlagosan 11.3%-kal alacsonyabb, mint a medián
(±) | a basszus linearitása átlagos (14.2% delta az előző frekvenciához)
Közepes 400-2000 Hz
(+) | kiegyensúlyozott középpontok – csak 2.4% választja el a mediántól
(+) | a középpontok lineárisak (5.5% delta az előző frekvenciához)
Maximum 2-16 kHz
(+) | kiegyensúlyozott csúcsok – csak 2% választja el a mediántól
(+) | a csúcsok lineárisak (4.5% delta az előző frekvenciához képest)
Összességében 100 - 16.000 Hz
(+) | általános hangzás lineáris (10.2% eltérés a mediánhoz képest)
Ugyanazon osztályhoz képest
» 7%Ebben az osztályban az összes tesztelt eszköz %-a jobb volt, 2% hasonló, 90%-kal rosszabb
» A legjobb delta értéke 5%, az átlag 18%, a legrosszabb 53% volt
Az összes tesztelt eszközzel összehasonlítva
» 5% az összes tesztelt eszköz jobb volt, 1% hasonló, 94%-kal rosszabb
» A legjobb delta értéke 4%, az átlag 23%, a legrosszabb 134% volt
| Kikapcsolt állapot / Készenlét | |
| Üresjárat | |
| Terhelés |
|
Kulcs:
min: | |
| MSI GE75 9SG i9-9880H, GeForce RTX 2080 Mobile, Samsung SSD PM981 MZVLB1T0HALR, AHVA, 1920x1080, 17.3" | MSI GE75 8SG Raider i7-8750H, GeForce RTX 2080 Mobile, Kingston RBUSNS8154P3512GJ, AHVA, 1920x1080, 17.3" | Asus Zephyrus S GX701GX i7-8750H, GeForce RTX 2080 Max-Q, Samsung SSD PM981 MZVLB1T0HALR, IPS, 1920x1080, 17.3" | MSI GT75 8RG-090 Titan i9-8950HK, GeForce GTX 1080 Mobile, 2x Samsung PM961 MZVLW256HEHP (RAID 0), TN, 1920x1080, 17.3" | Acer Predator Triton 700 i7-7700HQ, GeForce GTX 1080 Max-Q, 2x SK Hynix Canvas SC300 512GB M.2 (HFS512G39MND) (RAID 0), IPS, 1920x1080, 15.6" | MSI GE73 8RF-008 Raider RGB i7-8750H, GeForce GTX 1070 Mobile, Toshiba HG6 THNSNJ256G8NY, TN WLED, 1920x1080, 17.3" | |
|---|---|---|---|---|---|---|
| Power Consumption | 19% | -3% | -61% | -31% | 4% | |
| Idle Minimum * (Watt) | 13.9 | 7 50% | 19 -37% | 31 -123% | 28 -101% | 15 -8% |
| Idle Average * (Watt) | 18.8 | 15 20% | 22 -17% | 35 -86% | 33 -76% | 20 -6% |
| Idle Maximum * (Watt) | 23.1 | 22 5% | 30 -30% | 45 -95% | 41 -77% | 26 -13% |
| Load Average * (Watt) | 112.3 | 92 18% | 104 7% | 130 -16% | 94 16% | 97 14% |
| Witcher 3 ultra * (Watt) | 231 | 207 10% | 167 28% | 268 -16% | 160 31% | 186 19% |
| Load Maximum * (Watt) | 291.5 | 254 13% | 203 30% | 374 -28% | 222 24% | 239 18% |
* ... a kisebb jobb
| MSI GE75 9SG i9-9880H, GeForce RTX 2080 Mobile, 65 Wh | Asus TUF FX705DY-AU072 R5 3550H, Radeon RX 560X (Laptop), 64 Wh | Asus Zephyrus S GX701GX i7-8750H, GeForce RTX 2080 Max-Q, 76 Wh | Acer Predator Triton 700 i7-7700HQ, GeForce GTX 1080 Max-Q, 54 Wh | MSI GE73 8RF-008 Raider RGB i7-8750H, GeForce GTX 1070 Mobile, 51 Wh | MSI GE75 8SG Raider i7-8750H, GeForce RTX 2080 Mobile, 65 Wh | |
|---|---|---|---|---|---|---|
| Akkumulátor üzemidő | 47% | -22% | -51% | -37% | -4% | |
| WiFi v1.3 (h) | 4.9 | 7.2 47% | 3.8 -22% | 2.4 -51% | 3.1 -37% | 4.7 -4% |
| Reader / Idle (h) | 12.6 | 5 | 2.5 | 5.1 | 7.8 | |
| Load (h) | 2 | 0.9 | 1.2 | 0.6 | 0.9 | |
| Witcher 3 ultra (h) | 0.8 |
Pro
Kontra
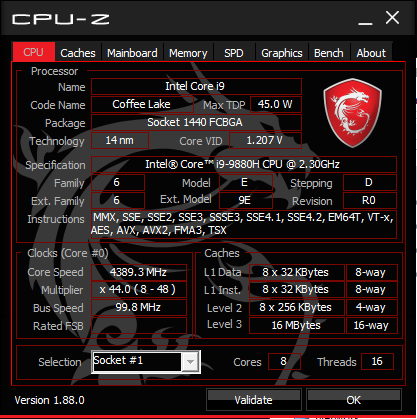
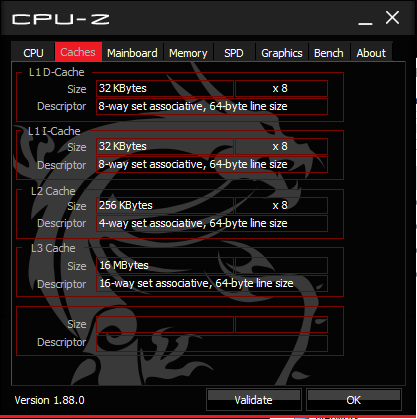
A Core i9-9880H olyan, amilyen a Core i9-8950HK kellett volna legyen. A két extra mag biztosítja a szükséges szolid teljesítménynövekedést a Core i7-8750H-hoz és a Core i7-9750H-hoz képest. Az átlagos i7-8750H körülbelül 36 százalékkal lassúbb, még mielőtt teljesítmény fojtás lépne fel.
A hátrányok azok, amiket egy gyorsabb, azonos architektúrán alapuló CPU-tól várhatunk. Nevezetesen, a mag hőmérséklet és az energiafogyasztás magasabbak, amikor a CPU maximálisan stresszelve van. Az i9-9880H 90 °C-on stabilizálódik Prime95 futtatása közben, összehasonlítva 73 °C-kal az i7-8750H SKU esetében. Emellett játék közben 231 W a fogyasztás szemben a tavalyi GE73 8SG 207 W-os fogyasztásával. Azok az alkalmazások, amelyek nem használják ki teljes mértékben mind a nyolc magot, kisebb teljesítménynövekedést fognak kapni a hatmagos Core i7 sorozathoz képest.
Persze a GE75 9SG csak egy példája a Core i9-9880H-nak. A i9-9880H rendkívül széles órajel tartománya (2.3 - 3.8 GHz) azt jelenti, hogy más OEM-ek ugyanazt a CPU-t alacsonyabb órajeleken alkalmazhatják potenciálisan alacsonyabb teljesítményért, mint amit mi itt tapasztaltunk. Ennek ellenére a 9. generációs Core i9 már most elsőre is nagyon ígéretesnek tűnik.
A rajongóknak érdemes felfigyelni a 9. generációs Core i9-re, különösen, ha nyolcmagos CPU-kra optimalizált alkalmazásokra támaszkodnak. A gamerek is nyerhetnek valamit az i9-9880H-n, habár jóval kevesebb, 10 százalék körüli teljesítménynövekedést kapnak a játékok többségében. Bármelyik esetet is nézzük, az új CPU jóval kedvezőbb helyzetben van, mint a tavalyi Core i9-8950HK.
MSI GE75 9SG
- 07/02/2020 v7 (old)
Allen Ngo
Price comparison

