MSI GE75 Raider 8SF (i7-8750H, RTX 2070) Laptop rövid értékelés


| SD Card Reader | |
| average JPG Copy Test (av. of 3 runs) | |
| MSI GE73VR 7RF Raider (Toshiba Exceria Pro SDXC 64 GB UHS-II) | |
| MSI GT75 8RG-090 Titan (Toshiba Exceria Pro SDXC 64 GB UHS-II) | |
| Asus ROG Strix Scar II GL704GW (Toshiba Exceria Pro SDXC 64 GB UHS-II) | |
| MSI GE75 8SF (Toshiba Exceria Pro SDXC 64 GB UHS-II) | |
| maximum AS SSD Seq Read Test (1GB) | |
| MSI GE73VR 7RF Raider (Toshiba Exceria Pro SDXC 64 GB UHS-II) | |
| MSI GT75 8RG-090 Titan (Toshiba Exceria Pro SDXC 64 GB UHS-II) | |
| Asus ROG Strix Scar II GL704GW (Toshiba Exceria Pro SDXC 64 GB UHS-II) | |
| MSI GE75 8SF (Toshiba Exceria Pro SDXC 64 GB UHS-II) | |
| Networking | |
| iperf3 transmit AX12 | |
| MSI GE75 8SF | |
| Asus Zephyrus S GX701GX | |
| Lenovo Legion Y740-17ICH | |
| Asus ROG Strix Scar II GL704GW | |
| iperf3 receive AX12 | |
| Asus Zephyrus S GX701GX | |
| MSI GE75 8SF | |
| Lenovo Legion Y740-17ICH | |
| Asus ROG Strix Scar II GL704GW | |
| |||||||||||||||||||||||||
Fényerő megoszlás: 89 %
Centrumban: 370.4 cd/m²
Kontraszt: 1277:1 (Fekete: 0.29 cd/m²)
ΔE ColorChecker Calman: 1.26 | ∀{0.5-29.43 Ø4.73}
calibrated: 1.21
ΔE Greyscale Calman: 1.4 | ∀{0.09-98 Ø4.97}
94.4% sRGB (Argyll 1.6.3 3D)
59.7% AdobeRGB 1998 (Argyll 1.6.3 3D)
65.2% AdobeRGB 1998 (Argyll 3D)
94.4% sRGB (Argyll 3D)
63.1% Display P3 (Argyll 3D)
Gamma: 2.2
CCT: 6747 K
| MSI GE75 8SF Chi Mei N173HCE-G33, IPS, 17.3", 1920x1080 | Lenovo Legion Y740-17ICH AU Optronics B173HAN03.2, IPS, 17.3", 1920x1080 | Asus Zephyrus S GX701GX B173HAN04.0 (AUO409D), IPS, 17.3", 1920x1080 | Asus ROG Strix Scar II GL704GW B173HAN04.0 (AUO409D), AHVA, 17.3", 1920x1080 | MSI GE73 8RF-008 Raider RGB Chi Mei N173HHE-G32 (CMN1747), TN WLED, 17.3", 1920x1080 | MSI GT75 8RG-090 Titan CMN N173HHE-G32 (CMN1747), TN, 17.3", 1920x1080 | |
|---|---|---|---|---|---|---|
| Display | -1% | -3% | -3% | 27% | 27% | |
| Display P3 Coverage (%) | 63.1 | 64 1% | 62.9 0% | 62.9 0% | 90.8 44% | 90.9 44% |
| sRGB Coverage (%) | 94.4 | 90.4 -4% | 87.8 -7% | 87.1 -8% | 99.9 6% | 100 6% |
| AdobeRGB 1998 Coverage (%) | 65.2 | 64.8 -1% | 63.9 -2% | 63.7 -2% | 85.8 32% | 86.2 32% |
| Response Times | -43% | 17% | -46% | -112% | 32% | |
| Response Time Grey 50% / Grey 80% * (ms) | 9.6 ? | 15.6 ? -63% | 7.2 ? 25% | 17.6 ? -83% | 28 ? -192% | 8 ? 17% |
| Response Time Black / White * (ms) | 10.4 ? | 12.8 ? -23% | 9.6 ? 8% | 11.2 ? -8% | 13.6 ? -31% | 5.6 ? 46% |
| PWM Frequency (Hz) | 25770 ? | 25000 ? | 26000 ? | |||
| Screen | -107% | -23% | -42% | -46% | -19% | |
| Brightness middle (cd/m²) | 370.4 | 299.1 -19% | 288 -22% | 295 -20% | 273 -26% | 240 -35% |
| Brightness (cd/m²) | 348 | 273 -22% | 287 -18% | 291 -16% | 273 -22% | 248 -29% |
| Brightness Distribution (%) | 89 | 81 -9% | 91 2% | 96 8% | 90 1% | 83 -7% |
| Black Level * (cd/m²) | 0.29 | 0.27 7% | 0.2 31% | 0.24 17% | 0.26 10% | 0.22 24% |
| Contrast (:1) | 1277 | 1108 -13% | 1440 13% | 1229 -4% | 1050 -18% | 1091 -15% |
| Colorchecker dE 2000 * | 1.26 | 5.07 -302% | 2.33 -85% | 3.2 -154% | 3.52 -179% | 2.14 -70% |
| Colorchecker dE 2000 max. * | 3.02 | 10.55 -249% | 5.34 -77% | 6.64 -120% | 6.34 -110% | 5.04 -67% |
| Colorchecker dE 2000 calibrated * | 1.21 | 3.31 -174% | 2.47 -104% | 2.52 -108% | 2.09 -73% | 1.54 -27% |
| Greyscale dE 2000 * | 1.4 | 6.8 -386% | 1.19 15% | 2.16 -54% | 3.11 -122% | 1.62 -16% |
| Gamma | 2.2 100% | 2.46 89% | 2.41 91% | 2.46 89% | 2.43 91% | 2.28 96% |
| CCT | 6747 96% | 7805 83% | 6710 97% | 6872 95% | 6999 93% | 6846 95% |
| Color Space (Percent of AdobeRGB 1998) (%) | 59.7 | 58.5 -2% | 57 -5% | 57 -5% | 76 27% | 77 29% |
| Color Space (Percent of sRGB) (%) | 94.4 | 89.9 -5% | 88 -7% | 87 -8% | 100 6% | 100 6% |
| Teljes átlag (program / beállítások) | -50% /
-79% | -3% /
-15% | -30% /
-35% | -44% /
-40% | 13% /
-4% |
* ... a kisebb jobb
Megjelenítési válaszidők
| ↔ Válaszidő Fekete-fehér | ||
|---|---|---|
| 10.4 ms ... emelkedés és süllyedés ↘ kombinálva | ↗ 5.2 ms emelkedés | 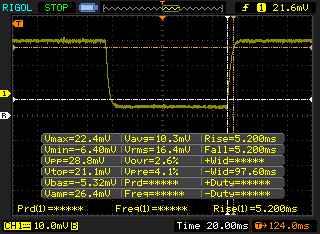 |
| ↘ 5.2 ms ősz | ||
| A képernyő jó reakciósebességet mutat tesztjeinkben, de túl lassú lehet a versenyképes játékosok számára. Összehasonlításképpen, az összes tesztelt eszköz 0.1 (minimum) és 240 (maximum) ms között mozog. » 28 % of all devices are better. Ez azt jelenti, hogy a mért válaszidő jobb, mint az összes vizsgált eszköz átlaga (19.9 ms). | ||
| ↔ Válaszidő 50% szürke és 80% szürke között | ||
| 9.6 ms ... emelkedés és süllyedés ↘ kombinálva | ↗ 5.2 ms emelkedés | 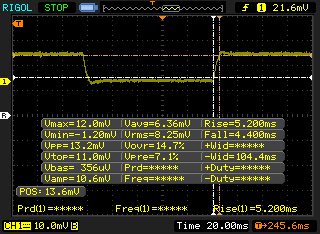 |
| ↘ 4.4 ms ősz | ||
| A képernyő gyors reakciósebességet mutat tesztjeinkben, és játékra is alkalmasnak kell lennie. Összehasonlításképpen, az összes tesztelt eszköz 0.165 (minimum) és 636 (maximum) ms között mozog. » 23 % of all devices are better. Ez azt jelenti, hogy a mért válaszidő jobb, mint az összes vizsgált eszköz átlaga (31.1 ms). | ||
Képernyő villogása / PWM (impulzusszélesség-moduláció)
| Képernyő villogása / PWM észlelve | 25770 Hz | ≤ 17 % fényerő beállítása | 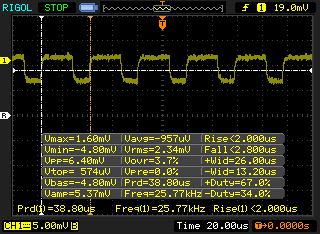 |
A kijelző háttérvilágítása 25770 Hz-en villog (a legrosszabb esetben, pl. PWM használatával) Villódzás észlelve a 17 % vagy annál kisebb fényerő-beállításnál. E fényerő-beállítás felett nem lehet villogás vagy PWM. A 25770 Hz frekvenciája meglehetősen magas, így a legtöbb PWM-re érzékeny felhasználó nem észlel semmilyen villogást. Összehasonlításképpen: az összes tesztelt eszköz 52 %-a nem használja a PWM-et a kijelző elsötétítésére. Ha PWM-et észleltek, akkor átlagosan 7797 (minimum: 5 - maximum: 343500) Hz-t mértek. | |||
| Cinebench R15 | |
| CPU Single 64Bit | |
| MSI GT75 8RG-090 Titan | |
| Huawei MateBook 13 i7 | |
| Átlagos Intel Core i7-8750H (163 - 177, n=86) | |
| Lenovo Legion Y740-17ICH | |
| Lenovo Legion Y730-15ICH i5-8300H | |
| MSI GE75 8SF | |
| Lenovo Ideapad 720S-15IKB 81AC001AGE | |
| Acer Nitro 5 AN515-42-R6V0 | |
| Asus GL702ZC-GC104T | |
| CPU Multi 64Bit | |
| Asus GL702ZC-GC104T | |
| MSI GT75 8RG-090 Titan | |
| Lenovo Legion Y740-17ICH | |
| Átlagos Intel Core i7-8750H (863 - 1251, n=93) | |
| MSI GE75 8SF | |
| Lenovo Legion Y730-15ICH i5-8300H | |
| Huawei MateBook 13 i7 | |
| Lenovo Ideapad 720S-15IKB 81AC001AGE | |
| Acer Nitro 5 AN515-42-R6V0 | |
| PCMark 8 Home Score Accelerated v2 | 3662 pontok | |
| PCMark 8 Work Score Accelerated v2 | 5338 pontok | |
| PCMark 10 Score | 5138 pontok | |
Segítség | ||
| MSI GE75 8SF Kingston RBUSNS8154P3256GJ1 | Lenovo Legion Y740-17ICH Samsung SSD PM981 MZVLB256HAHQ | Asus Zephyrus S GX701GX Samsung SSD PM981 MZVLB1T0HALR | Asus ROG Strix Scar II GL704GW Intel SSD 660p SSDPEKNW512G8 | MSI GE73 8RF-008 Raider RGB Toshiba HG6 THNSNJ256G8NY | MSI GT75 8RG-090 Titan 2x Samsung PM961 MZVLW256HEHP (RAID 0) | |
|---|---|---|---|---|---|---|
| AS SSD | 51% | 103% | 20% | -53% | 95% | |
| Seq Read (MB/s) | 949 | 1153 21% | 911 -4% | 1315 39% | 511 -46% | 3058 222% |
| Seq Write (MB/s) | 823 | 1328 61% | 2347 185% | 927 13% | 425.7 -48% | 2196 167% |
| 4K Read (MB/s) | 25.36 | 35.05 38% | 53 109% | 52.4 107% | 14.07 -45% | 38.37 51% |
| 4K Write (MB/s) | 67.1 | 96 43% | 122.5 83% | 122.8 83% | 38.34 -43% | 97.7 46% |
| 4K-64 Read (MB/s) | 748 | 727 -3% | 1577 111% | 326.5 -56% | 351.4 -53% | 1347 80% |
| 4K-64 Write (MB/s) | 650 | 1212 86% | 1734 167% | 727 12% | 172.7 -73% | 1236 90% |
| Access Time Read * (ms) | 0.173 | 0.063 64% | 0.08 54% | 0.11 36% | 0.235 -36% | 0.056 68% |
| Access Time Write * (ms) | 0.059 | 0.04 32% | 0.031 47% | 0.045 24% | 0.097 -64% | 0.038 36% |
| Score Read (Points) | 869 | 878 1% | 1721 98% | 510 -41% | 417 -52% | 1691 95% |
| Score Write (Points) | 799 | 1441 80% | 2091 162% | 942 18% | 254 -68% | 1553 94% |
| Score Total (Points) | 2109 | 2784 32% | 4771 126% | 1715 -19% | 881 -58% | 4066 93% |
| Copy ISO MB/s (MB/s) | 1121 | 1487 33% | 412.5 -63% | |||
| Copy Program MB/s (MB/s) | 532 | 608 14% | 192.9 -64% | |||
| Copy Game MB/s (MB/s) | 380.5 | 1162 205% | 295.5 -22% |
* ... a kisebb jobb

| 3DMark 11 Performance | 17817 pontok | |
| 3DMark Cloud Gate Standard Score | 25784 pontok | |
| 3DMark Fire Strike Score | 16541 pontok | |
| 3DMark Time Spy Score | 7061 pontok | |
Segítség | ||
| alacsony | közepes | magas | ultra | |
|---|---|---|---|---|
| BioShock Infinite (2013) | 231 | 208.9 | 193.1 | 136.9 |
| The Witcher 3 (2015) | 193.9 | 154 | 115.7 | 70.9 |
| Rise of the Tomb Raider (2016) | 120 | 111.3 | 92.2 | 89.4 |
| MSI GE75 8SF GeForce RTX 2070 Mobile, i7-8750H, Kingston RBUSNS8154P3256GJ1 | Lenovo Legion Y740-17ICH GeForce RTX 2080 Max-Q, i7-8750H, Samsung SSD PM981 MZVLB256HAHQ | Asus Zephyrus S GX701GX GeForce RTX 2080 Max-Q, i7-8750H, Samsung SSD PM981 MZVLB1T0HALR | Asus ROG Strix Scar II GL704GW GeForce RTX 2070 Mobile, i7-8750H, Intel SSD 660p SSDPEKNW512G8 | MSI GE73 8RF-008 Raider RGB GeForce GTX 1070 Mobile, i7-8750H, Toshiba HG6 THNSNJ256G8NY | MSI GT75 8RG-090 Titan GeForce GTX 1080 Mobile, i9-8950HK, 2x Samsung PM961 MZVLW256HEHP (RAID 0) | |
|---|---|---|---|---|---|---|
| Noise | 10% | 1% | -2% | 0% | -6% | |
| off / környezet * (dB) | 28.3 | 28.3 -0% | 29 -2% | 29 -2% | 30 -6% | 30 -6% |
| Idle Minimum * (dB) | 33.5 | 31.5 6% | 29 13% | 29 13% | 32 4% | 32 4% |
| Idle Average * (dB) | 33.6 | 31.6 6% | 32 5% | 32 5% | 33 2% | 34 -1% |
| Idle Maximum * (dB) | 35 | 31.6 10% | 33 6% | 40 -14% | 34 3% | 37 -6% |
| Load Average * (dB) | 38 | 32.3 15% | 47 -24% | 46 -21% | 41 -8% | 43 -13% |
| Witcher 3 ultra * (dB) | 50 | 43 14% | 49 2% | 51 -2% | 50 -0% | 57 -14% |
| Load Maximum * (dB) | 56.9 | 45.5 20% | 51 10% | 52 9% | 54 5% | 62 -9% |
* ... a kisebb jobb
Zajszint
| Üresjárat |
| 33.5 / 33.6 / 35 dB(A) |
| Terhelés |
| 38 / 56.9 dB(A) |
 | ||
30 dB csendes 40 dB(A) hallható 50 dB(A) hangos |
||
min: | ||
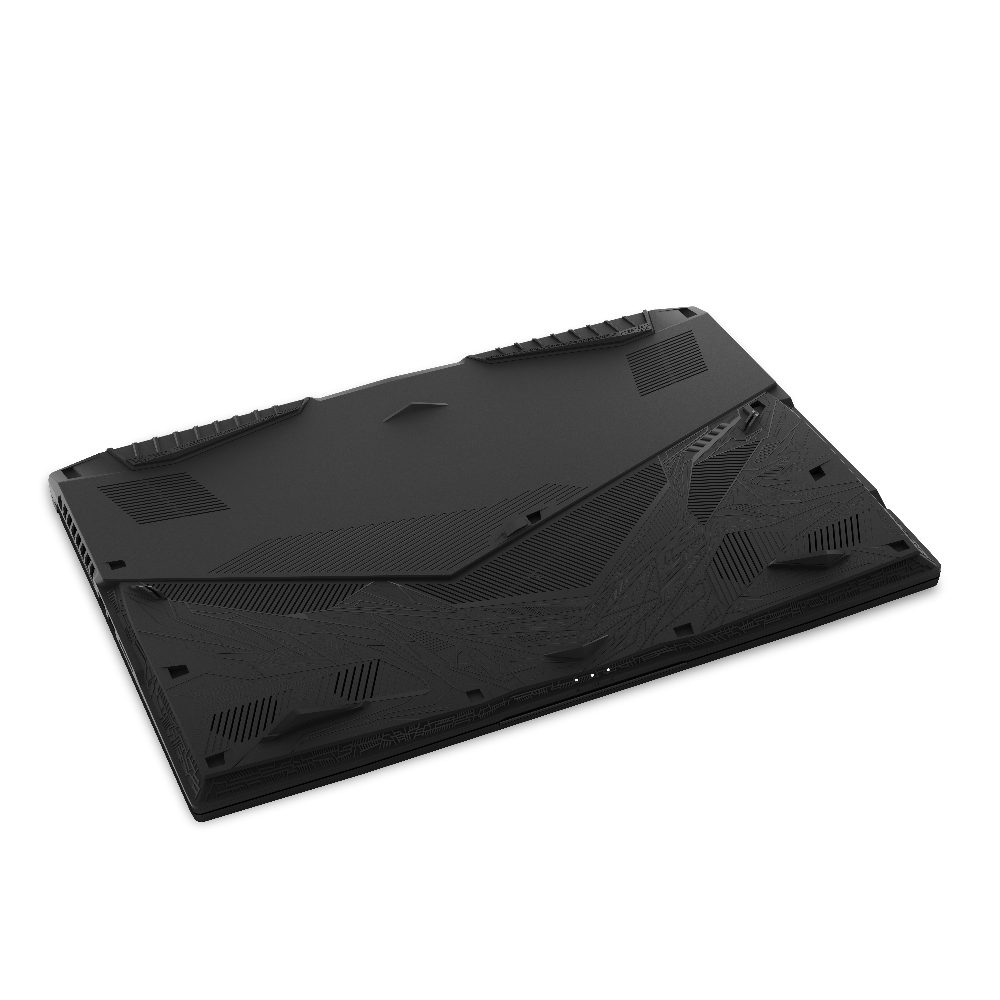
(±) A felső oldalon a maximális hőmérséklet 41.2 °C / 106 F, összehasonlítva a 40.4 °C / 105 F átlagával , 21.2 és 68.8 °C között a Gaming osztálynál.
(-) Az alsó maximum 46 °C / 115 F-ig melegszik fel, összehasonlítva a 43.2 °C / 110 F átlagával
(+) Üresjáratban a felső oldal átlagos hőmérséklete 24.6 °C / 76 F, összehasonlítva a 33.9 °C / ### eszközátlaggal class_avg_f### F.
(+) A The Witcher 3 játék során a felső oldal átlaghőmérséklete 30.7 °C / 87 F, összehasonlítva a 33.9 °C / ## eszközátlaggal #class_avg_f### F.
(+) A csuklótámasz és az érintőpad hűvösebb, mint a bőr hőmérséklete, maximum 27.4 °C / 81.3 F, ezért hűvös tapintású.
(±) A hasonló eszközök csuklótámasz területének átlagos hőmérséklete 28.8 °C / 83.8 F volt (+1.4 °C / 2.5 F).
MSI GE75 8SF hangelemzés
(+) | a hangszórók viszonylag hangosan tudnak játszani (89.3 dB)
Basszus 100 - 315 Hz
(±) | csökkentett basszus – átlagosan 13.7%-kal alacsonyabb, mint a medián
(+) | a basszus lineáris (6.8% delta az előző frekvenciához)
Közepes 400-2000 Hz
(±) | csökkentett középértékek – átlagosan 5.1%-kal alacsonyabb, mint a medián
(±) | a középpontok linearitása átlagos (7.4% delta az előző gyakorisághoz)
Maximum 2-16 kHz
(+) | kiegyensúlyozott csúcsok – csak 3.3% választja el a mediántól
(+) | a csúcsok lineárisak (6.4% delta az előző frekvenciához képest)
Összességében 100 - 16.000 Hz
(±) | az általános hang linearitása átlagos (16.2% eltérés a mediánhoz képest)
Ugyanazon osztályhoz képest
» 40%Ebben az osztályban az összes tesztelt eszköz %-a jobb volt, 7% hasonló, 54%-kal rosszabb
» A legjobb delta értéke 6%, az átlag 18%, a legrosszabb 132% volt
Az összes tesztelt eszközzel összehasonlítva
» 26% az összes tesztelt eszköz jobb volt, 6% hasonló, 68%-kal rosszabb
» A legjobb delta értéke 4%, az átlag 24%, a legrosszabb 134% volt
Apple MacBook 12 (Early 2016) 1.1 GHz hangelemzés
(+) | a hangszórók viszonylag hangosan tudnak játszani (83.6 dB)
Basszus 100 - 315 Hz
(±) | csökkentett basszus – átlagosan 11.3%-kal alacsonyabb, mint a medián
(±) | a basszus linearitása átlagos (14.2% delta az előző frekvenciához)
Közepes 400-2000 Hz
(+) | kiegyensúlyozott középpontok – csak 2.4% választja el a mediántól
(+) | a középpontok lineárisak (5.5% delta az előző frekvenciához)
Maximum 2-16 kHz
(+) | kiegyensúlyozott csúcsok – csak 2% választja el a mediántól
(+) | a csúcsok lineárisak (4.5% delta az előző frekvenciához képest)
Összességében 100 - 16.000 Hz
(+) | általános hangzás lineáris (10.2% eltérés a mediánhoz képest)
Ugyanazon osztályhoz képest
» 7%Ebben az osztályban az összes tesztelt eszköz %-a jobb volt, 2% hasonló, 91%-kal rosszabb
» A legjobb delta értéke 5%, az átlag 18%, a legrosszabb 53% volt
Az összes tesztelt eszközzel összehasonlítva
» 5% az összes tesztelt eszköz jobb volt, 1% hasonló, 94%-kal rosszabb
» A legjobb delta értéke 4%, az átlag 24%, a legrosszabb 134% volt
| Kikapcsolt állapot / Készenlét | |
| Üresjárat | |
| Terhelés |
|
Kulcs:
min: | |
| MSI GE75 8SF i7-8750H, GeForce RTX 2070 Mobile, Kingston RBUSNS8154P3256GJ1, IPS, 1920x1080, 17.3" | Lenovo Legion Y740-17ICH i7-8750H, GeForce RTX 2080 Max-Q, Samsung SSD PM981 MZVLB256HAHQ, IPS, 1920x1080, 17.3" | Asus ROG Strix Scar II GL704GW i7-8750H, GeForce RTX 2070 Mobile, Intel SSD 660p SSDPEKNW512G8, AHVA, 1920x1080, 17.3" | MSI GE73 8RF-008 Raider RGB i7-8750H, GeForce GTX 1070 Mobile, Toshiba HG6 THNSNJ256G8NY, TN WLED, 1920x1080, 17.3" | MSI GT75 8RG-090 Titan i9-8950HK, GeForce GTX 1080 Mobile, 2x Samsung PM961 MZVLW256HEHP (RAID 0), TN, 1920x1080, 17.3" | |
|---|---|---|---|---|---|
| Power Consumption | -2% | -7% | 2% | -62% | |
| Idle Minimum * (Watt) | 16.4 | 20.2 -23% | 19 -16% | 15 9% | 31 -89% |
| Idle Average * (Watt) | 21.9 | 27.2 -24% | 22 -0% | 20 9% | 35 -60% |
| Idle Maximum * (Watt) | 25.4 | 28.7 -13% | 29 -14% | 26 -2% | 45 -77% |
| Load Average * (Watt) | 90.7 | 90.8 -0% | 102 -12% | 97 -7% | 130 -43% |
| Witcher 3 ultra * (Watt) | 203.3 | 152.1 25% | 190 7% | 186 9% | 268 -32% |
| Load Maximum * (Watt) | 222.9 | 165.4 26% | 231 -4% | 239 -7% | 374 -68% |
* ... a kisebb jobb
| MSI GE75 8SF i7-8750H, GeForce RTX 2070 Mobile, 65 Wh | Lenovo Legion Y740-17ICH i7-8750H, GeForce RTX 2080 Max-Q, 76 Wh | Asus Zephyrus S GX701GX i7-8750H, GeForce RTX 2080 Max-Q, 76 Wh | Asus ROG Strix Scar II GL704GW i7-8750H, GeForce RTX 2070 Mobile, 66 Wh | MSI GE73 8RF-008 Raider RGB i7-8750H, GeForce GTX 1070 Mobile, 51 Wh | MSI GT75 8RG-090 Titan i9-8950HK, GeForce GTX 1080 Mobile, 75 Wh | |
|---|---|---|---|---|---|---|
| Akkumulátor üzemidő | -9% | 9% | 11% | -11% | ||
| WiFi v1.3 (h) | 3.5 | 3.2 -9% | 3.8 9% | 3.9 11% | 3.1 -11% | |
| Reader / Idle (h) | 5 | 6.2 | 5.1 | 3.8 | ||
| Load (h) | 0.9 | 1.1 | 0.6 | 1.1 | ||
| Witcher 3 ultra (h) | 0.9 |
Pro
Kontra

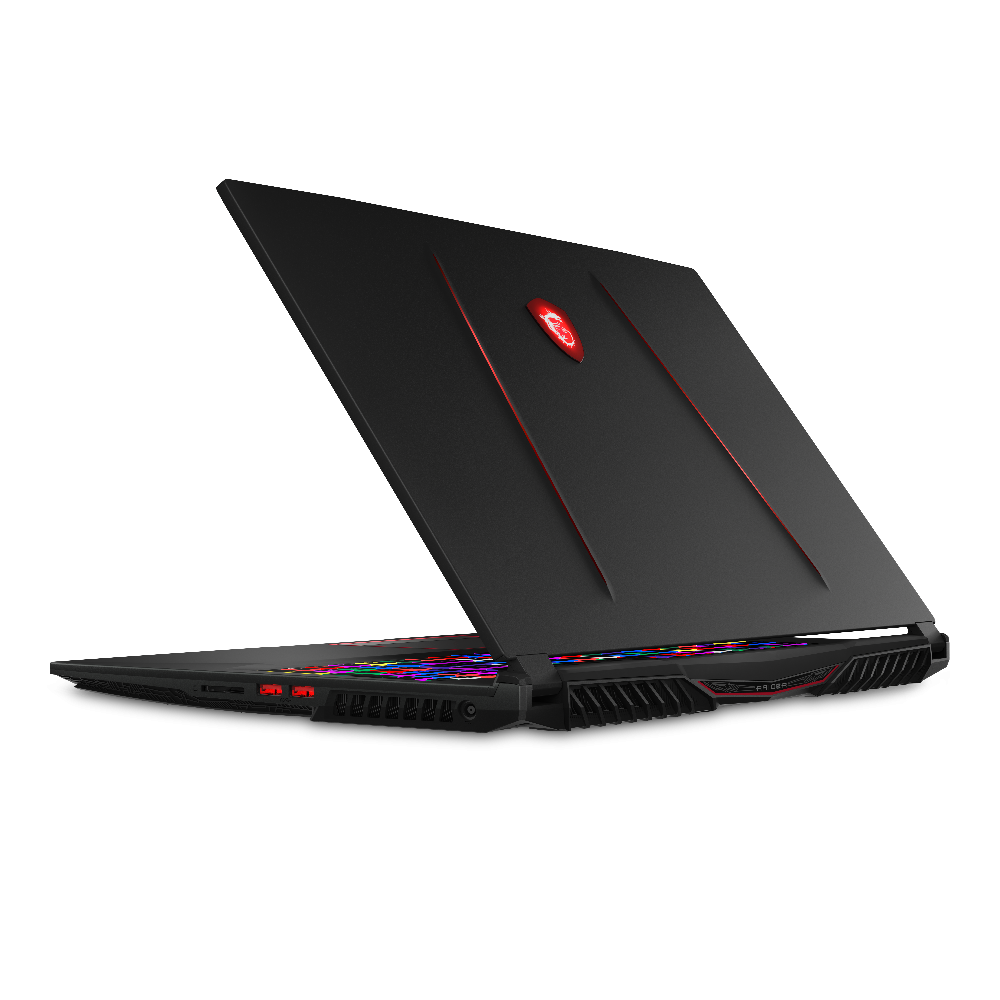
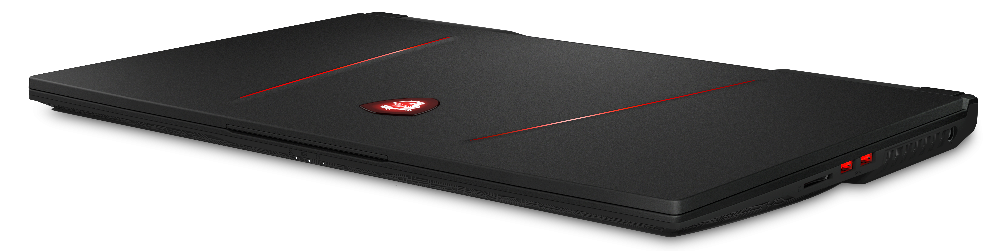
A GE75 megállja a helyét a nemrég megjelent GS75 alternatívájaként. Valamivel olcsóbb, vastagabb, és gyorsabb, mivel nem Max-Q GPU-kra támaszkodik. Az utolsó generációs GE73-at pedig elavulttá teszi, mivel 19 százalékkal kisebb és 10 százalékkal könnyebb, mindeközben pedig 35 százalékkal világosabb és max. 35 százalékkal gyorsabb. A generációról generációra frissülés egyértelműen érzékelhető, és nem csekély.
Van azért néhány sajátosság, amelyek remélhetőleg figyelmet kapnak majd a jövőbeni módosításokkal. A ventilátorzaj nem javult, és az üzemidő sem sokkal jobb. A szervízelhetőség egyszerűbb lehetne, a Thunderbolt 3 hiánya pedig megbocsáthatatlan egy több mint 2000 dolláros notebookon. Hasonlóképp a G-Sync jobban illett volna a GE szériához, mint az Optimus, hogy többet ki lehessen hozni a 144 Hz-es kijelzőből.
Jelen pillanatban a GE75 legnagyobb vetélytársa az Asus ROG GL704-es széria. Noha az Asus rendszer sötétebb, és hiányzik a gombonkénti RGB világítás, úgy találjuk, hogy a váz erősebb, komponensei pedig könnyebben szervízelhetőek, ezeket pedig a gamer célközönség értékeli. Amúgy hajszálnyi a különbség a kettő között.
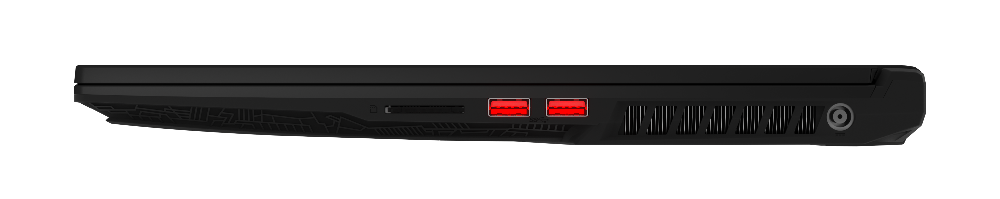
Kisebb, könnyebb, gyorsabb. A GE75 a zászlóshajó GT széria és a szupervékony GS széria fúziójaként mindkét fél legjavát kínálja egy alacsonyabb kezdő áron. Van azért néhány megszorítás, mint a lassú SD kártyaolvasó, és hiányzik a Thunderbolt 3 és a 10 Gbps Ethernet, de ezek nem vonnak le semmit az alapvető játékélményből.
MSI GE75 8SF
- 10/03/2019 v7 (old)
Allen Ngo
Price comparison

