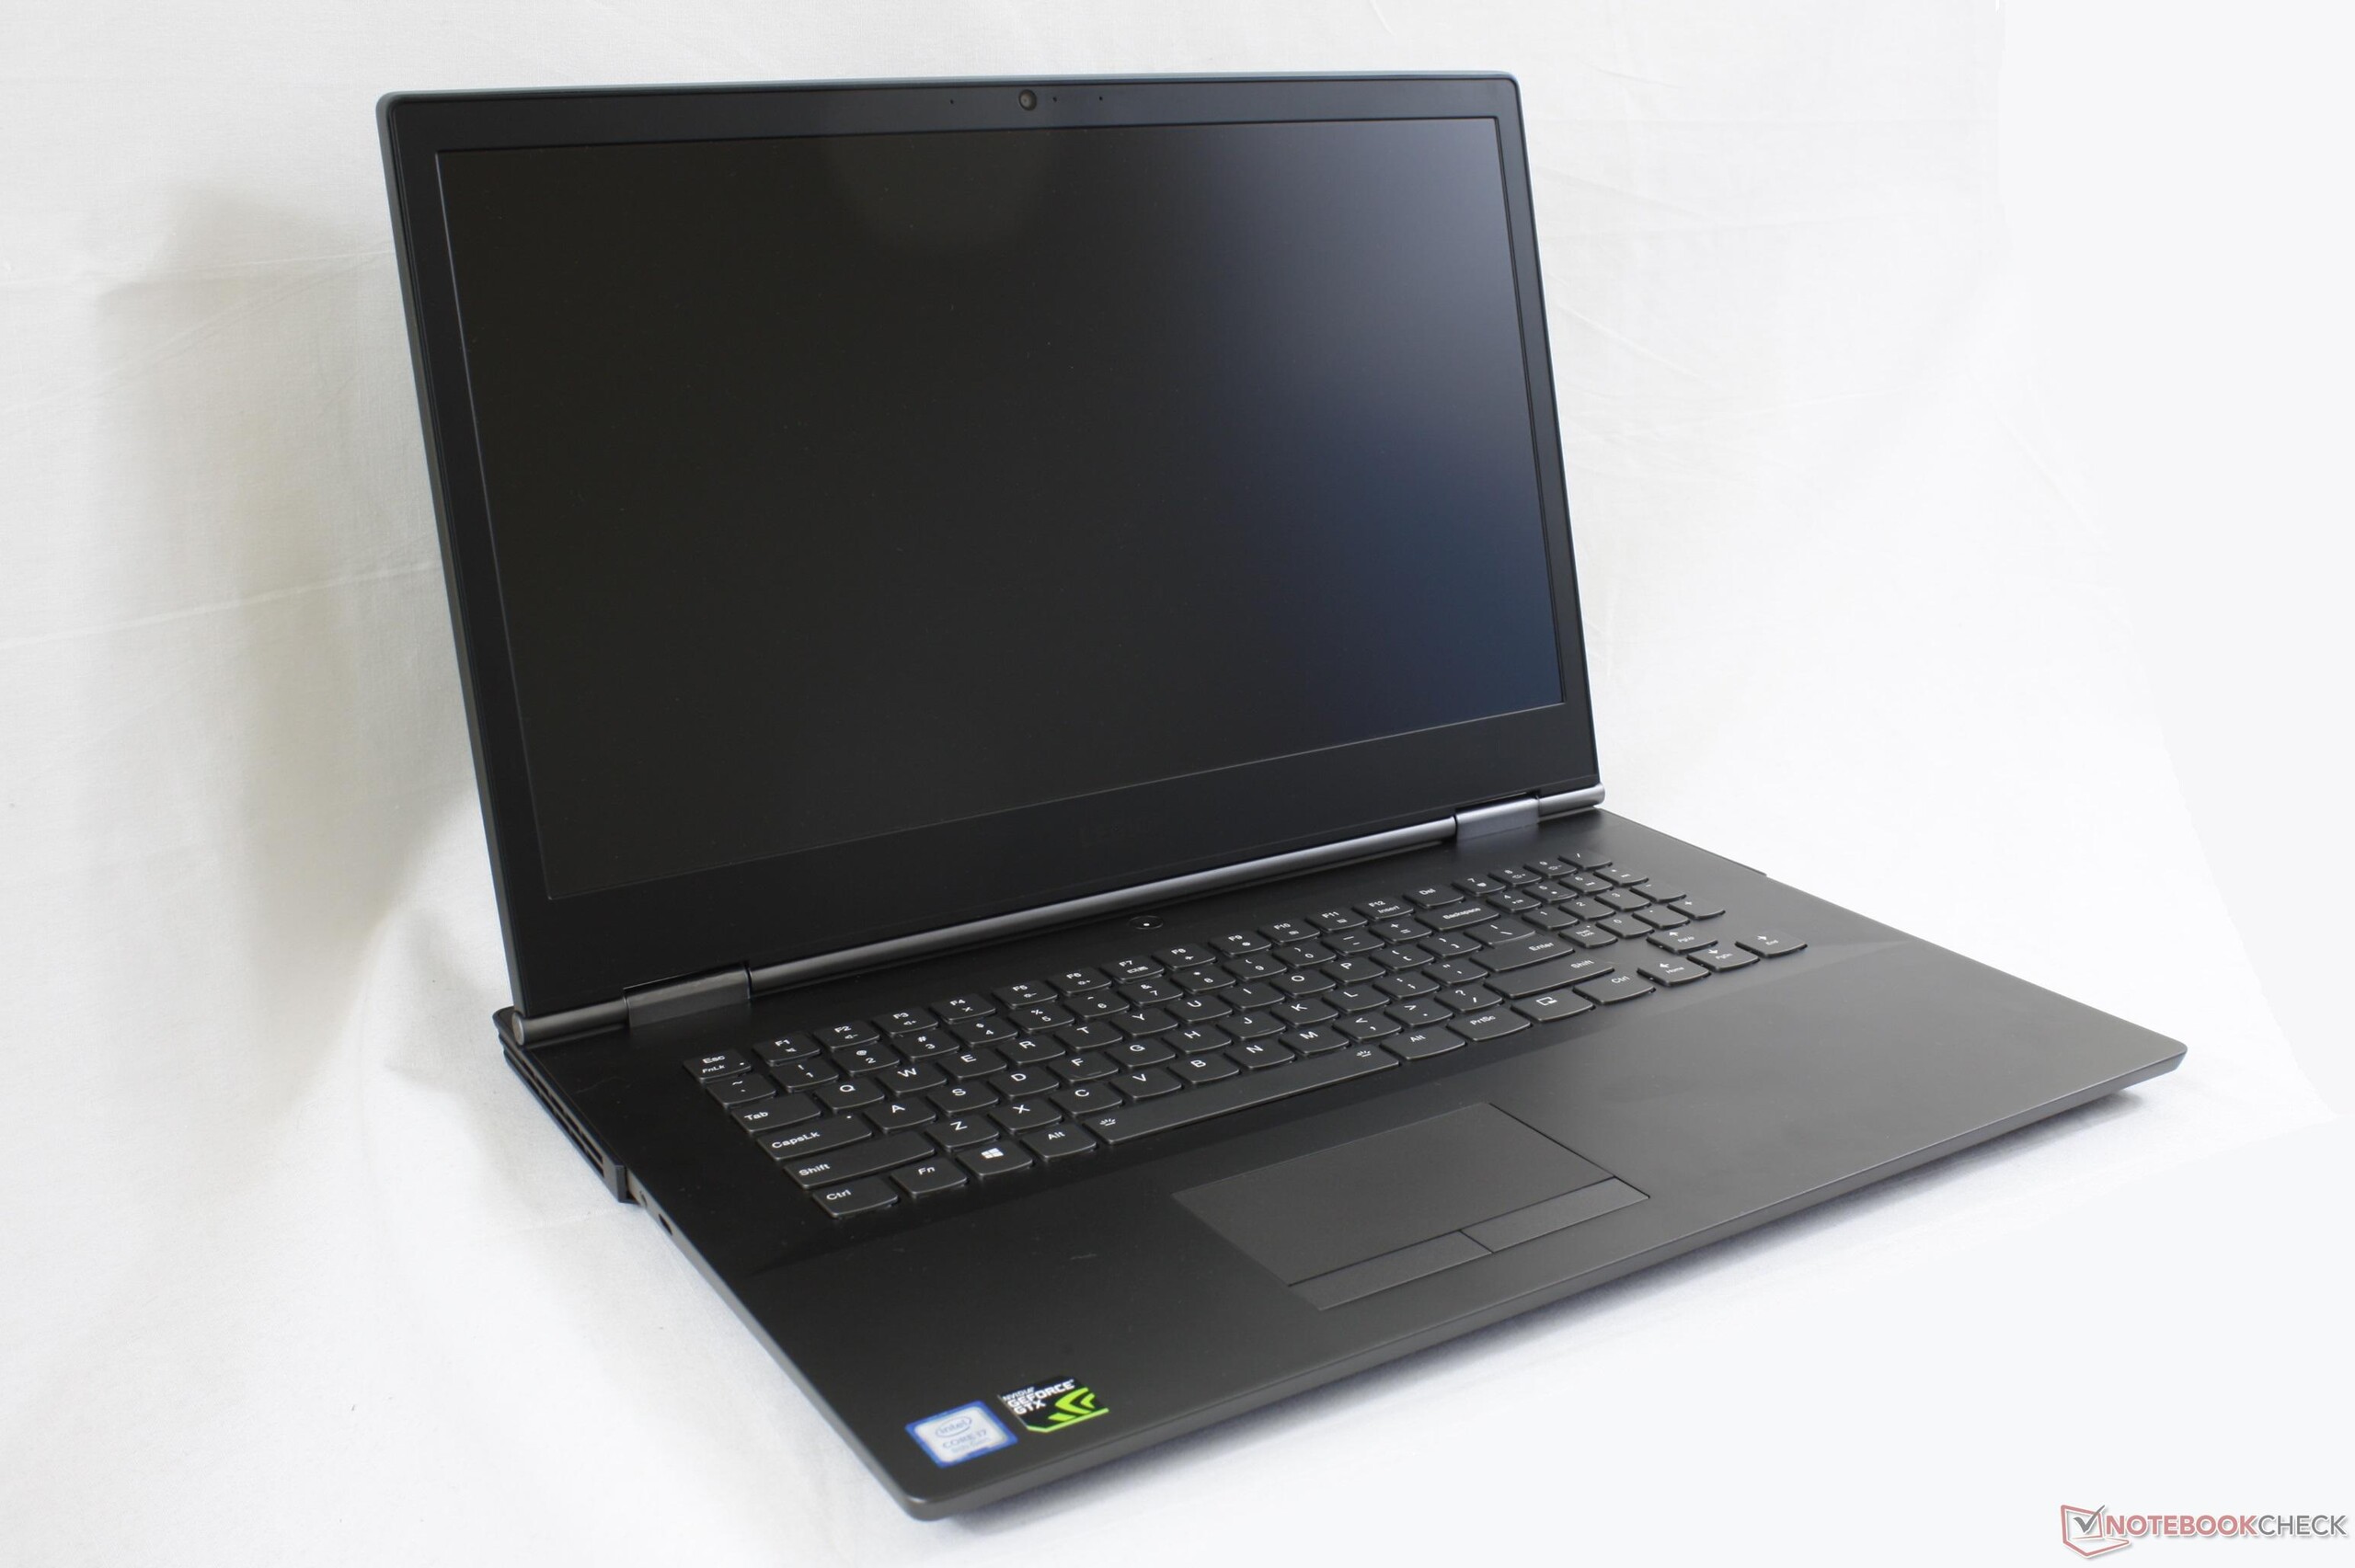
Lenovo Legion Y740-17ICH (i7-8750H, RTX 2080 Max-Q) Laptop rövid értékelés
| Networking | |
| iperf3 transmit AX12 | |
| MSI GE75 8SG Raider | |
| Lenovo Legion Y740-17ICH | |
| Alienware 17 R5 | |
| Razer Blade Pro 2017 | |
| Asus ROG Strix Scar II GL704GW | |
| iperf3 receive AX12 | |
| MSI GE75 8SG Raider | |
| Razer Blade Pro 2017 | |
| Alienware 17 R5 | |
| Lenovo Legion Y740-17ICH | |
| Asus ROG Strix Scar II GL704GW | |
| |||||||||||||||||||||||||
Fényerő megoszlás: 81 %
Centrumban: 299.1 cd/m²
Kontraszt: 1108:1 (Fekete: 0.27 cd/m²)
ΔE ColorChecker Calman: 5.07 | ∀{0.5-29.43 Ø4.71}
calibrated: 3.31
ΔE Greyscale Calman: 6.8 | ∀{0.09-98 Ø4.96}
89.9% sRGB (Argyll 1.6.3 3D)
58.5% AdobeRGB 1998 (Argyll 1.6.3 3D)
64.8% AdobeRGB 1998 (Argyll 3D)
90.4% sRGB (Argyll 3D)
64% Display P3 (Argyll 3D)
Gamma: 2.46
CCT: 7805 K
| Lenovo Legion Y740-17ICH AU Optronics B173HAN03.2, IPS, 17.3", 1920x1080 | Asus ROG Strix Scar II GL704GW B173HAN04.0 (AUO409D), AHVA, 17.3", 1920x1080 | Razer Blade Pro 2017 Sharp LQ173D1JW33 (SHP145A), IGZO, 17.3", 3840x2160 | MSI GE75 8SG Raider CMN N173HCE-G33 (CMN175C), AHVA, 17.3", 1920x1080 | Alienware 17 R5 JYWWF_B173QTN (AUO1496), TN, 17.3", 2560x1440 | Lenovo Legion Y730-17ICH, i7-8750H LP173WF4-SPF6, IPS, 17.3", 1920x1080 | |
|---|---|---|---|---|---|---|
| Display | -3% | 35% | -2% | -3% | -2% | |
| Display P3 Coverage (%) | 64 | 62.9 -2% | 88.9 39% | 60.6 -5% | 63.4 -1% | 66.4 4% |
| sRGB Coverage (%) | 90.4 | 87.1 -4% | 100 11% | 91.2 1% | 86.1 -5% | 84.9 -6% |
| AdobeRGB 1998 Coverage (%) | 64.8 | 63.7 -2% | 99.7 54% | 62.6 -3% | 62.9 -3% | 62.1 -4% |
| Response Times | 0% | -245% | 39% | 10% | -112% | |
| Response Time Grey 50% / Grey 80% * (ms) | 15.6 ? | 17.6 ? -13% | 60.8 ? -290% | 8 ? 49% | 20.8 ? -33% | 36.8 ? -136% |
| Response Time Black / White * (ms) | 12.8 ? | 11.2 ? 13% | 38.4 ? -200% | 9.2 ? 28% | 6 ? 53% | 24 ? -88% |
| PWM Frequency (Hz) | 204.9 ? | 26040 ? | ||||
| Screen | 19% | 7% | 24% | -1% | -8% | |
| Brightness middle (cd/m²) | 299.1 | 295 -1% | 230 -23% | 363 21% | 398 33% | 328.7 10% |
| Brightness (cd/m²) | 273 | 291 7% | 207 -24% | 342 25% | 367 34% | 318 16% |
| Brightness Distribution (%) | 81 | 96 19% | 83 2% | 86 6% | 86 6% | 91 12% |
| Black Level * (cd/m²) | 0.27 | 0.24 11% | 0.2 26% | 0.27 -0% | 0.51 -89% | 0.51 -89% |
| Contrast (:1) | 1108 | 1229 11% | 1150 4% | 1344 21% | 780 -30% | 645 -42% |
| Colorchecker dE 2000 * | 5.07 | 3.2 37% | 5.62 -11% | 2.29 55% | 5.45 -7% | 4.91 3% |
| Colorchecker dE 2000 max. * | 10.55 | 6.64 37% | 10.24 3% | 4.54 57% | 10.36 2% | 10.15 4% |
| Colorchecker dE 2000 calibrated * | 3.31 | 2.52 24% | 2.45 26% | 2.56 23% | 4.27 -29% | |
| Greyscale dE 2000 * | 6.8 | 2.16 68% | 4.54 33% | 3.02 56% | 5.4 21% | 3.9 43% |
| Gamma | 2.46 89% | 2.46 89% | 2.36 93% | 2.38 92% | 2.4 92% | 2.13 103% |
| CCT | 7805 83% | 6872 95% | 6625 98% | 7048 92% | 7453 87% | 6911 94% |
| Color Space (Percent of AdobeRGB 1998) (%) | 58.5 | 57 -3% | 88 50% | 58 -1% | 56 -4% | 55.6 -5% |
| Color Space (Percent of sRGB) (%) | 89.9 | 87 -3% | 100 11% | 91 1% | 86 -4% | 84.7 -6% |
| Teljes átlag (program / beállítások) | 5% /
12% | -68% /
-21% | 20% /
21% | 2% /
-0% | -41% /
-20% |
* ... a kisebb jobb
Megjelenítési válaszidők
| ↔ Válaszidő Fekete-fehér | ||
|---|---|---|
| 12.8 ms ... emelkedés és süllyedés ↘ kombinálva | ↗ 7.6 ms emelkedés | 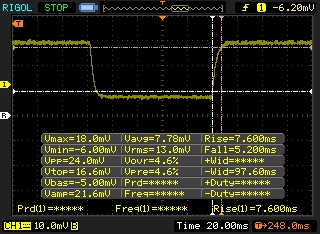 |
| ↘ 5.2 ms ősz | ||
| A képernyő jó reakciósebességet mutat tesztjeinkben, de túl lassú lehet a versenyképes játékosok számára. Összehasonlításképpen, az összes tesztelt eszköz 0.1 (minimum) és 240 (maximum) ms között mozog. » 33 % of all devices are better. Ez azt jelenti, hogy a mért válaszidő jobb, mint az összes vizsgált eszköz átlaga (19.8 ms). | ||
| ↔ Válaszidő 50% szürke és 80% szürke között | ||
| 15.6 ms ... emelkedés és süllyedés ↘ kombinálva | ↗ 8 ms emelkedés | 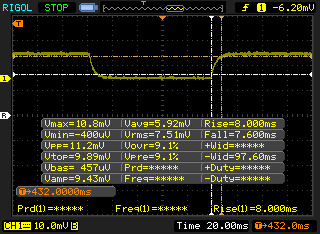 |
| ↘ 7.6 ms ősz | ||
| A képernyő jó reakciósebességet mutat tesztjeinkben, de túl lassú lehet a versenyképes játékosok számára. Összehasonlításképpen, az összes tesztelt eszköz 0.165 (minimum) és 636 (maximum) ms között mozog. » 30 % of all devices are better. Ez azt jelenti, hogy a mért válaszidő jobb, mint az összes vizsgált eszköz átlaga (30.9 ms). | ||
Képernyő villogása / PWM (impulzusszélesség-moduláció)
| Képernyő villogása / PWM nem érzékelhető | 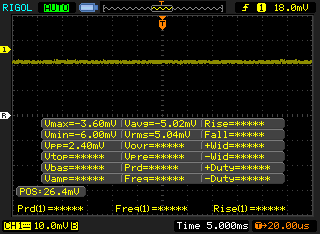 | ||
Összehasonlításképpen: az összes tesztelt eszköz 52 %-a nem használja a PWM-et a kijelző elsötétítésére. Ha PWM-et észleltek, akkor átlagosan 7741 (minimum: 5 - maximum: 343500) Hz-t mértek. | |||
| Cinebench R15 | |
| CPU Single 64Bit | |
| Intel Core i7-9700K, AMD Radeon RX Vega 64 | |
| Dell XPS 15 9570 Core i9 UHD | |
| Lenovo Legion Y730-17ICH, i7-8750H | |
| Alienware m15 GTX 1070 Max-Q | |
| Átlagos Intel Core i7-8750H (163 - 177, n=86) | |
| Lenovo ThinkPad X1 Carbon 2018-20KGS5DU00 | |
| Lenovo Legion Y740-17ICH | |
| Lenovo Legion Y730-15ICH i5-8300H | |
| Lenovo Ideapad 720S-15IKB 81AC001AGE | |
| Acer Nitro 5 AN515-42-R6V0 | |
| CPU Multi 64Bit | |
| Intel Core i7-9700K, AMD Radeon RX Vega 64 | |
| Lenovo Legion Y740-17ICH | |
| Lenovo Legion Y730-17ICH, i7-8750H | |
| Dell XPS 15 9570 Core i9 UHD | |
| Alienware m15 GTX 1070 Max-Q | |
| Átlagos Intel Core i7-8750H (863 - 1251, n=93) | |
| Lenovo Legion Y730-15ICH i5-8300H | |
| Lenovo Ideapad 720S-15IKB 81AC001AGE | |
| Acer Nitro 5 AN515-42-R6V0 | |
| Lenovo ThinkPad X1 Carbon 2018-20KGS5DU00 | |
| PCMark 8 Home Score Accelerated v2 | 5107 pontok | |
| PCMark 8 Work Score Accelerated v2 | 5882 pontok | |
| PCMark 10 Score | 6053 pontok | |
Segítség | ||
| Lenovo Legion Y740-17ICH Samsung SSD PM981 MZVLB256HAHQ | Asus ROG Strix Scar II GL704GW Intel SSD 660p SSDPEKNW512G8 | Razer Blade Pro 2017 2x Samsung SSD PM951 MZVLV256HCHP (RAID 0) | Alienware 17 R5 SK hynix PC401 HFS256GD9TNG | HP Omen X 17-ap0xx Samsung PM961 MZVLW256HEHP | |
|---|---|---|---|---|---|
| AS SSD | -21% | 11% | -29% | 13% | |
| Seq Read (MB/s) | 1153 | 1315 14% | 2599 125% | 2203 91% | 2352 104% |
| Seq Write (MB/s) | 1328 | 927 -30% | 588 -56% | 559 -58% | 1145 -14% |
| 4K Read (MB/s) | 35.05 | 52.4 50% | 37.57 7% | 38.74 11% | 44.81 28% |
| 4K Write (MB/s) | 96 | 122.8 28% | 104.4 9% | 92.7 -3% | 116.2 21% |
| 4K-64 Read (MB/s) | 727 | 326.5 -55% | 1116 54% | 447.2 -38% | 967 33% |
| 4K-64 Write (MB/s) | 1212 | 727 -40% | 513 -58% | 279.1 -77% | 798 -34% |
| Access Time Read * (ms) | 0.063 | 0.11 -75% | 0.051 19% | 0.091 -44% | 0.05 21% |
| Access Time Write * (ms) | 0.04 | 0.045 -13% | 0.036 10% | 0.065 -63% | 0.032 20% |
| Score Read (Points) | 878 | 510 -42% | 1414 61% | 706 -20% | 1248 42% |
| Score Write (Points) | 1441 | 942 -35% | 676 -53% | 428 -70% | 1029 -29% |
| Score Total (Points) | 2784 | 1715 -38% | 2715 -2% | 1424 -49% | 2862 3% |
| Copy ISO MB/s (MB/s) | 1487 | 1834 23% | |||
| Copy Program MB/s (MB/s) | 608 | 492.1 -19% | |||
| Copy Game MB/s (MB/s) | 1162 | 983 -15% |
* ... a kisebb jobb

| 3DMark 11 Performance | 20177 pontok | |
| 3DMark Cloud Gate Standard Score | 37537 pontok | |
| 3DMark Fire Strike Score | 16302 pontok | |
| 3DMark Fire Strike Extreme Score | 8104 pontok | |
| 3DMark Time Spy Score | 7153 pontok | |
Segítség | ||
| The Witcher 3 - 1920x1080 Ultra Graphics & Postprocessing (HBAO+) | |
| Asus ROG G703GX | |
| MSI GS75 8SG Stealth | |
| Lenovo Legion Y740-17ICH | |
| Asus ROG Strix Scar II GL704GW | |
| Razer Blade 15 RTX 2070 Max-Q | |
| HP Omen X 17-ap0xx | |
| Alienware 17 R5 | |
| Alienware m15 GTX 1070 Max-Q | |
| Lenovo Legion Y730-17ICH, i7-8750H | |
| Acer Nitro 5 AN515-42-R6V0 | |
| alacsony | közepes | magas | ultra | |
|---|---|---|---|---|
| BioShock Infinite (2013) | 316.8 | 283.4 | 239.6 | 161.5 |
| The Witcher 3 (2015) | 305.4 | 222.4 | 144.2 | 73.1 |
| Rise of the Tomb Raider (2016) | 253.4 | 182.8 | 138.8 | 109 |
| Lenovo Legion Y740-17ICH GeForce RTX 2080 Max-Q, i7-8750H, Samsung SSD PM981 MZVLB256HAHQ | Asus ROG Strix Scar II GL704GW GeForce RTX 2070 Mobile, i7-8750H, Intel SSD 660p SSDPEKNW512G8 | Razer Blade Pro 2017 GeForce GTX 1080 Mobile, i7-7820HK, 2x Samsung SSD PM951 MZVLV256HCHP (RAID 0) | MSI GE75 8SG Raider GeForce RTX 2080 Mobile, i7-8750H, Kingston RBUSNS8154P3512GJ | Alienware 17 R5 GeForce GTX 1070 Mobile, i7-8750H, SK hynix PC401 HFS256GD9TNG | Lenovo Legion Y730-17ICH, i7-8750H GeForce GTX 1050 Ti Mobile, i7-8750H, Toshiba KBG30ZMT128G | |
|---|---|---|---|---|---|---|
| Noise | -14% | -13% | -18% | -12% | 3% | |
| off / környezet * (dB) | 28.3 | 29 -2% | 30 -6% | 30 -6% | 30 -6% | 28 1% |
| Idle Minimum * (dB) | 31.5 | 29 8% | 30 5% | 30 5% | 32 -2% | 28 11% |
| Idle Average * (dB) | 31.6 | 32 -1% | 31 2% | 34 -8% | 33 -4% | 28 11% |
| Idle Maximum * (dB) | 31.6 | 40 -27% | 33 -4% | 37 -17% | 34 -8% | 31.3 1% |
| Load Average * (dB) | 32.3 | 46 -42% | 43 -33% | 52 -61% | 43 -33% | 33.4 -3% |
| Witcher 3 ultra * (dB) | 43 | 51 -19% | 55 -28% | 53 -23% | 51 -19% | 42.8 -0% |
| Load Maximum * (dB) | 45.5 | 52 -14% | 58 -27% | 54 -19% | 51 -12% | 46.2 -2% |
* ... a kisebb jobb
Zajszint
| Üresjárat |
| 31.5 / 31.6 / 31.6 dB(A) |
| HDD |
| 31.6 dB(A) |
| Terhelés |
| 32.3 / 45.5 dB(A) |
 | ||
30 dB csendes 40 dB(A) hallható 50 dB(A) hangos |
||
min: | ||
(+) A felső oldalon a maximális hőmérséklet 38.6 °C / 101 F, összehasonlítva a 40.4 °C / 105 F átlagával , 21.2 és 68.8 °C között a Gaming osztálynál.
(±) Az alsó maximum 43.6 °C / 110 F-ig melegszik fel, összehasonlítva a 43.2 °C / 110 F átlagával
(+) Üresjáratban a felső oldal átlagos hőmérséklete 26.1 °C / 79 F, összehasonlítva a 33.9 °C / ### eszközátlaggal class_avg_f### F.
(+) A The Witcher 3 játék során a felső oldal átlaghőmérséklete 29.6 °C / 85 F, összehasonlítva a 33.9 °C / ## eszközátlaggal #class_avg_f### F.
(+) A csuklótámasz és az érintőpad hűvösebb, mint a bőr hőmérséklete, maximum 27 °C / 80.6 F, ezért hűvös tapintású.
(±) A hasonló eszközök csuklótámasz területének átlagos hőmérséklete 28.8 °C / 83.8 F volt (+1.8 °C / 3.2 F).
Lenovo Legion Y740-17ICH hangelemzés
(±) | a hangszóró hangereje átlagos, de jó (74.3 dB)
Basszus 100 - 315 Hz
(-) | szinte nincs basszus – átlagosan 21.1%-kal alacsonyabb a mediánnál
(-) | A basszus nem lineáris (16.5% delta az előző frekvenciához)
Közepes 400-2000 Hz
(+) | kiegyensúlyozott középpontok – csak 3.3% választja el a mediántól
(±) | a középpontok linearitása átlagos (9.7% delta az előző gyakorisághoz)
Maximum 2-16 kHz
(+) | kiegyensúlyozott csúcsok – csak 1.7% választja el a mediántól
(+) | a csúcsok lineárisak (4.6% delta az előző frekvenciához képest)
Összességében 100 - 16.000 Hz
(±) | az általános hang linearitása átlagos (23.4% eltérés a mediánhoz képest)
Ugyanazon osztályhoz képest
» 85%Ebben az osztályban az összes tesztelt eszköz %-a jobb volt, 5% hasonló, 11%-kal rosszabb
» A legjobb delta értéke 6%, az átlag 18%, a legrosszabb 132% volt
Az összes tesztelt eszközzel összehasonlítva
» 70% az összes tesztelt eszköz jobb volt, 6% hasonló, 24%-kal rosszabb
» A legjobb delta értéke 4%, az átlag 23%, a legrosszabb 134% volt
Apple MacBook 12 (Early 2016) 1.1 GHz hangelemzés
(+) | a hangszórók viszonylag hangosan tudnak játszani (83.6 dB)
Basszus 100 - 315 Hz
(±) | csökkentett basszus – átlagosan 11.3%-kal alacsonyabb, mint a medián
(±) | a basszus linearitása átlagos (14.2% delta az előző frekvenciához)
Közepes 400-2000 Hz
(+) | kiegyensúlyozott középpontok – csak 2.4% választja el a mediántól
(+) | a középpontok lineárisak (5.5% delta az előző frekvenciához)
Maximum 2-16 kHz
(+) | kiegyensúlyozott csúcsok – csak 2% választja el a mediántól
(+) | a csúcsok lineárisak (4.5% delta az előző frekvenciához képest)
Összességében 100 - 16.000 Hz
(+) | általános hangzás lineáris (10.2% eltérés a mediánhoz képest)
Ugyanazon osztályhoz képest
» 7%Ebben az osztályban az összes tesztelt eszköz %-a jobb volt, 2% hasonló, 90%-kal rosszabb
» A legjobb delta értéke 5%, az átlag 18%, a legrosszabb 53% volt
Az összes tesztelt eszközzel összehasonlítva
» 5% az összes tesztelt eszköz jobb volt, 1% hasonló, 94%-kal rosszabb
» A legjobb delta értéke 4%, az átlag 23%, a legrosszabb 134% volt
| Kikapcsolt állapot / Készenlét | |
| Üresjárat | |
| Terhelés |
|
Kulcs:
min: | |
| Lenovo Legion Y740-17ICH i7-8750H, GeForce RTX 2080 Max-Q, Samsung SSD PM981 MZVLB256HAHQ, IPS, 1920x1080, 17.3" | Asus ROG Strix Scar II GL704GW i7-8750H, GeForce RTX 2070 Mobile, Intel SSD 660p SSDPEKNW512G8, AHVA, 1920x1080, 17.3" | Razer Blade Pro 2017 i7-7820HK, GeForce GTX 1080 Mobile, 2x Samsung SSD PM951 MZVLV256HCHP (RAID 0), IGZO, 3840x2160, 17.3" | MSI GE75 8SG Raider i7-8750H, GeForce RTX 2080 Mobile, Kingston RBUSNS8154P3512GJ, AHVA, 1920x1080, 17.3" | Alienware 17 R5 i7-8750H, GeForce GTX 1070 Mobile, SK hynix PC401 HFS256GD9TNG, TN, 2560x1440, 17.3" | Lenovo Legion Y730-17ICH, i7-8750H i7-8750H, GeForce GTX 1050 Ti Mobile, Toshiba KBG30ZMT128G, IPS, 1920x1080, 17.3" | |
|---|---|---|---|---|---|---|
| Power Consumption | -9% | -42% | 7% | -29% | 41% | |
| Idle Minimum * (Watt) | 20.2 | 19 6% | 31 -53% | 7 65% | 28 -39% | 6.3 69% |
| Idle Average * (Watt) | 27.2 | 22 19% | 36 -32% | 15 45% | 32 -18% | 11 60% |
| Idle Maximum * (Watt) | 28.7 | 29 -1% | 44 -53% | 22 23% | 37 -29% | 11.5 60% |
| Load Average * (Watt) | 90.8 | 102 -12% | 107 -18% | 92 -1% | 112 -23% | 89.8 1% |
| Witcher 3 ultra * (Watt) | 152.1 | 190 -25% | 212 -39% | 207 -36% | 192 -26% | 102 33% |
| Load Maximum * (Watt) | 165.4 | 231 -40% | 258 -56% | 254 -54% | 231 -40% | 130.7 21% |
* ... a kisebb jobb
| Lenovo Legion Y740-17ICH i7-8750H, GeForce RTX 2080 Max-Q, 76 Wh | Asus ROG Strix Scar II GL704GW i7-8750H, GeForce RTX 2070 Mobile, 66 Wh | Razer Blade Pro 2017 i7-7820HK, GeForce GTX 1080 Mobile, 99 Wh | MSI GE75 8SG Raider i7-8750H, GeForce RTX 2080 Mobile, 65 Wh | Alienware 17 R5 i7-8750H, GeForce GTX 1070 Mobile, 99 Wh | Lenovo Legion Y730-17ICH, i7-8750H i7-8750H, GeForce GTX 1050 Ti Mobile, 76 Wh | |
|---|---|---|---|---|---|---|
| Akkumulátor üzemidő | 22% | 3% | 47% | 13% | 109% | |
| WiFi v1.3 (h) | 3.2 | 3.9 22% | 3.3 3% | 4.7 47% | 3.6 13% | 6.7 109% |
| Reader / Idle (h) | 6.2 | 4.2 | 7.8 | 4.5 | 13.2 | |
| Witcher 3 ultra (h) | 0.9 | 0.8 | ||||
| Load (h) | 1.1 | 1.4 | 0.9 | 1.1 | 0.9 |
Pro
Kontra
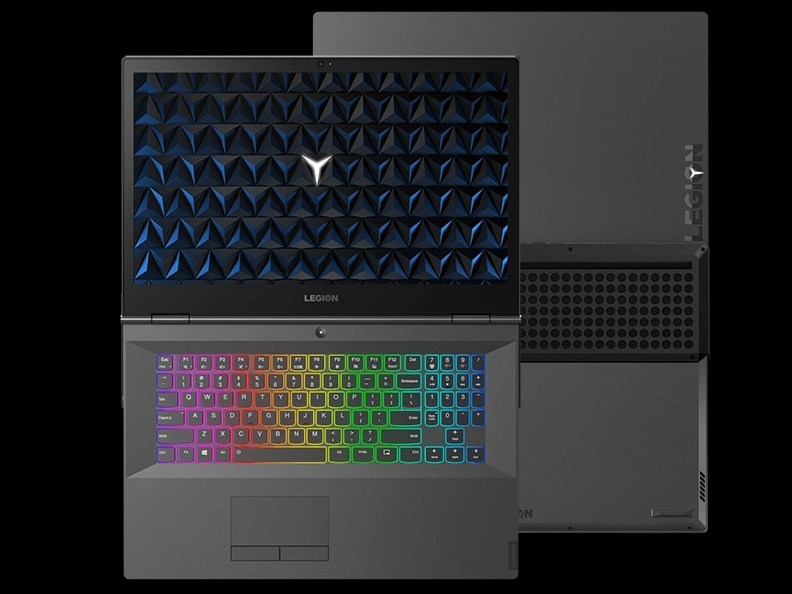
A legtöbb OEM normális esetben csak a csúcsmodelljei számára tartogatja a felsőkategóriás GeForce 80-as széria GPU-it. Ilyen volt a Lenovo esetében a Legion Y900-as család, de a gyártó ezt a szériát egyelőre félretette, így jelenleg a középkategóriás Legion Y700-as széria áll a kínálat legfelsőbb fokán. Az eredmény egy középkategóriás gamer laptop felső katgóriás GeForce GPU-val és jóval megfizethetőbb árakon, mint az olyan "szuper" gamer laptopok, amilyen az Alienware m17, Asus ROG G703, MSI GT75 vagy az Acer Triton 700. A Lenovo gépje több száz dollárral kevesebbért ugyanazt a gaming teljesítményt nyújtja, amelyet az előbb felsorolt alternatívák, főként azért, mert a váz dizájnja egyszerűbb és visszafogottabb.
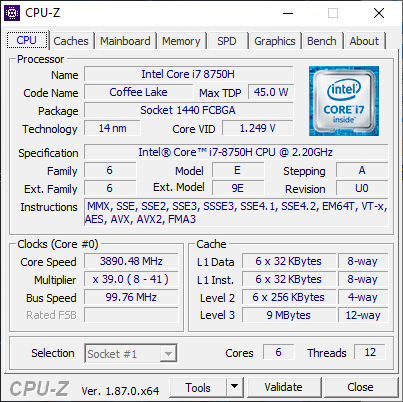
A kitűnő Turbo Boost technológia fenntarthatóságának köszönhetően a CPU teljesítmény gyorsabb, mint az átlagos Core i7-8750H. A vékony formatervezést és a nagy teljesítményt figyelembe véve, mind a maghőmérsékletek, mind pedig a ventilátorzaj a vártnál alacsonyabb szintűek.
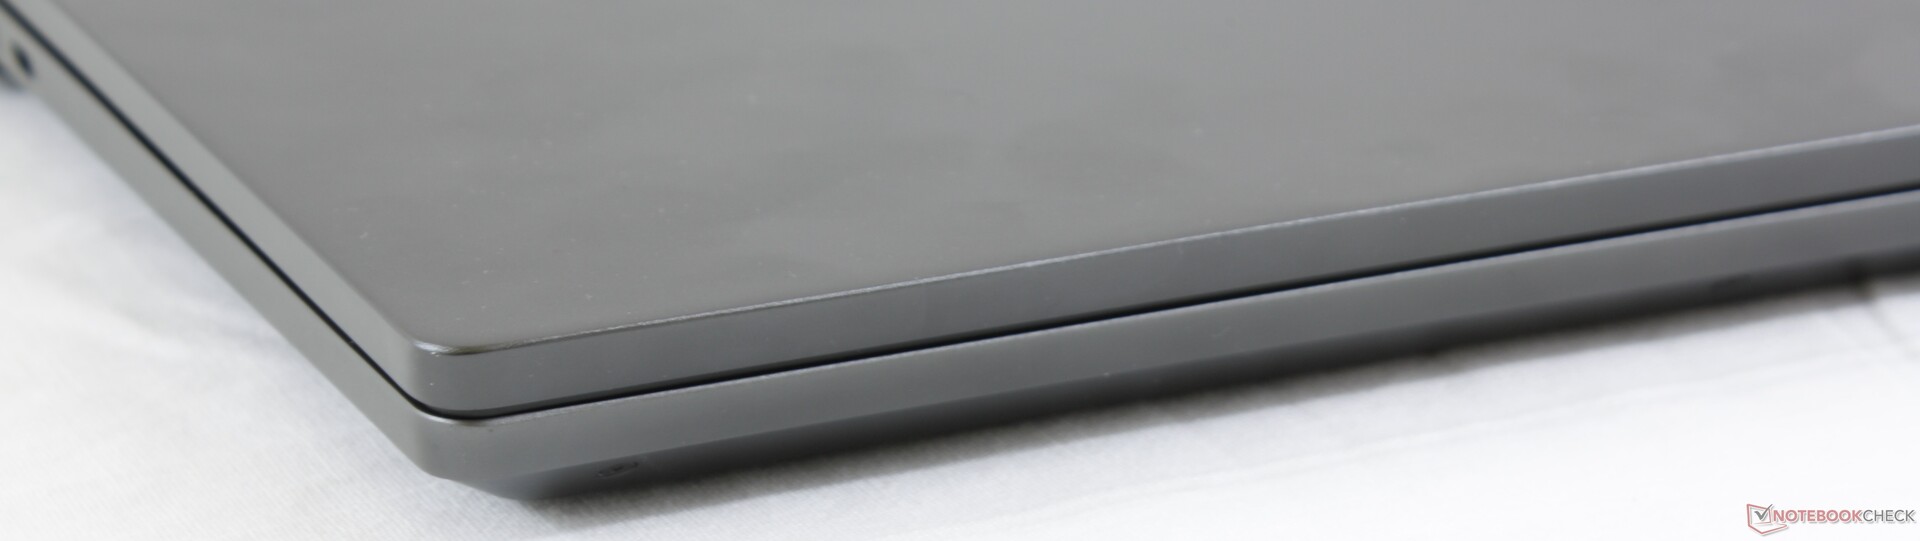
Mivel a Legion Y740 egy középkategóriás vázzal rendelkezik, ezért az első benyomás nem olyan erős, mint a fentebb említett csúcsgép-alternatívák esetében. A Lenovo váz nagyobb eséllyel hajlik vagy inog, mint a szilárdabb (és drágább) MSI GT75 vagy az Asus ROG G703. A magunk által használt tesztgép emellett közepes-erős backlight bleed-től és pontatlan színektől is szenved. Billentyűzetének gombjai finomabbak és általánosságban véve gyengébbek is. A játékosok nem fogják hiányolni a teljesítményt, viszont a gyengébb váz és gombok rontani fognak az össz-játékélményen.
A középkategóriás Legion Y740 jóval kevesebbért megkapható, mint amennyibe egy rivális 17.3 hüvelykes profi gamer laptop kerül, miközben ugyanazt a csúcskategóriás CPU-t és GPU-t hordozza magában. Kitűnő ár-érték aránya van a teljesítményt illetően, feltéve, hogy nem zavar a szerény dizájn és a hajlékonyabb váz.
Lenovo Legion Y740-17ICH
- 03/01/2019 v6 (old)
Allen Ngo
Price comparison

