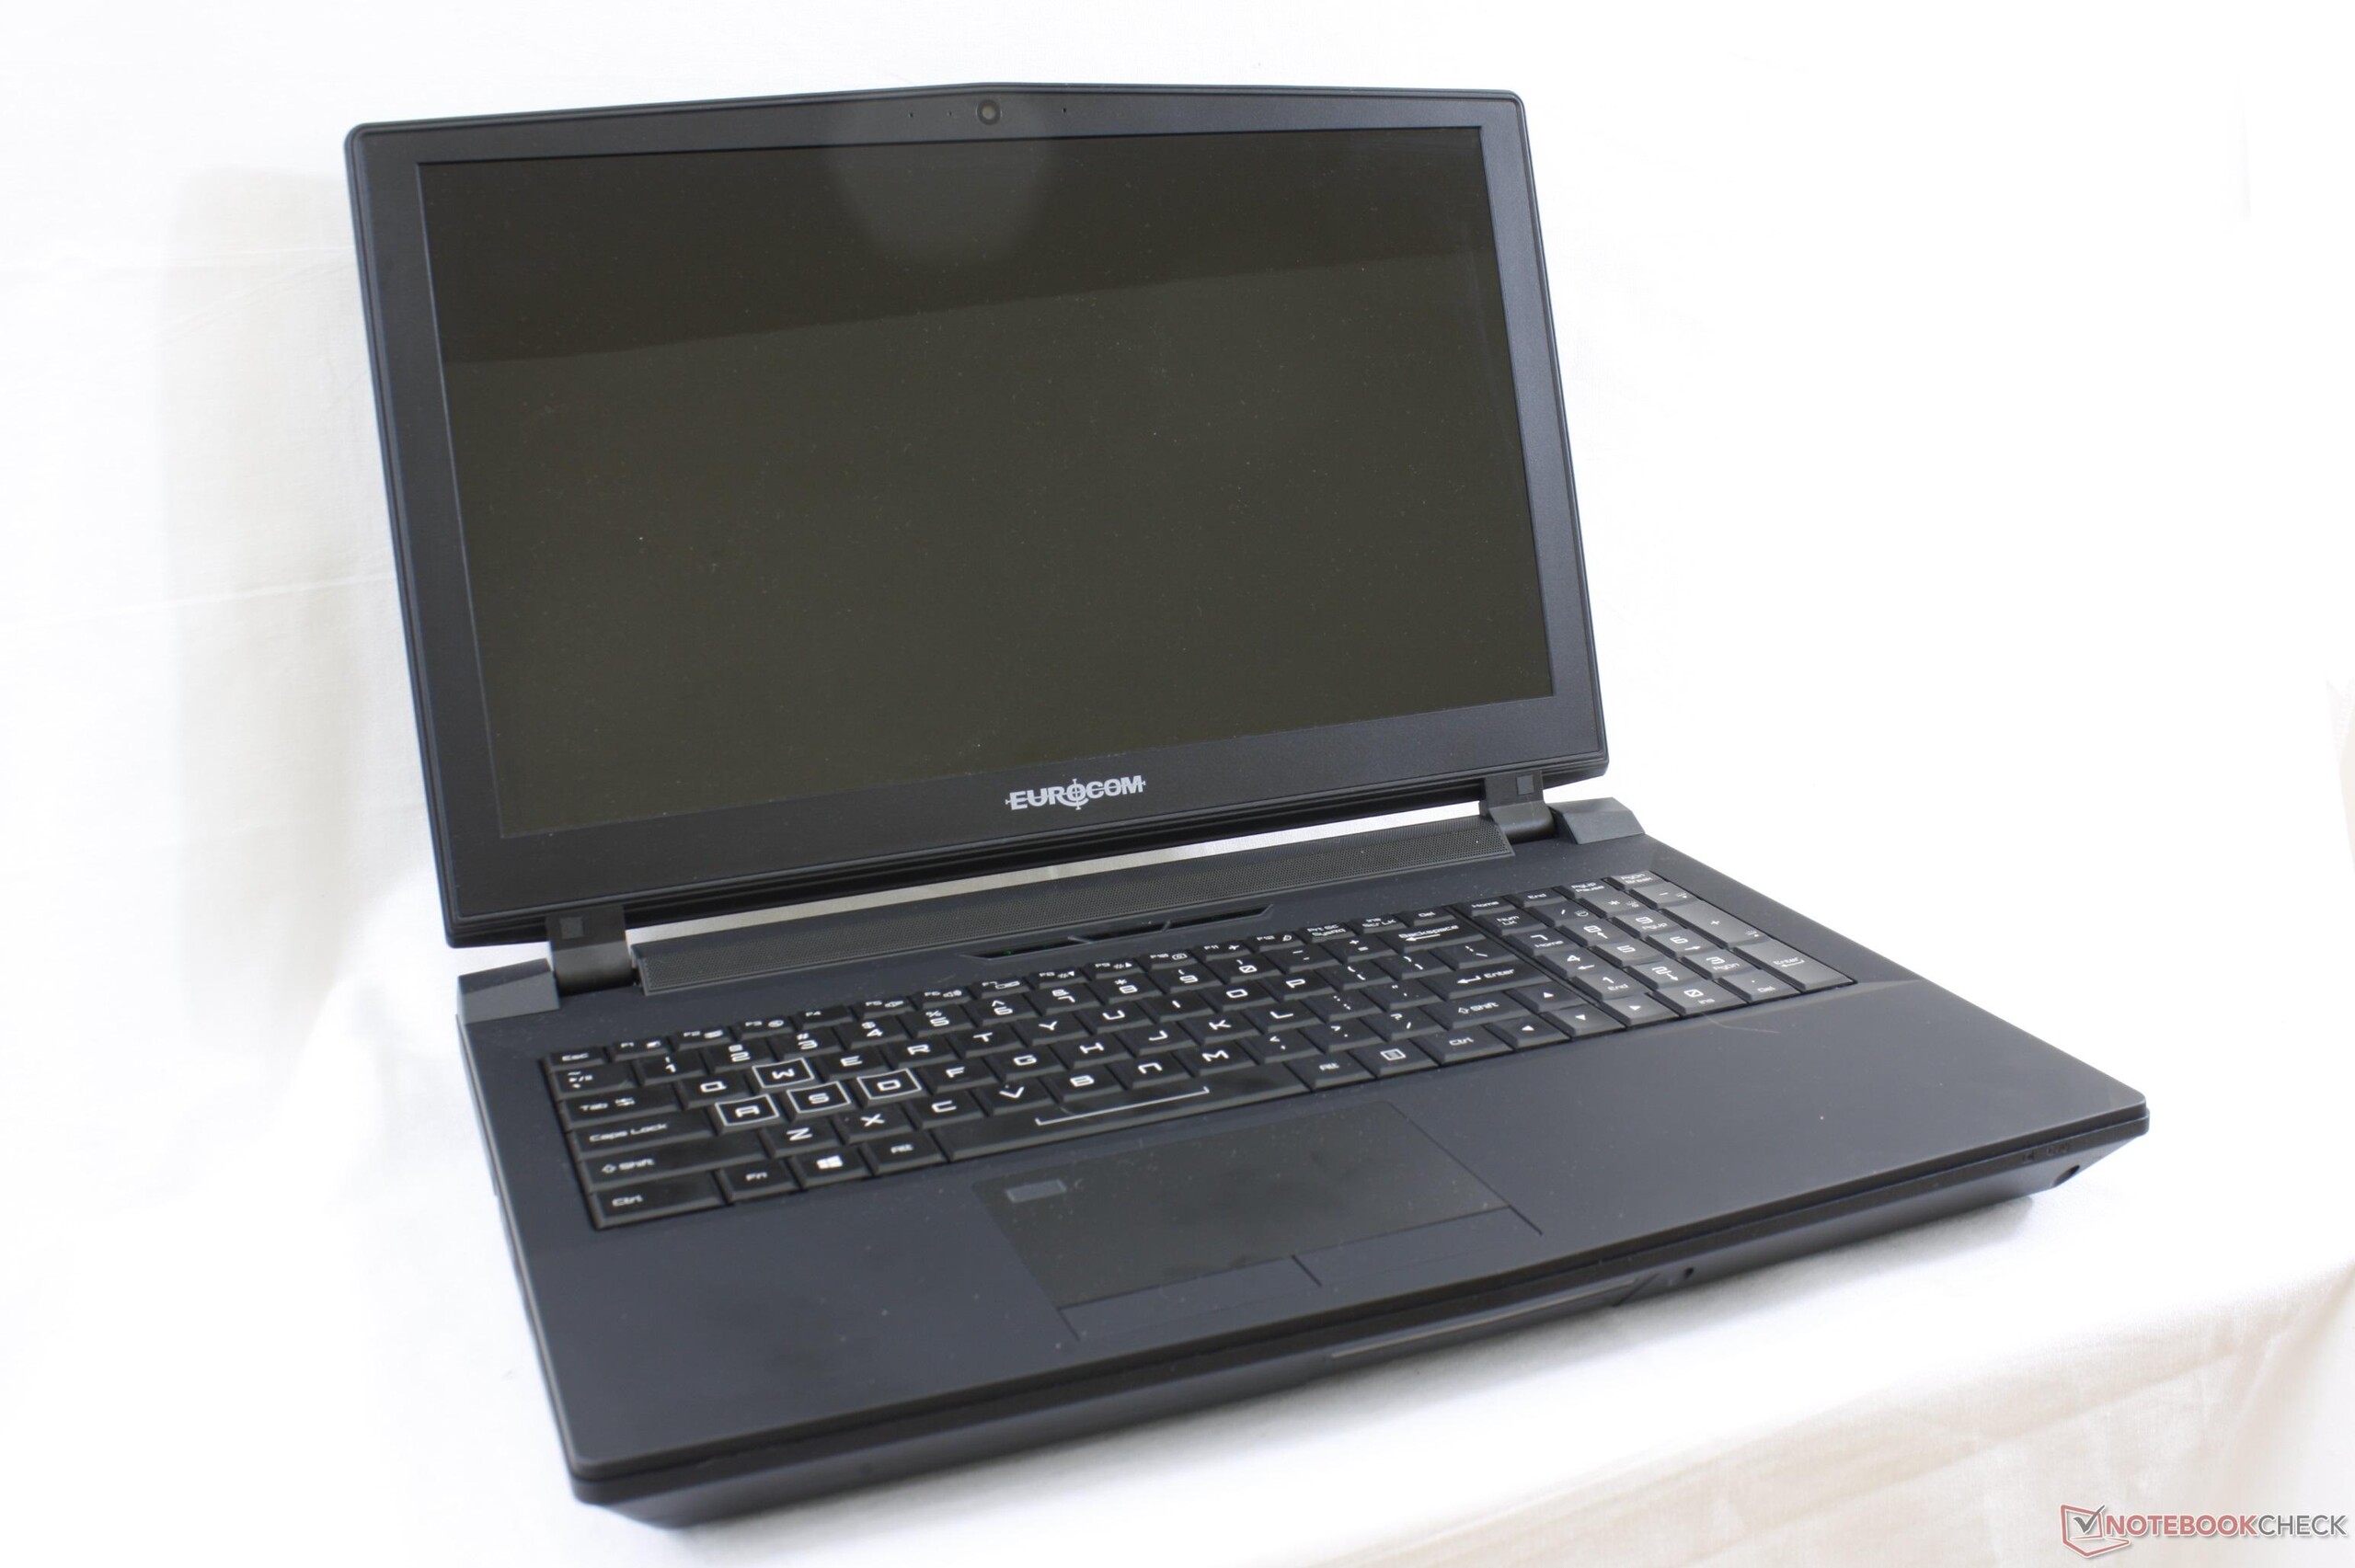
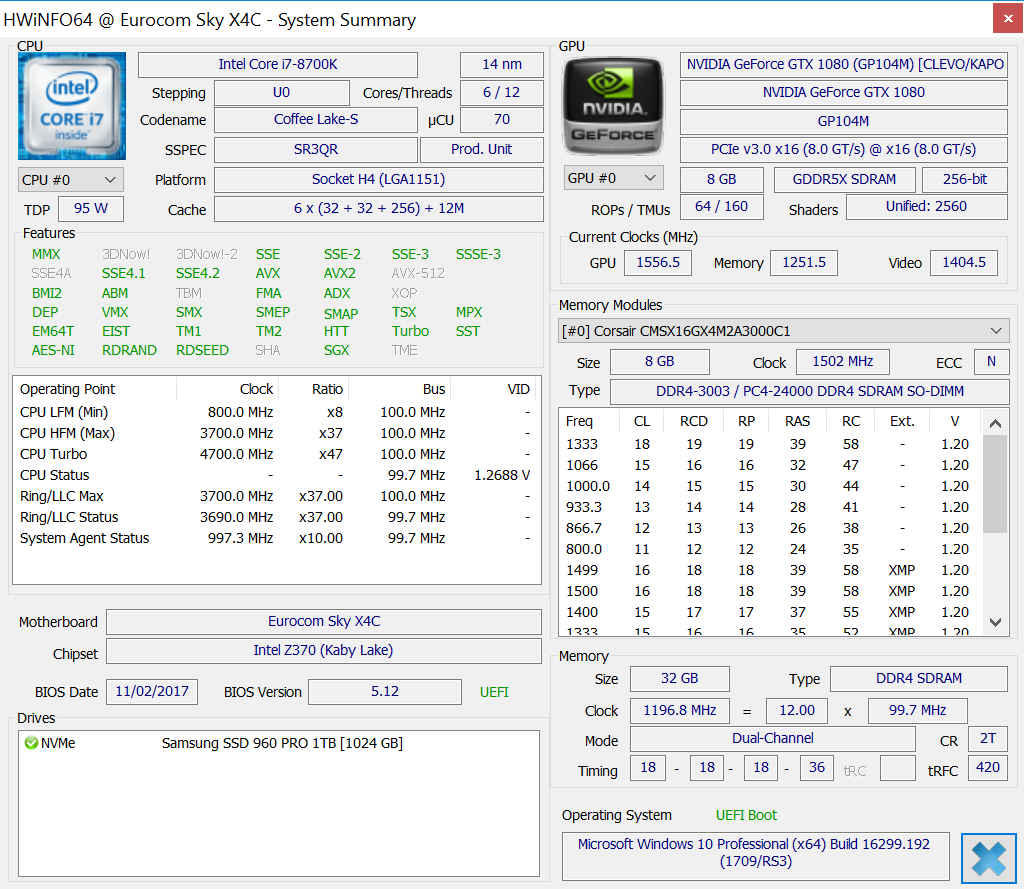
Eurocom Sky X4C (i7-8700K, GTX 1080, Clevo P751TM1-G) Laptop rövid értékelés
| SD Card Reader | |
| average JPG Copy Test (av. of 3 runs) | |
| Eurocom Sky X4C (Toshiba Exceria Pro SDXC 64 GB UHS-II) | |
| Dell XPS 15 9560 (i7-7700HQ, UHD) (Toshiba Exceria Pro SDXC 64 GB UHS-II) | |
| Acer Predator 15 G9-593-751X (Toshiba Exceria Pro SDXC 64 GB UHS-II) | |
| maximum AS SSD Seq Read Test (1GB) | |
| Dell XPS 15 9560 (i7-7700HQ, UHD) (Toshiba Exceria Pro SDXC 64 GB UHS-II) | |
| Eurocom Sky X4C (Toshiba Exceria Pro SDXC 64 GB UHS-II) | |
| Acer Predator 15 G9-593-751X (Toshiba Exceria Pro SDXC 64 GB UHS-II) | |
| Networking | |
| iperf3 transmit AX12 | |
| Acer Predator 15 G9-593-751X | |
| Eurocom Sky X4C | |
| MSI GT62VR 7RE-223 | |
| iperf3 receive AX12 | |
| Acer Predator 15 G9-593-751X | |
| MSI GT62VR 7RE-223 | |
| Eurocom Sky X4C | |
| |||||||||||||||||||||||||
Fényerő megoszlás: 81 %
Centrumban: 324.7 cd/m²
Kontraszt: 1249:1 (Fekete: 0.26 cd/m²)
ΔE ColorChecker Calman: 4.67 | ∀{0.5-29.43 Ø4.71}
ΔE Greyscale Calman: 5.9 | ∀{0.09-98 Ø4.96}
96.1% sRGB (Argyll 1.6.3 3D)
61.1% AdobeRGB 1998 (Argyll 1.6.3 3D)
67.2% AdobeRGB 1998 (Argyll 3D)
96.5% sRGB (Argyll 3D)
65.1% Display P3 (Argyll 3D)
Gamma: 2.14
CCT: 7176 K
| Eurocom Sky X4C ID: SHP142A, Name: LQ156D1JX01B, IPS, 15.6", 3840x2160 | MSI GT62VR 7RE-223 LG Philips LP156WF6 (LGD046F), IPS, 15.6", 1920x1080 | Alienware 15 R3 HPJGK_B156HTN (AUO51ED), TN, 15.6", 1920x1080 | Asus Strix GL502VS-FY032T LG Philips LP156WF6-SPB6 (LGD046F), IPS, 15.6", 1920x1080 | EVGA SC15 ID: AUO42ED, Name: AU Optronics B156HAN04.2, , 15.6", 1920x1080 | Dell XPS 15 9560 (i7-7700HQ, UHD) IGZO IPS, 15.6", 3840x2160 | |
|---|---|---|---|---|---|---|
| Display | -9% | -2% | -8% | -5% | 30% | |
| Display P3 Coverage (%) | 65.1 | 63.9 -2% | 66 1% | 64.5 -1% | 62.3 -4% | 89.7 38% |
| sRGB Coverage (%) | 96.5 | 83.1 -14% | 90.5 -6% | 83.1 -14% | 89.6 -7% | 100 4% |
| AdobeRGB 1998 Coverage (%) | 67.2 | 60.8 -10% | 66.2 -1% | 60.8 -10% | 63.6 -5% | 100 49% |
| Response Times | 8% | 45% | 9% | -9% | -44% | |
| Response Time Grey 50% / Grey 80% * (ms) | 33.6 ? | 37 ? -10% | 25 ? 26% | 38 ? -13% | 41.6 ? -24% | 57.2 ? -70% |
| Response Time Black / White * (ms) | 33.2 ? | 25 ? 25% | 12 ? 64% | 23 ? 31% | 30.8 ? 7% | 39.2 ? -18% |
| PWM Frequency (Hz) | 1000 ? | 962 | ||||
| Screen | -5% | -33% | -6% | -1% | 1% | |
| Brightness middle (cd/m²) | 324.7 | 310 -5% | 386 19% | 315 -3% | 281.5 -13% | 370.1 14% |
| Brightness (cd/m²) | 318 | 311 -2% | 382 20% | 290 -9% | 253 -20% | 356 12% |
| Brightness Distribution (%) | 81 | 85 5% | 93 15% | 85 5% | 73 -10% | 87 7% |
| Black Level * (cd/m²) | 0.26 | 0.3 -15% | 0.39 -50% | 0.32 -23% | 0.27 -4% | 0.37 -42% |
| Contrast (:1) | 1249 | 1033 -17% | 990 -21% | 984 -21% | 1043 -16% | 1000 -20% |
| Colorchecker dE 2000 * | 4.67 | 4.82 -3% | 10.2 -118% | 4.88 -4% | 3.9 16% | 5.3 -13% |
| Colorchecker dE 2000 max. * | 8.16 | 10.14 -24% | 15.81 -94% | 8.88 -9% | 7.1 13% | 9.9 -21% |
| Greyscale dE 2000 * | 5.9 | 3.94 33% | 11.28 -91% | 4.17 29% | 3.8 36% | 4.6 22% |
| Gamma | 2.14 103% | 2.45 90% | 2.23 99% | 2.53 87% | 2.27 97% | 2.31 95% |
| CCT | 7176 91% | 6877 95% | 11383 57% | 6683 97% | 7322 89% | 6284 103% |
| Color Space (Percent of AdobeRGB 1998) (%) | 61.1 | 54 -12% | 59 -3% | 55 -10% | 57.8 -5% | 88.3 45% |
| Color Space (Percent of sRGB) (%) | 96.1 | 83 -14% | 90 -6% | 83 -14% | 89.3 -7% | 100 4% |
| Teljes átlag (program / beállítások) | -2% /
-4% | 3% /
-16% | -2% /
-4% | -5% /
-3% | -4% /
1% |
* ... a kisebb jobb
Megjelenítési válaszidők
| ↔ Válaszidő Fekete-fehér | ||
|---|---|---|
| 33.2 ms ... emelkedés és süllyedés ↘ kombinálva | ↗ 21.2 ms emelkedés | 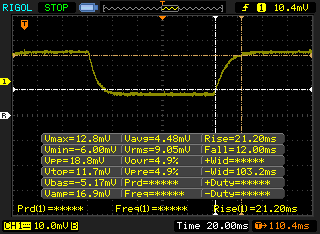 |
| ↘ 12 ms ősz | ||
| A képernyő lassú reakciósebességet mutat tesztjeinkben, és nem lesz kielégítő a játékosok számára. Összehasonlításképpen, az összes tesztelt eszköz 0.1 (minimum) és 240 (maximum) ms között mozog. » 90 % of all devices are better. Ez azt jelenti, hogy a mért válaszidő rosszabb, mint az összes vizsgált eszköz átlaga (19.8 ms). | ||
| ↔ Válaszidő 50% szürke és 80% szürke között | ||
| 33.6 ms ... emelkedés és süllyedés ↘ kombinálva | ↗ 19.6 ms emelkedés | 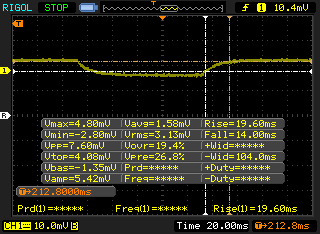 |
| ↘ 14 ms ősz | ||
| A képernyő lassú reakciósebességet mutat tesztjeinkben, és nem lesz kielégítő a játékosok számára. Összehasonlításképpen, az összes tesztelt eszköz 0.165 (minimum) és 636 (maximum) ms között mozog. » 46 % of all devices are better. Ez azt jelenti, hogy a mért válaszidő hasonló az összes vizsgált eszköz átlagához (31 ms). | ||
Képernyő villogása / PWM (impulzusszélesség-moduláció)
| Képernyő villogása / PWM észlelve | 1000 Hz | ≤ 20 % fényerő beállítása | 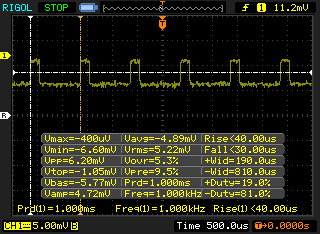 |
A kijelző háttérvilágítása 1000 Hz-en villog (a legrosszabb esetben, pl. PWM használatával) Villódzás észlelve a 20 % vagy annál kisebb fényerő-beállításnál. E fényerő-beállítás felett nem lehet villogás vagy PWM. A 1000 Hz frekvenciája meglehetősen magas, így a legtöbb PWM-re érzékeny felhasználó nem észlel semmilyen villogást. Összehasonlításképpen: az összes tesztelt eszköz 52 %-a nem használja a PWM-et a kijelző elsötétítésére. Ha PWM-et észleltek, akkor átlagosan 7754 (minimum: 5 - maximum: 343500) Hz-t mértek. | |||
| Cinebench R15 | |
| CPU Single 64Bit | |
| Eurocom Sky X4C | |
| Eurocom Tornado F5 | |
| Eurocom Sky X9C | |
| Smart7 Karme GX17E G2 | |
| Eurocom Tornado F5 Killer Edition | |
| Alienware 15 R3 Max-Q | |
| Eurocom Sky X7E2 | |
| AMD Ryzen 1800X - Asus Crosshair VI Hero | |
| Asus GL702ZC-GC104T | |
| Apple MacBook Pro 15 2016 (2.6 GHz, 450) | |
| Asus GL503VD-DB74 | |
| Dell Inspiron 15 7000 7577 | |
| CPU Multi 64Bit | |
| AMD Ryzen 1800X - Asus Crosshair VI Hero | |
| Asus GL702ZC-GC104T | |
| Eurocom Sky X9C | |
| Eurocom Sky X4C | |
| Smart7 Karme GX17E G2 | |
| Eurocom Tornado F5 | |
| Eurocom Sky X7E2 | |
| Alienware 15 R3 Max-Q | |
| Asus GL503VD-DB74 | |
| Apple MacBook Pro 15 2016 (2.6 GHz, 450) | |
| Eurocom Tornado F5 Killer Edition | |
| Dell Inspiron 15 7000 7577 | |
| Cinebench R11.5 | |
| CPU Single 64Bit | |
| Eurocom Sky X9C | |
| Eurocom Tornado F5 | |
| Eurocom Sky X4C | |
| Eurocom Tornado F5 Killer Edition | |
| Alienware 15 R3 Max-Q | |
| Asus GL503VD-DB74 | |
| AMD Ryzen 1800X - Asus Crosshair VI Hero | |
| Eurocom Sky X7E2 | |
| Asus GL702ZC-GC104T | |
| Apple MacBook Pro 15 2016 (2.6 GHz, 450) | |
| Dell Inspiron 15 7000 7577 | |
| CPU Multi 64Bit | |
| AMD Ryzen 1800X - Asus Crosshair VI Hero | |
| Asus GL702ZC-GC104T | |
| Eurocom Sky X9C | |
| Eurocom Sky X4C | |
| Eurocom Tornado F5 | |
| Eurocom Sky X7E2 | |
| Alienware 15 R3 Max-Q | |
| Asus GL503VD-DB74 | |
| Eurocom Tornado F5 Killer Edition | |
| Apple MacBook Pro 15 2016 (2.6 GHz, 450) | |
| Dell Inspiron 15 7000 7577 | |
| Cinebench R10 | |
| Rendering Multiple CPUs 32Bit | |
| Eurocom Sky X9C | |
| Eurocom Sky X4C | |
| AMD Ryzen 1800X - Asus Crosshair VI Hero | |
| Asus GL702ZC-GC104T | |
| Eurocom Tornado F5 | |
| Eurocom Sky X7E2 | |
| Eurocom Tornado F5 Killer Edition | |
| Alienware 15 R3 Max-Q | |
| Asus GL503VD-DB74 | |
| Dell Inspiron 15 7000 7577 | |
| Rendering Single 32Bit | |
| Eurocom Sky X9C | |
| Eurocom Sky X4C | |
| Eurocom Tornado F5 | |
| Eurocom Tornado F5 Killer Edition | |
| Eurocom Sky X7E2 | |
| Alienware 15 R3 Max-Q | |
| Asus GL503VD-DB74 | |
| Dell Inspiron 15 7000 7577 | |
| AMD Ryzen 1800X - Asus Crosshair VI Hero | |
| Asus GL702ZC-GC104T | |
| wPrime 2.10 - 1024m | |
| Dell Inspiron 15 7000 7577 | |
| Eurocom Tornado F5 Killer Edition | |
| Asus GL503VD-DB74 | |
| Eurocom Sky X7E2 | |
| Smart7 Karme GX17E G2 | |
| Eurocom Tornado F5 | |
| Eurocom Sky X4C | |
| Eurocom Sky X9C | |
| AMD Ryzen 1800X - Asus Crosshair VI Hero | |
* ... a kisebb jobb
| PCMark 8 | |
| Home Score Accelerated v2 | |
| Eurocom Sky X4C | |
| Acer Predator 15 G9-593-751X | |
| EVGA SC15 | |
| MSI GT62VR 7RE-223 | |
| Eurocom Sky X9C | |
| Alienware 15 R3 | |
| Asus Strix GL502VS-FY032T | |
| Work Score Accelerated v2 | |
| Acer Predator 15 G9-593-751X | |
| MSI GT62VR 7RE-223 | |
| EVGA SC15 | |
| Alienware 15 R3 | |
| Eurocom Sky X4C | |
| Eurocom Sky X9C | |
| Asus Strix GL502VS-FY032T | |
| Creative Score Accelerated v2 | |
| Eurocom Sky X9C | |
| Eurocom Sky X4C | |
| Acer Predator 15 G9-593-751X | |
| MSI GT62VR 7RE-223 | |
| Alienware 15 R3 | |
| EVGA SC15 | |
| PCMark 10 - Score | |
| Eurocom Sky X4C | |
| Eurocom Sky X9C | |
| PCMark 8 Home Score Accelerated v2 | 5225 pontok | |
| PCMark 8 Creative Score Accelerated v2 | 9222 pontok | |
| PCMark 8 Work Score Accelerated v2 | 5181 pontok | |
| PCMark 10 Score | 6620 pontok | |
Segítség | ||
| Eurocom Sky X4C Samsung SSD 960 Pro 1TB m.2 NVMe | Acer Predator 15 G9-593-751X Samsung SM951 MZVPV256HDGL m.2 PCI-e | MSI GT62VR 7RE-223 Samsung SSD PM871a MZNLN256HMHQ | Asus Strix GL502VS-FY032T SanDisk SD8SNAT256G1002 | EVGA SC15 Toshiba NVMe THNSN5256GPU7 | |
|---|---|---|---|---|---|
| AS SSD | -30% | -74% | -123% | -35% | |
| Copy Game MB/s (MB/s) | 1055 | 1091 3% | 377.8 -64% | 977 -7% | |
| Copy Program MB/s (MB/s) | 467.2 | 488.6 5% | 199 -57% | 442.3 -5% | |
| Copy ISO MB/s (MB/s) | 1908 | 1575 -17% | 354.7 -81% | 1071 -44% | |
| Score Total (Points) | 4615 | 2574 -44% | 1019 -78% | 598 -87% | 2474 -46% |
| Score Write (Points) | 1703 | 570 -67% | 304 -82% | 288 -83% | 896 -47% |
| Score Read (Points) | 1945 | 1350 -31% | 472 -76% | 207 -89% | 1081 -44% |
| Access Time Write * (ms) | 0.03 | 0.032 -7% | 0.037 -23% | 0.161 -437% | 0.035 -17% |
| Access Time Read * (ms) | 0.032 | 0.059 -84% | 0.1 -213% | 0.097 -203% | 0.054 -69% |
| 4K-64 Write (MB/s) | 1375 | 346 -75% | 171.6 -88% | 191.8 -86% | 706 -49% |
| 4K-64 Read (MB/s) | 1646 | 1109 -33% | 383.4 -77% | 140.7 -91% | 822 -50% |
| 4K Write (MB/s) | 129.6 | 117.3 -9% | 104 -20% | 65.5 -49% | 95.5 -26% |
| 4K Read (MB/s) | 44.83 | 46.35 3% | 37.2 -17% | 16.31 -64% | 39.13 -13% |
| Seq Write (MB/s) | 1989 | 1067 -46% | 288.2 -86% | 309.9 -84% | 943 -53% |
| Seq Read (MB/s) | 2541 | 1941 -24% | 510 -80% | 504 -80% | 2203 -13% |
* ... a kisebb jobb

| 3DMark | |
| 1920x1080 Fire Strike Graphics | |
| Eurocom Sky X9C | |
| Aorus X9 | |
| Nvidia GeForce GTX 1080 Ti Founders Edition | |
| Eurocom Sky X4C | |
| Nvidia GeForce GTX 1080 Founders Edition | |
| Razer Blade Pro 2017 | |
| Alienware 15 R3 Max-Q | |
| Nvidia GeForce GTX 1070 Ti Founders Edition | |
| MSI GF72VR 7RF | |
| 3840x2160 Fire Strike Ultra Graphics | |
| Eurocom Sky X9C | |
| Nvidia GeForce GTX 1080 Ti Founders Edition | |
| Eurocom Sky X4C | |
| Nvidia GeForce GTX 1080 Founders Edition | |
| Nvidia GeForce GTX 1070 Ti Founders Edition | |
| Alienware 15 R3 Max-Q | |
| MSI GF72VR 7RF | |
| Fire Strike Extreme Graphics | |
| Eurocom Sky X9C | |
| Eurocom Sky X4C | |
| Nvidia GeForce GTX 1080 Founders Edition | |
| Nvidia GeForce GTX 1070 Ti Founders Edition | |
| Alienware 15 R3 Max-Q | |
| MSI GF72VR 7RF | |
| 3DMark 11 | |
| 1280x720 Performance GPU | |
| Eurocom Sky X9C | |
| Aorus X9 | |
| Nvidia GeForce GTX 1080 Ti Founders Edition | |
| Nvidia GeForce GTX 1080 Founders Edition | |
| Nvidia GeForce GTX 1070 Ti Founders Edition | |
| Eurocom Sky X4C | |
| Razer Blade Pro 2017 | |
| Alienware 15 R3 Max-Q | |
| MSI GF72VR 7RF | |
| 1280x720 Performance Combined | |
| Nvidia GeForce GTX 1070 Ti Founders Edition | |
| Eurocom Sky X9C | |
| Eurocom Sky X4C | |
| Nvidia GeForce GTX 1080 Founders Edition | |
| Nvidia GeForce GTX 1080 Ti Founders Edition | |
| Razer Blade Pro 2017 | |
| Aorus X9 | |
| Alienware 15 R3 Max-Q | |
| MSI GF72VR 7RF | |
| 3DMark 11 Performance | 22125 pontok | |
| 3DMark Ice Storm Standard Score | 194644 pontok | |
| 3DMark Cloud Gate Standard Score | 41694 pontok | |
| 3DMark Fire Strike Score | 18551 pontok | |
| 3DMark Fire Strike Extreme Score | 9551 pontok | |
Segítség | ||
| Rise of the Tomb Raider - 3840x2160 High Preset AA:FX AF:4x | |
| Eurocom Sky X9C | |
| Nvidia GeForce GTX 1080 Ti Founders Edition | |
| Nvidia GeForce GTX 1080 Ti Founders Edition | |
| Eurocom Sky X4C | |
| Nvidia GeForce GTX 1080 Founders Edition | |
| Nvidia GeForce GTX 1080 Founders Edition | |
| Nvidia GeForce GTX 1070 Ti Founders Edition | |
| Asus Zephyrus GX501 | |
| Eurocom Q5 | |
| Fallout 4 - 3840x2160 High Preset AA:T AF:16x | |
| Eurocom Sky X9C | |
| Nvidia GeForce GTX 1080 Ti Founders Edition | |
| Nvidia GeForce GTX 1080 Founders Edition | |
| Eurocom Sky X4C | |
| Eurocom Q5 | |
| alacsony | közepes | magas | ultra | 4K | |
|---|---|---|---|---|---|
| BioShock Infinite (2013) | 181.2 | ||||
| Metro: Last Light (2013) | 141.1 | ||||
| Thief (2014) | 127.6 | ||||
| The Witcher 3 (2015) | 75.3 | 53.4 | |||
| Batman: Arkham Knight (2015) | 101 | 55 | |||
| Metal Gear Solid V (2015) | 60 | 60 | |||
| Fallout 4 (2015) | 123.4 | 53.4 | |||
| Rise of the Tomb Raider (2016) | 111.7 | 50.6 | |||
| Overwatch (2016) | 195.6 | 92.1 | |||
| Mafia 3 (2016) | 81.2 | 32.5 | |||
| Prey (2017) | 143 | 70.9 | |||
| Middle-earth: Shadow of War (2017) | 94 | 37 | |||
| Destiny 2 (2017) | 139.1 | 38.4 |
Zajszint
| Üresjárat |
| 28.6 / 28.6 / 31.1 dB(A) |
| HDD |
| 0 dB(A) |
| Terhelés |
| 42.2 / 50 dB(A) |
 | ||
30 dB csendes 40 dB(A) hallható 50 dB(A) hangos |
||
min: | ||
| Eurocom Sky X4C GeForce GTX 1080 Mobile, i7-8700K, Samsung SSD 960 Pro 1TB m.2 NVMe | Alienware 15 R3 Max-Q GeForce GTX 1080 Max-Q, i7-7820HK, LiteOn CX2-8B256 | MSI GT62VR 7RE-223 GeForce GTX 1070 Mobile, i7-7700HQ, Samsung SSD PM871a MZNLN256HMHQ | Asus Strix GL502VS-FY032T GeForce GTX 1070 Mobile, 6700HQ, SanDisk SD8SNAT256G1002 | EVGA SC15 GeForce GTX 1060 Mobile, i7-7700HQ, Toshiba NVMe THNSN5256GPU7 | Alienware 15 R3 GeForce GTX 1070 Mobile, i7-7700HQ | |
|---|---|---|---|---|---|---|
| Noise | -6% | -8% | -6% | 1% | -13% | |
| off / környezet * (dB) | 28.6 | 29 -1% | 30 -5% | 30 -5% | 28 2% | 30 -5% |
| Idle Minimum * (dB) | 28.6 | 32 -12% | 34 -19% | 32 -12% | 31.9 -12% | 31 -8% |
| Idle Average * (dB) | 28.6 | 33 -15% | 35 -22% | 33 -15% | 32 -12% | 32 -12% |
| Idle Maximum * (dB) | 31.1 | 35 -13% | 36 -16% | 34 -9% | 32 -3% | 42 -35% |
| Load Average * (dB) | 42.2 | 46 -9% | 40 5% | 39 8% | 36.5 14% | 49 -16% |
| Witcher 3 ultra * (dB) | 53.8 | 48 11% | 40.3 25% | |||
| Load Maximum * (dB) | 50 | 50 -0% | 46 8% | 51 -2% | 53.4 -7% | 50 -0% |
* ... a kisebb jobb
(±) A felső oldalon a maximális hőmérséklet 43.8 °C / 111 F, összehasonlítva a 40.4 °C / 105 F átlagával , 21.2 és 68.8 °C között a Gaming osztálynál.
(-) Az alsó maximum 49.6 °C / 121 F-ig melegszik fel, összehasonlítva a 43.2 °C / 110 F átlagával
(+) Üresjáratban a felső oldal átlagos hőmérséklete 26.4 °C / 80 F, összehasonlítva a 33.9 °C / ### eszközátlaggal class_avg_f### F.
(+) A The Witcher 3 játék során a felső oldal átlaghőmérséklete 30 °C / 86 F, összehasonlítva a 33.9 °C / ## eszközátlaggal #class_avg_f### F.
(+) A csuklótámasz és az érintőpad hűvösebb, mint a bőr hőmérséklete, maximum 27.6 °C / 81.7 F, ezért hűvös tapintású.
(±) A hasonló eszközök csuklótámasz területének átlagos hőmérséklete 28.8 °C / 83.8 F volt (+1.2 °C / 2.1 F).
| Kikapcsolt állapot / Készenlét | |
| Üresjárat | |
| Terhelés |
|
Kulcs:
min: | |
| Eurocom Sky X4C i7-8700K, GeForce GTX 1080 Mobile, Samsung SSD 960 Pro 1TB m.2 NVMe, IPS, 3840x2160, 15.6" | Alienware 15 R3 Max-Q i7-7820HK, GeForce GTX 1080 Max-Q, LiteOn CX2-8B256, IPS, 1920x1080, 15.6" | MSI GT62VR 7RE-223 i7-7700HQ, GeForce GTX 1070 Mobile, Samsung SSD PM871a MZNLN256HMHQ, IPS, 1920x1080, 15.6" | EVGA SC15 i7-7700HQ, GeForce GTX 1060 Mobile, Toshiba NVMe THNSN5256GPU7, , 1920x1080, 15.6" | Alienware 15 R3 i7-7700HQ, GeForce GTX 1070 Mobile, , TN, 1920x1080, 15.6" | Eurocom Tornado F5 Killer Edition i5-7600K, GeForce GTX 1080 Mobile, Samsung SSD 960 Evo 250GB m.2 NVMe, IPS, 3840x2160, 15.6" | |
|---|---|---|---|---|---|---|
| Power Consumption | 18% | 27% | 27% | 28% | -8% | |
| Idle Minimum * (Watt) | 30.2 | 22 27% | 20 34% | 25.8 15% | 19 37% | 28.4 6% |
| Idle Average * (Watt) | 34.7 | 26 25% | 24 31% | 26.6 23% | 23 34% | 32 8% |
| Idle Maximum * (Watt) | 37.8 | 33 13% | 29 23% | 26.7 29% | 29 23% | 33.5 11% |
| Load Average * (Watt) | 130.3 | 86 34% | 82 37% | 80.3 38% | 85 35% | 190.9 -47% |
| Witcher 3 ultra * (Watt) | 172.2 | 159 8% | 121.2 30% | |||
| Load Maximum * (Watt) | 217.7 | 215 1% | 193 11% | 159.3 27% | 192 12% | 259.4 -19% |
* ... a kisebb jobb
| Eurocom Sky X4C i7-8700K, GeForce GTX 1080 Mobile, 82 Wh | Alienware 15 R3 Max-Q i7-7820HK, GeForce GTX 1080 Max-Q, 99 Wh | MSI GT62VR 7RE-223 i7-7700HQ, GeForce GTX 1070 Mobile, 75 Wh | Asus Strix GL502VS-FY032T 6700HQ, GeForce GTX 1070 Mobile, 62 Wh | EVGA SC15 i7-7700HQ, GeForce GTX 1060 Mobile, 62 Wh | Acer Predator 15 G9-593-751X i7-7700HQ, GeForce GTX 1070 Mobile, 90 Wh | |
|---|---|---|---|---|---|---|
| Akkumulátor üzemidő | 94% | 61% | 12% | 10% | 112% | |
| Reader / Idle (h) | 3 | 7.1 137% | 6.3 110% | 4.1 37% | 3.7 23% | 8.4 180% |
| WiFi v1.3 (h) | 2.6 | 5.4 108% | 4.1 58% | 3.3 27% | 2.8 8% | 5.5 112% |
| Load (h) | 1.4 | 1.9 36% | 1.6 14% | 1 -29% | 1.4 0% | 2 43% |
Pro
Kontra
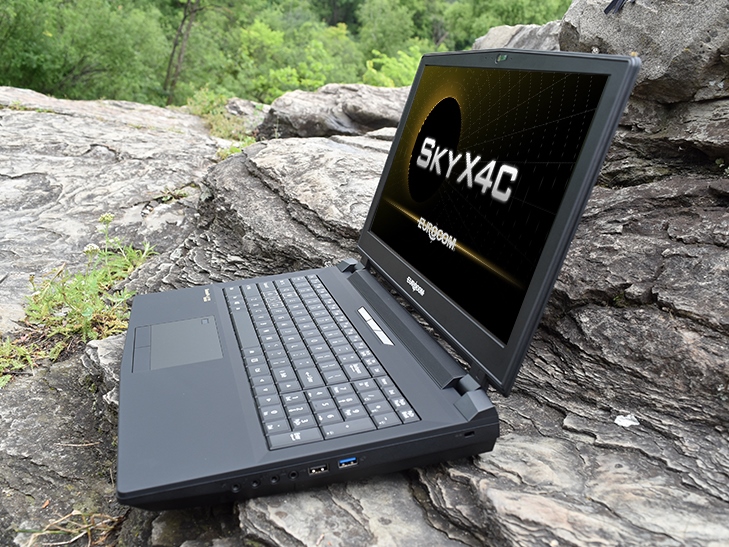
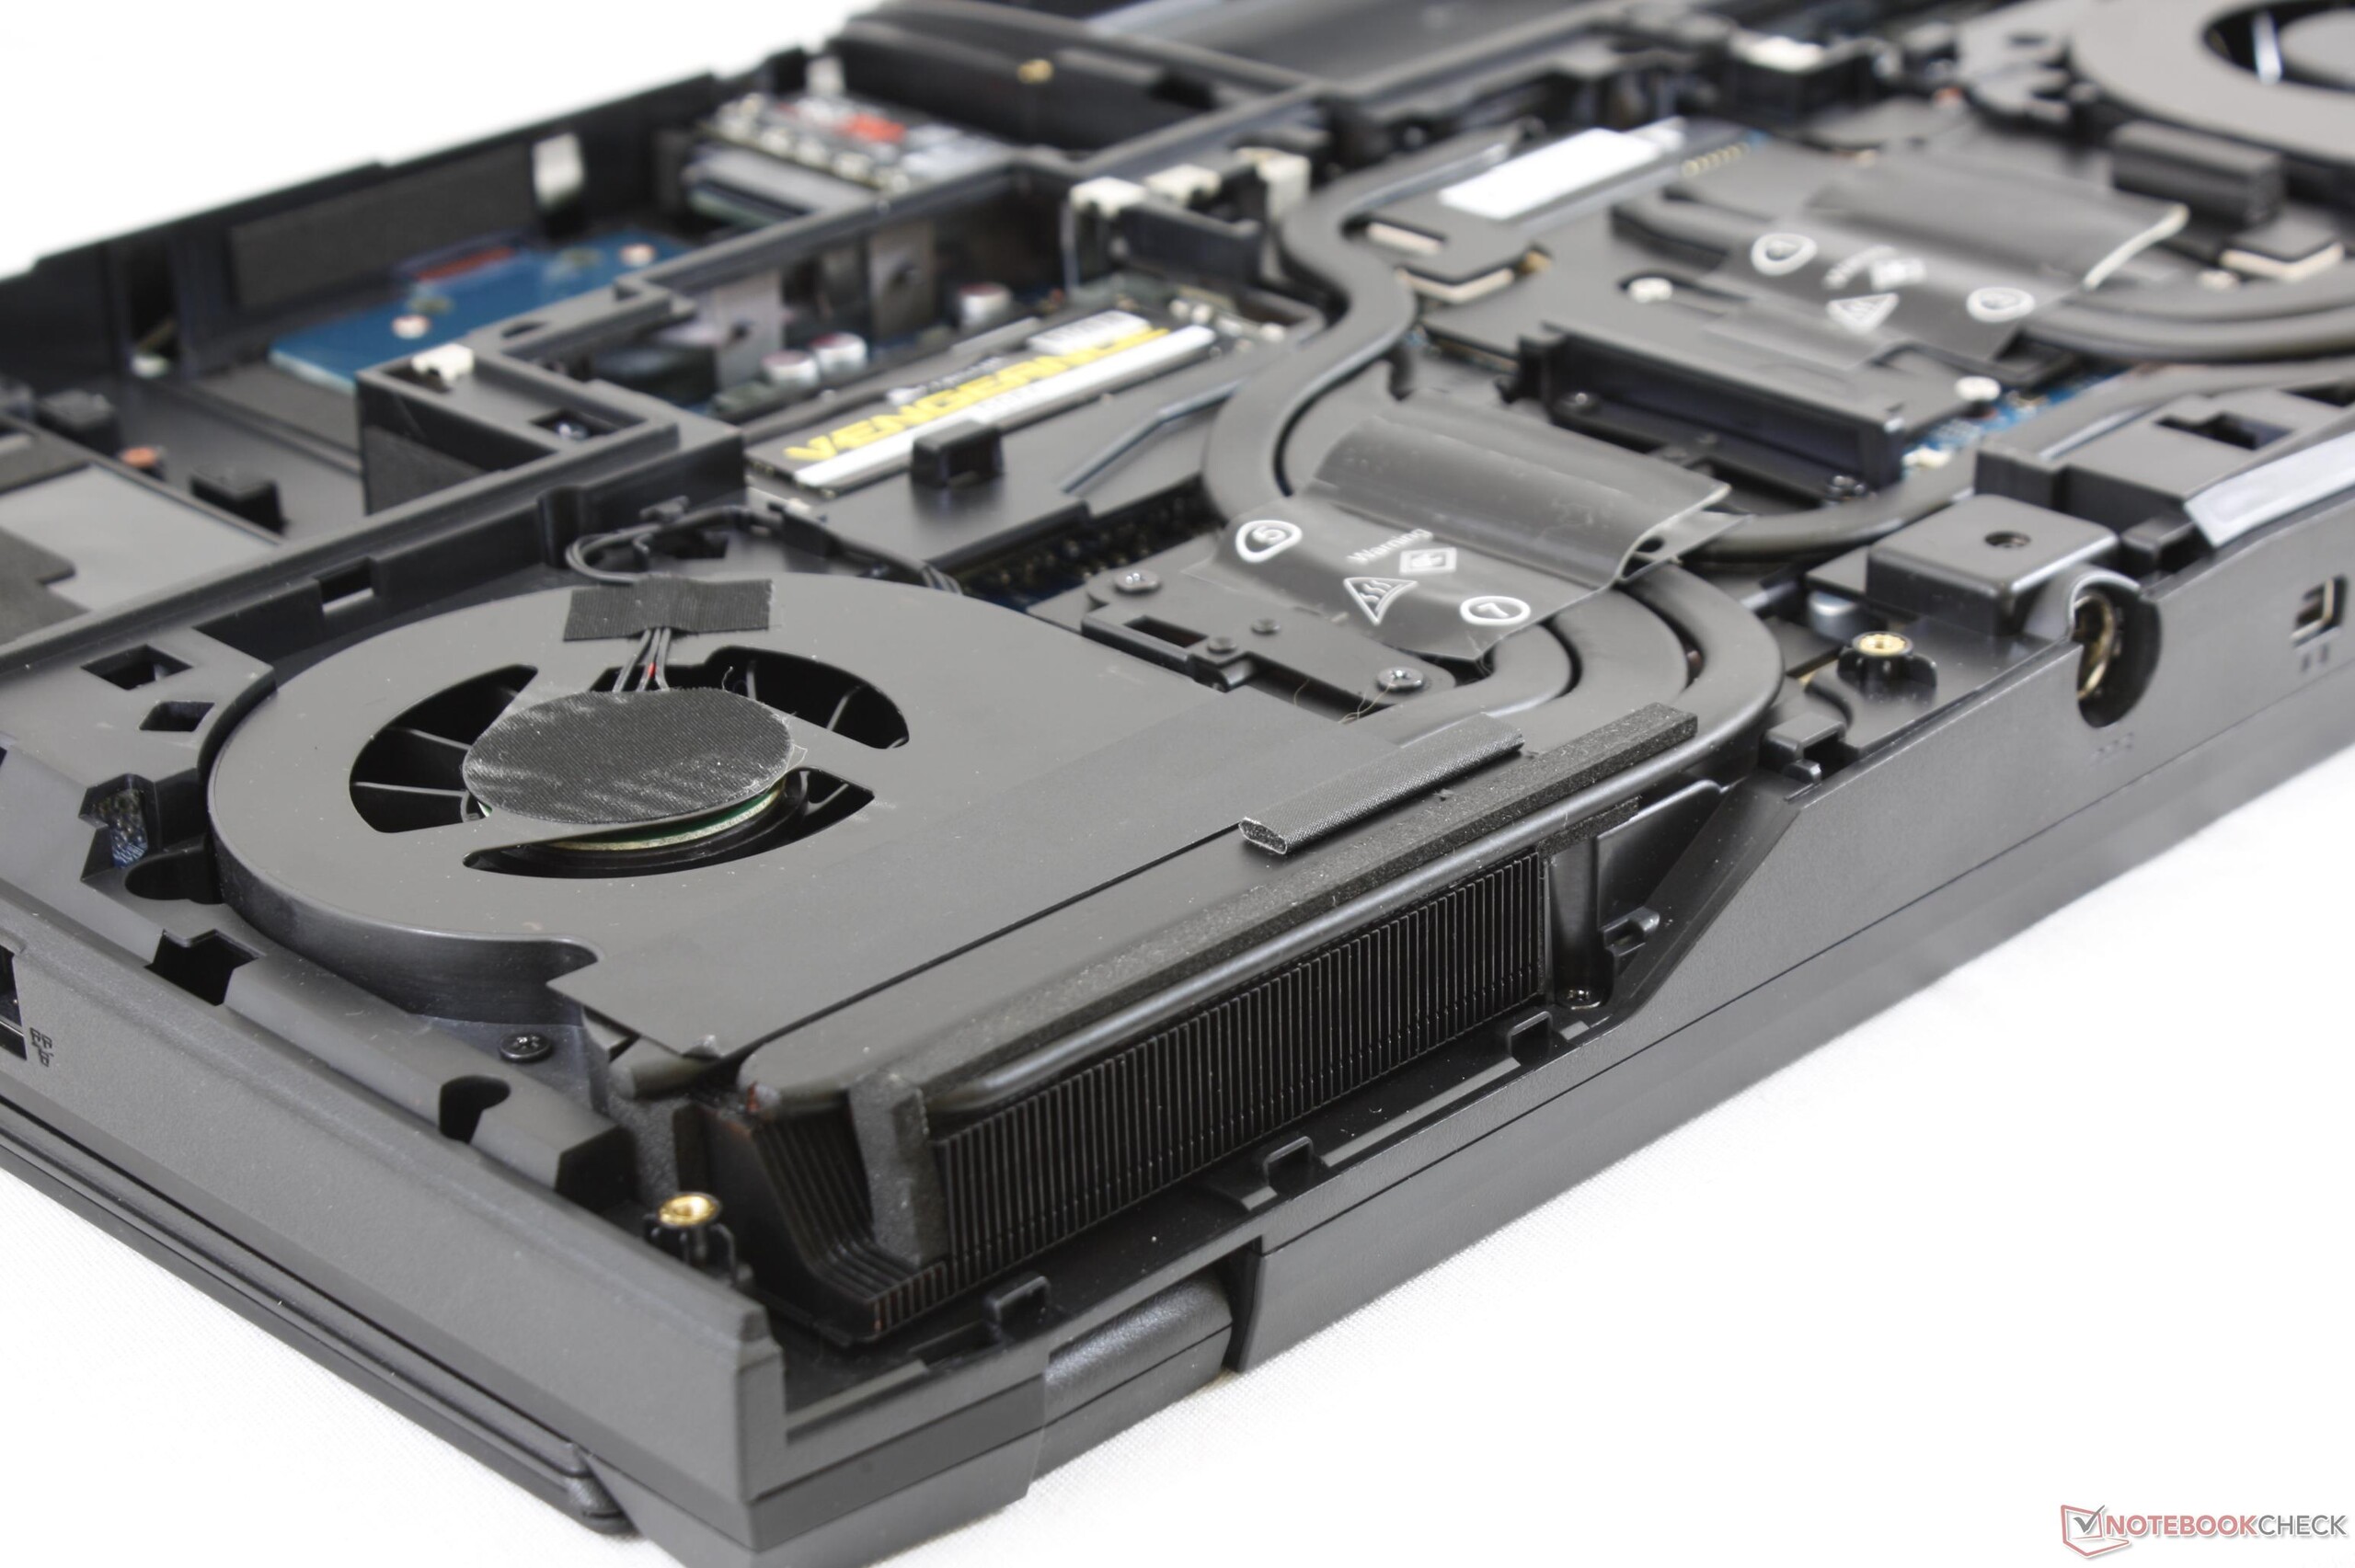
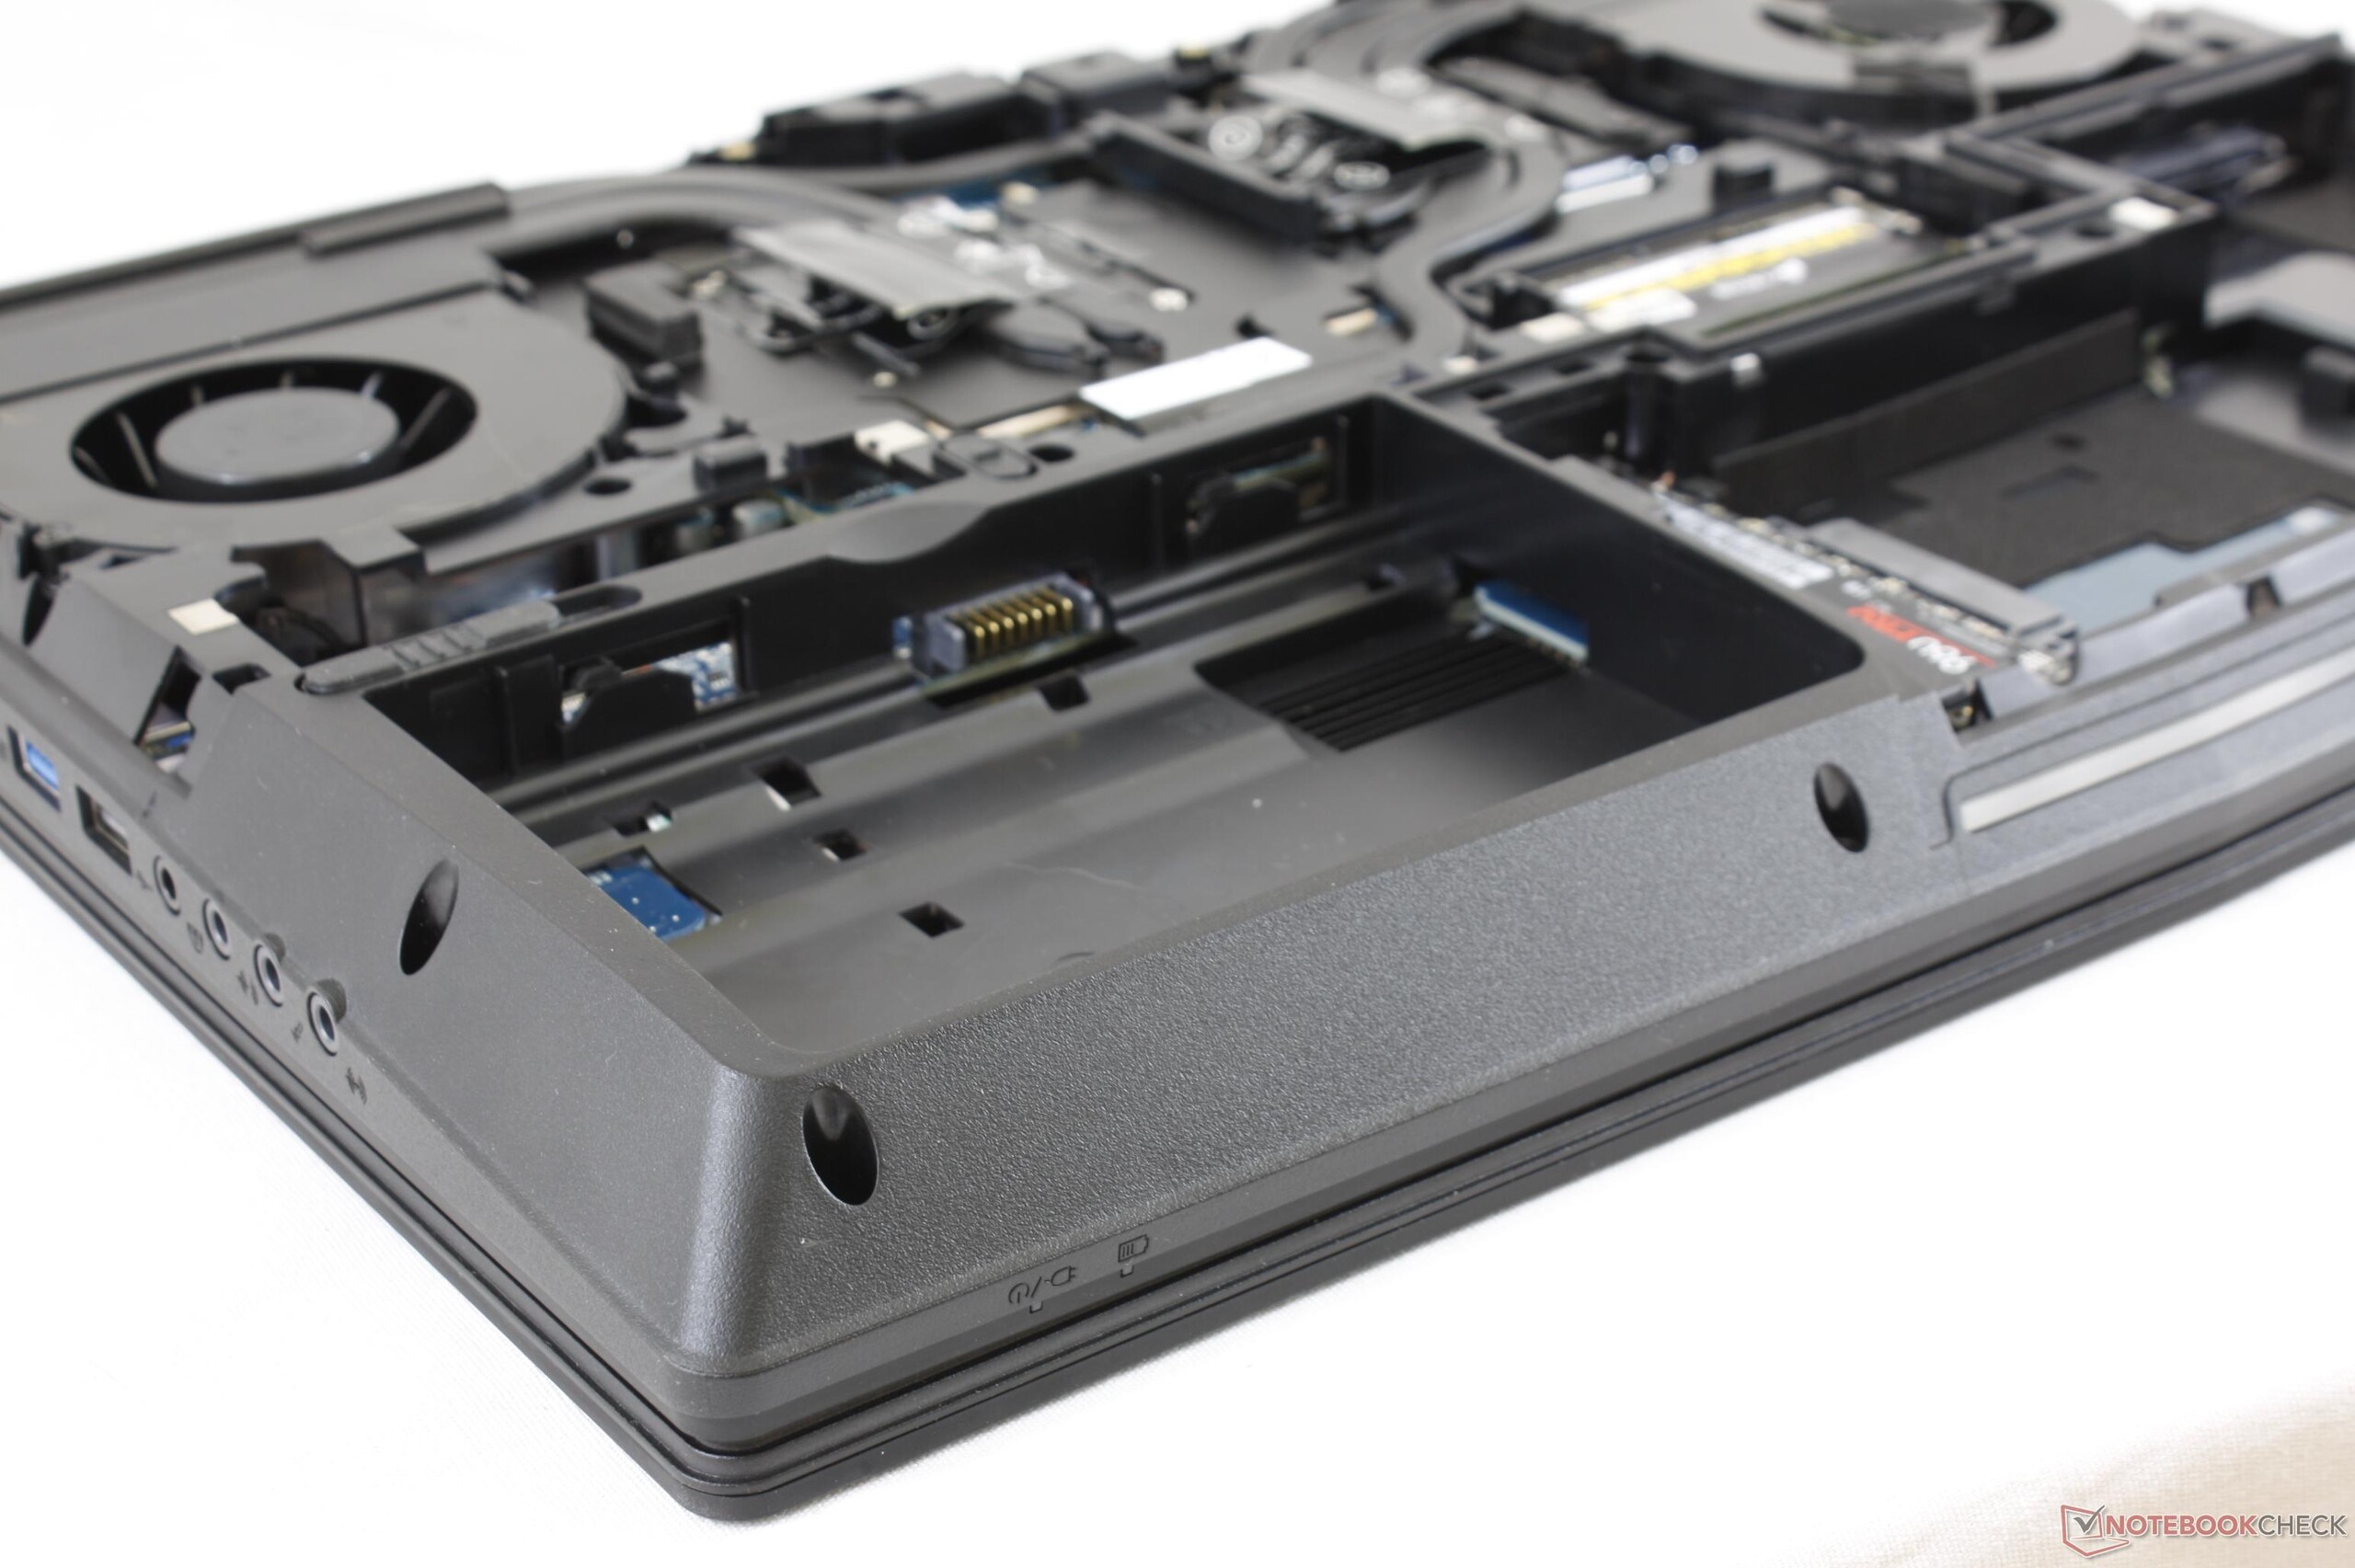
A Sky X4C a jelenleg elérhető legerősebb és legsokoldalúbb 15.6 inches notebook, köszönhetően az asztali gépekhez hasonló bővíthetőségének. Kettős felhasználhatósága gamer gépként és profi munkaállomásként, valamint a SIM képesség egyedülállóvá teszik a fogyasztói gamer notebookok között. Az is teljesen esélytelen, hogy a Lenovo, HP, Dell, vagy más nagy gyártó valaha akkora teret engedne a végfelhasználóknak szervizelés és testre szabás terén, mint a Eurocom és általában a Clevo notebookok. Ez a készülék egyértelműen a leglelkesebbeknek készült.
Akármennyire is erős a Eurocom, a Clevo háza funkcióit tekintve lassan kiöregszik A G-Sync csak egyes GPU-khoz érhető el, és nincs 3 ms/144 Hz paneles, sem érintőkijelzős változat, nincs 10 Gbps RJ-45, sem gombonkénti RGB billentyűzetvilágítás, esetleg dedikált kiegészítő gombok. Egyesek számára ezek hiánya apróságnak tűnhet, de a notebook árát figyelembe véve sokkal többet várnánk el.
A hardvernek amúgy is van pár említésre érdemes furcsasága. A gumírozott fedél vonzza a zsíros és poros szennyeződéseket, az egyenetlen háttérfény szivárgás prdig elfogadhatatlan ebben a kategóriában. A fényes, de szemcsés 4K UHD panel az adott konfigurációt kevésbé vonzóvá teszi, a fogyasztás ugrálása extrém terhelés alatt (tartósan 100 százalékra terhelt CPU és GPU) pedig aggasztó.
Ezt a notebookot nehéz lenyomni, ha csak a szervizelhetőséget és a teljesítményt nézzük. A funkciókészlete és a ventilátorok zajszintje terén viszont még bőven van hová fejlődnie.
Ez az eredeti értékelés rövidített változata. A teljes, angol nyelvű cikk itt olvasható.
Eurocom Sky X4C
- 02/11/2018 v6 (old)
Allen Ngo
Price comparison
