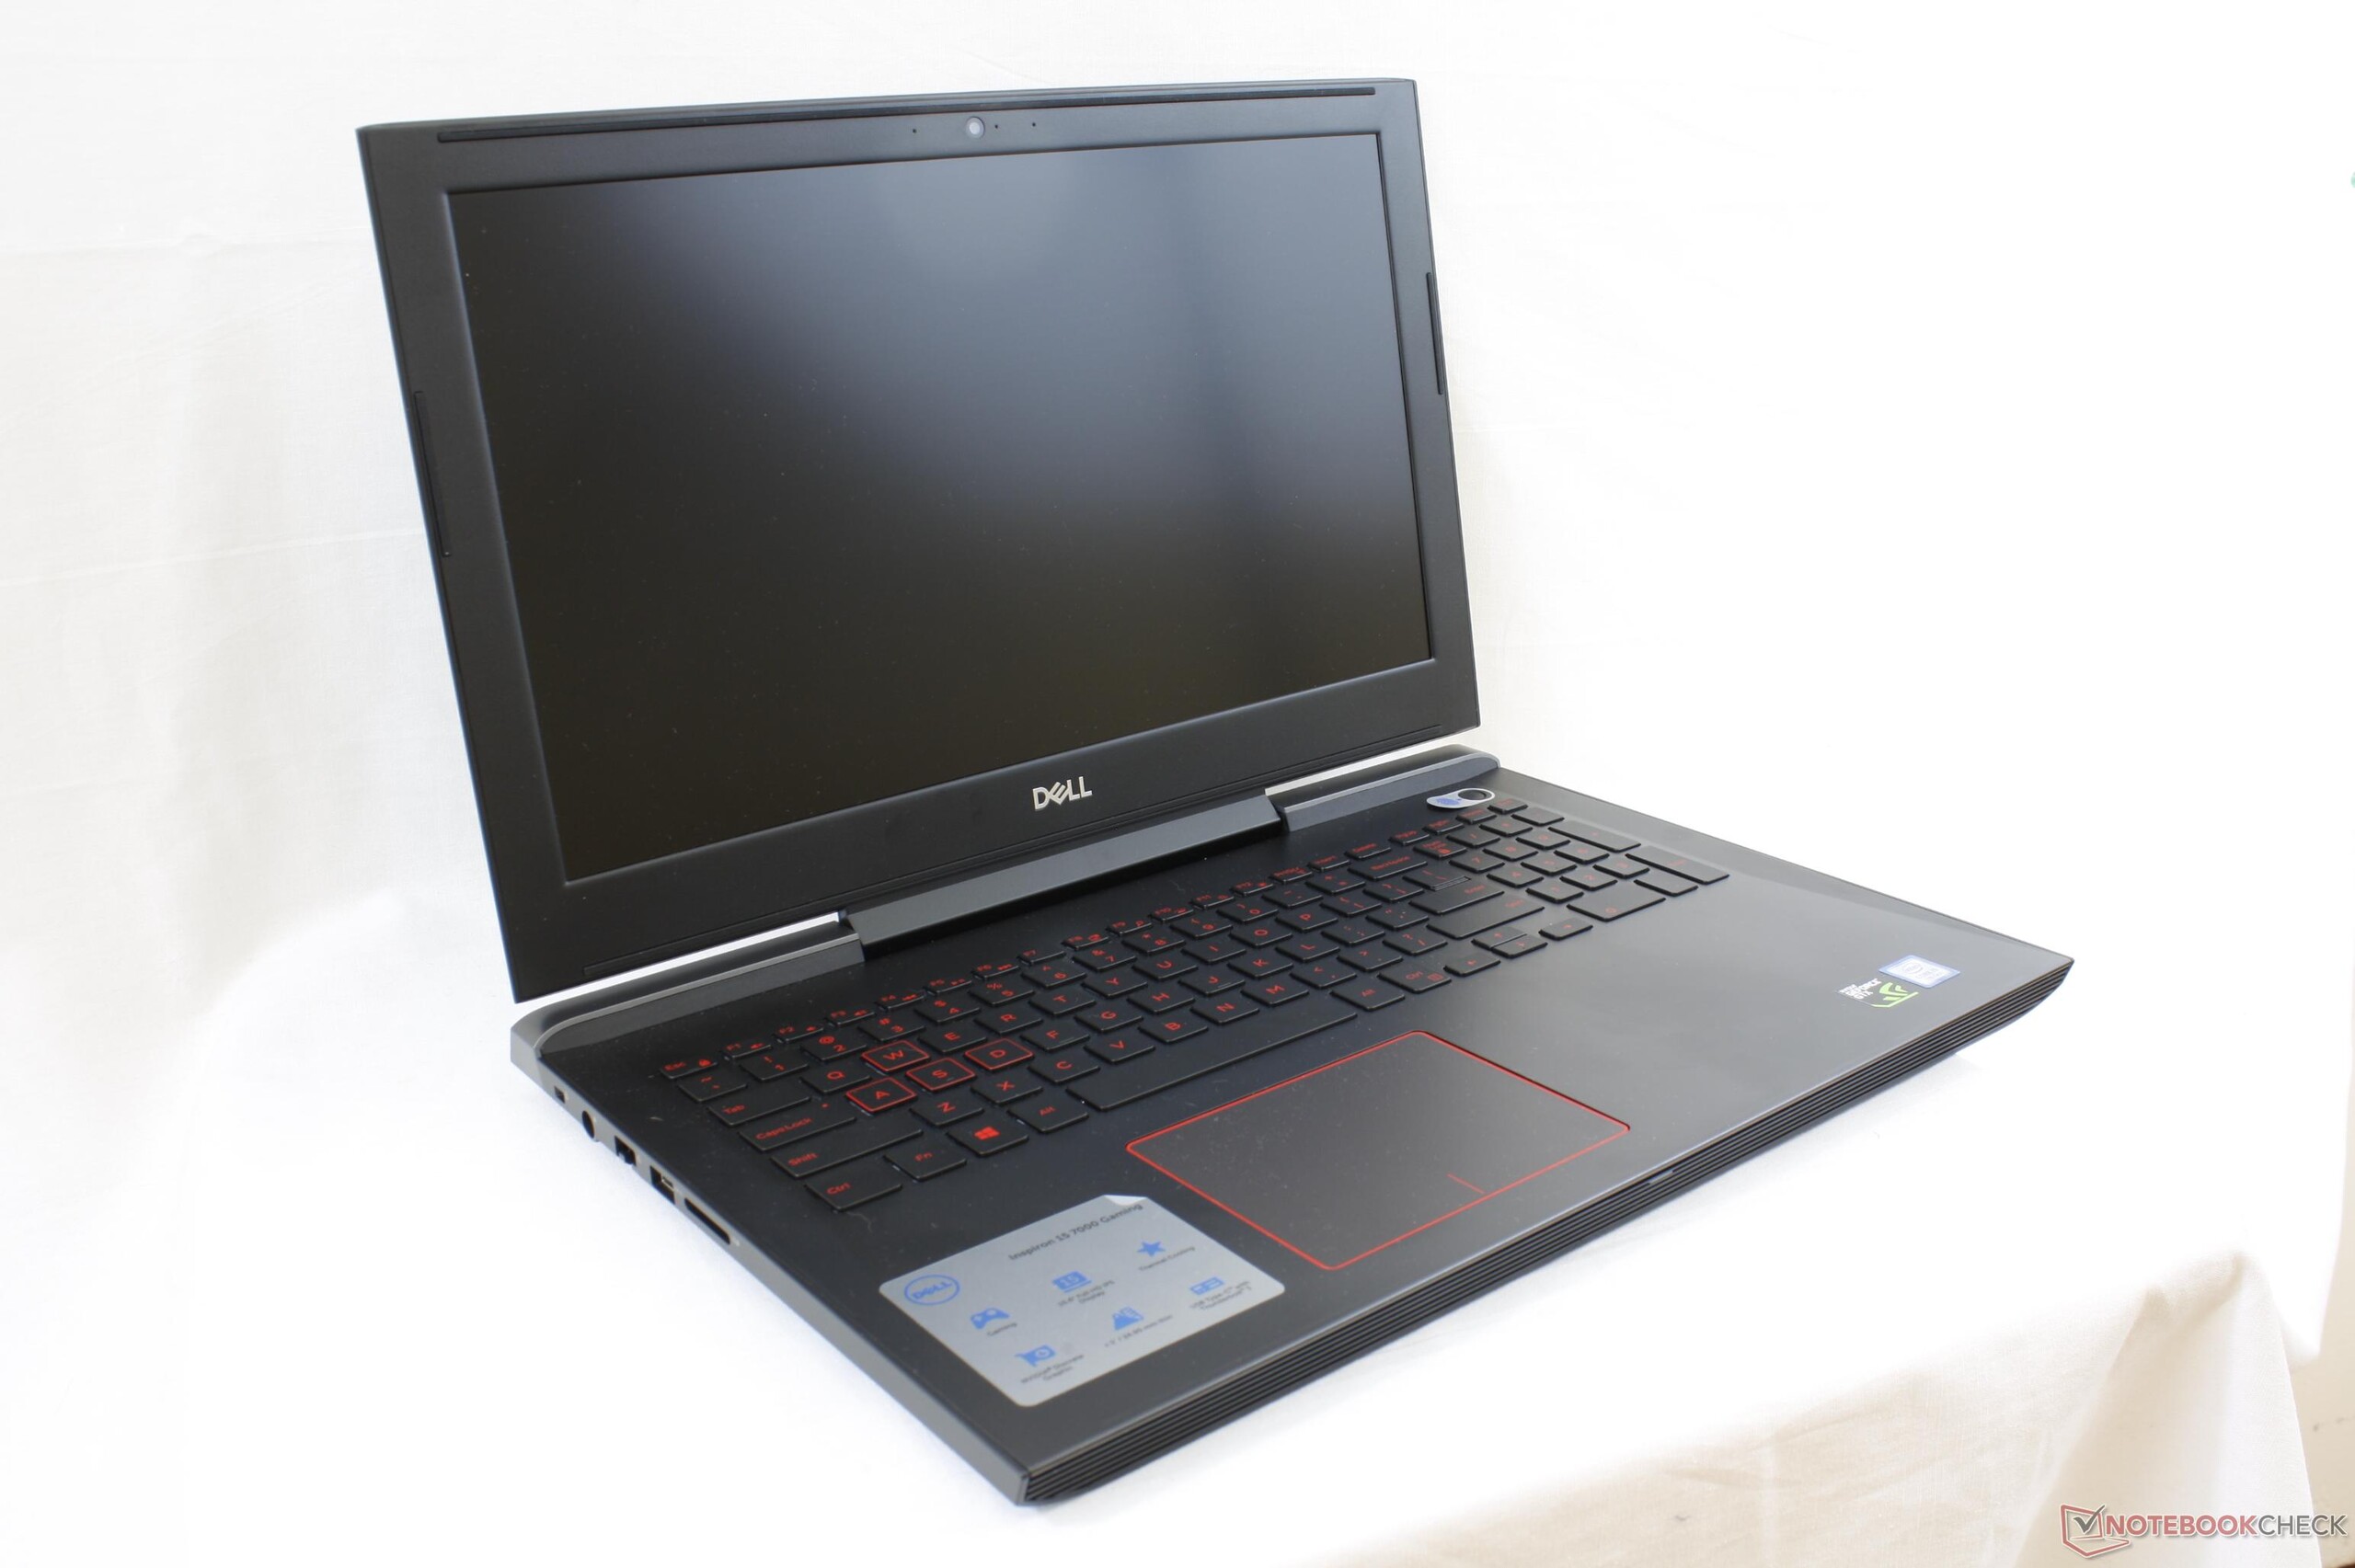
Dell Inspiron 15 7000 7577 (i5-7300HQ, GTX 1060 Max-Q) Laptop rövid értékelés
| SD Card Reader | |
| average JPG Copy Test (av. of 3 runs) | |
| Dell XPS 15 9560 (i7-7700HQ, UHD) | |
| Dell Inspiron 15 7000 7577 | |
| Dell Inspiron 15 7000 7567 | |
| maximum AS SSD Seq Read Test (1GB) | |
| Dell XPS 15 9560 (i7-7700HQ, UHD) | |
| Dell Inspiron 15 7000 7577 | |
| Dell Inspiron 15 7000 7567 | |
| Networking | |
| iperf3 transmit AX12 | |
| Dell XPS 15 9560 (i7-7700HQ, UHD) | |
| Dell Inspiron 15 7000 7577 | |
| Dell Inspiron 15 7000 7567 (jseb) | |
| iperf3 receive AX12 | |
| Dell Inspiron 15 7000 7577 | |
| Dell XPS 15 9560 (i7-7700HQ, UHD) | |
| Dell Inspiron 15 7000 7567 (jseb) | |
| |||||||||||||||||||||||||
Fényerő megoszlás: 91 %
Centrumban: 235.4 cd/m²
Kontraszt: 841:1 (Fekete: 0.28 cd/m²)
ΔE ColorChecker Calman: 5.6 | ∀{0.5-29.43 Ø4.73}
ΔE Greyscale Calman: 3.6 | ∀{0.09-98 Ø4.97}
55.4% sRGB (Argyll 1.6.3 3D)
35.2% AdobeRGB 1998 (Argyll 1.6.3 3D)
38.32% AdobeRGB 1998 (Argyll 3D)
55.6% sRGB (Argyll 3D)
37.07% Display P3 (Argyll 3D)
Gamma: 2.23
CCT: 7214 K
| Dell Inspiron 15 7000 7577 ID: LG Philips LGD053F, Name: 156WF6, Dell P/N: 4XK13, IPS, 15.6", 1920x1080 | Dell Inspiron 15 7000 7567 AU Optronics AUO38ED B156HTN 28H80, TN, 15.6", 1920x1080 | Acer Nitro 5 AN515-51-788E LG Philips LP156WF6-SPK6, IPS, 15.6", 1920x1080 | HP Omen 15-ce002ng AUO42ED, IPS, 15.6", 1920x1080 | Lenovo Legion Y520-15IKBN-80WK001KUS LP156WF6-SPK3, IPS, 15.6", 1920x1080 | |
|---|---|---|---|---|---|
| Display | -2% | 12% | 72% | ||
| Display P3 Coverage (%) | 37.07 | 36.42 -2% | 41.7 12% | 65.8 78% | |
| sRGB Coverage (%) | 55.6 | 54.9 -1% | 62.2 12% | 90.9 63% | |
| AdobeRGB 1998 Coverage (%) | 38.32 | 37.62 -2% | 43.17 13% | 66.5 74% | |
| Response Times | -16% | 11% | -17% | -48% | |
| Response Time Grey 50% / Grey 80% * (ms) | 35.6 ? | 36 ? -1% | 35 ? 2% | 43.2 ? -21% | 58.8 ? -65% |
| Response Time Black / White * (ms) | 27.6 ? | 36 ? -30% | 22 ? 20% | 31.2 ? -13% | 36 ? -30% |
| PWM Frequency (Hz) | 21550 ? | ||||
| Screen | -61% | 9% | 36% | -13% | |
| Brightness middle (cd/m²) | 235.4 | 246 5% | 276 17% | 304 29% | 239 2% |
| Brightness (cd/m²) | 223 | 235 5% | 265 19% | 289 30% | 244 9% |
| Brightness Distribution (%) | 91 | 75 -18% | 91 0% | 86 -5% | 88 -3% |
| Black Level * (cd/m²) | 0.28 | 0.55 -96% | 0.25 11% | 0.26 7% | 0.35 -25% |
| Contrast (:1) | 841 | 447 -47% | 1104 31% | 1169 39% | 683 -19% |
| Colorchecker dE 2000 * | 5.6 | 10.97 -96% | 5.06 10% | 3.46 38% | 7.3 -30% |
| Colorchecker dE 2000 max. * | 20.3 | 10.13 50% | 7.72 62% | 24.7 -22% | |
| Greyscale dE 2000 * | 3.6 | 14.25 -296% | 6.25 -74% | 2.46 32% | 4.9 -36% |
| Gamma | 2.23 99% | 1.83 120% | 1.76 125% | 2.38 92% | 2.19 100% |
| CCT | 7214 90% | 11200 58% | 6873 95% | 6915 94% | 7332 89% |
| Color Space (Percent of AdobeRGB 1998) (%) | 35.2 | 35 -1% | 40 14% | 59 68% | 35 -1% |
| Color Space (Percent of sRGB) (%) | 55.4 | 55 -1% | 62 12% | 91 64% | 55 -1% |
| Teljes átlag (program / beállítások) | -26% /
-42% | 11% /
10% | 30% /
36% | -31% /
-18% |
* ... a kisebb jobb
Megjelenítési válaszidők
| ↔ Válaszidő Fekete-fehér | ||
|---|---|---|
| 27.6 ms ... emelkedés és süllyedés ↘ kombinálva | ↗ 15.6 ms emelkedés | 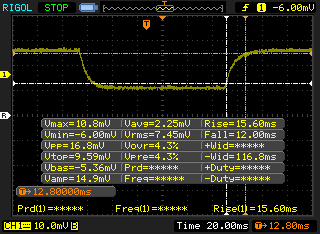 |
| ↘ 12 ms ősz | ||
| A képernyő viszonylag lassú reakciósebességet mutat tesztjeinkben, és túl lassú lehet a játékosok számára. Összehasonlításképpen, az összes tesztelt eszköz 0.1 (minimum) és 240 (maximum) ms között mozog. » 70 % of all devices are better. Ez azt jelenti, hogy a mért válaszidő rosszabb, mint az összes vizsgált eszköz átlaga (19.9 ms). | ||
| ↔ Válaszidő 50% szürke és 80% szürke között | ||
| 35.6 ms ... emelkedés és süllyedés ↘ kombinálva | ↗ 20 ms emelkedés | 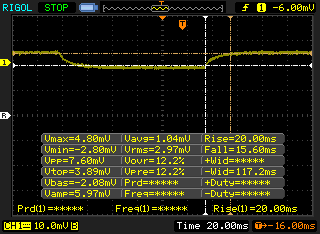 |
| ↘ 15.6 ms ősz | ||
| A képernyő lassú reakciósebességet mutat tesztjeinkben, és nem lesz kielégítő a játékosok számára. Összehasonlításképpen, az összes tesztelt eszköz 0.165 (minimum) és 636 (maximum) ms között mozog. » 50 % of all devices are better. Ez azt jelenti, hogy a mért válaszidő rosszabb, mint az összes vizsgált eszköz átlaga (31.1 ms). | ||
Képernyő villogása / PWM (impulzusszélesség-moduláció)
| Képernyő villogása / PWM nem érzékelhető | 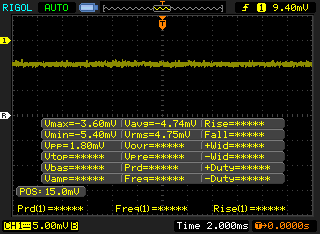 | ||
Összehasonlításképpen: az összes tesztelt eszköz 52 %-a nem használja a PWM-et a kijelző elsötétítésére. Ha PWM-et észleltek, akkor átlagosan 7797 (minimum: 5 - maximum: 343500) Hz-t mértek. | |||
| wPrime 2.10 - 1024m | |
| Lenovo Yoga 920-13IKB-80Y7 | |
| Dell Inspiron 15 7000 7567 Gaming (Core i5-7300HQ, GTX 1050) | |
| Dell Inspiron 15 7000 7577 | |
| Lenovo IdeaPad Y50 | |
| Razer Blade Pro RZ09-0220 | |
* ... a kisebb jobb
| PCMark 10 - Score | |
| Acer Nitro 5 AN515-51-788E | |
| Dell Inspiron 15 7000 7577 | |
| Dell Inspiron 15 7000 7567 Gaming (Core i5-7300HQ, GTX 1050) | |
| PCMark 8 Home Score Accelerated v2 | 3759 pontok | |
| PCMark 8 Creative Score Accelerated v2 | 4723 pontok | |
| PCMark 8 Work Score Accelerated v2 | 4856 pontok | |
| PCMark 10 Score | 4406 pontok | |
Segítség | ||
| Dell Inspiron 15 7000 7577 Samsung PM961 MZVLW256HEHP | Dell Inspiron 15 7000 7567 Intel SSDSCKKF256H6 | Gigabyte Sabre 15G Liteonit CV3-8D128 | Lenovo Legion Y520-15IKBN-80WK001KUS Samsung PM961 MZVLW256HEHP | HP Omen 17-w100ng SanDisk Z400s SD8SNAT-128G | |
|---|---|---|---|---|---|
| AS SSD | -56% | -64% | 41% | -94% | |
| Copy Game MB/s (MB/s) | 382.5 | 286.2 -25% | 323.5 -15% | 1115 192% | 159.8 -58% |
| Copy Program MB/s (MB/s) | 274.8 | 224 -18% | 195.3 -29% | 502 83% | 80.6 -71% |
| Copy ISO MB/s (MB/s) | 814 | 425.4 -48% | 446.8 -45% | 1912 135% | 233.4 -71% |
| Score Total (Points) | 2405 | 734 -69% | 752 -69% | 2617 9% | 537 -78% |
| Score Write (Points) | 594 | 227 -62% | 234 -61% | 807 36% | 236 -60% |
| Score Read (Points) | 1241 | 332 -73% | 337 -73% | 1232 -1% | 206 -83% |
| Access Time Write * (ms) | 0.037 | 0.057 -54% | 0.073 -97% | 0.027 27% | 0.162 -338% |
| Access Time Read * (ms) | 0.058 | 0.094 -62% | 0.141 -143% | 0.065 -12% | 0.14 -141% |
| 4K-64 Write (MB/s) | 375.8 | 118.3 -69% | 132.2 -65% | 529 41% | 155 -59% |
| 4K-64 Read (MB/s) | 929 | 258.6 -72% | 257 -72% | 919 -1% | 137.4 -85% |
| 4K Write (MB/s) | 100.2 | 66.6 -34% | 53.8 -46% | 139.4 39% | 64.2 -36% |
| 4K Read (MB/s) | 46.95 | 25.16 -46% | 28.3 -40% | 48.57 3% | 17.76 -62% |
| Seq Write (MB/s) | 1181 | 416.1 -65% | 479.8 -59% | 1392 18% | 166.7 -86% |
| Seq Read (MB/s) | 2652 | 481.6 -82% | 516 -81% | 2649 0% | 507 -81% |
* ... a kisebb jobb

| 3DMark | |
| 1920x1080 Fire Strike Graphics | |
| Asus G701VIK-BA049T | |
| Alienware 15 R3 Max-Q | |
| Aorus X5 v7 | |
| Gigabyte Aero 15X | |
| AMD Radeon RX 480 8 GB Reference | |
| Razer Blade Pro RZ09-0220 | |
| HP Omen 15-ce002ng | |
| Dell Inspiron 15 7000 7577 | |
| EVGA SC17 | |
| Lenovo Legion Y520-15IKBN-80WK001KUS | |
| Asus GL503VD-DB74 | |
| Acer Swift 3 SF315-51G-57E5 | |
| Fire Strike Extreme Graphics | |
| Alienware 15 R3 Max-Q | |
| Gigabyte Aero 15X | |
| AMD Radeon RX 480 8 GB Reference | |
| Razer Blade Pro RZ09-0220 | |
| Dell Inspiron 15 7000 7577 | |
| EVGA SC17 | |
| Lenovo Legion Y520-15IKBN-80WK001KUS | |
| Asus GL503VD-DB74 | |
| 3DMark 11 | |
| 1280x720 Performance GPU | |
| Asus G701VIK-BA049T | |
| Alienware 15 R3 Max-Q | |
| Aorus X5 v7 | |
| Gigabyte Aero 15X | |
| AMD Radeon RX 480 8 GB Reference | |
| Razer Blade Pro RZ09-0220 | |
| HP Omen 15-ce002ng | |
| Dell Inspiron 15 7000 7577 | |
| EVGA SC17 | |
| Asus GL503VD-DB74 | |
| Acer Swift 3 SF315-51G-57E5 | |
| 1280x720 Performance Combined | |
| Asus G701VIK-BA049T | |
| AMD Radeon RX 480 8 GB Reference | |
| Aorus X5 v7 | |
| Alienware 15 R3 Max-Q | |
| EVGA SC17 | |
| Gigabyte Aero 15X | |
| Razer Blade Pro RZ09-0220 | |
| HP Omen 15-ce002ng | |
| Asus GL503VD-DB74 | |
| Dell Inspiron 15 7000 7577 | |
| Acer Swift 3 SF315-51G-57E5 | |
| 3DMark 11 Performance | 10176 pontok | |
| 3DMark Ice Storm Standard Score | 96790 pontok | |
| 3DMark Cloud Gate Standard Score | 17325 pontok | |
| 3DMark Fire Strike Score | 8292 pontok | |
| 3DMark Fire Strike Extreme Score | 4467 pontok | |
Segítség | ||
| Rise of the Tomb Raider - 1920x1080 Very High Preset AA:FX AF:16x | |
| MSI GE73VR 7RF Raider | |
| Nvidia GeForce GTX 1060 Founders Edition 6 GB | |
| Nvidia GeForce GTX 1060 Founders Edition 6 GB | |
| Razer Blade Pro RZ09-0220 | |
| Dell Inspiron 15 7000 7577 | |
| HP Omen 15-ce002ng | |
| Asus Strix GL502VT-DS74 | |
| Lenovo Legion Y520-15IKBN-80WK001KUS | |
| Gigabyte Sabre 15G | |
| MSI GL72 6QF | |
| The Witcher 3 - 1920x1080 Ultra Graphics & Postprocessing (HBAO+) | |
| MSI GE73VR 7RF Raider | |
| Nvidia GeForce GTX 1060 Founders Edition 6 GB | |
| Razer Blade Pro RZ09-0220 | |
| Lenovo Legion Y520-15IKBN-80WK001KUS | |
| Dell Inspiron 15 7000 7577 | |
| HP Omen 15-ce002ng | |
| Gigabyte Sabre 15G | |
| BioShock Infinite - 1920x1080 Ultra Preset, DX11 (DDOF) | |
| MSI GE73VR 7RF Raider | |
| Razer Blade Pro RZ09-0220 | |
| Dell Inspiron 15 7000 7577 | |
| Lenovo Legion Y520-15IKBN-80WK001KUS | |
| Asus Strix GL502VT-DS74 | |
| Gigabyte Sabre 15G | |
| MSI GL72 6QF | |
| alacsony | közepes | magas | ultra | |
|---|---|---|---|---|
| Guild Wars 2 (2012) | 45.7 | |||
| BioShock Infinite (2013) | 95.3 | |||
| Metro: Last Light (2013) | 64.3 | |||
| Thief (2014) | 64.6 | |||
| The Witcher 3 (2015) | 73.4 | 35.2 | ||
| Batman: Arkham Knight (2015) | 74 | 49 | ||
| Metal Gear Solid V (2015) | 60 | |||
| Fallout 4 (2015) | 73.9 | 61.3 | ||
| Rise of the Tomb Raider (2016) | 67.5 | 55.4 | ||
| Overwatch (2016) | 98.4 | |||
| Mafia 3 (2016) | 36.2 | |||
| Prey (2017) | 97.1 | |||
| Dirt 4 (2017) | 118 | 87.1 | 46.5 | |
| F1 2017 (2017) | 94 | 77 | 56 | |
| Middle-earth: Shadow of War (2017) | 84 | 65 | 48 |
Zajszint
| Üresjárat |
| 28 / 28 / 28 dB(A) |
| Terhelés |
| 30.3 / 46.5 dB(A) |
 | ||
30 dB csendes 40 dB(A) hallható 50 dB(A) hangos |
||
min: | ||
| Dell Inspiron 15 7000 7577 GeForce GTX 1060 Max-Q, i5-7300HQ, Samsung PM961 MZVLW256HEHP | Dell Inspiron 15 7000 7567 Gaming (Core i5-7300HQ, GTX 1050) GeForce GTX 1050 Mobile, i5-7300HQ, Toshiba MQ02ABD100H | Gigabyte Sabre 15G GeForce GTX 1050 Mobile, i7-7700HQ, Liteonit CV3-8D128 | Lenovo Legion Y520-15IKBN-80WK001KUS GeForce GTX 1050 Ti Mobile, i7-7700HQ, Samsung PM961 MZVLW256HEHP | Asus Strix GL502VT-DS74 GeForce GTX 970M, 6700HQ, Lite-On CV1-8B128 | HP Omen 15-ce002ng GeForce GTX 1060 Max-Q, i7-7700HQ, Samsung PM961 MZVLW256HEHP | |
|---|---|---|---|---|---|---|
| Noise | -12% | -21% | -7% | -12% | -16% | |
| off / környezet * (dB) | 28 | 28 -0% | 28.2 -1% | 27.7 1% | 28.7 -2% | 30 -7% |
| Idle Minimum * (dB) | 28 | 31.6 -13% | 33 -18% | 30.5 -9% | 31 -11% | 30 -7% |
| Idle Average * (dB) | 28 | 31.8 -14% | 33.3 -19% | 30.5 -9% | 31 -11% | 33 -18% |
| Idle Maximum * (dB) | 28 | 31.8 -14% | 34.7 -24% | 30.6 -9% | 32 -14% | 37 -32% |
| Load Average * (dB) | 30.3 | 36.3 -20% | 44.5 -47% | 40 -32% | 40.7 -34% | 41 -35% |
| Witcher 3 ultra * (dB) | 39.5 | 46.3 -17% | 49.2 -25% | 40 -1% | 42 -6% | |
| Load Maximum * (dB) | 46.5 | 49 -5% | 52.8 -14% | 42.6 8% | 47.6 -2% | 50 -8% |
* ... a kisebb jobb
(±) A felső oldalon a maximális hőmérséklet 44 °C / 111 F, összehasonlítva a 40.4 °C / 105 F átlagával , 21.2 és 68.8 °C között a Gaming osztálynál.
(±) Az alsó maximum 43.8 °C / 111 F-ig melegszik fel, összehasonlítva a 43.2 °C / 110 F átlagával
(+) Üresjáratban a felső oldal átlagos hőmérséklete 24.7 °C / 76 F, összehasonlítva a 33.9 °C / ### eszközátlaggal class_avg_f### F.
(+) A The Witcher 3 játék során a felső oldal átlaghőmérséklete 27.9 °C / 82 F, összehasonlítva a 33.9 °C / ## eszközátlaggal #class_avg_f### F.
(+) A csuklótámasz és az érintőpad hűvösebb, mint a bőr hőmérséklete, maximum 29.8 °C / 85.6 F, ezért hűvös tapintású.
(±) A hasonló eszközök csuklótámasz területének átlagos hőmérséklete 28.8 °C / 83.8 F volt (-1 °C / -1.8 F).
Dell Inspiron 15 7000 7577 hangelemzés
(±) | a hangszóró hangereje átlagos, de jó (80.9 dB)
Basszus 100 - 315 Hz
(±) | csökkentett basszus – átlagosan 13%-kal alacsonyabb, mint a medián
(+) | a basszus lineáris (6.8% delta az előző frekvenciához)
Közepes 400-2000 Hz
(+) | kiegyensúlyozott középpontok – csak 2.7% választja el a mediántól
(+) | a középpontok lineárisak (5.3% delta az előző frekvenciához)
Maximum 2-16 kHz
(±) | magasabb csúcsok – átlagosan 8%-kal magasabb, mint a medián
(±) | a csúcsok linearitása átlagos (10.6% delta az előző gyakorisághoz)
Összességében 100 - 16.000 Hz
(±) | az általános hang linearitása átlagos (18.9% eltérés a mediánhoz képest)
Ugyanazon osztályhoz képest
» 63%Ebben az osztályban az összes tesztelt eszköz %-a jobb volt, 8% hasonló, 29%-kal rosszabb
» A legjobb delta értéke 6%, az átlag 18%, a legrosszabb 132% volt
Az összes tesztelt eszközzel összehasonlítva
» 44% az összes tesztelt eszköz jobb volt, 8% hasonló, 48%-kal rosszabb
» A legjobb delta értéke 4%, az átlag 24%, a legrosszabb 134% volt
Apple MacBook 12 (Early 2016) 1.1 GHz hangelemzés
(+) | a hangszórók viszonylag hangosan tudnak játszani (83.6 dB)
Basszus 100 - 315 Hz
(±) | csökkentett basszus – átlagosan 11.3%-kal alacsonyabb, mint a medián
(±) | a basszus linearitása átlagos (14.2% delta az előző frekvenciához)
Közepes 400-2000 Hz
(+) | kiegyensúlyozott középpontok – csak 2.4% választja el a mediántól
(+) | a középpontok lineárisak (5.5% delta az előző frekvenciához)
Maximum 2-16 kHz
(+) | kiegyensúlyozott csúcsok – csak 2% választja el a mediántól
(+) | a csúcsok lineárisak (4.5% delta az előző frekvenciához képest)
Összességében 100 - 16.000 Hz
(+) | általános hangzás lineáris (10.2% eltérés a mediánhoz képest)
Ugyanazon osztályhoz képest
» 7%Ebben az osztályban az összes tesztelt eszköz %-a jobb volt, 2% hasonló, 91%-kal rosszabb
» A legjobb delta értéke 5%, az átlag 18%, a legrosszabb 53% volt
Az összes tesztelt eszközzel összehasonlítva
» 5% az összes tesztelt eszköz jobb volt, 1% hasonló, 94%-kal rosszabb
» A legjobb delta értéke 4%, az átlag 24%, a legrosszabb 134% volt
| Kikapcsolt állapot / Készenlét | |
| Üresjárat | |
| Terhelés |
|
Kulcs:
min: | |
| Dell Inspiron 15 7000 7577 i5-7300HQ, GeForce GTX 1060 Max-Q, Samsung PM961 MZVLW256HEHP, IPS, 1920x1080, 15.6" | Dell Inspiron 15 7000 7567 i7-7700HQ, GeForce GTX 1050 Ti Mobile, Intel SSDSCKKF256H6, TN, 1920x1080, 15.6" | Gigabyte Sabre 15G i7-7700HQ, GeForce GTX 1050 Mobile, Liteonit CV3-8D128, IPS, 1920x1080, 15.6" | MSI GF62VR 7RF-877 i7-7700HQ, GeForce GTX 1060 Mobile, Intel SSD 600p SSDPEKKW256G7, TN LED, 1920x1080, 15.6" | Asus Strix GL502VY-DS71 6700HQ, GeForce GTX 980M, SanDisk SD8SN8U1T001122, IPS, 1920x1080, 15.6" | |
|---|---|---|---|---|---|
| Power Consumption | 1% | -19% | -85% | -144% | |
| Idle Minimum * (Watt) | 7.1 | 4.4 38% | 8 -13% | 16.2 -128% | 20.6 -190% |
| Idle Average * (Watt) | 7.6 | 6.8 11% | 10.9 -43% | 18.2 -139% | 22.1 -191% |
| Idle Maximum * (Watt) | 8.6 | 8.3 3% | 11 -28% | 18.9 -120% | 22.5 -162% |
| Load Average * (Watt) | 59.5 | 81 -36% | 76.7 -29% | 82.7 -39% | 130.6 -119% |
| Witcher 3 ultra * (Watt) | 89 | 94.9 -7% | 125.7 -41% | ||
| Load Maximum * (Watt) | 112.8 | 127 -13% | 106.4 6% | 162.3 -44% | 177.2 -57% |
* ... a kisebb jobb
| Dell Inspiron 15 7000 7577 i5-7300HQ, GeForce GTX 1060 Max-Q, 56 Wh | Dell Inspiron 15 7000 7567 i7-7700HQ, GeForce GTX 1050 Ti Mobile, 74 Wh | Gigabyte Sabre 15G i7-7700HQ, GeForce GTX 1050 Mobile, 47 Wh | Lenovo Legion Y520-15IKBN-80WK001KUS i7-7700HQ, GeForce GTX 1050 Ti Mobile, 45 Wh | Asus Strix GL502VT-DS74 6700HQ, GeForce GTX 970M, 64 Wh | MSI GF62VR 7RF-877 i7-7700HQ, GeForce GTX 1060 Mobile, 41 Wh | |
|---|---|---|---|---|---|---|
| Akkumulátor üzemidő | 39% | -27% | -38% | -23% | -68% | |
| Reader / Idle (h) | 11 | 19.6 78% | 8.2 -25% | 8.5 -23% | 9.7 -12% | 2.8 -75% |
| WiFi v1.3 (h) | 6.9 | 10.4 51% | 4.4 -36% | 4 -42% | 5.9 -14% | 1.9 -72% |
| Load (h) | 1.6 | 1.4 -13% | 1.3 -19% | 0.8 -50% | 0.9 -44% | 0.7 -56% |
Pro
Kontra
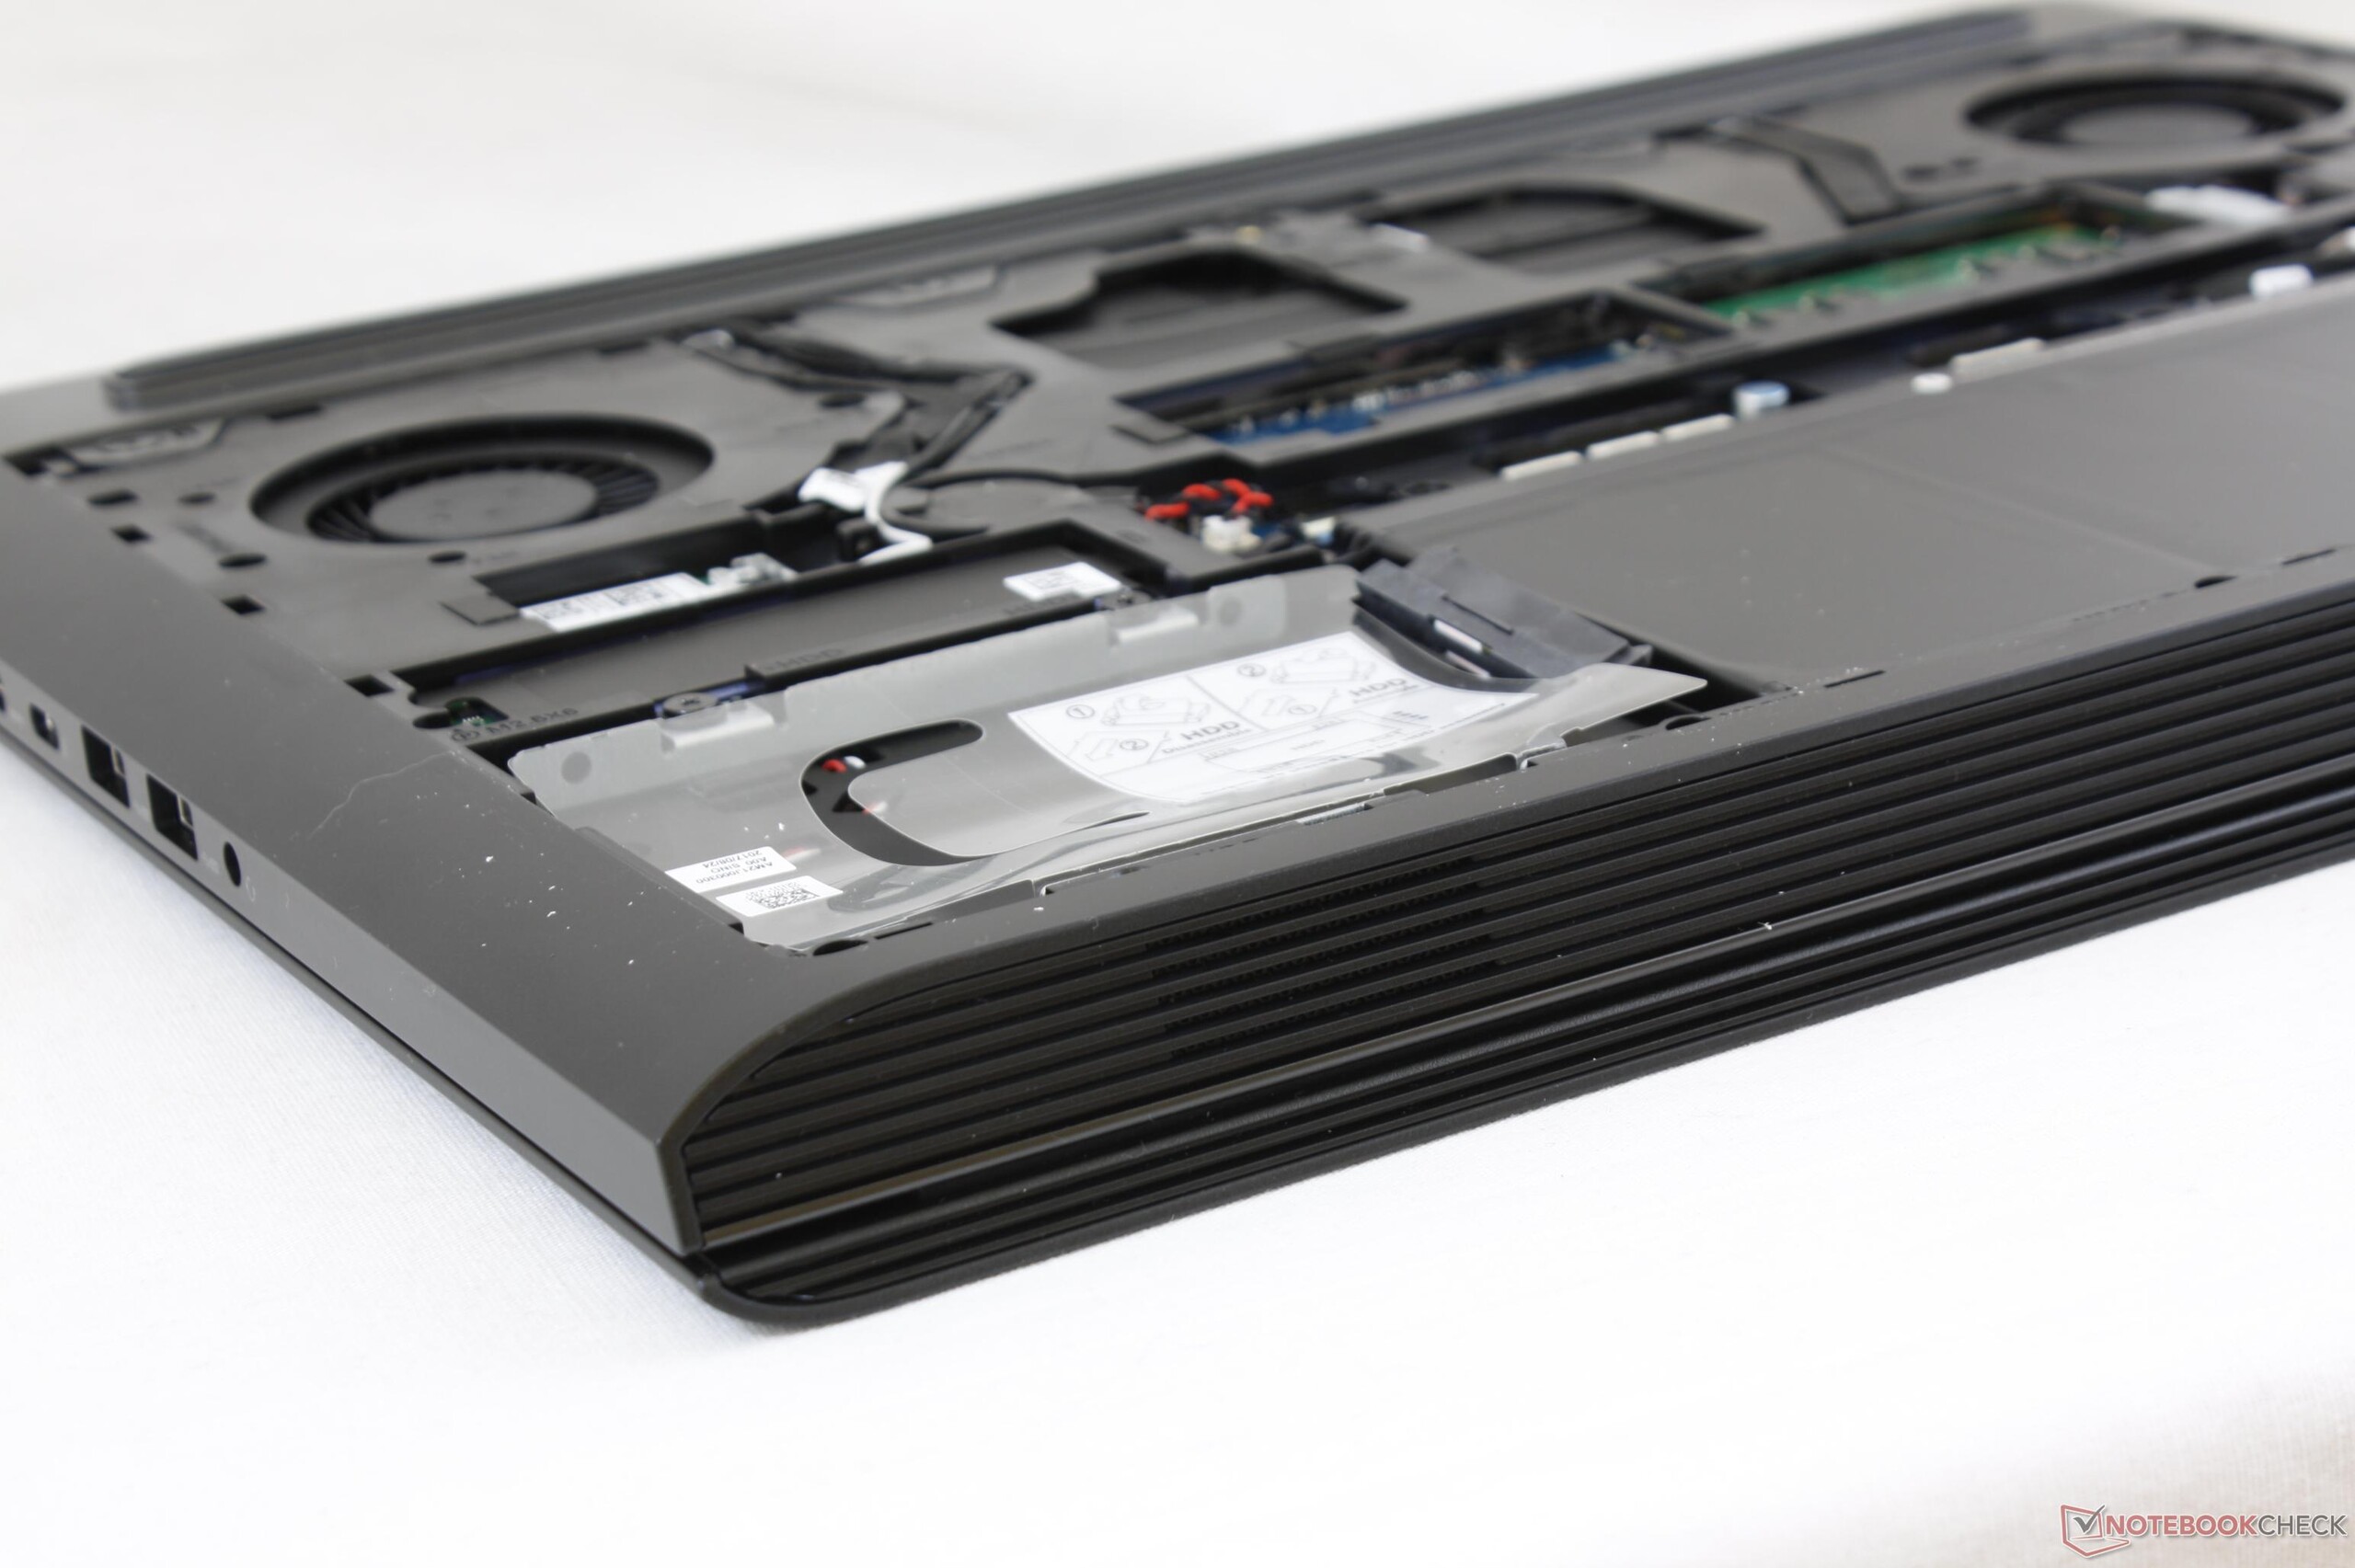
Az Inspiron 7577 ennyiért egy kitűnő gamer gép, hála a stabil alapnak, hozzáférhető belsőnek, és a GTX 1060 Max-Q GPU-nak. A GPU már önmagában csendesebbé, hatékonyabbá, gyorsabbá tette a gépet, mint bármelyik Inspiron 7567 konfiguráció. Nem mindennapi jelenség, hogy a közvetlen utód modell 35-70 százalékkal jobb grafikus teljesítményt nyújtson, mindössze 5-10 százalékkal magasabb fogyasztás árán, és emellett még csendesebben is működjön.
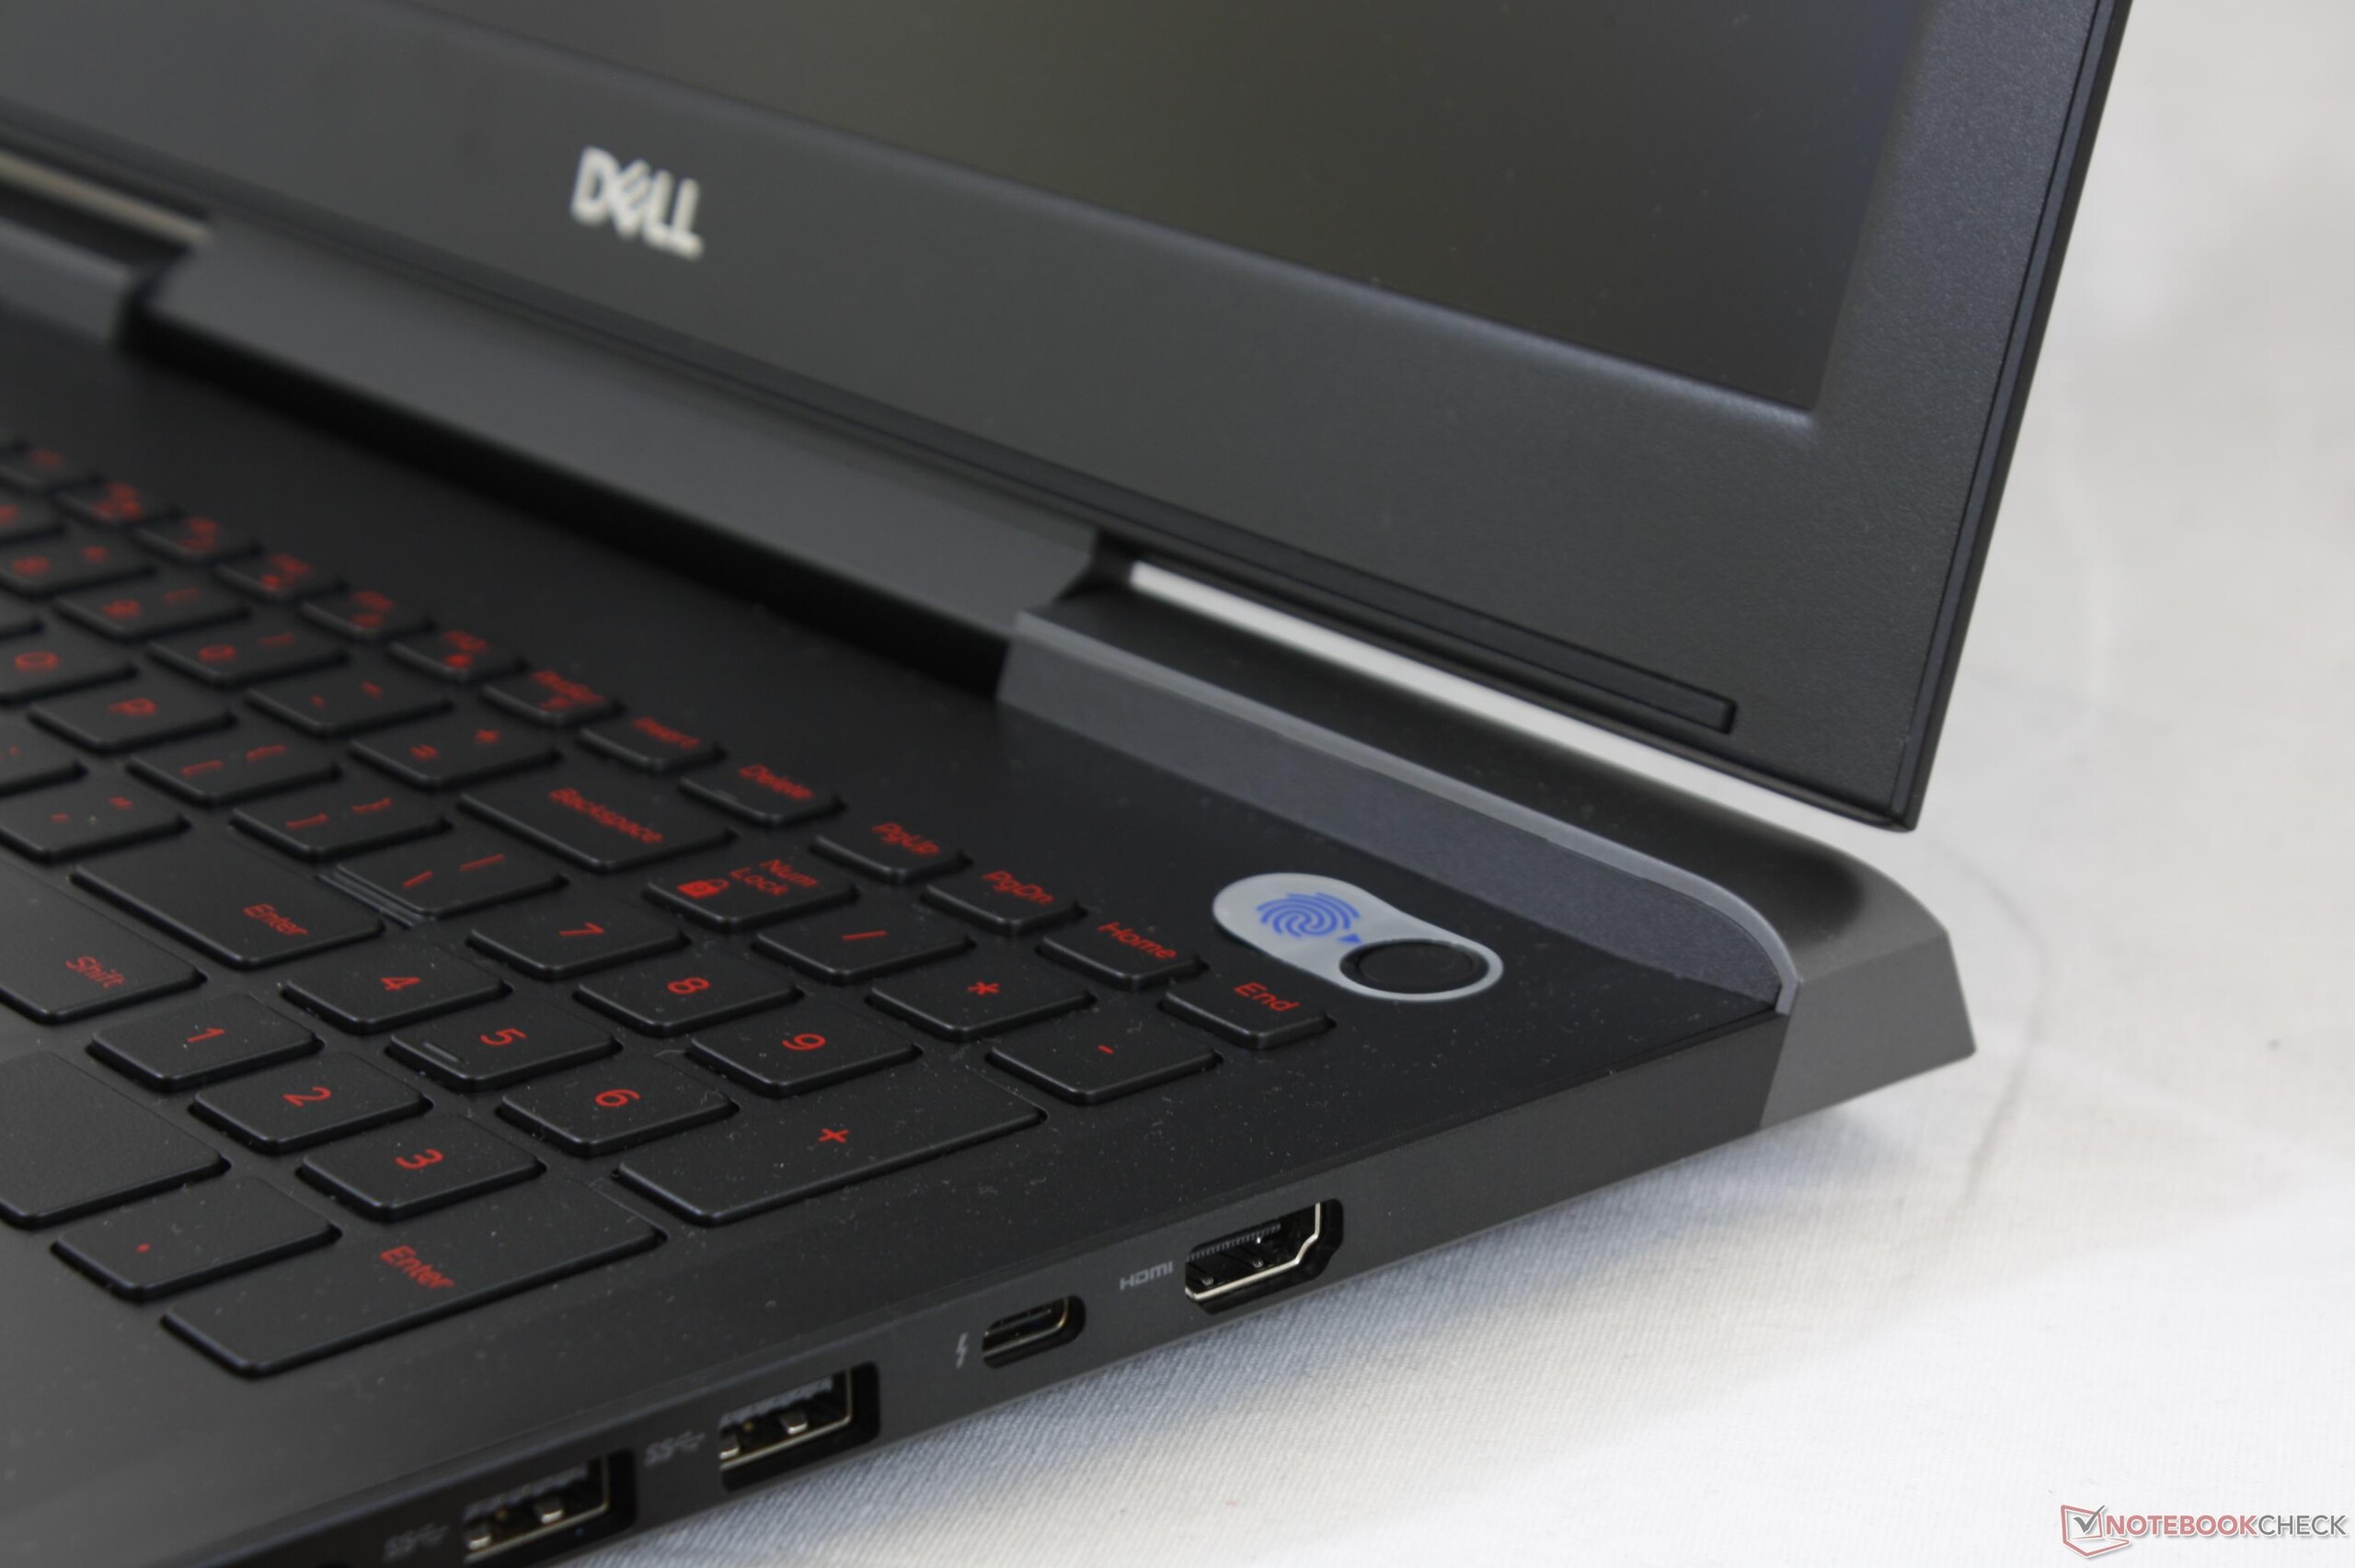
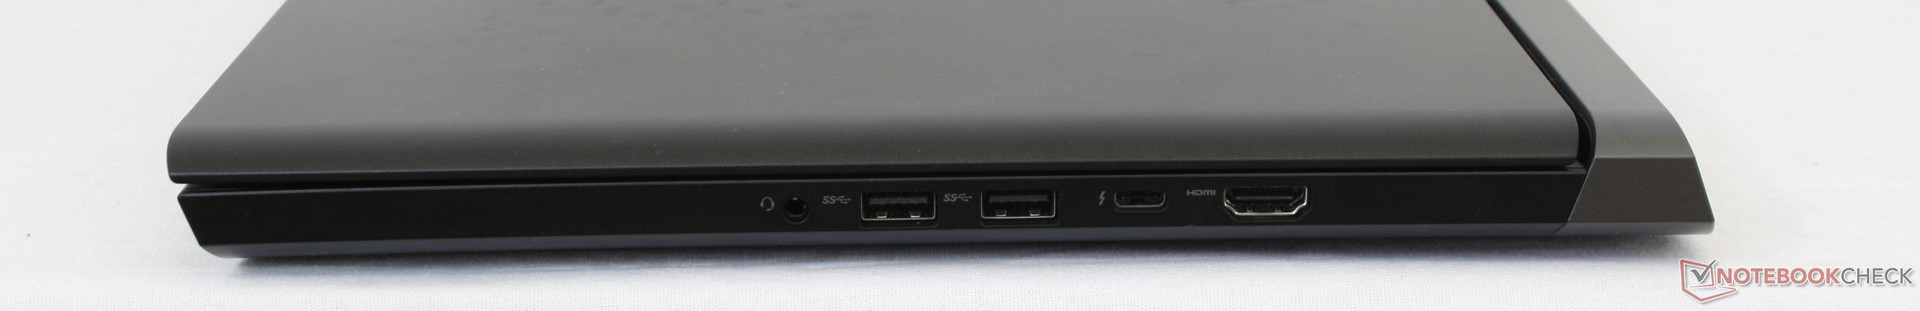
Az olyan versenytársakkal összevetve, mint az Omen 15 (7700HQ, GTX 1060 Max-Q) vagy az MSI GF62VR (7700HQ, GTX 1060), a Dell simán leiskolázza őket összesítettben. A fogyasztása majdnem 40%-kal kisebb, mint az MSI gépéé, és alig 5-10%-kal kisebb a grafikus teljesítménye. A zajszintje viszont jelentősen kisebb, és az üzemideje órákkal hosszabb. A most tesztelt rendszer még az Omen 15-nél is csendesebb, pedig ugyanazt a Max-Q GPU-t használja, és azonos 3D teljesítményt nyújt. Ha megemlítjük még a Thunderbolt 3-at, és az alacsony, 900 dolláros kezdőárat, akkor az Inspiron 7577 hamar a kedvenc gamer notebookunk lesz az ezer alatti kategóriában.
Az Inspiron 7577-et néhány komolyabb hiányosság választja el a drágább modellektől, például az Alienware 15-től, vagy az Aorus X5-től. Először is, az 1080p felbontású kijelző elmarad képességeiben. Az előbb említett rivális gépeknél rosszabb a színlefedettsége ( <90% sRGB). A színek ugyan élesek, de nem annyira telítettek. Szívesen feláldoztuk volna a 4K UHD panelt, amelyet a drágább Inspiron 7577 kapot, ha ezt G-Sync-re, gyorsabb válaszidőre, pontosabb színekre és világosabb kijelzőre cserélhettük volna. Másodszor, a billentyűzet sokkal lágyabb, mint amit egy 15 inches gamer notebookban várnánk. A Dell ennél jobbra is képes, ezt a Latitude és XPS szériával bizonyította, így semmi okát nem látjuk annak, hogy az Inspiron miért nem egy azokhoz hasonló billentyűzetet kapott. Ezen felül még kisebb panaszaink voltak, mint a gombonkénti RGB megvilágítás hiánya, nagyon lassú SD olvasó, gyengébb hangszórók és viszonylag nagy tömeg. Ezek viszont játék közben nem annyira lényegesek, mint a kényelmes billentyűzet, a kijelző, a zajszint, vagy a teljesítmény.
Az Inspiron 7577 a legjobb gamer laptop, ha szűkebb keretből gazdálkodunk. Meglepően csendes és hosszú ideig bírja telepről, mindezt olyan grafikus teljesítmény mellett, amilyet ezen az áron remélni sem mernénk. A kijelző és a billentyűzet az, ahol némi "olcsóságot" éreztünk ebben az amúgy kitűnő középkategóriás gépben.
Ez az eredeti értékelés rövidített változata. A teljes, angol nyelvű cikk itt olvasható.
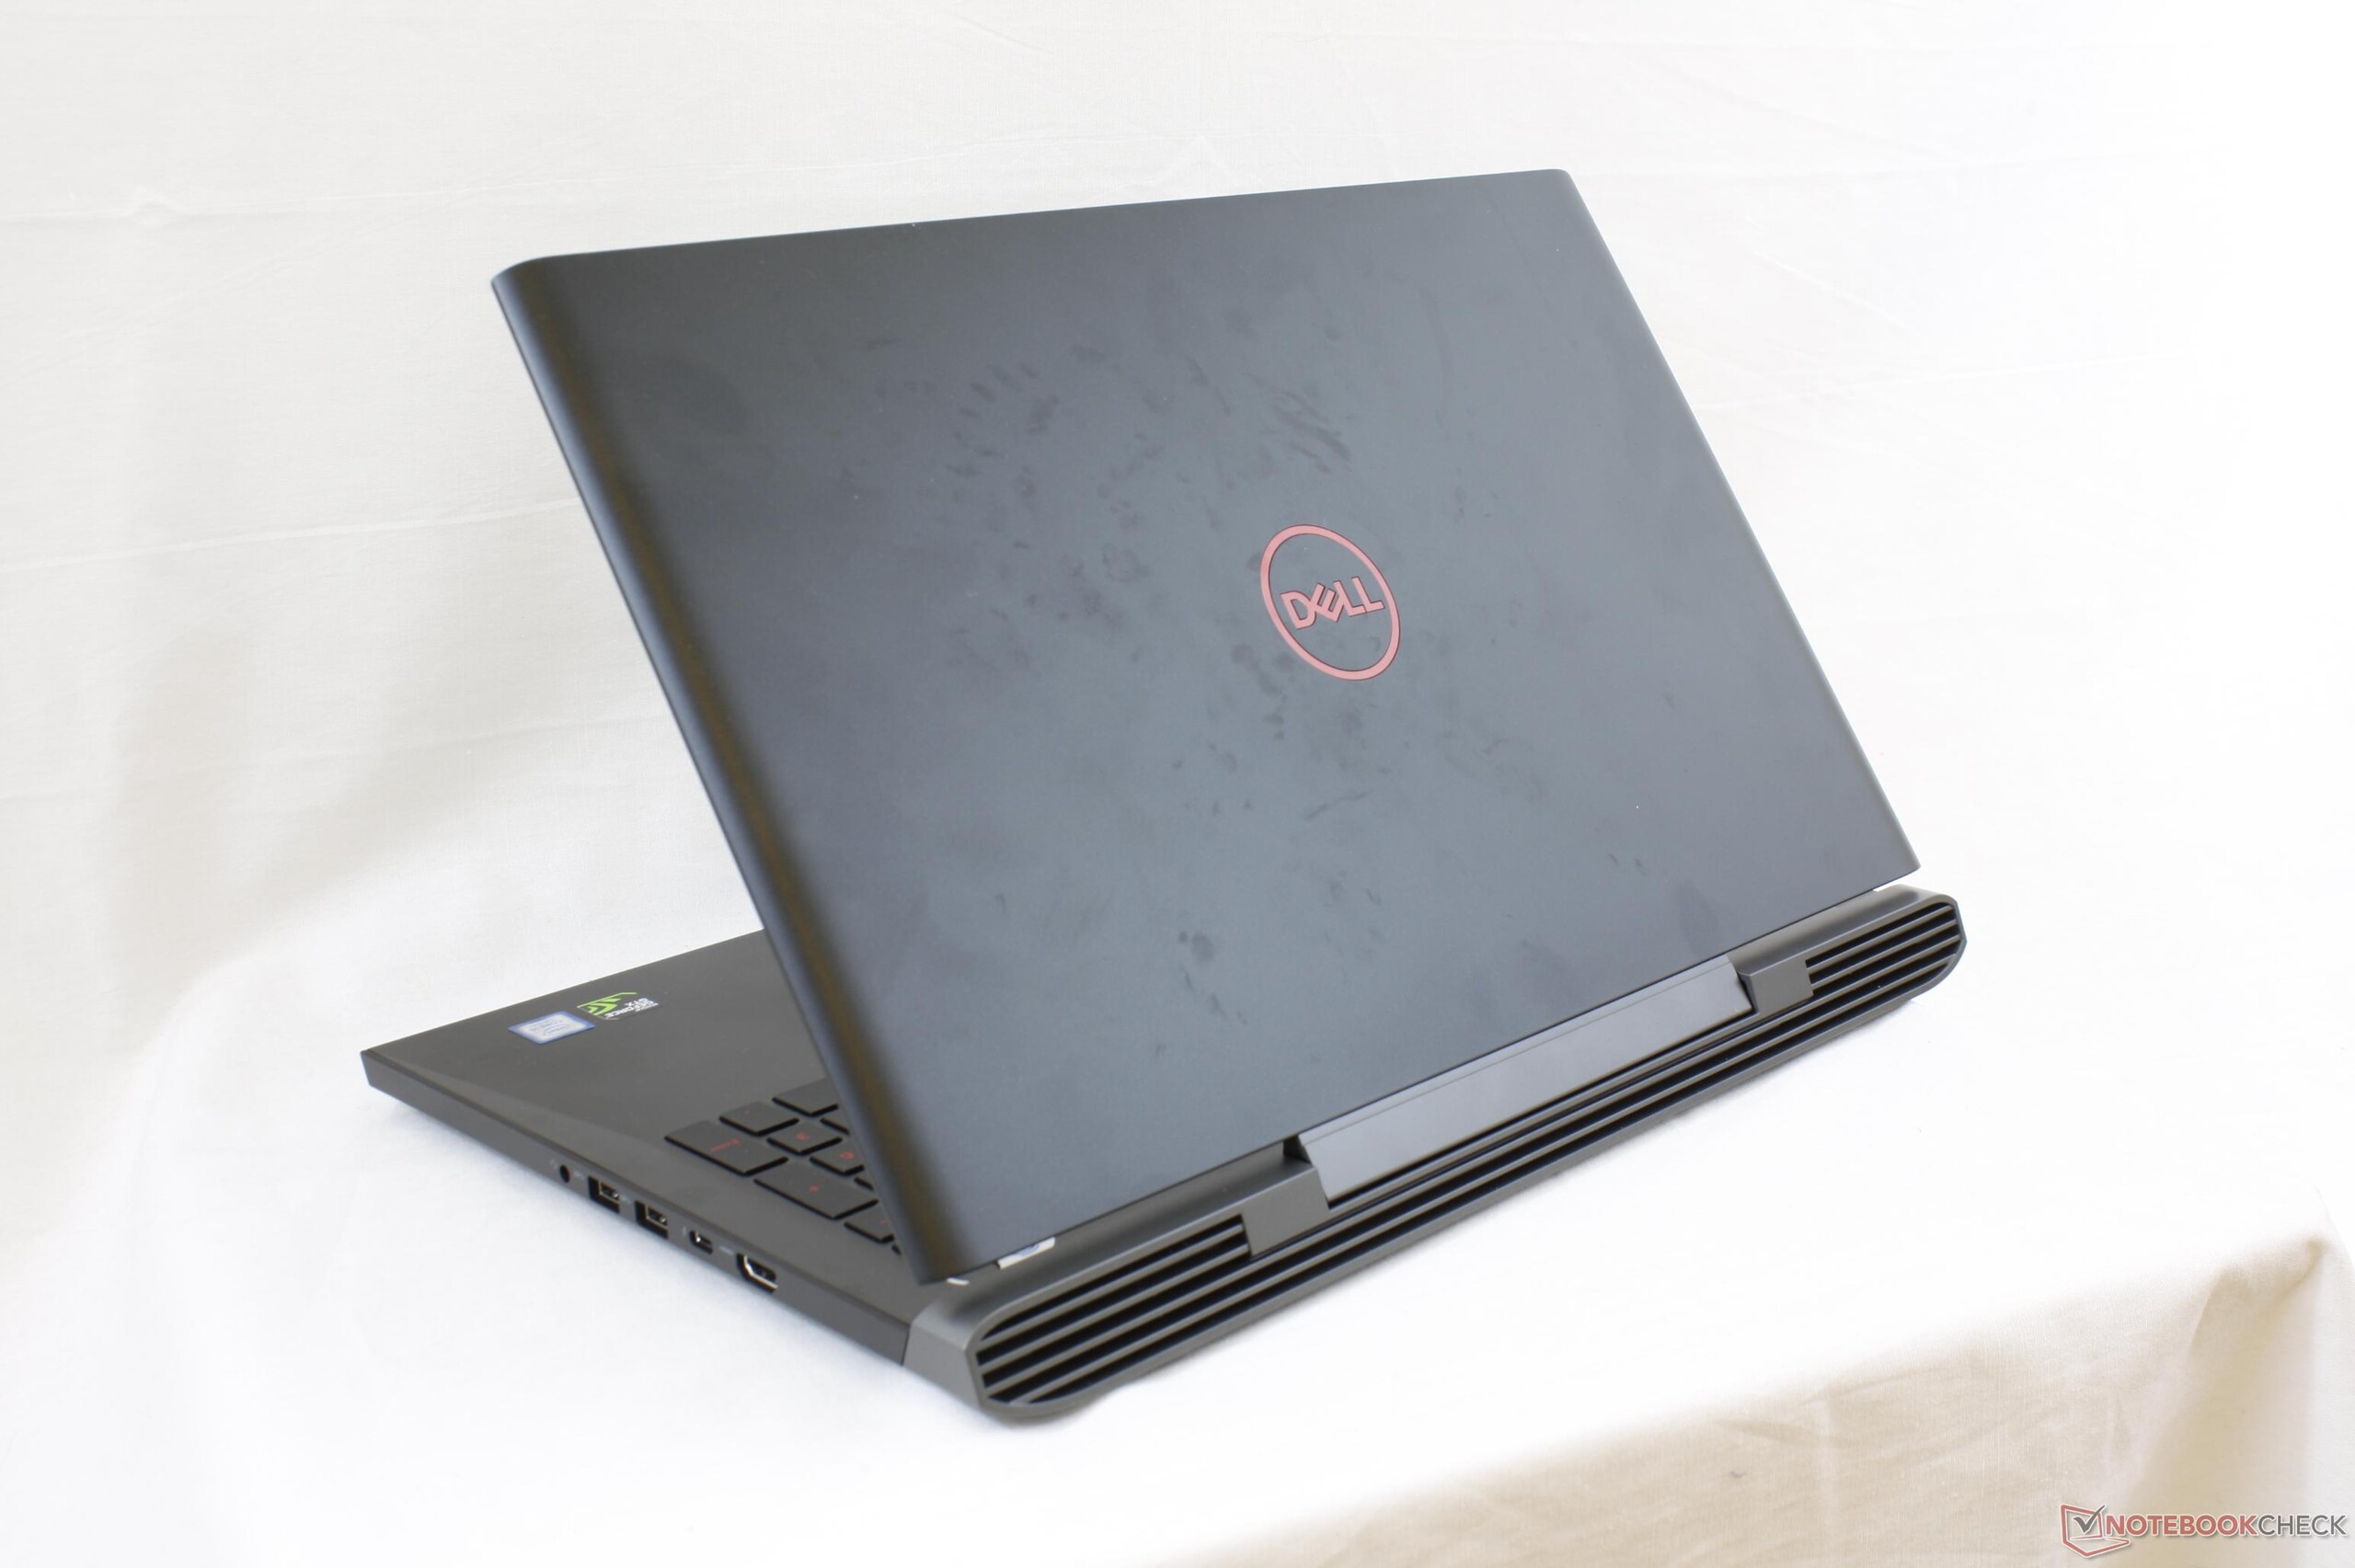
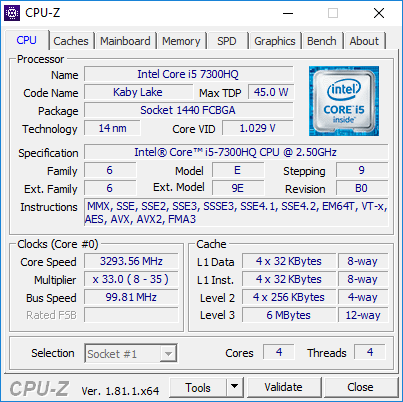
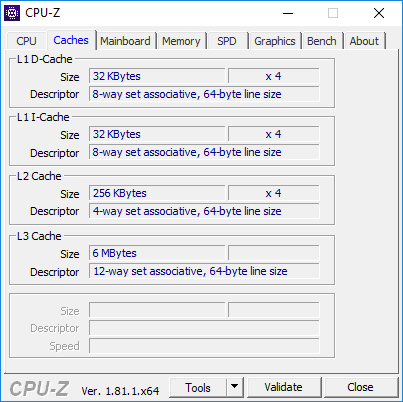
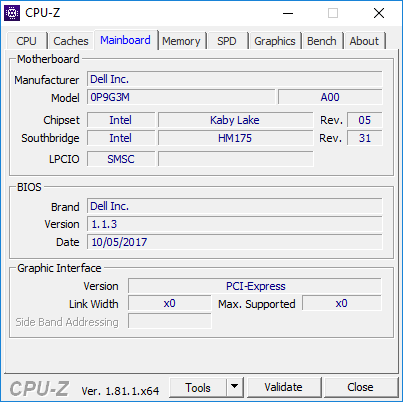
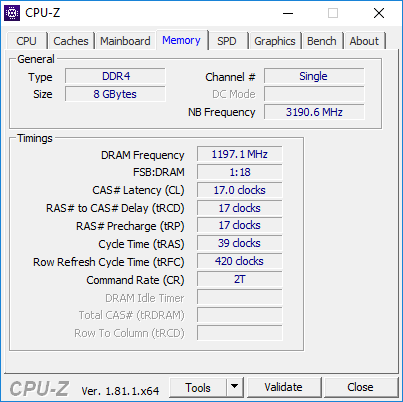
Dell Inspiron 15 7000 7577
- 01/03/2018 v6 (old)
Allen Ngo
Price comparison
