Dell Inspiron 15 7000 7577 (i7-7700HQ, GTX 1060 Max-Q, 4K UHD) Laptop rövid értékelés
| SD Card Reader | |
| average JPG Copy Test (av. of 3 runs) | |
| Az osztály átlaga Gaming (20.9 - 210, n=55, az elmúlt 2 évben) | |
| Asus Zenbook Pro UX550VE-DB71T (Toshiba Exceria Pro SDXC 64 GB UHS-II) | |
| Dell Inspiron 15 7000 7577 4K (Toshiba Exceria Pro SDXC 64 GB UHS-II) | |
| MSI GF62VR 7RF-877 (Toshiba Exceria Pro SDXC 64 GB UHS-II) | |
| maximum AS SSD Seq Read Test (1GB) | |
| Az osztály átlaga Gaming (25.5 - 261, n=52, az elmúlt 2 évben) | |
| Asus Zenbook Pro UX550VE-DB71T (Toshiba Exceria Pro SDXC 64 GB UHS-II) | |
| Dell Inspiron 15 7000 7577 4K (Toshiba Exceria Pro SDXC 64 GB UHS-II) | |
| MSI GF62VR 7RF-877 (Toshiba Exceria Pro SDXC 64 GB UHS-II) | |
| Networking | |
| iperf3 transmit AX12 | |
| MSI GF62VR 7RF-877 | |
| Dell Inspiron 15 7000 7577 4K | |
| Asus Zenbook Pro UX550VE-DB71T | |
| iperf3 receive AX12 | |
| MSI GF62VR 7RF-877 | |
| Dell Inspiron 15 7000 7577 4K | |
| Asus Zenbook Pro UX550VE-DB71T | |
| |||||||||||||||||||||||||
Fényerő megoszlás: 90 %
Centrumban: 322.9 cd/m²
Kontraszt: 897:1 (Fekete: 0.36 cd/m²)
ΔE ColorChecker Calman: 3.99 | ∀{0.5-29.43 Ø4.73}
ΔE Greyscale Calman: 5.3 | ∀{0.09-98 Ø4.97}
96.8% sRGB (Argyll 1.6.3 3D)
62.9% AdobeRGB 1998 (Argyll 1.6.3 3D)
69.6% AdobeRGB 1998 (Argyll 3D)
97.1% sRGB (Argyll 3D)
68.4% Display P3 (Argyll 3D)
Gamma: 2.041
CCT: 6941 K
| Dell Inspiron 15 7000 7577 4K Name: AU Optronics B156ZAN, IPS, 15.6", 3840x2160 | Asus Zenbook Pro UX550VE-DB71T N156HCE-EN1 (CMN15E8), IPS, 15.6", 1920x1080 | MSI GF62VR 7RF-877 Chi Mei N156HGA-EAL, TN LED, 15.6", 1920x1080 | Asus GL503VD-DB74 LG Philips LP156WF6, IPS, 15.6", 1920x1080 | Apple MacBook Pro 15 2017 (2.8 GHz, 555) APPA031, IPS, 15.4", 2880x1800 | Dell Inspiron 15 7000 7577 ID: LG Philips LGD053F, Name: 156WF6, Dell P/N: 4XK13, IPS, 15.6", 1920x1080 | |
|---|---|---|---|---|---|---|
| Display | -6% | 16% | -10% | 23% | -40% | |
| Display P3 Coverage (%) | 68.4 | 64.3 -6% | 85.6 25% | 64.3 -6% | 97.9 43% | 40.4 -41% |
| sRGB Coverage (%) | 97.1 | 90.4 -7% | 99.9 3% | 84.4 -13% | 99.9 3% | 60.5 -38% |
| AdobeRGB 1998 Coverage (%) | 69.6 | 65.3 -6% | 83.9 21% | 61.7 -11% | 85.9 23% | 41.77 -40% |
| Response Times | -19% | -14% | 3% | -28% | -8% | |
| Response Time Grey 50% / Grey 80% * (ms) | 35.2 ? | 43.2 ? -23% | 49.6 ? -41% | 36.4 ? -3% | 48 ? -36% | 41 ? -16% |
| Response Time Black / White * (ms) | 28.4 ? | 32.8 ? -15% | 24.4 ? 14% | 26.2 ? 8% | 33.8 ? -19% | 28 ? 1% |
| PWM Frequency (Hz) | 25510 ? | 25510 ? | 21010 ? | 119000 ? | ||
| Screen | -15% | -56% | -4% | 42% | -5% | |
| Brightness middle (cd/m²) | 322.9 | 288.2 -11% | 223.9 -31% | 315.9 -2% | 545 69% | 257 -20% |
| Brightness (cd/m²) | 309 | 266 -14% | 208 -33% | 304 -2% | 523 69% | 229 -26% |
| Brightness Distribution (%) | 90 | 75 -17% | 88 -2% | 88 -2% | 86 -4% | 84 -7% |
| Black Level * (cd/m²) | 0.36 | 0.3 17% | 0.56 -56% | 0.37 -3% | 0.44 -22% | 0.17 53% |
| Contrast (:1) | 897 | 961 7% | 400 -55% | 854 -5% | 1239 38% | 1512 69% |
| Colorchecker dE 2000 * | 3.99 | 5.5 -38% | 9.7 -143% | 4.9 -23% | 1.6 60% | 5.34 -34% |
| Colorchecker dE 2000 max. * | 8.97 | 11.3 -26% | 19.7 -120% | 9.7 -8% | 3.8 58% | 9.99 -11% |
| Greyscale dE 2000 * | 5.3 | 7.9 -49% | 12.9 -143% | 3.8 28% | 1.9 64% | 4.82 9% |
| Gamma | 2.041 108% | 2.09 105% | 2.18 101% | 2.24 98% | 2.26 97% | 2.46 89% |
| CCT | 6941 94% | 6559 99% | 15225 43% | 6847 95% | 6834 95% | 6587 99% |
| Color Space (Percent of AdobeRGB 1998) (%) | 62.9 | 58.5 -7% | 75 19% | 55 -13% | 38 -40% | |
| Color Space (Percent of sRGB) (%) | 96.8 | 90 -7% | 100 3% | 84 -13% | 60 -38% | |
| Teljes átlag (program / beállítások) | -13% /
-13% | -18% /
-36% | -4% /
-5% | 12% /
27% | -18% /
-12% |
* ... a kisebb jobb
Megjelenítési válaszidők
| ↔ Válaszidő Fekete-fehér | ||
|---|---|---|
| 28.4 ms ... emelkedés és süllyedés ↘ kombinálva | ↗ 16 ms emelkedés | 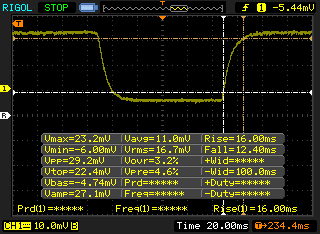 |
| ↘ 12.4 ms ősz | ||
| A képernyő viszonylag lassú reakciósebességet mutat tesztjeinkben, és túl lassú lehet a játékosok számára. Összehasonlításképpen, az összes tesztelt eszköz 0.1 (minimum) és 240 (maximum) ms között mozog. » 75 % of all devices are better. Ez azt jelenti, hogy a mért válaszidő rosszabb, mint az összes vizsgált eszköz átlaga (19.9 ms). | ||
| ↔ Válaszidő 50% szürke és 80% szürke között | ||
| 35.2 ms ... emelkedés és süllyedés ↘ kombinálva | ↗ 17.2 ms emelkedés | 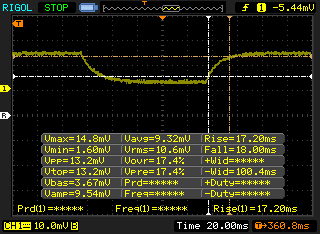 |
| ↘ 18 ms ősz | ||
| A képernyő lassú reakciósebességet mutat tesztjeinkben, és nem lesz kielégítő a játékosok számára. Összehasonlításképpen, az összes tesztelt eszköz 0.165 (minimum) és 636 (maximum) ms között mozog. » 49 % of all devices are better. Ez azt jelenti, hogy a mért válaszidő rosszabb, mint az összes vizsgált eszköz átlaga (31.1 ms). | ||
Képernyő villogása / PWM (impulzusszélesség-moduláció)
| Képernyő villogása / PWM nem érzékelhető | 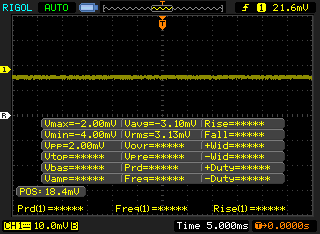 | ||
Összehasonlításképpen: az összes tesztelt eszköz 52 %-a nem használja a PWM-et a kijelző elsötétítésére. Ha PWM-et észleltek, akkor átlagosan 7798 (minimum: 5 - maximum: 343500) Hz-t mértek. | |||
* ... a kisebb jobb
| PCMark 8 Home Score Accelerated v2 | 3385 pontok | |
| PCMark 8 Creative Score Accelerated v2 | 4806 pontok | |
| PCMark 8 Work Score Accelerated v2 | 4102 pontok | |
| PCMark 10 Score | 4306 pontok | |
Segítség | ||
| Dell Inspiron 15 7000 7577 4K SK hynix SC311 M.2 | Asus Zenbook Pro UX550VE-DB71T Samsung PM961 NVMe MZVLW512HMJP | MSI GF62VR 7RF-877 Intel SSD 600p SSDPEKKW256G7 | Dell Inspiron 15 7000 7577 Samsung PM961 MZVLW256HEHP | Átlagos SK hynix SC311 M.2 | |
|---|---|---|---|---|---|
| AS SSD | 337% | 114% | 207% | 1% | |
| Copy Game MB/s (MB/s) | 185.4 | 477.1 157% | 471.7 154% | 382.5 106% | 164.3 ? -11% |
| Copy Program MB/s (MB/s) | 142.2 | 294.6 107% | 286.5 101% | 274.8 93% | 138.6 ? -3% |
| Copy ISO MB/s (MB/s) | 363.6 | 1269 249% | 1069 194% | 814 124% | 246 ? -32% |
| Score Total (Points) | 578 | 3721 544% | 1324 129% | 2405 316% | 639 ? 11% |
| Score Write (Points) | 227 | 1421 526% | 693 205% | 594 162% | 228 ? 0% |
| Score Read (Points) | 234 | 1541 559% | 448 91% | 1241 430% | 273 ? 17% |
| Access Time Write * (ms) | 0.058 | 0.034 41% | 0.03 48% | 0.037 36% | 0.058 ? -0% |
| Access Time Read * (ms) | 0.126 | 0.054 57% | 0.09 29% | 0.058 54% | 0.1233 ? 2% |
| 4K-64 Write (MB/s) | 127.2 | 1160 812% | 551 333% | 375.8 195% | 131.4 ? 3% |
| 4K-64 Read (MB/s) | 156.6 | 1269 710% | 280.1 79% | 929 493% | 196.5 ? 25% |
| 4K Write (MB/s) | 74 | 112.8 52% | 118.3 60% | 100.2 35% | 69.6 ? -6% |
| 4K Read (MB/s) | 26.24 | 51 94% | 31.27 19% | 46.95 79% | 26.3 ? 0% |
| Seq Write (MB/s) | 259.9 | 1475 468% | 234.9 -10% | 1181 354% | 270 ? 4% |
| Seq Read (MB/s) | 508 | 2208 335% | 1371 170% | 2652 422% | 504 ? -1% |
* ... a kisebb jobb

| 3DMark 11 Performance | 11855 pontok | |
| 3DMark Ice Storm Standard Score | 84441 pontok | |
| 3DMark Cloud Gate Standard Score | 24667 pontok | |
| 3DMark Fire Strike Score | 8861 pontok | |
| 3DMark Fire Strike Extreme Score | 4610 pontok | |
Segítség | ||
| Rise of the Tomb Raider | |
| 1920x1080 Very High Preset AA:FX AF:16x | |
| MSI Gaming Z GeForce GTX 1070 OC Bios Desktop PC | |
| Nvidia GeForce GTX 1060 Founders Edition 6 GB | |
| Nvidia GeForce GTX 1060 Founders Edition 6 GB | |
| DogHouse Systems Mobius SS | |
| Dell Inspiron 15 7000 7577 4K | |
| MSI GeForce GTX 1050 Ti | |
| Zotac GeForce GTX 1050 2GB | |
| 3840x2160 High Preset AA:FX AF:4x | |
| MSI Gaming Z GeForce GTX 1070 OC Bios Desktop PC | |
| Nvidia GeForce GTX 1060 Founders Edition 6 GB | |
| Nvidia GeForce GTX 1060 Founders Edition 6 GB | |
| Dell Inspiron 15 7000 7577 4K | |
| Zotac GeForce GTX 1050 2GB | |
| alacsony | közepes | magas | ultra | 4K | |
|---|---|---|---|---|---|
| BioShock Infinite (2013) | 100.4 | ||||
| Metro: Last Light (2013) | 74 | ||||
| Thief (2014) | 70.4 | ||||
| The Witcher 3 (2015) | 70.1 | 36.8 | 24.4 | ||
| Batman: Arkham Knight (2015) | 129 | 81 | 53 | 26 | |
| Metal Gear Solid V (2015) | 60 | 60 | 42 | ||
| Fallout 4 (2015) | 78.4 | 64.6 | 25.8 | ||
| Rise of the Tomb Raider (2016) | 45.3 | 22.8 | |||
| Ashes of the Singularity (2016) | 59.8 | 52.9 | 21 | ||
| Overwatch (2016) | 165.8 | 102 | 50.3 | ||
| Prey (2017) | 120 | 101 | 34.6 | ||
| Dirt 4 (2017) | 119.5 | 84.9 | 48.3 | 28.8 | |
| F1 2017 (2017) | 98 | 60 | 26 | ||
| Middle-earth: Shadow of War (2017) | 82 | 60 | 46 | 17 | |
| Destiny 2 (2017) | 94.7 | 85.4 | 71.4 | 17.6 | |
| Final Fantasy XV Benchmark (2018) | 73 | 47.2 | 33.9 | 14.6 |
Zajszint
| Üresjárat |
| 28.8 / 29.2 / 29.2 dB(A) |
| Terhelés |
| 34.6 / 49.3 dB(A) |
 | ||
30 dB csendes 40 dB(A) hallható 50 dB(A) hangos |
||
min: | ||
| Dell Inspiron 15 7000 7577 4K GeForce GTX 1060 Max-Q, i7-7700HQ, SK hynix SC311 M.2 | Asus Zenbook Pro UX550VE-DB71T GeForce GTX 1050 Ti Mobile, i7-7700HQ, Samsung PM961 NVMe MZVLW512HMJP | Acer Swift 3 SF315-41-R4W1 Vega 8, R5 2500U, Intel SSD 600p SSDPEKKW256G7 | Dell Inspiron 15 7000 7577 GeForce GTX 1050 Mobile, i5-7300HQ, Seagate Mobile HDD 1TB ST1000LX015-1U7172 | Asus Zephyrus GX501 GeForce GTX 1080 Max-Q, i7-7700HQ, Samsung SSD SM961 1TB M.2 MZVKW1T0HMLH | MSI GE63VR 7RF Raider GeForce GTX 1070 Mobile, i7-7700HQ, Toshiba HG6 THNSNJ256G8NY | |
|---|---|---|---|---|---|---|
| Noise | -6% | -1% | -5% | -7% | -20% | |
| off / környezet * (dB) | 28.5 | 28.3 1% | 31.8 -12% | 31 -9% | 31 -9% | 30 -5% |
| Idle Minimum * (dB) | 28.8 | 30.4 -6% | 31.8 -10% | 32.7 -14% | 32 -11% | 33 -15% |
| Idle Average * (dB) | 29.2 | 31 -6% | 32.1 -10% | 32.7 -12% | 33 -13% | 35 -20% |
| Idle Maximum * (dB) | 29.2 | 31.2 -7% | 32.1 -10% | 32.7 -12% | 34 -16% | 40 -37% |
| Load Average * (dB) | 34.6 | 43.3 -25% | 33 5% | 38.7 -12% | 39 -13% | 48 -39% |
| Witcher 3 ultra * (dB) | 44.1 | 46.2 -5% | 39 12% | 42 5% | 50 -13% | |
| Load Maximum * (dB) | 49.3 | 46.2 6% | 34.8 29% | 44.6 10% | 46 7% | 55 -12% |
* ... a kisebb jobb
(±) A felső oldalon a maximális hőmérséklet 42.6 °C / 109 F, összehasonlítva a 40.4 °C / 105 F átlagával , 21.2 és 68.8 °C között a Gaming osztálynál.
(-) Az alsó maximum 46.2 °C / 115 F-ig melegszik fel, összehasonlítva a 43.2 °C / 110 F átlagával
(+) Üresjáratban a felső oldal átlagos hőmérséklete 27.1 °C / 81 F, összehasonlítva a 33.9 °C / ### eszközátlaggal class_avg_f### F.
(+) A The Witcher 3 játék során a felső oldal átlaghőmérséklete 28.9 °C / 84 F, összehasonlítva a 33.9 °C / ## eszközátlaggal #class_avg_f### F.
(+) A csuklótámasz és az érintőpad hűvösebb, mint a bőr hőmérséklete, maximum 27.2 °C / 81 F, ezért hűvös tapintású.
(±) A hasonló eszközök csuklótámasz területének átlagos hőmérséklete 28.8 °C / 83.8 F volt (+1.6 °C / 2.8 F).
| Kikapcsolt állapot / Készenlét | |
| Üresjárat | |
| Terhelés |
|
Kulcs:
min: | |
| Dell Inspiron 15 7000 7577 4K i7-7700HQ, GeForce GTX 1060 Max-Q, SK hynix SC311 M.2, IPS, 3840x2160, 15.6" | Asus Zenbook Pro UX550VE-DB71T i7-7700HQ, GeForce GTX 1050 Ti Mobile, Samsung PM961 NVMe MZVLW512HMJP, IPS, 1920x1080, 15.6" | Acer Swift 3 SF315-41-R4W1 R5 2500U, Vega 8, Intel SSD 600p SSDPEKKW256G7, IPS, 1920x1080, 15.6" | MSI GF62VR 7RF-877 i7-7700HQ, GeForce GTX 1060 Mobile, Intel SSD 600p SSDPEKKW256G7, TN LED, 1920x1080, 15.6" | Dell Inspiron 15 7000 7577 i5-7300HQ, GeForce GTX 1050 Mobile, Seagate Mobile HDD 1TB ST1000LX015-1U7172, IPS, 1920x1080, 15.6" | Asus Zephyrus GX501 i7-7700HQ, GeForce GTX 1080 Max-Q, Samsung SSD SM961 1TB M.2 MZVKW1T0HMLH, IPS, 1920x1080, 15.6" | |
|---|---|---|---|---|---|---|
| Power Consumption | 7% | 14% | -68% | 3% | -107% | |
| Idle Minimum * (Watt) | 5.5 | 6.3 -15% | 7.3 -33% | 16.2 -195% | 5.3 4% | 18 -227% |
| Idle Average * (Watt) | 10.5 | 7.9 25% | 9.7 8% | 18.2 -73% | 8.8 16% | 23 -119% |
| Idle Maximum * (Watt) | 10.9 | 8.1 26% | 13 -19% | 18.9 -73% | 9.7 11% | 31 -184% |
| Load Average * (Watt) | 72 | 84.9 -18% | 40.4 44% | 82.7 -15% | 100 -39% | 79 -10% |
| Witcher 3 ultra * (Watt) | 97.4 | 96.3 1% | 125.7 -29% | 87 11% | 148 -52% | |
| Load Maximum * (Watt) | 130.4 | 102.4 21% | 42.2 68% | 162.3 -24% | 109 16% | 196 -50% |
* ... a kisebb jobb
| Dell Inspiron 15 7000 7577 4K i7-7700HQ, GeForce GTX 1060 Max-Q, 56 Wh | Asus Zenbook Pro UX550VE-DB71T i7-7700HQ, GeForce GTX 1050 Ti Mobile, 73 Wh | Acer Swift 3 SF315-41-R4W1 R5 2500U, Vega 8, 48 Wh | MSI GF62VR 7RF-877 i7-7700HQ, GeForce GTX 1060 Mobile, 41 Wh | Asus GL503VD-DB74 i7-7700HQ, GeForce GTX 1050 Mobile, 64 Wh | Dell Inspiron 15 7000 7577 i5-7300HQ, GeForce GTX 1050 Mobile, 56 Wh | |
|---|---|---|---|---|---|---|
| Akkumulátor üzemidő | 39% | 4% | -63% | -2% | 19% | |
| Reader / Idle (h) | 10 | 17.1 71% | 12.2 22% | 2.8 -72% | 10.8 8% | 11.1 11% |
| WiFi v1.3 (h) | 5.4 | 8.9 65% | 5.2 -4% | 1.9 -65% | 5.8 7% | 6.8 26% |
| Load (h) | 1.5 | 1.2 -20% | 1.4 -7% | 0.7 -53% | 1.2 -20% | 1.8 20% |
Pro
Kontra

Játékra, a natív 4K UHD panel nem tökéletesen illik egy GTX 1060 Max-Q GPU-val hajtott gépbe. Ha a notebookot nem csak nagy táblázatokhoz, és kisebb igényű játékokhoz (pl.: Rocket League, LoL, Overwatch, vagy DOTA 2) akarjuk használni, úgy nehéz érvet találni a 4K-s panel masszív ártöbblete mellett a szabvány FHD-s modellel szemben. Sokkal erősebb videokártyára lenne ahhoz szükség, hogy megfelelően ki lehessen használni az UHD kijelző nyújtotta előnyöket.
Ha a fentiek nem rettentik el a leendő vásárlót, úgy örömmel konstatálhatják, hogy a 4K-s panel világosabb, és színhűbb az FHD-s modellnél. Az előzőleg tesztelt Inspiron 15 7577-ek előnyei és hátrányai itt is visszaköszönnek, ide értve az erős alapot, lágy, de halk billentyűket, valamint a jól hozzáférhető belsőt.
Az Inspiron 15 7577 4K UHD-s verziója papíron jobb, mint az FHD-s konfiguráció, de a gamerek jobban járnak, ha a legtöbb játéknál maradnak az 1080p felbontásnál, amelyre a GTX 1060 Max-Q-t tervezték.
Ez az eredeti értékelés rövidített változata. A teljes, angol nyelvű cikk itt olvasható.
Dell Inspiron 15 7000 7577 4K
- 02/19/2018 v6 (old)
Allen Ngo
Price comparison
