Asus ROG Zephyrus GX501 Laptop rövid értékelés


| Networking | |
| iperf3 transmit AX12 | |
| Asus Zephyrus GX501 | |
| iperf3 receive AX12 | |
| Asus Zephyrus GX501 | |
| |||||||||||||||||||||||||
Fényerő megoszlás: 83 %
Centrumban: 328 cd/m²
Kontraszt: 1312:1 (Fekete: 0.25 cd/m²)
ΔE ColorChecker Calman: 6.02 | ∀{0.5-29.43 Ø4.73}
ΔE Greyscale Calman: 6.32 | ∀{0.09-98 Ø4.97}
92% sRGB (Argyll 1.6.3 3D)
60% AdobeRGB 1998 (Argyll 1.6.3 3D)
65.9% AdobeRGB 1998 (Argyll 3D)
91.8% sRGB (Argyll 3D)
64.8% Display P3 (Argyll 3D)
Gamma: 2.28
CCT: 8194 K
Megjelenítési válaszidők
| ↔ Válaszidő Fekete-fehér | ||
|---|---|---|
| 24 ms ... emelkedés és süllyedés ↘ kombinálva | ↗ 11.6 ms emelkedés | 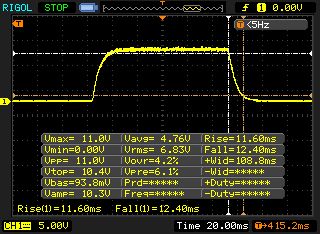 |
| ↘ 12.4 ms ősz | ||
| A képernyő jó reakciósebességet mutat tesztjeinkben, de túl lassú lehet a versenyképes játékosok számára. Összehasonlításképpen, az összes tesztelt eszköz 0.1 (minimum) és 240 (maximum) ms között mozog. » 54 % of all devices are better. Ez azt jelenti, hogy a mért válaszidő rosszabb, mint az összes vizsgált eszköz átlaga (19.9 ms). | ||
| ↔ Válaszidő 50% szürke és 80% szürke között | ||
| 40.4 ms ... emelkedés és süllyedés ↘ kombinálva | ↗ 23.2 ms emelkedés | 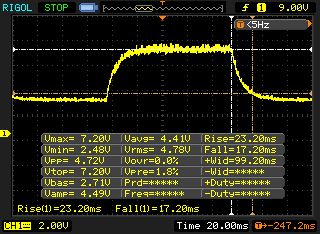 |
| ↘ 17.2 ms ősz | ||
| A képernyő lassú reakciósebességet mutat tesztjeinkben, és nem lesz kielégítő a játékosok számára. Összehasonlításképpen, az összes tesztelt eszköz 0.165 (minimum) és 636 (maximum) ms között mozog. » 63 % of all devices are better. Ez azt jelenti, hogy a mért válaszidő rosszabb, mint az összes vizsgált eszköz átlaga (31.1 ms). | ||
Képernyő villogása / PWM (impulzusszélesség-moduláció)
| Képernyő villogása / PWM nem érzékelhető | 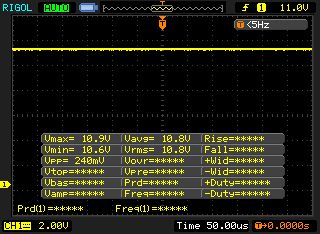 | ||
Összehasonlításképpen: az összes tesztelt eszköz 52 %-a nem használja a PWM-et a kijelző elsötétítésére. Ha PWM-et észleltek, akkor átlagosan 7798 (minimum: 5 - maximum: 343500) Hz-t mértek. | |||

| PCMark 8 Home Score Accelerated v2 | 5057 pontok | |
| PCMark 8 Work Score Accelerated v2 | 5289 pontok | |
| PCMark 10 Score | 5125 pontok | |
Segítség | ||
| 3DMark Vantage P Result | 39562 pontok | |
| 3DMark 11 Performance | 16821 pontok | |
| 3DMark Ice Storm Standard Score | 140964 pontok | |
| 3DMark Cloud Gate Standard Score | 27935 pontok | |
| 3DMark Fire Strike Score | 14260 pontok | |
| 3DMark Time Spy Score | 5390 pontok | |
Segítség | ||
| alacsony | közepes | magas | ultra | QHD | 4K | |
|---|---|---|---|---|---|---|
| The Witcher 3 (2015) | 118 | 61.9 | 43.7 | |||
| Batman: Arkham Knight (2015) | 124 | 88 | 48 | |||
| Star Wars Battlefront (2015) | 164 | 144 | 55.6 | |||
| Assassin's Creed Syndicate (2015) | 74.4 | 50.3 | 40 | |||
| Rainbow Six Siege (2015) | 197 | 172 | 65.7 | |||
| Rise of the Tomb Raider (2016) | 125 | 105 | 43.6 | |||
| Far Cry Primal (2016) | 92 | 87 | 41 | |||
| The Division (2016) | 107 | 83.8 | 40.8 | |||
| Doom (2016) | 134 | 128 | 53.9 | |||
| Mirror's Edge Catalyst (2016) | 106 | 97.8 | 38.8 | |||
| Deus Ex Mankind Divided (2016) | 87.3 | 47.9 | 29.6 | |||
| Battlefield 1 (2016) | 130 | 113 | 49 | |||
| Titanfall 2 (2016) | 131 | 113 | 46.6 | |||
| Call of Duty Infinite Warfare (2016) | 123 | 118 | 63.7 | |||
| Dishonored 2 (2016) | 78.2 | 66.5 | 43.4 | |||
| Watch Dogs 2 (2016) | 86.7 | 66.7 | 34.9 | |||
| Resident Evil 7 (2017) | 166 | 140 | 47.4 | |||
| For Honor (2017) | 155 | 115 | 47.9 | |||
| Ghost Recon Wildlands (2017) | 86.7 | 51.9 | 34.1 | |||
| Mass Effect Andromeda (2017) | 81.4 | 73.2 | 35.1 | |||
| Warhammer 40.000: Dawn of War III (2017) | 88 | 86 | 41.9 | |||
| Prey (2017) | 135 | 131 | 50.5 | |||
| Rocket League (2017) | 235 | 103 | ||||
| Dirt 4 (2017) | 136 | 88.4 | ||||
| Team Fortress 2 (2017) | 124 | 125 | ||||
| Playerunknown's Battlegrounds (PUBG) (2017) | 125 | 111 | 104 | 79 | 27.1 | |
| Final Fantasy XV Benchmark (2018) | 130 | 86 | 64 | 27.2 | ||
| Far Cry New Dawn (2019) | 66 | 38 | ||||
| Dirt Rally 2.0 (2019) | 75 | 55.9 | 33.7 | |||
| The Division 2 (2019) | 74 | 51.5 | 27.8 | |||
| League of Legends (2019) | 145 | 144 |
Zajszint
| Üresjárat |
| 32 / 33 / 34 dB(A) |
| Terhelés |
| 39 / 46 dB(A) |
 | ||
30 dB csendes 40 dB(A) hallható 50 dB(A) hangos |
||
min: | ||
(-) A felső oldalon a maximális hőmérséklet 57 °C / 135 F, összehasonlítva a 40.4 °C / 105 F átlagával , 21.2 és 68.8 °C között a Gaming osztálynál.
(-) Az alsó maximum 54 °C / 129 F-ig melegszik fel, összehasonlítva a 43.2 °C / 110 F átlagával
(+) Üresjáratban a felső oldal átlagos hőmérséklete 30.7 °C / 87 F, összehasonlítva a 33.9 °C / ### eszközátlaggal class_avg_f### F.
(-) A The Witcher 3 játék során a felső oldal átlaghőmérséklete 46.8 °C / 116 F, összehasonlítva a 33.9 °C / ## eszközátlaggal #class_avg_f### F.
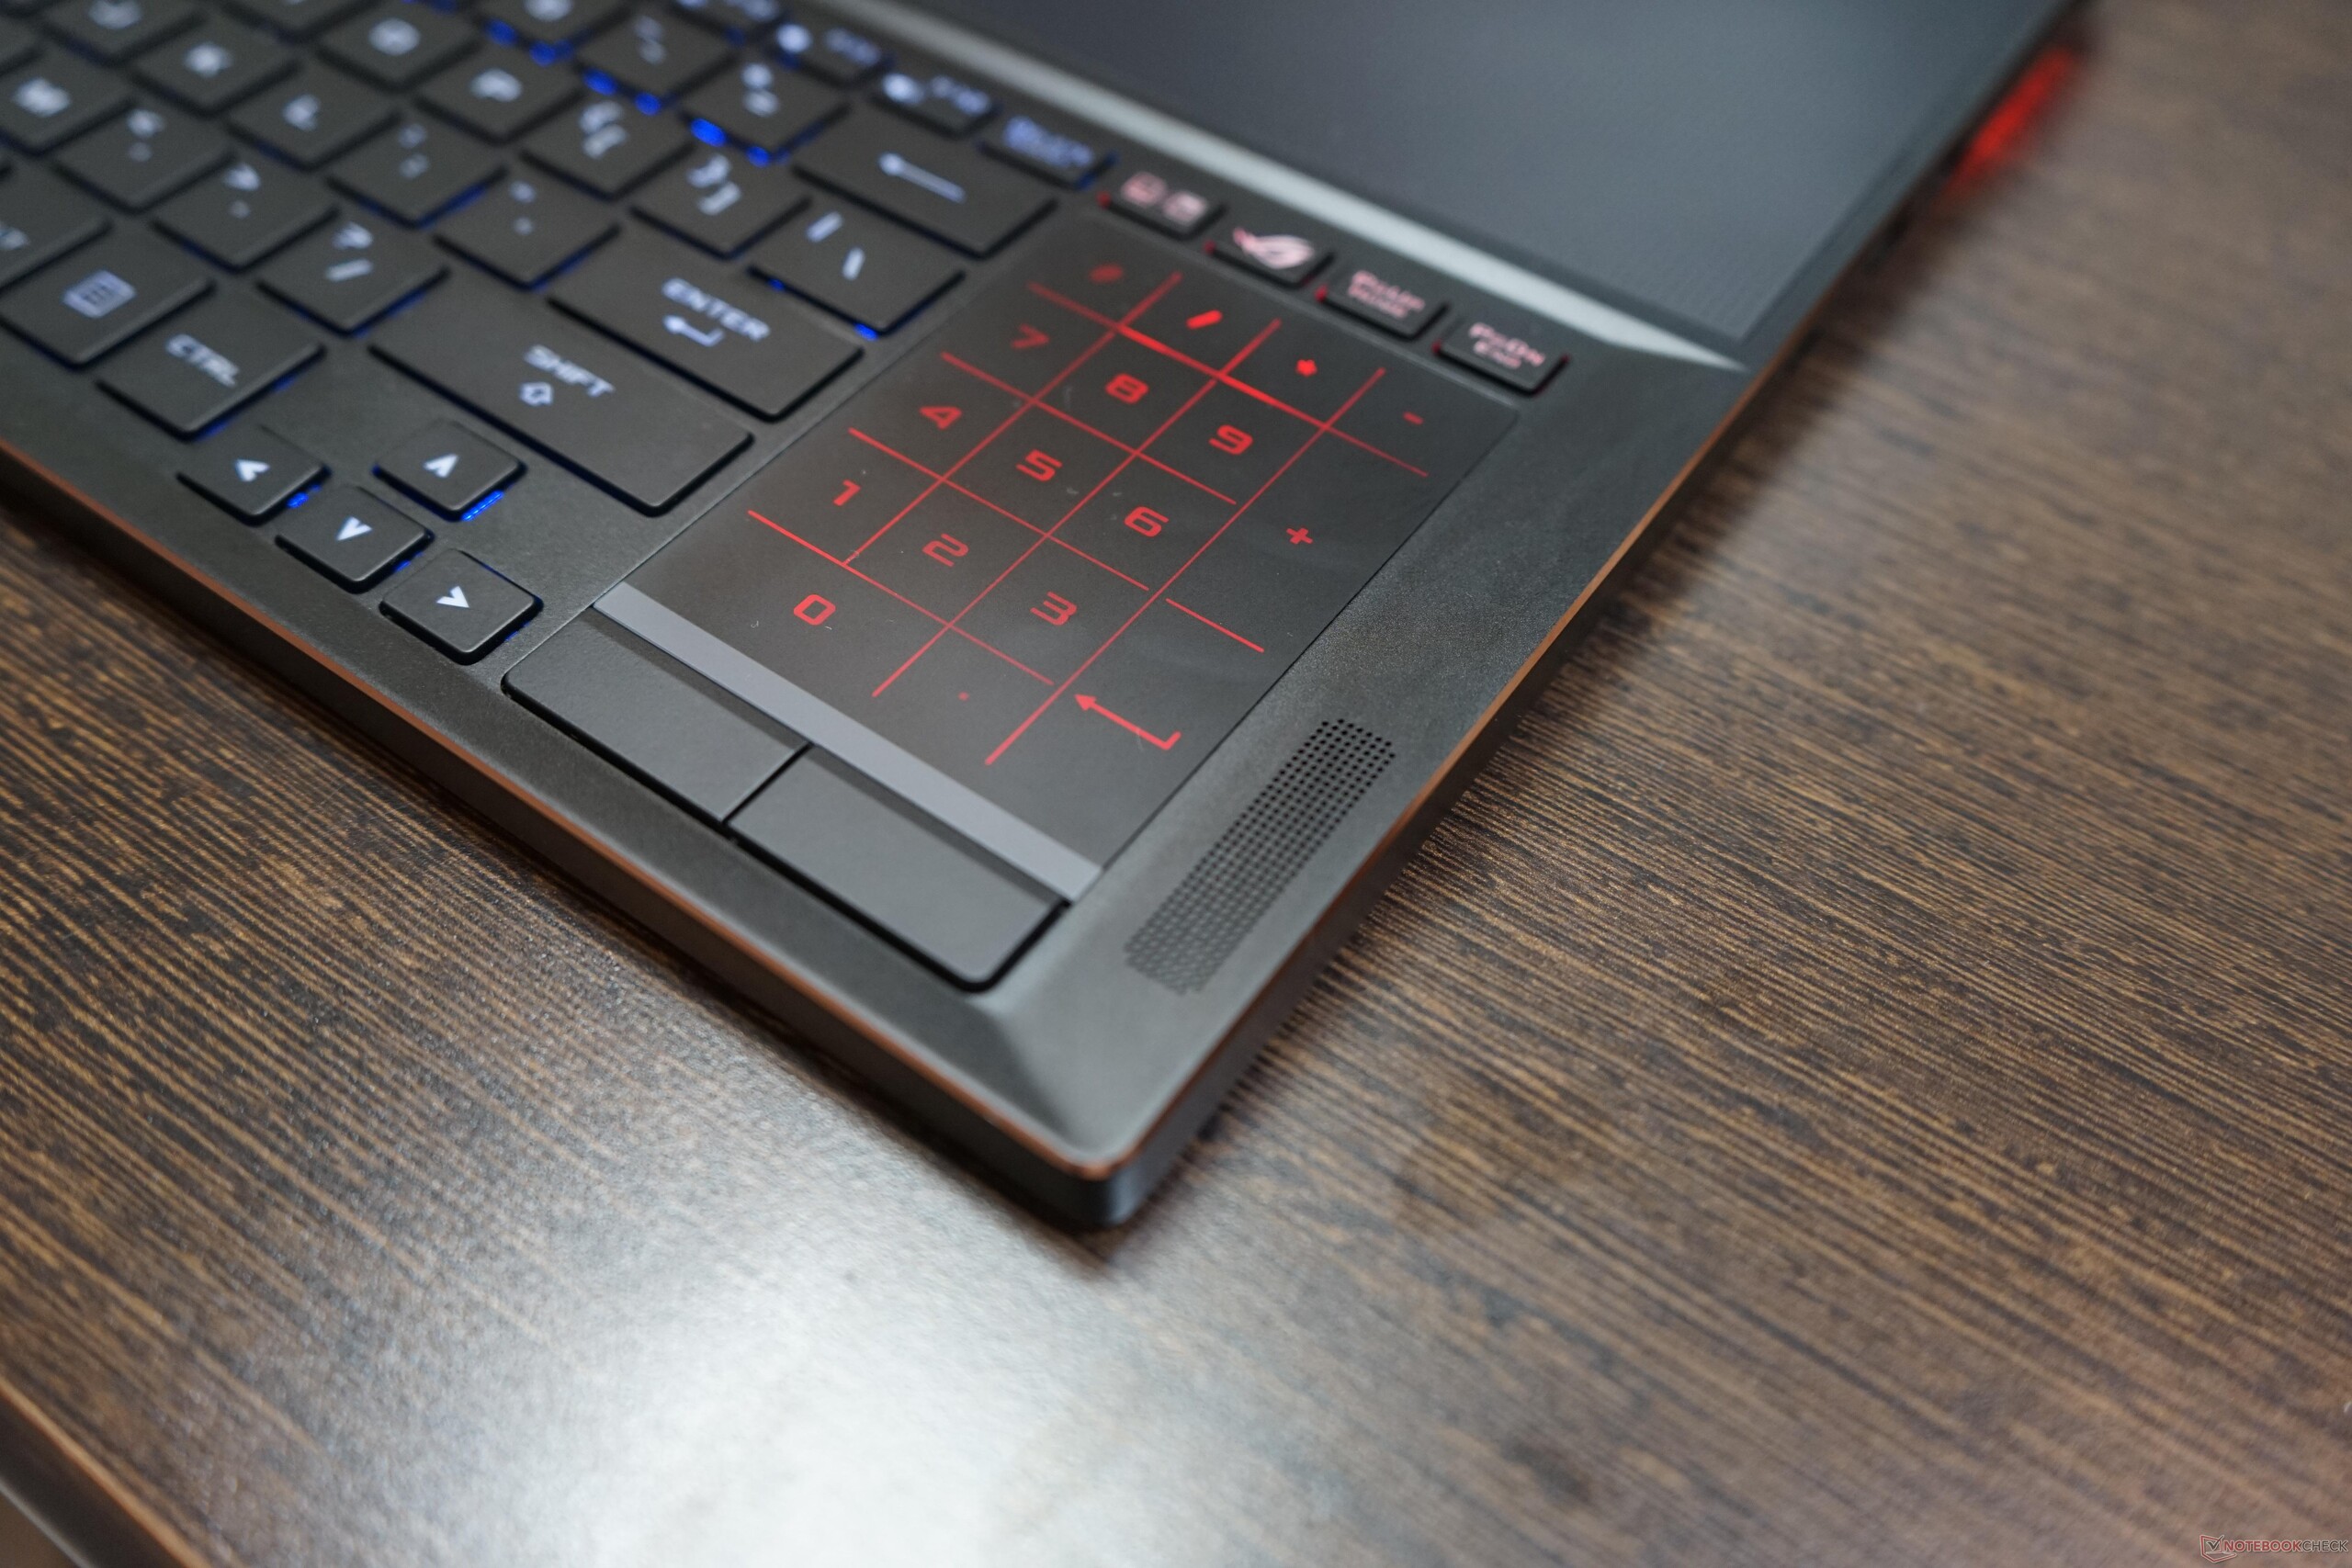
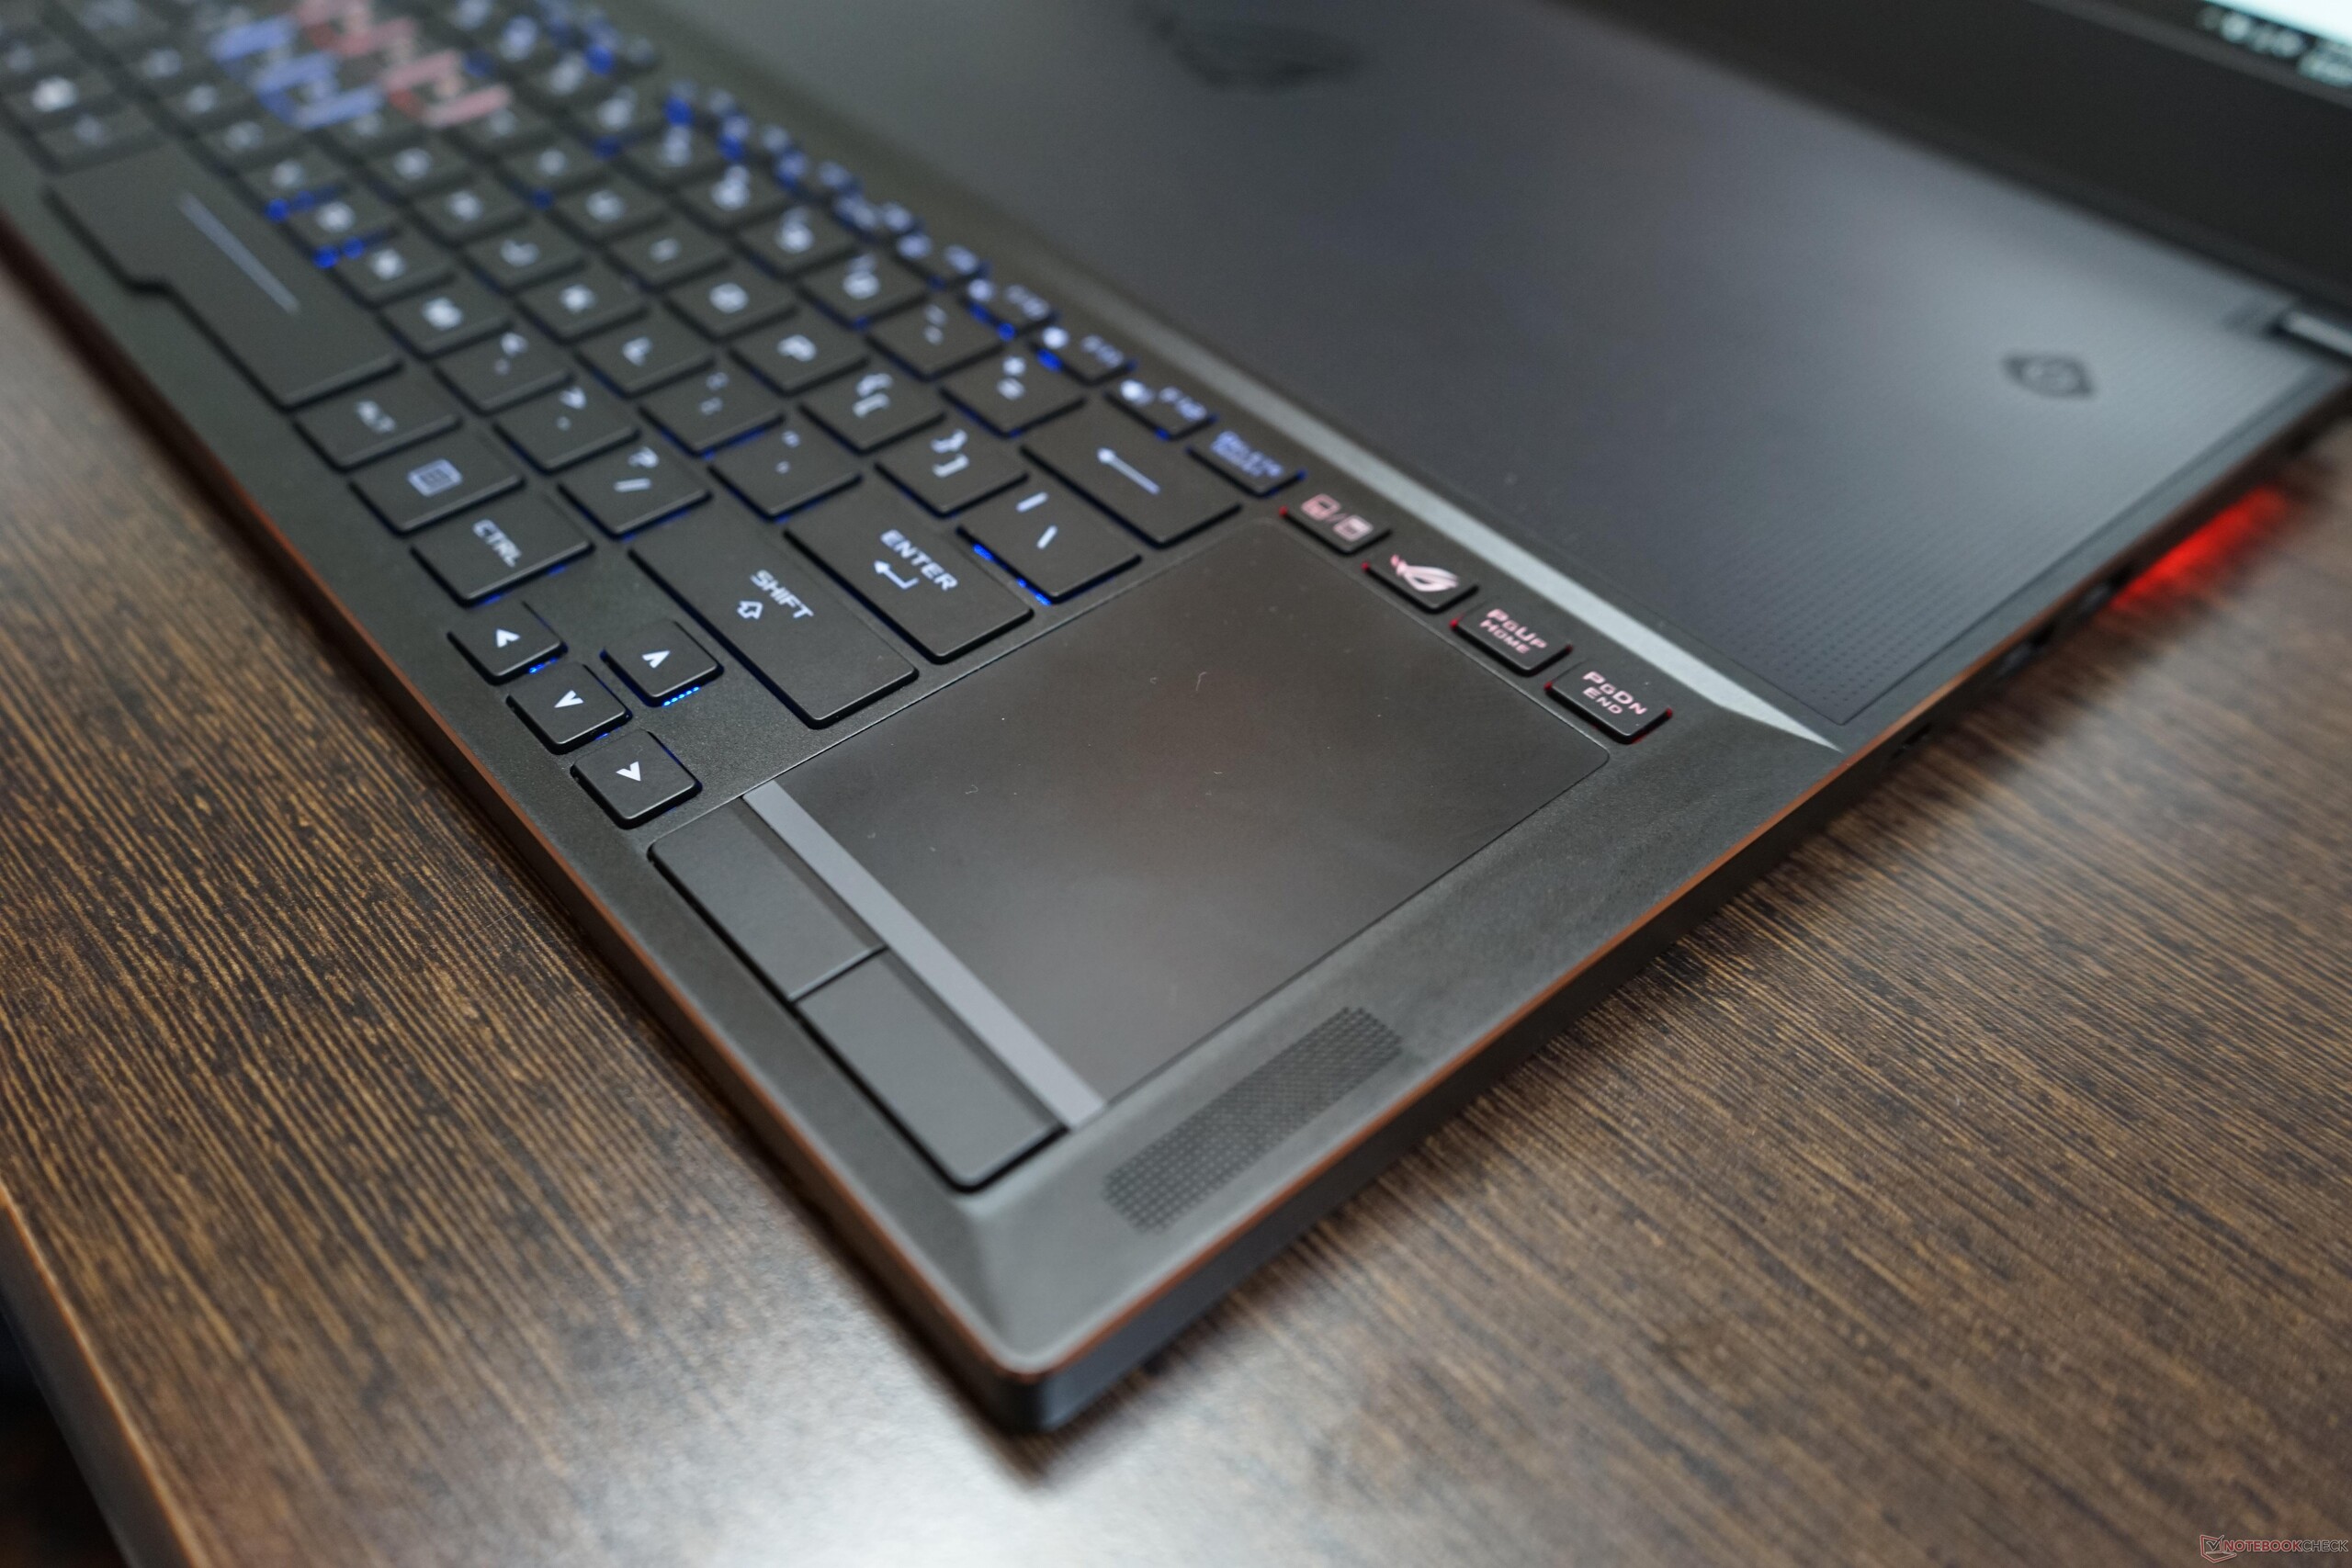
(-) A csuklótámasz és az érintőpad tapintásra nagyon felforrósodhat, maximum 42 °C / 107.6 F.
(-) A hasonló eszközök csuklótámasz területének átlagos hőmérséklete 28.8 °C / 83.8 F volt (-13.2 °C / -23.8 F).
Asus Zephyrus GX501 hangelemzés
(+) | a hangszórók viszonylag hangosan tudnak játszani (83 dB)
Basszus 100 - 315 Hz
(-) | szinte nincs basszus – átlagosan 23.2%-kal alacsonyabb a mediánnál
(±) | a basszus linearitása átlagos (12.5% delta az előző frekvenciához)
Közepes 400-2000 Hz
(+) | kiegyensúlyozott középpontok – csak 2.4% választja el a mediántól
(+) | a középpontok lineárisak (4.8% delta az előző frekvenciához)
Maximum 2-16 kHz
(+) | kiegyensúlyozott csúcsok – csak 2.2% választja el a mediántól
(+) | a csúcsok lineárisak (2% delta az előző frekvenciához képest)
Összességében 100 - 16.000 Hz
(±) | az általános hang linearitása átlagos (16.8% eltérés a mediánhoz képest)
Ugyanazon osztályhoz képest
» 44%Ebben az osztályban az összes tesztelt eszköz %-a jobb volt, 11% hasonló, 46%-kal rosszabb
» A legjobb delta értéke 6%, az átlag 18%, a legrosszabb 132% volt
Az összes tesztelt eszközzel összehasonlítva
» 29% az összes tesztelt eszköz jobb volt, 8% hasonló, 63%-kal rosszabb
» A legjobb delta értéke 4%, az átlag 24%, a legrosszabb 134% volt
Gigabyte Aero 15 hangelemzés
(±) | a hangszóró hangereje átlagos, de jó (79 dB)
Basszus 100 - 315 Hz
(-) | szinte nincs basszus – átlagosan 23.3%-kal alacsonyabb a mediánnál
(±) | a basszus linearitása átlagos (10.7% delta az előző frekvenciához)
Közepes 400-2000 Hz
(+) | kiegyensúlyozott középpontok – csak 1.8% választja el a mediántól
(+) | a középpontok lineárisak (4.1% delta az előző frekvenciához)
Maximum 2-16 kHz
(+) | kiegyensúlyozott csúcsok – csak 2.6% választja el a mediántól
(+) | a csúcsok lineárisak (5.1% delta az előző frekvenciához képest)
Összességében 100 - 16.000 Hz
(±) | az általános hang linearitása átlagos (18.3% eltérés a mediánhoz képest)
Ugyanazon osztályhoz képest
» 56%Ebben az osztályban az összes tesztelt eszköz %-a jobb volt, 7% hasonló, 38%-kal rosszabb
» A legjobb delta értéke 5%, az átlag 17%, a legrosszabb 45% volt
Az összes tesztelt eszközzel összehasonlítva
» 40% az összes tesztelt eszköz jobb volt, 8% hasonló, 52%-kal rosszabb
» A legjobb delta értéke 4%, az átlag 24%, a legrosszabb 134% volt
| Kikapcsolt állapot / Készenlét | |
| Üresjárat | |
| Terhelés |
|
Kulcs:
min: | |
Price comparison
