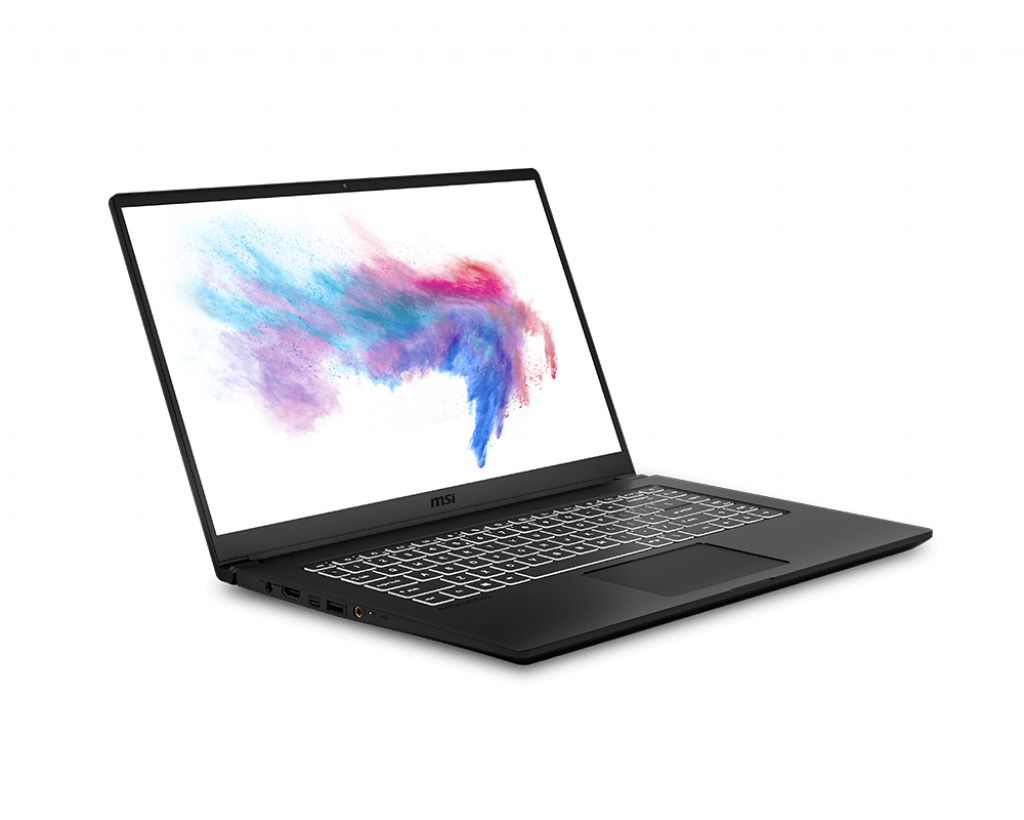
MSI Modern 15 A10RB Laptop rövid értékelés: A Dell XPS 15 Lite
Értékelés | Dátum | Modell | Súly | Magasság | Méret | Felbontás | Legjobb ár |
|---|---|---|---|---|---|---|---|
| 80.1 % v7 (old) | 04/2020 | MSI Modern 15 A10RB i7-10510U, GeForce MX250 | 1.6 kg | 15.9 mm | 15.60" | 1920x1080 | |
| 83.1 % v7 (old) | 12/2019 | Asus ZenBook 15 UX534FT-DB77 i7-8565U, GeForce GTX 1650 Max-Q | 1.7 kg | 18.9 mm | 15.60" | 1920x1080 | |
| 86.6 % v7 (old) | 08/2019 | Lenovo ThinkPad T590-20N4002VGE i7-8565U, GeForce MX250 | 1.9 kg | 19.95 mm | 15.60" | 1920x1080 | |
| 85 % v7 (old) | HP Spectre X360 15-5ZV31AV i7-10510U, GeForce MX250 | 2.1 kg | 19.3 mm | 15.60" | 3840x2160 | ||
| 85.2 % v7 (old) | 01/2020 | MSI Prestige 15 A10SC i7-10710U, GeForce GTX 1650 Max-Q | 1.7 kg | 16 mm | 15.60" | 3840x2160 | |
| 83.9 % v7 (old) | 12/2019 | Microsoft Surface Laptop 3 15 i7-1065G7 i7-1065G7, Iris Plus Graphics G7 (Ice Lake 64 EU) | 1.5 kg | 14.7 mm | 15.00" | 2496x1664 |
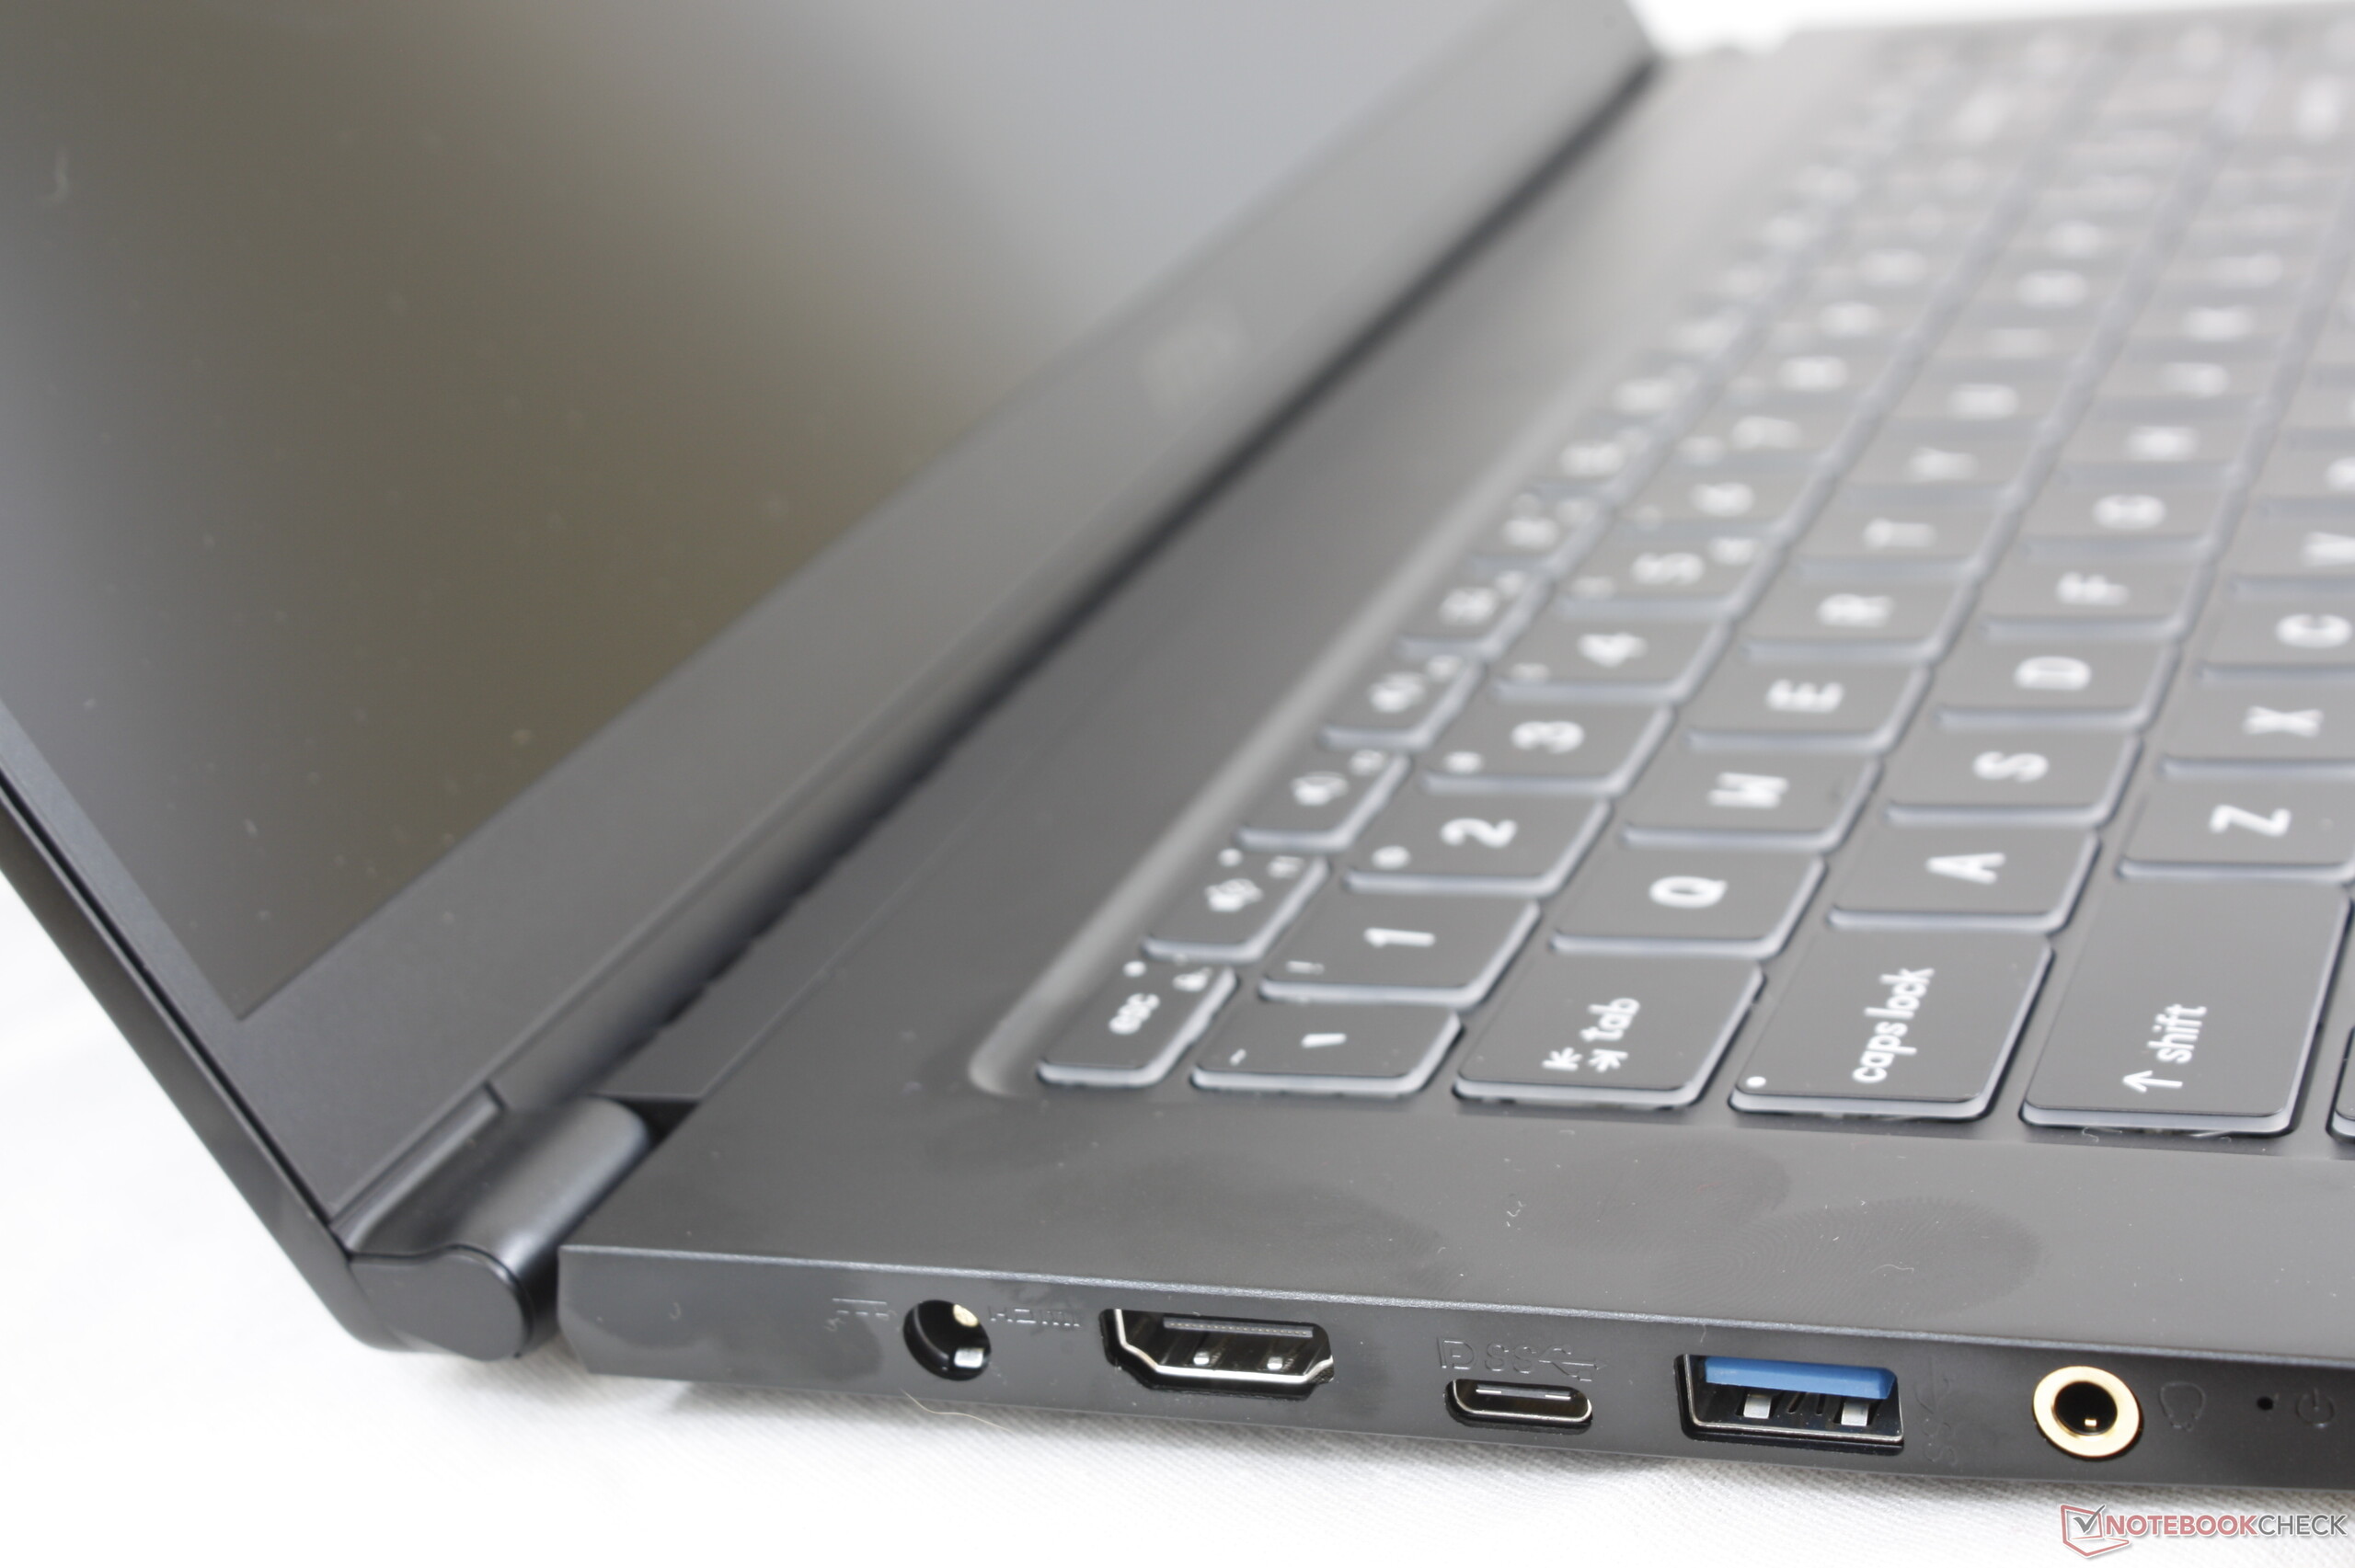
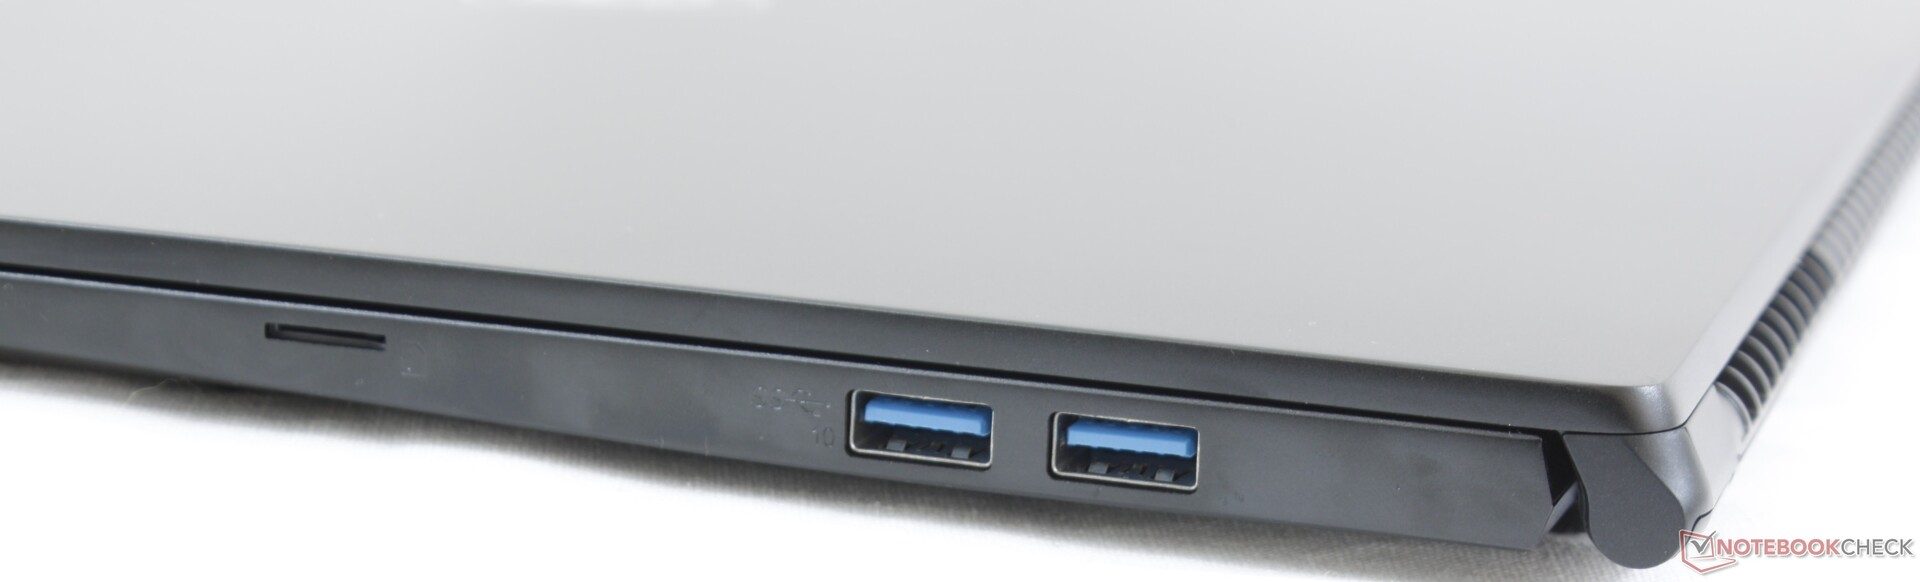
| SD Card Reader | |
| average JPG Copy Test (av. of 3 runs) | |
| Dell XPS 15 7590 i5 iGPU FHD (Toshiba Exceria Pro SDXC 64 GB UHS-II) | |
| MSI Prestige 15 A10SC (Toshiba Exceria Pro M501 UHS-II) | |
| Lenovo ThinkPad T590-20N4002VGE (Toshiba Exceria Pro M501 UHS-II) | |
| Asus ZenBook 15 UX534FT-DB77 (Toshiba Exceria Pro SDXC 64 GB UHS-II) | |
| MSI Modern 15 A10RB (Toshiba Exceria Pro M501 UHS-II) | |
| maximum AS SSD Seq Read Test (1GB) | |
| MSI Prestige 15 A10SC (Toshiba Exceria Pro M501 UHS-II) | |
| Dell XPS 15 7590 i5 iGPU FHD (Toshiba Exceria Pro SDXC 64 GB UHS-II) | |
| Lenovo ThinkPad T590-20N4002VGE (Toshiba Exceria Pro M501 UHS-II) | |
| Asus ZenBook 15 UX534FT-DB77 (Toshiba Exceria Pro SDXC 64 GB UHS-II) | |
| MSI Modern 15 A10RB (Toshiba Exceria Pro M501 UHS-II) | |
| |||||||||||||||||||||||||
Fényerő megoszlás: 82 %
Centrumban: 289.4 cd/m²
Kontraszt: 1072:1 (Fekete: 0.27 cd/m²)
ΔE ColorChecker Calman: 2.32 | ∀{0.5-29.43 Ø4.73}
calibrated: 2.49
ΔE Greyscale Calman: 3 | ∀{0.09-98 Ø4.97}
92% sRGB (Argyll 1.6.3 3D)
59.8% AdobeRGB 1998 (Argyll 1.6.3 3D)
66.5% AdobeRGB 1998 (Argyll 3D)
92.1% sRGB (Argyll 3D)
66% Display P3 (Argyll 3D)
Gamma: 2.22
CCT: 6867 K
| MSI Modern 15 A10RB Chi Mei N156HCE-EN1, IPS, 15.6", 1920x1080 | Asus ZenBook 15 UX534FT-DB77 BOE NV156FHM-N63, IPS, 15.6", 1920x1080 | Dell XPS 15 7590 i5 iGPU FHD LQ156M1, IPS, 15.6", 1920x1080 | Lenovo ThinkPad T590-20N4002VGE LP156WFC-SPD1, aSi IPS LED, 15.6", 1920x1080 | HP Spectre X360 15-5ZV31AV AU Optronics AUO30EB, IPS, 15.6", 3840x2160 | MSI Prestige 15 A10SC Sharp LQ156D1JW42, IPS, 15.6", 3840x2160 | |
|---|---|---|---|---|---|---|
| Display | -3% | 3% | -39% | 3% | 25% | |
| Display P3 Coverage (%) | 66 | 66.6 1% | 66.5 1% | 38.79 -41% | 68.3 3% | 82 24% |
| sRGB Coverage (%) | 92.1 | 87.7 -5% | 98 6% | 58.3 -37% | 94.3 2% | 98.3 7% |
| AdobeRGB 1998 Coverage (%) | 66.5 | 64.1 -4% | 68.4 3% | 40.11 -40% | 68.4 3% | 96.2 45% |
| Response Times | 4% | -8% | 18% | -25% | -30% | |
| Response Time Grey 50% / Grey 80% * (ms) | 43.2 ? | 41.2 ? 5% | 52.8 ? -22% | 37.2 ? 14% | 56.8 ? -31% | 60 ? -39% |
| Response Time Black / White * (ms) | 34.4 ? | 33.2 ? 3% | 32 ? 7% | 27.2 ? 21% | 40.8 ? -19% | 41.2 ? -20% |
| PWM Frequency (Hz) | 26040 ? | 1020 ? | 26040 ? | |||
| Screen | -32% | 21% | -42% | -5% | 4% | |
| Brightness middle (cd/m²) | 289.4 | 312.6 8% | 588 103% | 276 -5% | 284.6 -2% | 464.5 61% |
| Brightness (cd/m²) | 273 | 290 6% | 555 103% | 262 -4% | 285 4% | 451 65% |
| Brightness Distribution (%) | 82 | 85 4% | 89 9% | 88 7% | 85 4% | 92 12% |
| Black Level * (cd/m²) | 0.27 | 0.31 -15% | 0.4 -48% | 0.23 15% | 0.25 7% | 0.5 -85% |
| Contrast (:1) | 1072 | 1008 -6% | 1470 37% | 1200 12% | 1138 6% | 929 -13% |
| Colorchecker dE 2000 * | 2.32 | 5.78 -149% | 2.5 -8% | 5.6 -141% | 3.52 -52% | 3.36 -45% |
| Colorchecker dE 2000 max. * | 5.76 | 8.86 -54% | 6.3 -9% | 16.4 -185% | 5.56 3% | 7.06 -23% |
| Colorchecker dE 2000 calibrated * | 2.49 | 3.78 -52% | 0.6 76% | 4.7 -89% | 3 -20% | 3.42 -37% |
| Greyscale dE 2000 * | 3 | 5.4 -80% | 4.5 -50% | 3 -0% | 3.2 -7% | 1.3 57% |
| Gamma | 2.22 99% | 2.21 100% | 2.2 100% | 2.18 101% | 2.28 96% | 2.14 103% |
| CCT | 6867 95% | 7864 83% | 6836 95% | 7075 92% | 7070 92% | 6596 99% |
| Color Space (Percent of AdobeRGB 1998) (%) | 59.8 | 57.1 -5% | 63.2 6% | 36.9 -38% | 61.1 2% | 84.8 42% |
| Color Space (Percent of sRGB) (%) | 92 | 87.4 -5% | 98 7% | 58.1 -37% | 93.8 2% | 98.3 7% |
| Teljes átlag (program / beállítások) | -10% /
-22% | 5% /
14% | -21% /
-34% | -9% /
-6% | -0% /
4% |
* ... a kisebb jobb
Megjelenítési válaszidők
| ↔ Válaszidő Fekete-fehér | ||
|---|---|---|
| 34.4 ms ... emelkedés és süllyedés ↘ kombinálva | ↗ 20.4 ms emelkedés | 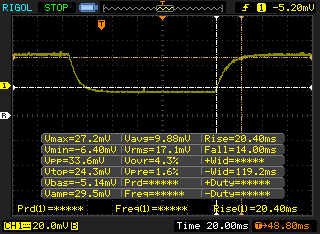 |
| ↘ 14 ms ősz | ||
| A képernyő lassú reakciósebességet mutat tesztjeinkben, és nem lesz kielégítő a játékosok számára. Összehasonlításképpen, az összes tesztelt eszköz 0.1 (minimum) és 240 (maximum) ms között mozog. » 92 % of all devices are better. Ez azt jelenti, hogy a mért válaszidő rosszabb, mint az összes vizsgált eszköz átlaga (19.9 ms). | ||
| ↔ Válaszidő 50% szürke és 80% szürke között | ||
| 43.2 ms ... emelkedés és süllyedés ↘ kombinálva | ↗ 22.8 ms emelkedés | 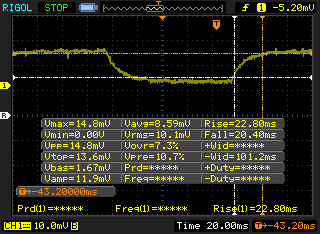 |
| ↘ 20.4 ms ősz | ||
| A képernyő lassú reakciósebességet mutat tesztjeinkben, és nem lesz kielégítő a játékosok számára. Összehasonlításképpen, az összes tesztelt eszköz 0.165 (minimum) és 636 (maximum) ms között mozog. » 72 % of all devices are better. Ez azt jelenti, hogy a mért válaszidő rosszabb, mint az összes vizsgált eszköz átlaga (31.1 ms). | ||
Képernyő villogása / PWM (impulzusszélesség-moduláció)
| Képernyő villogása / PWM észlelve | 26040 Hz | ≤ 13 % fényerő beállítása | 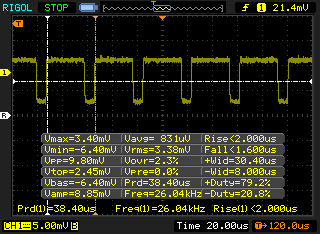 |
A kijelző háttérvilágítása 26040 Hz-en villog (a legrosszabb esetben, pl. PWM használatával) Villódzás észlelve a 13 % vagy annál kisebb fényerő-beállításnál. E fényerő-beállítás felett nem lehet villogás vagy PWM. A 26040 Hz frekvenciája meglehetősen magas, így a legtöbb PWM-re érzékeny felhasználó nem észlel semmilyen villogást. Összehasonlításképpen: az összes tesztelt eszköz 52 %-a nem használja a PWM-et a kijelző elsötétítésére. Ha PWM-et észleltek, akkor átlagosan 7801 (minimum: 5 - maximum: 343500) Hz-t mértek. | |||
| Cinebench R20 | |
| CPU (Single Core) | |
| MSI Modern 15 A10RB | |
| Dell Latitude 5500 | |
| Dell XPS 13 7390 2-in-1 Core i7 | |
| Dell XPS 13 7390 Core i7-10710U | |
| Lenovo IdeaPad S740-15IRH | |
| MSI PS63 Modern 8SC | |
| Átlagos Intel Core i7-10510U (362 - 497, n=37) | |
| MSI Modern 14 A10RB-459US | |
| Dynabook Portege A30-E-174 | |
| Walmart Motile M142 | |
| Microsoft Surface Laptop 3 15 Ryzen 5 3580U | |
| MSI Alpha 15 A3DDK-034 | |
| Dell Latitude 13 3390 | |
| Dell Inspiron 15 5000 5585 | |
| CPU (Multi Core) | |
| Lenovo IdeaPad S740-15IRH | |
| Dell XPS 13 7390 Core i7-10710U | |
| Dell XPS 13 7390 2-in-1 Core i7 | |
| MSI Modern 15 A10RB | |
| MSI Alpha 15 A3DDK-034 | |
| Microsoft Surface Laptop 3 15 Ryzen 5 3580U | |
| Dell Latitude 5500 | |
| MSI PS63 Modern 8SC | |
| Dell Inspiron 15 5000 5585 | |
| Átlagos Intel Core i7-10510U (1015 - 1897, n=38) | |
| Walmart Motile M142 | |
| MSI Modern 14 A10RB-459US | |
| Dynabook Portege A30-E-174 | |
| Dell Latitude 13 3390 | |
| Cinebench R15 | |
| CPU Single 64Bit | |
| MSI Modern 15 A10RB | |
| Dell Latitude 5500 | |
| Lenovo IdeaPad S740-15IRH | |
| MSI PS63 Modern 8SC | |
| Dell XPS 13 7390 Core i7-10710U | |
| Átlagos Intel Core i7-10510U (113 - 202, n=42) | |
| Dell XPS 13 7390 2-in-1 Core i7 | |
| MSI Modern 14 A10RB-459US | |
| Dynabook Portege A30-E-174 | |
| Walmart Motile M142 | |
| Dell Latitude 13 3390 | |
| MSI Alpha 15 A3DDK-034 | |
| Microsoft Surface Laptop 3 15 Ryzen 5 3580U | |
| Dell Inspiron 15 5000 5585 | |
| CPU Multi 64Bit | |
| Lenovo IdeaPad S740-15IRH | |
| Dell XPS 13 7390 Core i7-10710U | |
| Dell XPS 13 7390 2-in-1 Core i7 | |
| MSI Modern 15 A10RB | |
| MSI Alpha 15 A3DDK-034 | |
| MSI PS63 Modern 8SC | |
| Microsoft Surface Laptop 3 15 Ryzen 5 3580U | |
| Dell Latitude 5500 | |
| Dell Inspiron 15 5000 5585 | |
| Átlagos Intel Core i7-10510U (482 - 856, n=45) | |
| Walmart Motile M142 | |
| MSI Modern 14 A10RB-459US | |
| Dell Latitude 13 3390 | |
| Dynabook Portege A30-E-174 | |
| Cinebench R11.5 | |
| CPU Single 64Bit | |
| Dell XPS 13 7390 Core i7-10710U | |
| Dell XPS 13 7390 2-in-1 Core i7 | |
| Átlagos Intel Core i7-10510U (n=1) | |
| Microsoft Surface Laptop 3 15 Ryzen 5 3580U | |
| Dell Latitude 13 3390 | |
| Dell Inspiron 15 5000 5585 | |
| CPU Multi 64Bit | |
| Dell XPS 13 7390 Core i7-10710U | |
| Dell XPS 13 7390 2-in-1 Core i7 | |
| Microsoft Surface Laptop 3 15 Ryzen 5 3580U | |
| Dell Inspiron 15 5000 5585 | |
| Átlagos Intel Core i7-10510U (n=1) | |
| Dell Latitude 13 3390 | |
| Cinebench R10 | |
| Rendering Multiple CPUs 32Bit | |
| Dell XPS 13 7390 Core i7-10710U | |
| Dell XPS 13 7390 2-in-1 Core i7 | |
| Átlagos Intel Core i7-10510U (6763 - 26265, n=3) | |
| MSI Alpha 15 A3DDK-034 | |
| Microsoft Surface Laptop 3 15 Ryzen 5 3580U | |
| Dynabook Portege A30-E-174 | |
| Rendering Single 32Bit | |
| Dell XPS 13 7390 Core i7-10710U | |
| Dell XPS 13 7390 2-in-1 Core i7 | |
| Átlagos Intel Core i7-10510U (5740 - 7748, n=3) | |
| Dynabook Portege A30-E-174 | |
| MSI Alpha 15 A3DDK-034 | |
| Microsoft Surface Laptop 3 15 Ryzen 5 3580U | |
| wPrime 2.10 - 1024m | |
| Microsoft Surface Laptop 3 15 Ryzen 5 3580U | |
| Dell XPS 13 7390 2-in-1 Core i7 | |
| Dell XPS 13 7390 Core i7-10710U | |
* ... a kisebb jobb
| PCMark 8 | |
| Home Score Accelerated v2 | |
| Dell XPS 15 7590 i5 iGPU FHD | |
| MSI Modern 15 A10RB | |
| Lenovo ThinkPad T590-20N4002VGE | |
| Asus ZenBook 15 UX534FT-DB77 | |
| Átlagos Intel Core i7-10510U, NVIDIA GeForce MX250 (3214 - 3958, n=8) | |
| MSI Prestige 15 A10SC | |
| HP Spectre X360 15-5ZV31AV | |
| Work Score Accelerated v2 | |
| MSI Modern 15 A10RB | |
| Lenovo ThinkPad T590-20N4002VGE | |
| Asus ZenBook 15 UX534FT-DB77 | |
| Dell XPS 15 7590 i5 iGPU FHD | |
| Átlagos Intel Core i7-10510U, NVIDIA GeForce MX250 (4599 - 5443, n=8) | |
| HP Spectre X360 15-5ZV31AV | |
| MSI Prestige 15 A10SC | |
| PCMark 8 Home Score Accelerated v2 | 3958 pontok | |
| PCMark 8 Work Score Accelerated v2 | 5443 pontok | |
| PCMark 10 Score | 5409 pontok | |
Segítség | ||
| MSI Modern 15 A10RB WDC PC SN730 SDBPNTY-512G | Asus ZenBook 15 UX534FT-DB77 Samsung SSD PM981 MZVLB1T0HALR | Lenovo ThinkPad T590-20N4002VGE Toshiba XG6 KXG60ZNV512G | HP Spectre X360 15-5ZV31AV Intel SSD 660p 2TB SSDPEKNW020T8 | MSI Prestige 15 A10SC Samsung SSD PM981 MZVLB1T0HALR | |
|---|---|---|---|---|---|
| AS SSD | 0% | 21% | -21% | 11% | |
| Seq Read (MB/s) | 2084 | 1887 -9% | 2551 22% | 1220 -41% | 1274 -39% |
| Seq Write (MB/s) | 2442 | 1432 -41% | 2376 -3% | 1152 -53% | 1395 -43% |
| 4K Read (MB/s) | 47.52 | 52.3 10% | 52.7 11% | 52.3 10% | 50.3 6% |
| 4K Write (MB/s) | 135.8 | 146 8% | 153 13% | 146.6 8% | 119.8 -12% |
| 4K-64 Read (MB/s) | 1043 | 969 -7% | 1406 35% | 652 -37% | 1599 53% |
| 4K-64 Write (MB/s) | 955 | 1375 44% | 1439 51% | 847 -11% | 1455 52% |
| Access Time Read * (ms) | 0.062 | 0.034 45% | 0.067 -8% | 0.077 -24% | 0.044 29% |
| Access Time Write * (ms) | 0.076 | 0.075 1% | 0.027 64% | 0.106 -39% | 0.092 -21% |
| Score Read (Points) | 1299 | 1210 -7% | 1714 32% | 826 -36% | 1777 37% |
| Score Write (Points) | 1335 | 1664 25% | 1829 37% | 1109 -17% | 1714 28% |
| Score Total (Points) | 3326 | 3483 5% | 4418 33% | 2371 -29% | 4411 33% |
| Copy ISO MB/s (MB/s) | 1926 | 1375 -29% | 2625 36% | 2070 7% | 2830 47% |
| Copy Program MB/s (MB/s) | 714 | 468 -34% | 495.9 -31% | 571 -20% | 609 -15% |
| Copy Game MB/s (MB/s) | 1425 | 1287 -10% | 1384 -3% | 1219 -14% | 1424 0% |
| CrystalDiskMark 5.2 / 6 | -14% | -22% | -27% | -33% | |
| Write 4K (MB/s) | 208.4 | 141.6 -32% | 126.2 -39% | 151.5 -27% | 150.8 -28% |
| Read 4K (MB/s) | 51 | 45.28 -11% | 48.93 -4% | 59.3 16% | 47.3 -7% |
| Write Seq (MB/s) | 2687 | 1975 -26% | 1345 -50% | 1424 -47% | 981 -63% |
| Read Seq (MB/s) | 2168 | 2272 5% | 1373 -37% | 1609 -26% | 976 -55% |
| Write 4K Q32T1 (MB/s) | 489.2 | 458.6 -6% | 383.8 -22% | 393.6 -20% | 442.7 -10% |
| Read 4K Q32T1 (MB/s) | 600 | 391.4 -35% | 434.8 -28% | 369.4 -38% | 499.7 -17% |
| Write Seq Q32T1 (MB/s) | 2699 | 2393 -11% | 2966 10% | 1946 -28% | 1706 -37% |
| Read Seq Q32T1 (MB/s) | 3374 | 3464 3% | 3230 -4% | 1934 -43% | 1758 -48% |
| Write 4K Q8T8 (MB/s) | 960 | ||||
| Read 4K Q8T8 (MB/s) | 1441 | ||||
| Teljes átlag (program / beállítások) | -7% /
-5% | -1% /
5% | -24% /
-23% | -11% /
-5% |
* ... a kisebb jobb

| 3DMark 11 Performance | 5302 pontok | |
| 3DMark Cloud Gate Standard Score | 17955 pontok | |
| 3DMark Fire Strike Score | 3562 pontok | |
| 3DMark Time Spy Score | 1308 pontok | |
Segítség | ||
| Shadow of the Tomb Raider | |
| 1280x720 Lowest Preset | |
| Lenovo IdeaPad S740-15IRH | |
| MSI GL72 7QF | |
| MSI Modern 15 A10RB | |
| Átlagos NVIDIA GeForce MX250 (24 - 56, n=8) | |
| Xiaomi Mi Notebook Pro i7 | |
| Dell Inspiron 15 5000 5585 | |
| Microsoft Surface Laptop 3 15 i7-1065G7 | |
| Microsoft Surface Laptop 3 15 Ryzen 5 3580U | |
| 1920x1080 Medium Preset | |
| Lenovo IdeaPad S740-15IRH | |
| MSI GL72 7QF | |
| MSI Modern 15 A10RB | |
| Xiaomi Mi Notebook Pro i7 | |
| Átlagos NVIDIA GeForce MX250 (7 - 19, n=8) | |
| Dell Inspiron 15 5000 5585 | |
| Microsoft Surface Laptop 3 15 Ryzen 5 3580U | |
| 1920x1080 High Preset AA:SM | |
| Asus TUF FX705GM | |
| Lenovo IdeaPad S740-15IRH | |
| MSI GL72 7QF | |
| Dell Inspiron 15 5000 5585 | |
| MSI Modern 15 A10RB | |
| Átlagos NVIDIA GeForce MX250 (12 - 15, n=6) | |
| Xiaomi Mi Notebook Pro i7 | |
| 1920x1080 Highest Preset AA:T | |
| Asus TUF FX705GM | |
| Lenovo IdeaPad S740-15IRH | |
| MSI GL72 7QF | |
| MSI Modern 15 A10RB | |
| Átlagos NVIDIA GeForce MX250 (9 - 10, n=5) | |
| Xiaomi Mi Notebook Pro i7 | |
| BioShock Infinite | |
| 1280x720 Very Low Preset | |
| Lenovo IdeaPad S740-15IRH | |
| MSI Modern 15 A10RB | |
| Átlagos NVIDIA GeForce MX250 (133.9 - 212, n=14) | |
| Dell Inspiron 15 5000 5585 | |
| Microsoft Surface Laptop 3 15 Ryzen 5 3580U | |
| Microsoft Surface Laptop 3 15 i7-1065G7 | |
| 1366x768 Medium Preset | |
| Lenovo IdeaPad S740-15IRH | |
| MSI Modern 15 A10RB | |
| Átlagos NVIDIA GeForce MX250 (98.4 - 117.5, n=14) | |
| Microsoft Surface Laptop 3 15 i7-1065G7 | |
| 1366x768 High Preset | |
| Lenovo IdeaPad S740-15IRH | |
| MSI Modern 15 A10RB | |
| Átlagos NVIDIA GeForce MX250 (84 - 100.5, n=14) | |
| Microsoft Surface Laptop 3 15 i7-1065G7 | |
| 1920x1080 Ultra Preset, DX11 (DDOF) | |
| Lenovo IdeaPad S740-15IRH | |
| MSI Modern 15 A10RB | |
| Átlagos NVIDIA GeForce MX250 (32.3 - 38.1, n=14) | |
| Microsoft Surface Laptop 3 15 i7-1065G7 | |
| Dell Inspiron 15 5000 5585 | |
| Microsoft Surface Laptop 3 15 Ryzen 5 3580U | |
| Rocket League | |
| 1280x720 Performance | |
| MSI Modern 15 A10RB | |
| Átlagos NVIDIA GeForce MX250 (175.4 - 182.9, n=3) | |
| Dell Inspiron 15 5000 5585 | |
| Microsoft Surface Laptop 3 15 Ryzen 5 3580U | |
| Microsoft Surface Laptop 3 15 i7-1065G7 | |
| 1920x1080 Performance | |
| MSI Modern 15 A10RB | |
| Átlagos NVIDIA GeForce MX250 (n=1) | |
| Dell Inspiron 15 5000 5585 | |
| Microsoft Surface Laptop 3 15 i7-1065G7 | |
| Microsoft Surface Laptop 3 15 Ryzen 5 3580U | |
| 1920x1080 Quality AA:Medium FX | |
| Átlagos NVIDIA GeForce MX250 (77 - 109, n=3) | |
| MSI Modern 15 A10RB | |
| Microsoft Surface Laptop 3 15 i7-1065G7 | |
| Dell Inspiron 15 5000 5585 | |
| Microsoft Surface Laptop 3 15 Ryzen 5 3580U | |
| 1920x1080 High Quality AA:High FX | |
| Átlagos NVIDIA GeForce MX250 (52.1 - 80, n=3) | |
| MSI Modern 15 A10RB | |
| Microsoft Surface Laptop 3 15 i7-1065G7 | |
| Dell Inspiron 15 5000 5585 | |
| Microsoft Surface Laptop 3 15 Ryzen 5 3580U | |
| alacsony | közepes | magas | ultra | |
|---|---|---|---|---|
| BioShock Infinite (2013) | 212.3 | 114.5 | 98.1 | 37.8 |
| The Witcher 3 (2015) | 70 | 40 | 23.1 | 12 |
| Rocket League (2017) | 182.9 | 91.2 | 60.8 | |
| Shadow of the Tomb Raider (2018) | 55 | 19 | 13 | 10 |
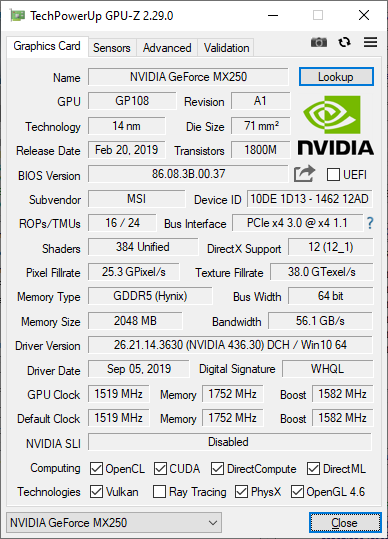
| MSI Modern 15 A10RB GeForce MX250, i7-10510U, WDC PC SN730 SDBPNTY-512G | Asus ZenBook 15 UX534FT-DB77 GeForce GTX 1650 Max-Q, i7-8565U, Samsung SSD PM981 MZVLB1T0HALR | Dell XPS 15 7590 i5 iGPU FHD UHD Graphics 630, i5-9300H, Toshiba XG6 KXG60ZNV512G | Lenovo ThinkPad T590-20N4002VGE GeForce MX250, i7-8565U, Toshiba XG6 KXG60ZNV512G | HP Spectre X360 15-5ZV31AV GeForce MX250, i7-10510U, Intel SSD 660p 2TB SSDPEKNW020T8 | MSI Prestige 15 A10SC GeForce GTX 1650 Max-Q, i7-10710U, Samsung SSD PM981 MZVLB1T0HALR | |
|---|---|---|---|---|---|---|
| Noise | 8% | 9% | 9% | 6% | 5% | |
| off / környezet * (dB) | 28.3 | 28.4 -0% | 29.3 -4% | 29.4 -4% | 30.1 -6% | 29.3 -4% |
| Idle Minimum * (dB) | 32 | 28.4 11% | 29.3 8% | 29.3 8% | 30.1 6% | 30.1 6% |
| Idle Average * (dB) | 32 | 28.4 11% | 29.3 8% | 29.3 8% | 30.1 6% | 30.2 6% |
| Idle Maximum * (dB) | 32 | 28.4 11% | 29.8 7% | 31.8 1% | 30.1 6% | 30.2 6% |
| Load Average * (dB) | 34.5 | 33.9 2% | 32.4 6% | 33.5 3% | 30.1 13% | 31.5 9% |
| Witcher 3 ultra * (dB) | 39.5 | 39.8 -1% | 33.5 15% | 39.7 -1% | 37 6% | |
| Load Maximum * (dB) | 50.9 | 40.2 21% | 37.2 27% | 35.8 30% | 42 17% | 47 8% |
* ... a kisebb jobb
Zajszint
| Üresjárat |
| 32 / 32 / 32 dB(A) |
| Terhelés |
| 34.5 / 50.9 dB(A) |
 | ||
30 dB csendes 40 dB(A) hallható 50 dB(A) hangos |
||
min: | ||
(-) A felső oldalon a maximális hőmérséklet 54.2 °C / 130 F, összehasonlítva a 34.3 °C / 94 F átlagával , 21.2 és 62.5 °C között a Office osztálynál.
(-) Az alsó maximum 59.4 °C / 139 F-ig melegszik fel, összehasonlítva a 36.8 °C / 98 F átlagával
(+) Üresjáratban a felső oldal átlagos hőmérséklete 26.2 °C / 79 F, összehasonlítva a 29.5 °C / ### eszközátlaggal class_avg_f### F.
(-) A The Witcher 3 játék során a felső oldal átlaghőmérséklete 39.3 °C / 103 F, összehasonlítva a 29.5 °C / ## eszközátlaggal #class_avg_f### F.
(+) A csuklótámasz és az érintőpad eléri a bőr maximális hőmérsékletét (33 °C / 91.4 F), ezért nem forrók.
(-) A hasonló eszközök csuklótámasz területének átlagos hőmérséklete 27.5 °C / 81.5 F volt (-5.5 °C / -9.9 F).
MSI Modern 15 A10RB hangelemzés
(+) | a hangszórók viszonylag hangosan tudnak játszani (82.1 dB)
Basszus 100 - 315 Hz
(-) | szinte nincs basszus – átlagosan 19.1%-kal alacsonyabb a mediánnál
(±) | a basszus linearitása átlagos (12.2% delta az előző frekvenciához)
Közepes 400-2000 Hz
(+) | kiegyensúlyozott középpontok – csak 4.4% választja el a mediántól
(±) | a középpontok linearitása átlagos (10.2% delta az előző gyakorisághoz)
Maximum 2-16 kHz
(+) | kiegyensúlyozott csúcsok – csak 1.3% választja el a mediántól
(+) | a csúcsok lineárisak (6.8% delta az előző frekvenciához képest)
Összességében 100 - 16.000 Hz
(±) | az általános hang linearitása átlagos (20.6% eltérés a mediánhoz képest)
Ugyanazon osztályhoz képest
» 47%Ebben az osztályban az összes tesztelt eszköz %-a jobb volt, 9% hasonló, 44%-kal rosszabb
» A legjobb delta értéke 7%, az átlag 21%, a legrosszabb 53% volt
Az összes tesztelt eszközzel összehasonlítva
» 55% az összes tesztelt eszköz jobb volt, 8% hasonló, 37%-kal rosszabb
» A legjobb delta értéke 4%, az átlag 24%, a legrosszabb 134% volt
Apple MacBook 12 (Early 2016) 1.1 GHz hangelemzés
(+) | a hangszórók viszonylag hangosan tudnak játszani (83.6 dB)
Basszus 100 - 315 Hz
(±) | csökkentett basszus – átlagosan 11.3%-kal alacsonyabb, mint a medián
(±) | a basszus linearitása átlagos (14.2% delta az előző frekvenciához)
Közepes 400-2000 Hz
(+) | kiegyensúlyozott középpontok – csak 2.4% választja el a mediántól
(+) | a középpontok lineárisak (5.5% delta az előző frekvenciához)
Maximum 2-16 kHz
(+) | kiegyensúlyozott csúcsok – csak 2% választja el a mediántól
(+) | a csúcsok lineárisak (4.5% delta az előző frekvenciához képest)
Összességében 100 - 16.000 Hz
(+) | általános hangzás lineáris (10.2% eltérés a mediánhoz képest)
Ugyanazon osztályhoz képest
» 7%Ebben az osztályban az összes tesztelt eszköz %-a jobb volt, 2% hasonló, 91%-kal rosszabb
» A legjobb delta értéke 5%, az átlag 18%, a legrosszabb 53% volt
Az összes tesztelt eszközzel összehasonlítva
» 5% az összes tesztelt eszköz jobb volt, 1% hasonló, 94%-kal rosszabb
» A legjobb delta értéke 4%, az átlag 24%, a legrosszabb 134% volt
| Kikapcsolt állapot / Készenlét | |
| Üresjárat | |
| Terhelés |
|
Kulcs:
min: | |
| MSI Modern 15 A10RB i7-10510U, GeForce MX250, WDC PC SN730 SDBPNTY-512G, IPS, 1920x1080, 15.6" | Asus ZenBook 15 UX534FT-DB77 i7-8565U, GeForce GTX 1650 Max-Q, Samsung SSD PM981 MZVLB1T0HALR, IPS, 1920x1080, 15.6" | Dell XPS 15 7590 i5 iGPU FHD i5-9300H, UHD Graphics 630, Toshiba XG6 KXG60ZNV512G, IPS, 1920x1080, 15.6" | Lenovo ThinkPad T590-20N4002VGE i7-8565U, GeForce MX250, Toshiba XG6 KXG60ZNV512G, aSi IPS LED, 1920x1080, 15.6" | HP Spectre X360 15-5ZV31AV i7-10510U, GeForce MX250, Intel SSD 660p 2TB SSDPEKNW020T8, IPS, 3840x2160, 15.6" | MSI Prestige 15 A10SC i7-10710U, GeForce GTX 1650 Max-Q, Samsung SSD PM981 MZVLB1T0HALR, IPS, 3840x2160, 15.6" | |
|---|---|---|---|---|---|---|
| Power Consumption | -11% | 27% | 24% | 20% | -9% | |
| Idle Minimum * (Watt) | 6.6 | 5 24% | 3.79 43% | 4.1 38% | 5.2 21% | 6.1 8% |
| Idle Average * (Watt) | 9.9 | 13.2 -33% | 6.9 30% | 8.3 16% | 8.5 14% | 13.2 -33% |
| Idle Maximum * (Watt) | 14.7 | 24 -63% | 9.2 37% | 11.8 20% | 8.7 41% | 19.2 -31% |
| Load Average * (Watt) | 82.9 | 70 16% | 62 25% | 61.6 26% | 65.6 21% | 75 10% |
| Witcher 3 ultra * (Watt) | 59.4 | 63.3 -7% | 54.4 8% | 56.5 5% | 74 -25% | |
| Load Maximum * (Watt) | 109.3 | 114 -4% | 108 1% | 69.4 37% | 92.4 15% | 89.7 18% |
* ... a kisebb jobb
| MSI Modern 15 A10RB i7-10510U, GeForce MX250, 52 Wh | Asus ZenBook 15 UX534FT-DB77 i7-8565U, GeForce GTX 1650 Max-Q, 71 Wh | Dell XPS 15 7590 i5 iGPU FHD i5-9300H, UHD Graphics 630, 97 Wh | Lenovo ThinkPad T590-20N4002VGE i7-8565U, GeForce MX250, 57 Wh | HP Spectre X360 15-5ZV31AV i7-10510U, GeForce MX250, 84 Wh | MSI Prestige 15 A10SC i7-10710U, GeForce GTX 1650 Max-Q, 82 Wh | |
|---|---|---|---|---|---|---|
| Akkumulátor üzemidő | 47% | 59% | 84% | 61% | 22% | |
| Reader / Idle (h) | 15.4 | 21.5 40% | 22.6 47% | 19.1 24% | ||
| WiFi v1.3 (h) | 6.5 | 8.4 29% | 14.1 117% | 10.5 62% | 10.8 66% | 7.6 17% |
| Load (h) | 1.7 | 2.9 71% | 1.7 0% | 3.5 106% | 2.9 71% | 2.1 24% |
Pro
Kontra
Érdemes a Modern 15-re figyelni a népszerűbb Dell XPS 15, HP Spectre x360 15, Microsoft Surface Laptop 3 15 vagy a MacBook Pro laptopok helyett, mivel könnyebb, olcsóbb, és egyszerűbben bővíthető a RAM-ja és a tárhelye, mivel ezek az MSI rendszer erősségei. A Core i7-10510U CPU jól illik a GeForce MX250 GPU-hoz, és mindkettő átlagon felüli sebességen fut a Modern 15-ben.
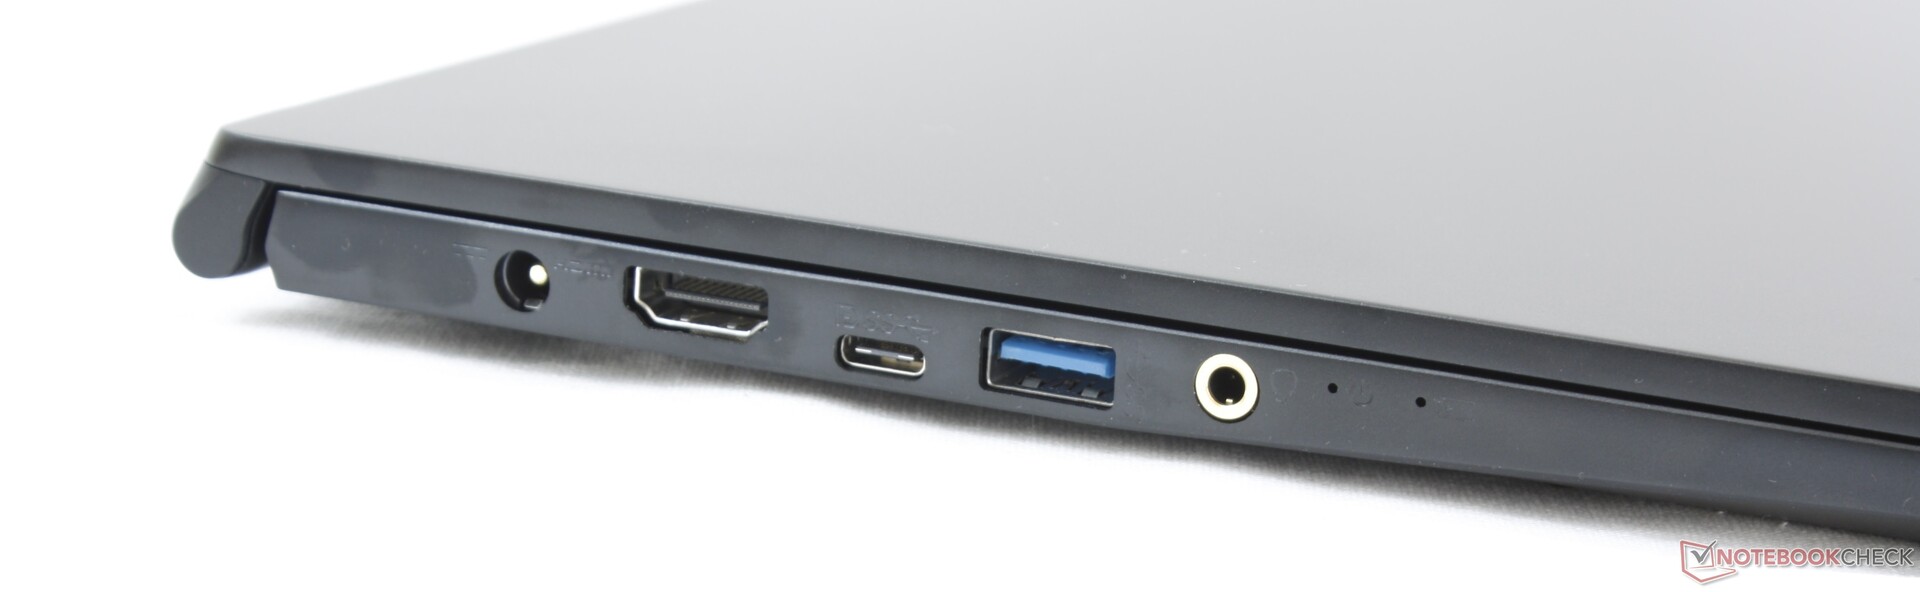
A fő hátrányok, amiket érdemes szem előtt tartani, azok a lassúbb CPU teljesítmény, az erősebb Core H Ultrabookokhoz képest, a lágyabb billentyűzet gombok, valamint a Thunderbolt 3 támogatás hiánya. A váz hajlamosabb a hajlásra és sérülésre, míg a kijelző nem annyira világos, mint a magasabb kategóriájú alternatívák. Végül is a Modern széria elvileg a megfizethető középkategóriás laptopoknak a helye.
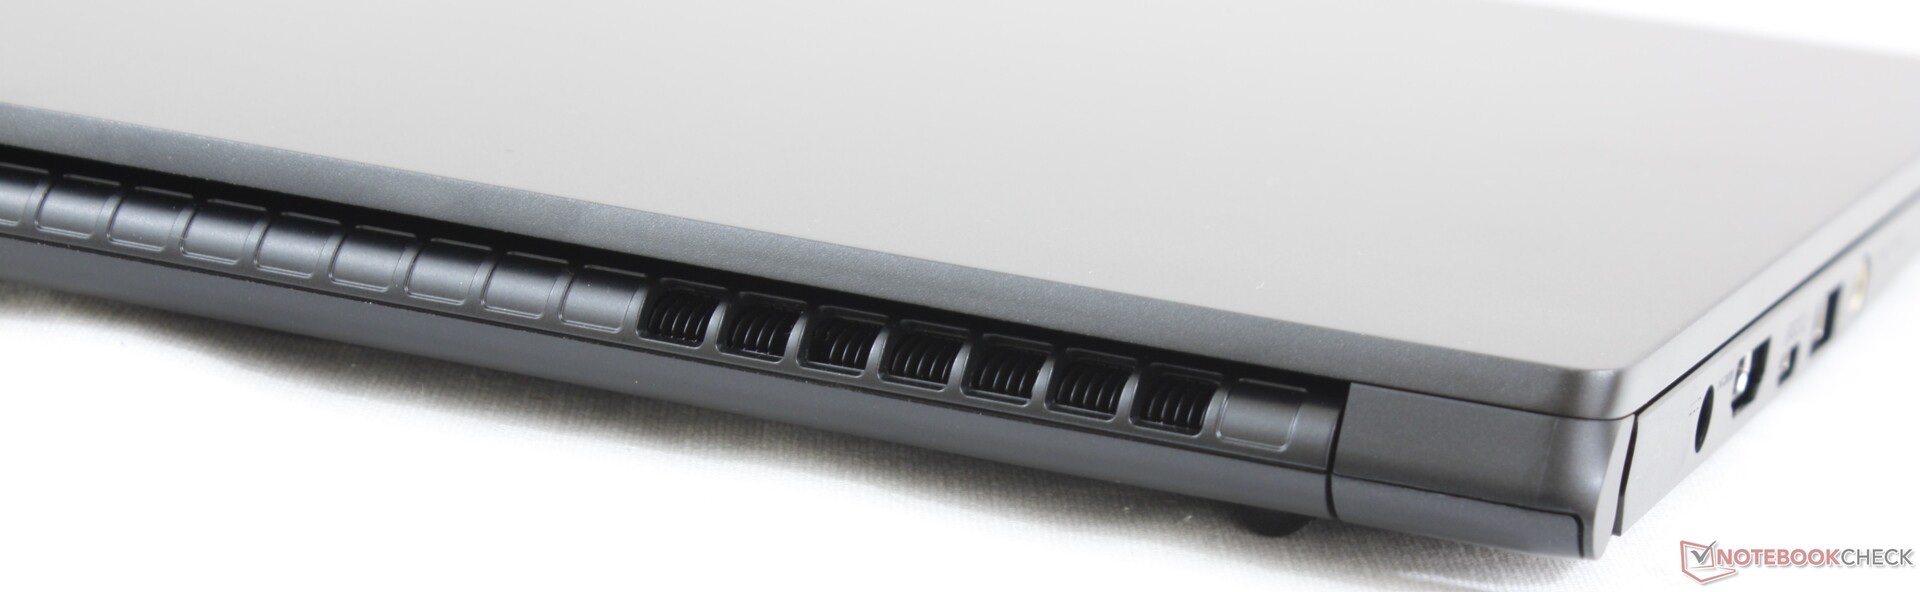
Egy zavaró aspektus, amire szerintünk érdemes jobban odafigyelni, az a ventilátor viselkedése. Semmi ok nincs arra, hogy a rendszerventilátorok üresjáratban is működjenek a Csendes vagy Takarékos üzemmódban. A Core U sorozatú CPU-val rendelkező laptopok többsége csendesebb, amikor annyira kevés energiát igénylő helyzetekben működnek.
Akit nem zavarnak a hátrányok, az a Modern 15-ben egy erőteljes laptopot fog kapni a kis mérethez és a könnyű súlyhoz képest. Aki nagyobb teljesítményt szeretne, vagy valamit, ami strapabíróbb, annak viszont érdemes megfontolni a Prestige 15-öt vagy az „igazi” üzleti laptopokat, mint a HP EliteBook, ThinkPad X1 Carbon, vagy a Dell Latitude 7000 sorozat.
MSI Modern 15 A10RB
- 05/20/2021 v7 (old)
Allen Ngo
Price comparison

