Apple MacBook Pro 16 2019 Laptop rövid értékelés: Egy meggyőző, Core i9-9880H és Radeon Pro 5500M által hajtott multimédiás laptop
Értékelés | Dátum | Modell | Súly | Magasság | Méret | Felbontás | Legjobb ár |
|---|---|---|---|---|---|---|---|
| 89.7 % v7 (old) | 01/2020 | Apple MacBook Pro 16 2019 i9 5500M i9-9880H, Radeon Pro 5500M | 2 kg | 16.2 mm | 16.00" | 3072x1920 | |
| 87.1 % v7 (old) | Lenovo ThinkPad X1 Extreme 2019 20QV000WGE i7-9750H, GeForce GTX 1650 Mobile | 1.7 kg | 18.7 mm | 15.60" | 3840x2160 | ||
| 87.8 % v7 (old) | 09/2019 | Dell XPS 15 7590 9980HK GTX 1650 i9-9980HK, GeForce GTX 1650 Mobile | 2 kg | 17 mm | 15.60" | 3840x2160 | |
| 89.4 % v7 (old) | 03/2020 | Apple MacBook Pro 15 2019 i9 Vega 20 i9-9980HK, Radeon Pro Vega 20 | 1.8 kg | 15.5 mm | 15.40" | 2880x1800 | |
| 87.8 % v6 (old) | 07/2018 | Asus ZenBook Pro 15 UX580GE i9-8950HK, GeForce GTX 1050 Ti Mobile | 1.9 kg | 18.9 mm | 15.60" | 3840x2160 | |
| 85 % v7 (old) | 08/2019 | MSI P65 Creator 9SF-657 i9-9880H, GeForce RTX 2070 Max-Q | 1.9 kg | 18 mm | 15.60" | 3840x2160 |


| Networking | |
| iperf3 transmit AX12 | |
| Lenovo ThinkPad X1 Extreme 2019 20QV000WGE | |
| Dell XPS 15 7590 9980HK GTX 1650 | |
| Apple MacBook Pro 16 2019 i9 5500M | |
| iperf3 receive AX12 | |
| Lenovo ThinkPad X1 Extreme 2019 20QV000WGE | |
| Apple MacBook Pro 16 2019 i9 5500M | |
| Dell XPS 15 7590 9980HK GTX 1650 | |
| |||||||||||||||||||||||||
Fényerő megoszlás: 86 %
Centrumban: 519 cd/m²
Kontraszt: 1331:1 (Fekete: 0.39 cd/m²)
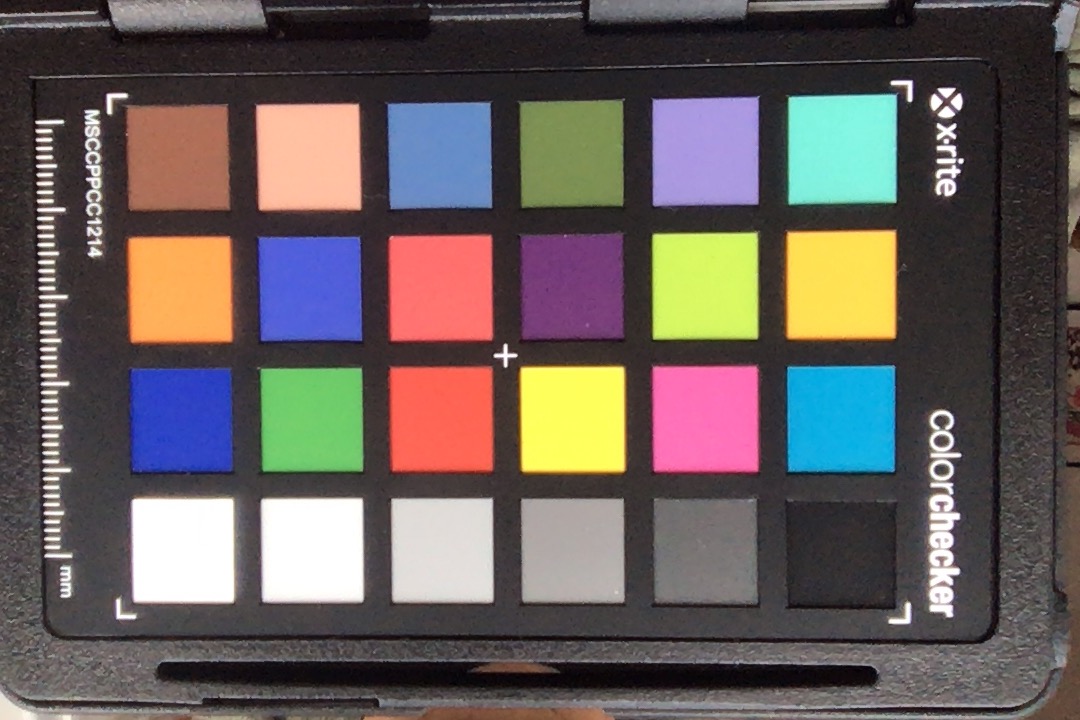
ΔE ColorChecker Calman: 2.28 | ∀{0.5-29.43 Ø4.73}
calibrated: 0.86
ΔE Greyscale Calman: 0.9 | ∀{0.09-98 Ø4.97}
100% sRGB (Calman 2D)
78% AdobeRGB 1998 (Argyll 1.6.3 3D)
Gamma: 2145
CCT: 6572 K
| Apple MacBook Pro 16 2019 i9 5500M APPA044, IPS, 3072x1920, 16" | Dell XPS 15 7590 9980HK GTX 1650 Samsung 156WR04, SDCA029, OLED, 3840x2160, 15.6" | Lenovo ThinkPad X1 Extreme 2019 20QV000WGE NE156QUM-N66, IPS, 3840x2160, 15.6" | Apple MacBook Pro 15 2018 (2.6 GHz, 560X) APPA040, IPS, 2880x1800, 15.4" | Asus ZenBook Pro 15 UX580GE AU Optronics B156ZAN03.1, IPS, 3840x2160, 15.6" | MSI P65 Creator 9SF-657 AU Optronics AUO41EB, IPS, 3840x2160, 15.6" | |
|---|---|---|---|---|---|---|
| Display | ||||||
| Display P3 Coverage (%) | 88.1 | 82 | 98.7 | 85.9 | 84.4 | |
| sRGB Coverage (%) | 99.6 | 99.1 | 99.9 | 100 | 100 | |
| AdobeRGB 1998 Coverage (%) | 91.8 | 96.9 | 86.6 | 99.1 | 98.5 | |
| Response Times | 95% | 12% | 15% | 26% | 7% | |
| Response Time Grey 50% / Grey 80% * (ms) | 52.4 ? | 2.3 ? 96% | 46.4 ? 11% | 43.2 ? 18% | 44 ? 16% | 51 ? 3% |
| Response Time Black / White * (ms) | 34.9 ? | 2.4 ? 93% | 30.4 ? 13% | 31.2 ? 11% | 22.8 ? 35% | 31 ? 11% |
| PWM Frequency (Hz) | 131700 | 59.5 ? | 117000 ? | |||
| Screen | -68% | -85% | 9% | -69% | -66% | |
| Brightness middle (cd/m²) | 519 | 421.2 -19% | 464 -11% | 520 0% | 357.6 -31% | 445 -14% |
| Brightness (cd/m²) | 477 | 417 -13% | 448 -6% | 492 3% | 350 -27% | 462 -3% |
| Brightness Distribution (%) | 86 | 94 9% | 90 5% | 88 2% | 85 -1% | 83 -3% |
| Black Level * (cd/m²) | 0.39 | 0.36 8% | 0.39 -0% | 0.35 10% | 0.5 -28% | |
| Contrast (:1) | 1331 | 1289 -3% | 1333 0% | 1022 -23% | 890 -33% | |
| Colorchecker dE 2000 * | 2.28 | 6.06 -166% | 4.2 -84% | 1.2 47% | 4.12 -81% | 4.75 -108% |
| Colorchecker dE 2000 max. * | 6.54 | 11.89 -82% | 11.4 -74% | 2.3 65% | 9.91 -52% | 7.79 -19% |
| Colorchecker dE 2000 calibrated * | 0.86 | 0.8 7% | 4.23 -392% | |||
| Greyscale dE 2000 * | 0.9 | 2.8 -211% | 7.2 -700% | 1.3 -44% | 1.8 -100% | 4.49 -399% |
| Gamma | 2145 0% | 2.15 102% | 2.17 101% | 2.18 101% | 2.17 101% | 2.49 88% |
| CCT | 6572 99% | 6235 104% | 6345 102% | 6738 96% | 6613 98% | 7374 88% |
| Color Space (Percent of AdobeRGB 1998) (%) | 78 | 81 4% | 85.2 9% | 87.5 12% | 87 12% | |
| Color Space (Percent of sRGB) (%) | 99.6 | 99 | 100 | 100 | ||
| Teljes átlag (program / beállítások) | 14% /
-32% | -37% /
-69% | 12% /
10% | -22% /
-53% | -30% /
-53% |
* ... a kisebb jobb
Megjelenítési válaszidők
| ↔ Válaszidő Fekete-fehér | ||
|---|---|---|
| 34.9 ms ... emelkedés és süllyedés ↘ kombinálva | ↗ 17.8 ms emelkedés | 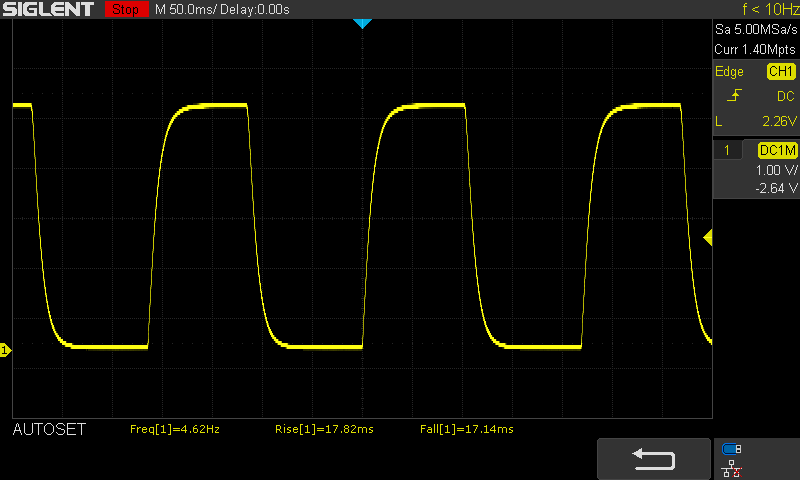 |
| ↘ 17.1 ms ősz | ||
| A képernyő lassú reakciósebességet mutat tesztjeinkben, és nem lesz kielégítő a játékosok számára. Összehasonlításképpen, az összes tesztelt eszköz 0.1 (minimum) és 240 (maximum) ms között mozog. » 92 % of all devices are better. Ez azt jelenti, hogy a mért válaszidő rosszabb, mint az összes vizsgált eszköz átlaga (19.9 ms). | ||
| ↔ Válaszidő 50% szürke és 80% szürke között | ||
| 52.4 ms ... emelkedés és süllyedés ↘ kombinálva | ↗ 23.9 ms emelkedés | 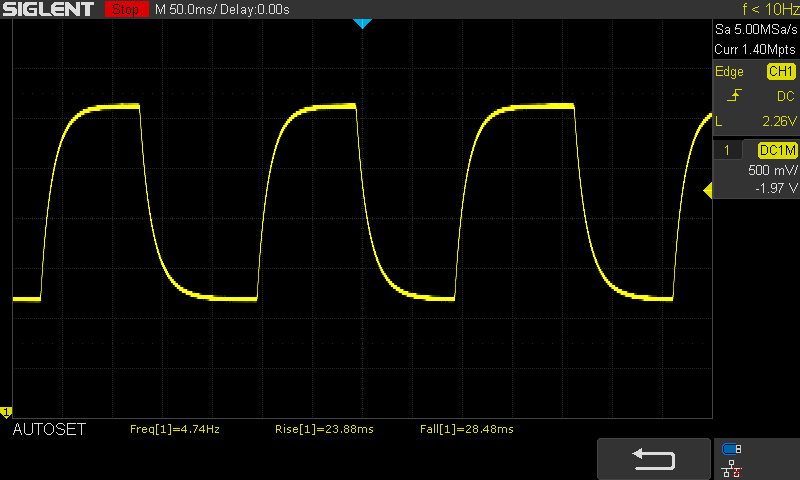 |
| ↘ 28.5 ms ősz | ||
| A képernyő lassú reakciósebességet mutat tesztjeinkben, és nem lesz kielégítő a játékosok számára. Összehasonlításképpen, az összes tesztelt eszköz 0.165 (minimum) és 636 (maximum) ms között mozog. » 89 % of all devices are better. Ez azt jelenti, hogy a mért válaszidő rosszabb, mint az összes vizsgált eszköz átlaga (31.1 ms). | ||
Képernyő villogása / PWM (impulzusszélesség-moduláció)
| Képernyő villogása / PWM észlelve | 131700 Hz | 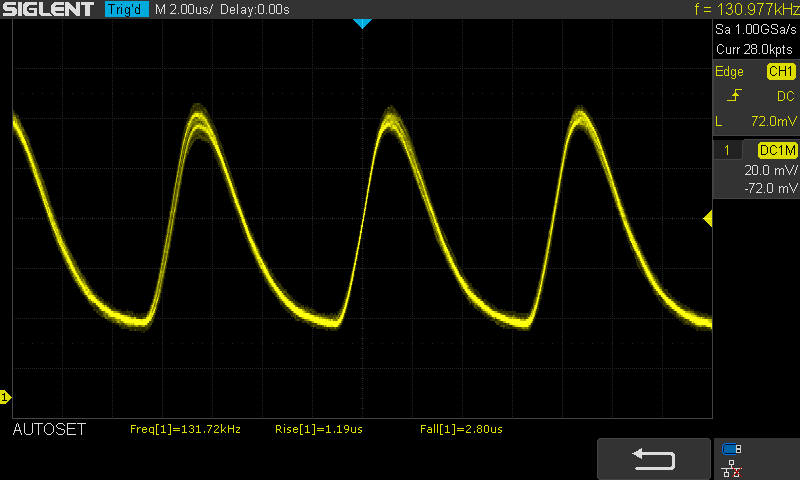 | |
A kijelző háttérvilágítása 131700 Hz-en villog (a legrosszabb esetben, pl. PWM használatával) . A 131700 Hz frekvenciája meglehetősen magas, így a legtöbb PWM-re érzékeny felhasználó nem észlel semmilyen villogást. Összehasonlításképpen: az összes tesztelt eszköz 52 %-a nem használja a PWM-et a kijelző elsötétítésére. Ha PWM-et észleltek, akkor átlagosan 7791 (minimum: 5 - maximum: 343500) Hz-t mértek. | |||

| PCMark 10 - Score | |
| Az osztály átlaga Multimedia (4325 - 10386, n=58, az elmúlt 2 évben) | |
| Átlagos Intel Core i9-9880H (5211 - 6558, n=8) | |
| Átlagos Intel Core i9-9980HK (4305 - 7082, n=14) | |
| Átlagos Intel Core i7-9750H (4395 - 6453, n=72) | |
| Apple MacBook Pro 16 2019 i9 5500M | |
| Dell XPS 15 7590 9980HK GTX 1650 | |
| Apple MacBook Pro 15 2019 i9 Vega 16 | |
| Dell Precision 5540 | |
| MSI P65 Creator 9SF-657 | |
| Lenovo ThinkPad X1 Extreme 2019 20QV000WGE | |
| Apple MacBook Pro 15 2019 i9 Vega 20 | |
| Microsoft Surface Laptop 3 15 Ryzen 5 3580U | |
| PCMark 8 | |
| Home Score Accelerated v2 | |
| Az osztály átlaga Multimedia (n=1az elmúlt 2 évben) | |
| Apple MacBook Pro 16 2019 i9 5500M | |
| Átlagos Intel Core i9-9880H (3505 - 4900, n=5) | |
| Átlagos Intel Core i7-9750H (3417 - 5661, n=56) | |
| Átlagos Intel Core i9-9980HK (3684 - 5731, n=11) | |
| Dell XPS 15 7590 9980HK GTX 1650 | |
| Dell Precision 5540 | |
| MSI P65 Creator 9SF-657 | |
| Lenovo ThinkPad X1 Extreme 2019 20QV000WGE | |
| Microsoft Surface Laptop 3 15 Ryzen 5 3580U | |
| Work Score Accelerated v2 | |
| Átlagos Intel Core i9-9880H (4482 - 6095, n=5) | |
| Átlagos Intel Core i7-9750H (4241 - 6593, n=57) | |
| Átlagos Intel Core i9-9980HK (4558 - 6524, n=11) | |
| Apple MacBook Pro 16 2019 i9 5500M | |
| Dell XPS 15 7590 9980HK GTX 1650 | |
| Dell Precision 5540 | |
| MSI P65 Creator 9SF-657 | |
| Microsoft Surface Laptop 3 15 Ryzen 5 3580U | |
| Lenovo ThinkPad X1 Extreme 2019 20QV000WGE | |
| PCMark 8 Home Score Accelerated v2 | 4900 pontok | |
| PCMark 8 Creative Score Accelerated v2 | 7359 pontok | |
| PCMark 8 Work Score Accelerated v2 | 4812 pontok | |
| PCMark 10 Score | 5500 pontok | |
Segítség | ||
| Apple MacBook Pro 16 2019 i9 5500M Apple SSD AP1024 7171 | Dell XPS 15 7590 9980HK GTX 1650 Toshiba XG6 KXG60ZNV1T02 | Microsoft Surface Laptop 3 15 Ryzen 5 3580U SK hynix BC501 HFM256GDGTNG | Dell Precision 5540 SK hynix PC400 512 GB | Gigabyte Aero 17 XA RP77 Intel SSD 760p SSDPEKKW512G8 | Eurocom Nightsky RX15 Samsung SSD 970 Pro 512GB | |
|---|---|---|---|---|---|---|
| CrystalDiskMark 5.2 / 6 | 30% | -11% | 8% | 52% | 58% | |
| Write 4K (MB/s) | 55.5 | 104.3 88% | 99 78% | 98 77% | 169.6 206% | 153 176% |
| Read 4K (MB/s) | 16.21 | 45.23 179% | 35.63 120% | 41.25 154% | 58 258% | 60.5 273% |
| Write Seq (MB/s) | 1959 | 1729 -12% | 706 -64% | 1295 -34% | 1516 -23% | 1938 -1% |
| Read Seq (MB/s) | 1763 | 1861 6% | 1044 -41% | 1441 -18% | 2362 34% | 1932 10% |
| Write 4K Q32T1 (MB/s) | 398.5 | 509 28% | 326.6 -18% | 429.2 8% | 481.8 21% | 482.5 21% |
| Read 4K Q32T1 (MB/s) | 648 | 388.5 -40% | 270 -58% | 400.1 -38% | 506 -22% | 594 -8% |
| Write Seq Q32T1 (MB/s) | 2727 | 2813 3% | 820 -70% | 1366 -50% | 1530 -44% | 2324 -15% |
| Read Seq Q32T1 (MB/s) | 3242 | 2906 -10% | 2028 -37% | 2201 -32% | 2645 -18% | 3539 9% |
| AS SSD | 34% | -26% | 8% | -17% | 21% | |
| Seq Read (MB/s) | 2531 | 1723 -32% | 1122 -56% | 1743 -31% | 1812 -28% | 2352 -7% |
| Seq Write (MB/s) | 2289 | 1386 -39% | 514 -78% | 930 -59% | 1512 -34% | 2184 -5% |
| 4K Read (MB/s) | 15.85 | 43.25 173% | 34.98 121% | 39.1 147% | 32.68 106% | 28.65 81% |
| 4K Write (MB/s) | 39.88 | 98.3 146% | 96.8 143% | 92.1 131% | 107.7 170% | 61.3 54% |
| 4K-64 Read (MB/s) | 1267 | 1078 -15% | 492 -61% | 956 -25% | 504 -60% | 1317 4% |
| 4K-64 Write (MB/s) | 1749 | 1456 -17% | 339.9 -81% | 863 -51% | 534 -69% | 2156 23% |
| Access Time Read * (ms) | 0.122 | 0.05 59% | 0.056 54% | 0.074 39% | 0.05 59% | 0.101 17% |
| Access Time Write * (ms) | 0.095 | 0.039 59% | 0.11 -16% | 0.053 44% | 0.227 -139% | 0.09 5% |
| Score Read (Points) | 1536 | 1294 -16% | 639 -58% | 1170 -24% | 718 -53% | 1581 3% |
| Score Write (Points) | 2018 | 1693 -16% | 488 -76% | 1048 -48% | 793 -61% | 2435 21% |
| Score Total (Points) | 4317 | 3638 -16% | 1434 -67% | 2781 -36% | 1871 -57% | 4813 11% |
| Copy ISO MB/s (MB/s) | 1995 | 3182 59% | 828 -58% | 946 -53% | 2705 36% | |
| Copy Program MB/s (MB/s) | 584 | 984 68% | 200.5 -66% | 414.3 -29% | 666 14% | |
| Copy Game MB/s (MB/s) | 1135 | 1824 61% | 387.4 -66% | 1263 11% | 1583 39% | |
| PCMark 8 | ||||||
| Storage Score v2 (Points) | 1818 | |||||
| Teljes átlag (program / beállítások) | 32% /
33% | -19% /
-21% | 8% /
8% | 18% /
8% | 40% /
35% |
* ... a kisebb jobb

| Performance rating - Percent | |
| Átlagos NVIDIA GeForce GTX 1660 Ti Mobile | |
| Asus ZenBook Pro Duo UX581GV | |
| MSI P65 Creator 9SF-657 -1! | |
| Az osztály átlaga Multimedia | |
| Átlagos NVIDIA GeForce GTX 1660 Ti Max-Q | |
| MSI Alpha 15 A3DDK | |
| unknown 5300M laptop -2! | |
| Apple MacBook Pro 16 2019 i9 5500M | |
| Átlagos NVIDIA GeForce GTX 1650 Mobile | |
| Dell XPS 15 7590 9980HK GTX 1650 | |
| Apple MacBook Pro 15 2019 i9 Vega 20 -1! | |
| Dell Precision 5540 | |
| Lenovo ThinkPad X1 Extreme 2019 20QV000WGE -1! | |
| Asus ZenBook Pro 15 UX580GE | |
| Microsoft Surface Laptop 3 15 Ryzen 5 3580U | |
| 3DMark 06 Standard Score | 34321 pontok | |
| 3DMark 11 Performance | 14097 pontok | |
| 3DMark Cloud Gate Standard Score | 30690 pontok | |
| 3DMark Fire Strike Score | 9196 pontok | |
| 3DMark Time Spy Score | 3629 pontok | |
Segítség | ||
SpecViewPerf 13
| Performance rating - Percent | |
| Lenovo ThinkPad P53-20QN000YGE | |
| Razer Blade 15 Studio Edition | |
| MSI WS75 9TL-636 | |
| Lenovo ThinkPad P73-20QR002DGE | |
| Apple MacBook Pro 16 2019 i9 5500M | |
| Dell Precision 5540 | |
| Acer Aspire Nitro 5 AN517-51-7887 | |
| Lenovo ThinkPad P1 2019-20QT000RGE | |
| Acer Nitro 5 -1! | |
| Deus Ex Mankind Divided - 1920x1080 Ultra Preset AA:2xMS AF:8x | |
| Átlagos NVIDIA GeForce GTX 1660 Ti Mobile (n=1) | |
| Apple MacBook Pro 16 2019 i9 5500M | |
| Átlagos NVIDIA GeForce GTX 1650 Mobile (n=1) | |
| Apple MacBook Pro 15 2018 (2.6 GHz, 560X) | |
| Rage 2 - 1920x1080 Ultra Preset (Resolution Scale Off) | |
| Átlagos NVIDIA GeForce GTX 1660 Ti Mobile (67.9 - 68.8, n=2) | |
| Átlagos NVIDIA GeForce GTX 1660 Ti Max-Q (58.2 - 64.8, n=2) | |
| MSI Alpha 15 A3DDK | |
| Átlagos NVIDIA GeForce GTX 1650 Mobile (45.1 - 60, n=3) | |
| Apple MacBook Pro 16 2019 i9 5500M | |
| Borderlands 3 - 1920x1080 Badass Overall Quality (DX11) | |
| Átlagos NVIDIA GeForce GTX 1660 Ti Mobile (46.6 - 48.6, n=3) | |
| Átlagos NVIDIA GeForce GTX 1660 Ti Max-Q (41.5 - 42.3, n=2) | |
| MSI Alpha 15 A3DDK | |
| Átlagos NVIDIA GeForce GTX 1650 Mobile (29 - 34.6, n=5) | |
| Apple MacBook Pro 16 2019 i9 5500M | |
| Apple MacBook Pro 15 2018 (2.6 GHz, 560X) | |
| Ghost Recon Breakpoint - 1920x1080 Ultra Preset AA:T | |
| Átlagos NVIDIA GeForce GTX 1660 Ti Mobile (51 - 55, n=2) | |
| Átlagos NVIDIA GeForce GTX 1660 Ti Max-Q (48 - 51, n=2) | |
| Apple MacBook Pro 16 2019 i9 5500M | |
| Átlagos NVIDIA GeForce GTX 1650 Mobile (30 - 37, n=2) | |
| MSI Alpha 15 A3DDK | |
| Apple MacBook Pro 15 2018 (2.6 GHz, 560X) | |
| alacsony | közepes | magas | ultra | QHD | 4K | |
|---|---|---|---|---|---|---|
| Counter-Strike: GO (2012) | 208 | 118 | 71.4 | |||
| GTA V (2015) | 168 | 91.4 | 47.6 | 34.5 | 32.3 | |
| The Witcher 3 (2015) | 68 | 38.8 | ||||
| Dota 2 Reborn (2015) | 137 | 125 | 111 | 107 | 53.9 | |
| World of Warships (2015) | 43.4 | |||||
| Rainbow Six Siege (2015) | 126 | 44.8 | ||||
| Overwatch (2016) | 98 | |||||
| Deus Ex Mankind Divided (2016) | 52 | 27.8 | 16.9 | |||
| Rocket League (2017) | 153 | 107 | 59 | |||
| Final Fantasy XV Benchmark (2018) | 48.4 | 20.4 | ||||
| World of Tanks enCore (2018) | 76 | 49.1 | 24.6 | |||
| Far Cry 5 (2018) | 55 | 40 | 20 | |||
| Shadow of the Tomb Raider (2018) | 120 | 58 | 54 | 46 | 30 | 13 |
| Battlefield V (2018) | 85 | 76 | 62 | 58.9 | 47 | 14.4 |
| Apex Legends (2019) | 63 | 43.5 | ||||
| Far Cry New Dawn (2019) | 86 | 67 | 64 | 57 | 41 | 21 |
| Metro Exodus (2019) | 92 | 47.1 | 34.3 | 28.6 | 22 | |
| Dirt Rally 2.0 (2019) | 90 | 50.2 | 35.8 | |||
| The Division 2 (2019) | 56 | 39 | ||||
| Anno 1800 (2019) | 67 | 44.6 | 21.7 | |||
| Rage 2 (2019) | 113 | 53.7 | 45.2 | 44.4 | 28.4 | |
| Total War: Three Kingdoms (2019) | 175 | 64.1 | 40.5 | 29.7 | 19 | 7 |
| F1 2019 (2019) | 174 | 105 | 97 | 65 | 49 | |
| Control (2019) | 139 | 41.5 | 29.2 | 18.1 | ||
| Borderlands 3 (2019) | 41.4 | 30.8 | 21.4 | 3.8 | ||
| FIFA 20 (2019) | 144 | 124 | 90 | |||
| Ghost Recon Breakpoint (2019) | 50 | 35 | ||||
| GRID 2019 (2019) | 46.3 | 36.6 | 23.2 | |||
| Call of Duty Modern Warfare 2019 (2019) | 34.7 | |||||
| Need for Speed Heat (2019) | 74 | 56.7 | 50.9 | 44.7 | 28 | 12.8 |
| Star Wars Jedi Fallen Order (2019) | 75 | 61 | 54.3 | 35 | 16.2 | |
| Red Dead Redemption 2 (2019) | 97.6 | 55.2 | 35.8 | 20.9 | 0 () | 0 () |
| Fall Guys (2020) | 59.4 | 59.4 | 38.1 | |||
| Hearthstone (2020) | 33.2 | 32 | 59.7 | 59.6 | ||
| Doom Eternal (2020) | 84.8 | 47.5 | 27.5 | 21.9 | 15.1 | |
| Gears Tactics (2020) | 60 | 47.6 | 30.7 | |||
| F1 2020 (2020) | 0 a játék nem indul el | |||||
| Flight Simulator 2020 (2020) | 47.4 | 28 | 19.2 | 12.2 | ||
| Mafia Definitive Edition (2020) | 52.5 | 37.5 | ||||
| Star Wars Squadrons (2020) | 95.6 | 69.7 | 26.4 | |||
| FIFA 21 (2020) | 151 | 115 | 70 | |||
| Cyberpunk 2077 1.0 (2020) | 54.8 | 29.9 | 23.5 | |||
| Hitman 3 (2021) | 157 | 81.3 | 66.3 | 62 | ||
| Outriders (2021) | 70.7 | 44.4 | 36 | 27.6 | ||
| Resident Evil Village (2021) | 81.7 | 38.9 | 40.6 | |||
| Far Cry 6 (2021) | 0 a játék nem indul el | |||||
| Riders Republic (2021) | 61 | 41 | 28 | |||
| Call of Duty Vanguard (2021) | 43.1 | 21.7 | ||||
| Forza Horizon 5 (2021) | 85 | 31 |
Zajszint
| Üresjárat |
| 29.9 / 29.9 / 29.9 dB(A) |
| Terhelés |
| 43 / 46.1 dB(A) |
 | ||
30 dB csendes 40 dB(A) hallható 50 dB(A) hangos |
||
min: | ||
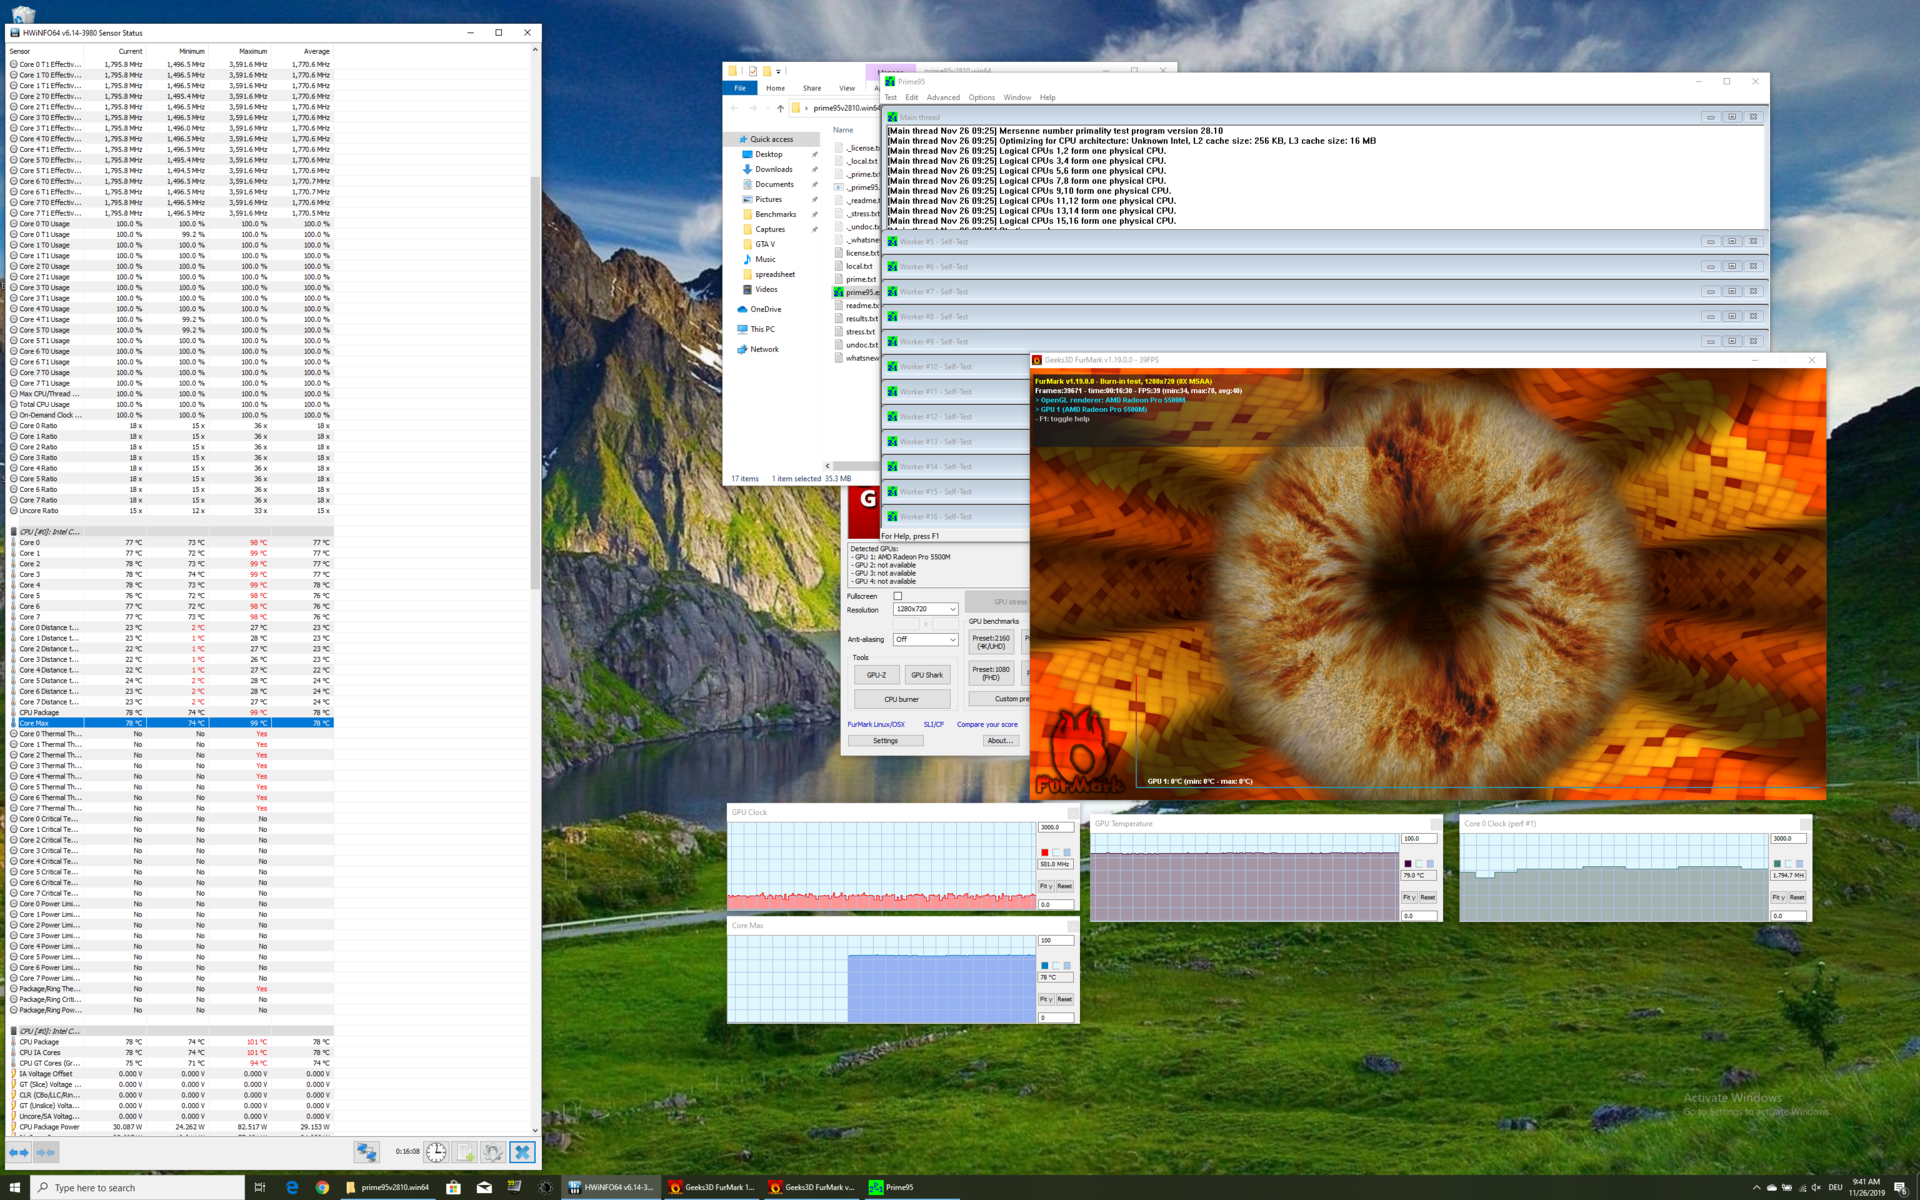
(±) A felső oldalon a maximális hőmérséklet 42 °C / 108 F, összehasonlítva a 36.8 °C / 98 F átlagával , 21 és 71 °C között a Multimedia osztálynál.
(+) Az alsó maximum 38 °C / 100 F-ig melegszik fel, összehasonlítva a 39.1 °C / 102 F átlagával
(+) Üresjáratban a felső oldal átlagos hőmérséklete 22.8 °C / 73 F, összehasonlítva a 31.3 °C / ### eszközátlaggal class_avg_f### F.
(+) A csuklótámasz és az érintőpad hűvösebb, mint a bőr hőmérséklete, maximum 27 °C / 80.6 F, ezért hűvös tapintású.
(±) A hasonló eszközök csuklótámasz területének átlagos hőmérséklete 28.7 °C / 83.7 F volt (+1.7 °C / 3.1 F).
Apple MacBook Pro 16 2019 i9 5500M hangelemzés
(+) | a hangszórók viszonylag hangosan tudnak játszani (82.3 dB)
Basszus 100 - 315 Hz
(+) | jó basszus – csak 2.3% választja el a mediántól
(+) | a basszus lineáris (5% delta az előző frekvenciához)
Közepes 400-2000 Hz
(+) | kiegyensúlyozott középpontok – csak 2.7% választja el a mediántól
(+) | a középpontok lineárisak (3.4% delta az előző frekvenciához)
Maximum 2-16 kHz
(+) | kiegyensúlyozott csúcsok – csak 2.1% választja el a mediántól
(+) | a csúcsok lineárisak (2.6% delta az előző frekvenciához képest)
Összességében 100 - 16.000 Hz
(+) | általános hangzás lineáris (6.9% eltérés a mediánhoz képest)
Ugyanazon osztályhoz képest
» 5%Ebben az osztályban az összes tesztelt eszköz %-a jobb volt, 1% hasonló, 94%-kal rosszabb
» A legjobb delta értéke 5%, az átlag 17%, a legrosszabb 45% volt
Az összes tesztelt eszközzel összehasonlítva
» 1% az összes tesztelt eszköz jobb volt, 0% hasonló, 99%-kal rosszabb
» A legjobb delta értéke 4%, az átlag 24%, a legrosszabb 134% volt
Dell XPS 15 7590 9980HK GTX 1650 hangelemzés
(+) | a hangszórók viszonylag hangosan tudnak játszani (88.4 dB)
Basszus 100 - 315 Hz
(-) | szinte nincs basszus – átlagosan 24.9%-kal alacsonyabb a mediánnál
(±) | a basszus linearitása átlagos (14.4% delta az előző frekvenciához)
Közepes 400-2000 Hz
(+) | kiegyensúlyozott középpontok – csak 2.8% választja el a mediántól
(±) | a középpontok linearitása átlagos (7.8% delta az előző gyakorisághoz)
Maximum 2-16 kHz
(+) | kiegyensúlyozott csúcsok – csak 1.9% választja el a mediántól
(+) | a csúcsok lineárisak (5.3% delta az előző frekvenciához képest)
Összességében 100 - 16.000 Hz
(±) | az általános hang linearitása átlagos (17.8% eltérés a mediánhoz képest)
Ugyanazon osztályhoz képest
» 52%Ebben az osztályban az összes tesztelt eszköz %-a jobb volt, 7% hasonló, 41%-kal rosszabb
» A legjobb delta értéke 5%, az átlag 17%, a legrosszabb 45% volt
Az összes tesztelt eszközzel összehasonlítva
» 36% az összes tesztelt eszköz jobb volt, 8% hasonló, 56%-kal rosszabb
» A legjobb delta értéke 4%, az átlag 24%, a legrosszabb 134% volt
Apple MacBook Pro 15 2018 (2.6 GHz, 560X) hangelemzés
(+) | a hangszórók viszonylag hangosan tudnak játszani (85 dB)
Basszus 100 - 315 Hz
(+) | jó basszus – csak 4.7% választja el a mediántól
(±) | a basszus linearitása átlagos (8.3% delta az előző frekvenciához)
Közepes 400-2000 Hz
(+) | kiegyensúlyozott középpontok – csak 1.8% választja el a mediántól
(+) | a középpontok lineárisak (3.5% delta az előző frekvenciához)
Maximum 2-16 kHz
(+) | kiegyensúlyozott csúcsok – csak 2.6% választja el a mediántól
(+) | a csúcsok lineárisak (5.7% delta az előző frekvenciához képest)
Összességében 100 - 16.000 Hz
(+) | általános hangzás lineáris (6.4% eltérés a mediánhoz képest)
Ugyanazon osztályhoz képest
» 4%Ebben az osztályban az összes tesztelt eszköz %-a jobb volt, 1% hasonló, 95%-kal rosszabb
» A legjobb delta értéke 5%, az átlag 17%, a legrosszabb 45% volt
Az összes tesztelt eszközzel összehasonlítva
» 1% az összes tesztelt eszköz jobb volt, 0% hasonló, 99%-kal rosszabb
» A legjobb delta értéke 4%, az átlag 24%, a legrosszabb 134% volt
| Kikapcsolt állapot / Készenlét | |
| Üresjárat | |
| Terhelés |
|
Kulcs:
min: | |
| Apple MacBook Pro 16 2019 i9 5500M i9-9880H, Radeon Pro 5500M, Apple SSD AP1024 7171, IPS, 3072x1920, 16" | Apple MacBook Pro 15 2018 (2.6 GHz, 560X) i7-8850H, Radeon Pro 560X, Apple SSD AP0512, IPS, 2880x1800, 15.4" | Dell XPS 15 7590 9980HK GTX 1650 i9-9980HK, GeForce GTX 1650 Mobile, Toshiba XG6 KXG60ZNV1T02, OLED, 3840x2160, 15.6" | MSI P65 Creator 9SF-657 i9-9880H, GeForce RTX 2070 Max-Q, 2x Samsung SSD PM981 MZVLB512HAJQ (RAID 0), IPS, 3840x2160, 15.6" | Lenovo ThinkPad X1 Extreme 2019 20QV000WGE i7-9750H, GeForce GTX 1650 Mobile, Samsung SSD PM981 MZVLB512HAJQ, IPS, 3840x2160, 15.6" | Az osztály átlaga Multimedia | |
|---|---|---|---|---|---|---|
| Power Consumption | 11% | -18% | -67% | -31% | 2% | |
| Idle Minimum * (Watt) | 3.7 | 3.4 8% | 6.2 -68% | 9.4 -154% | 8.5 -130% | 5.71 ? -54% |
| Idle Average * (Watt) | 12.1 | 11 9% | 9.6 21% | 17.4 -44% | 14.7 -21% | 10.1 ? 17% |
| Idle Maximum * (Watt) | 17 | 14.9 12% | 21.2 -25% | 19.6 -15% | 19.4 -14% | 12.4 ? 27% |
| Load Average * (Watt) | 91.5 | 78.9 14% | 104.3 -14% | 103 -13% | 89.6 2% | 65 ? 29% |
| Witcher 3 ultra * (Watt) | 103 | 91.7 11% | 96.1 7% | |||
| Load Maximum * (Watt) | 102.3 | 91.2 11% | 135.3 -32% | 216 -111% | 129.8 -27% | 112.2 ? -10% |
* ... a kisebb jobb
| Apple MacBook Pro 16 2019 i9 5500M i9-9880H, Radeon Pro 5500M, 99.8 Wh | Lenovo ThinkPad X1 Extreme 2019 20QV000WGE i7-9750H, GeForce GTX 1650 Mobile, 80 Wh | Dell XPS 15 7590 9980HK GTX 1650 i9-9980HK, GeForce GTX 1650 Mobile, 97 Wh | Asus ZenBook Pro 15 UX580GE i9-8950HK, GeForce GTX 1050 Ti Mobile, 71 Wh | MSI P65 Creator 9SF-657 i9-9880H, GeForce RTX 2070 Max-Q, 82 Wh | Apple MacBook Pro 15 2018 (2.6 GHz, 560X) i7-8850H, Radeon Pro 560X, 83 Wh | Az osztály átlaga Multimedia | |
|---|---|---|---|---|---|---|---|
| Akkumulátor üzemidő | -31% | 98% | -9% | -20% | 24% | 46% | |
| H.264 (h) | 9.7 | 4.7 -52% | 11.7 21% | 16.4 ? 69% | |||
| WiFi v1.3 (h) | 12 | 4.8 -60% | 7.8 -35% | 6.3 -47% | 6 -50% | 10.2 -15% | 12 ? 0% |
| Witcher 3 ultra (h) | 0.9 | 1.5 67% | |||||
| Load (h) | 1 | 1.2 20% | 3.3 230% | 1.3 30% | 1.1 10% | 1.675 ? 68% |
Pro
Kontra
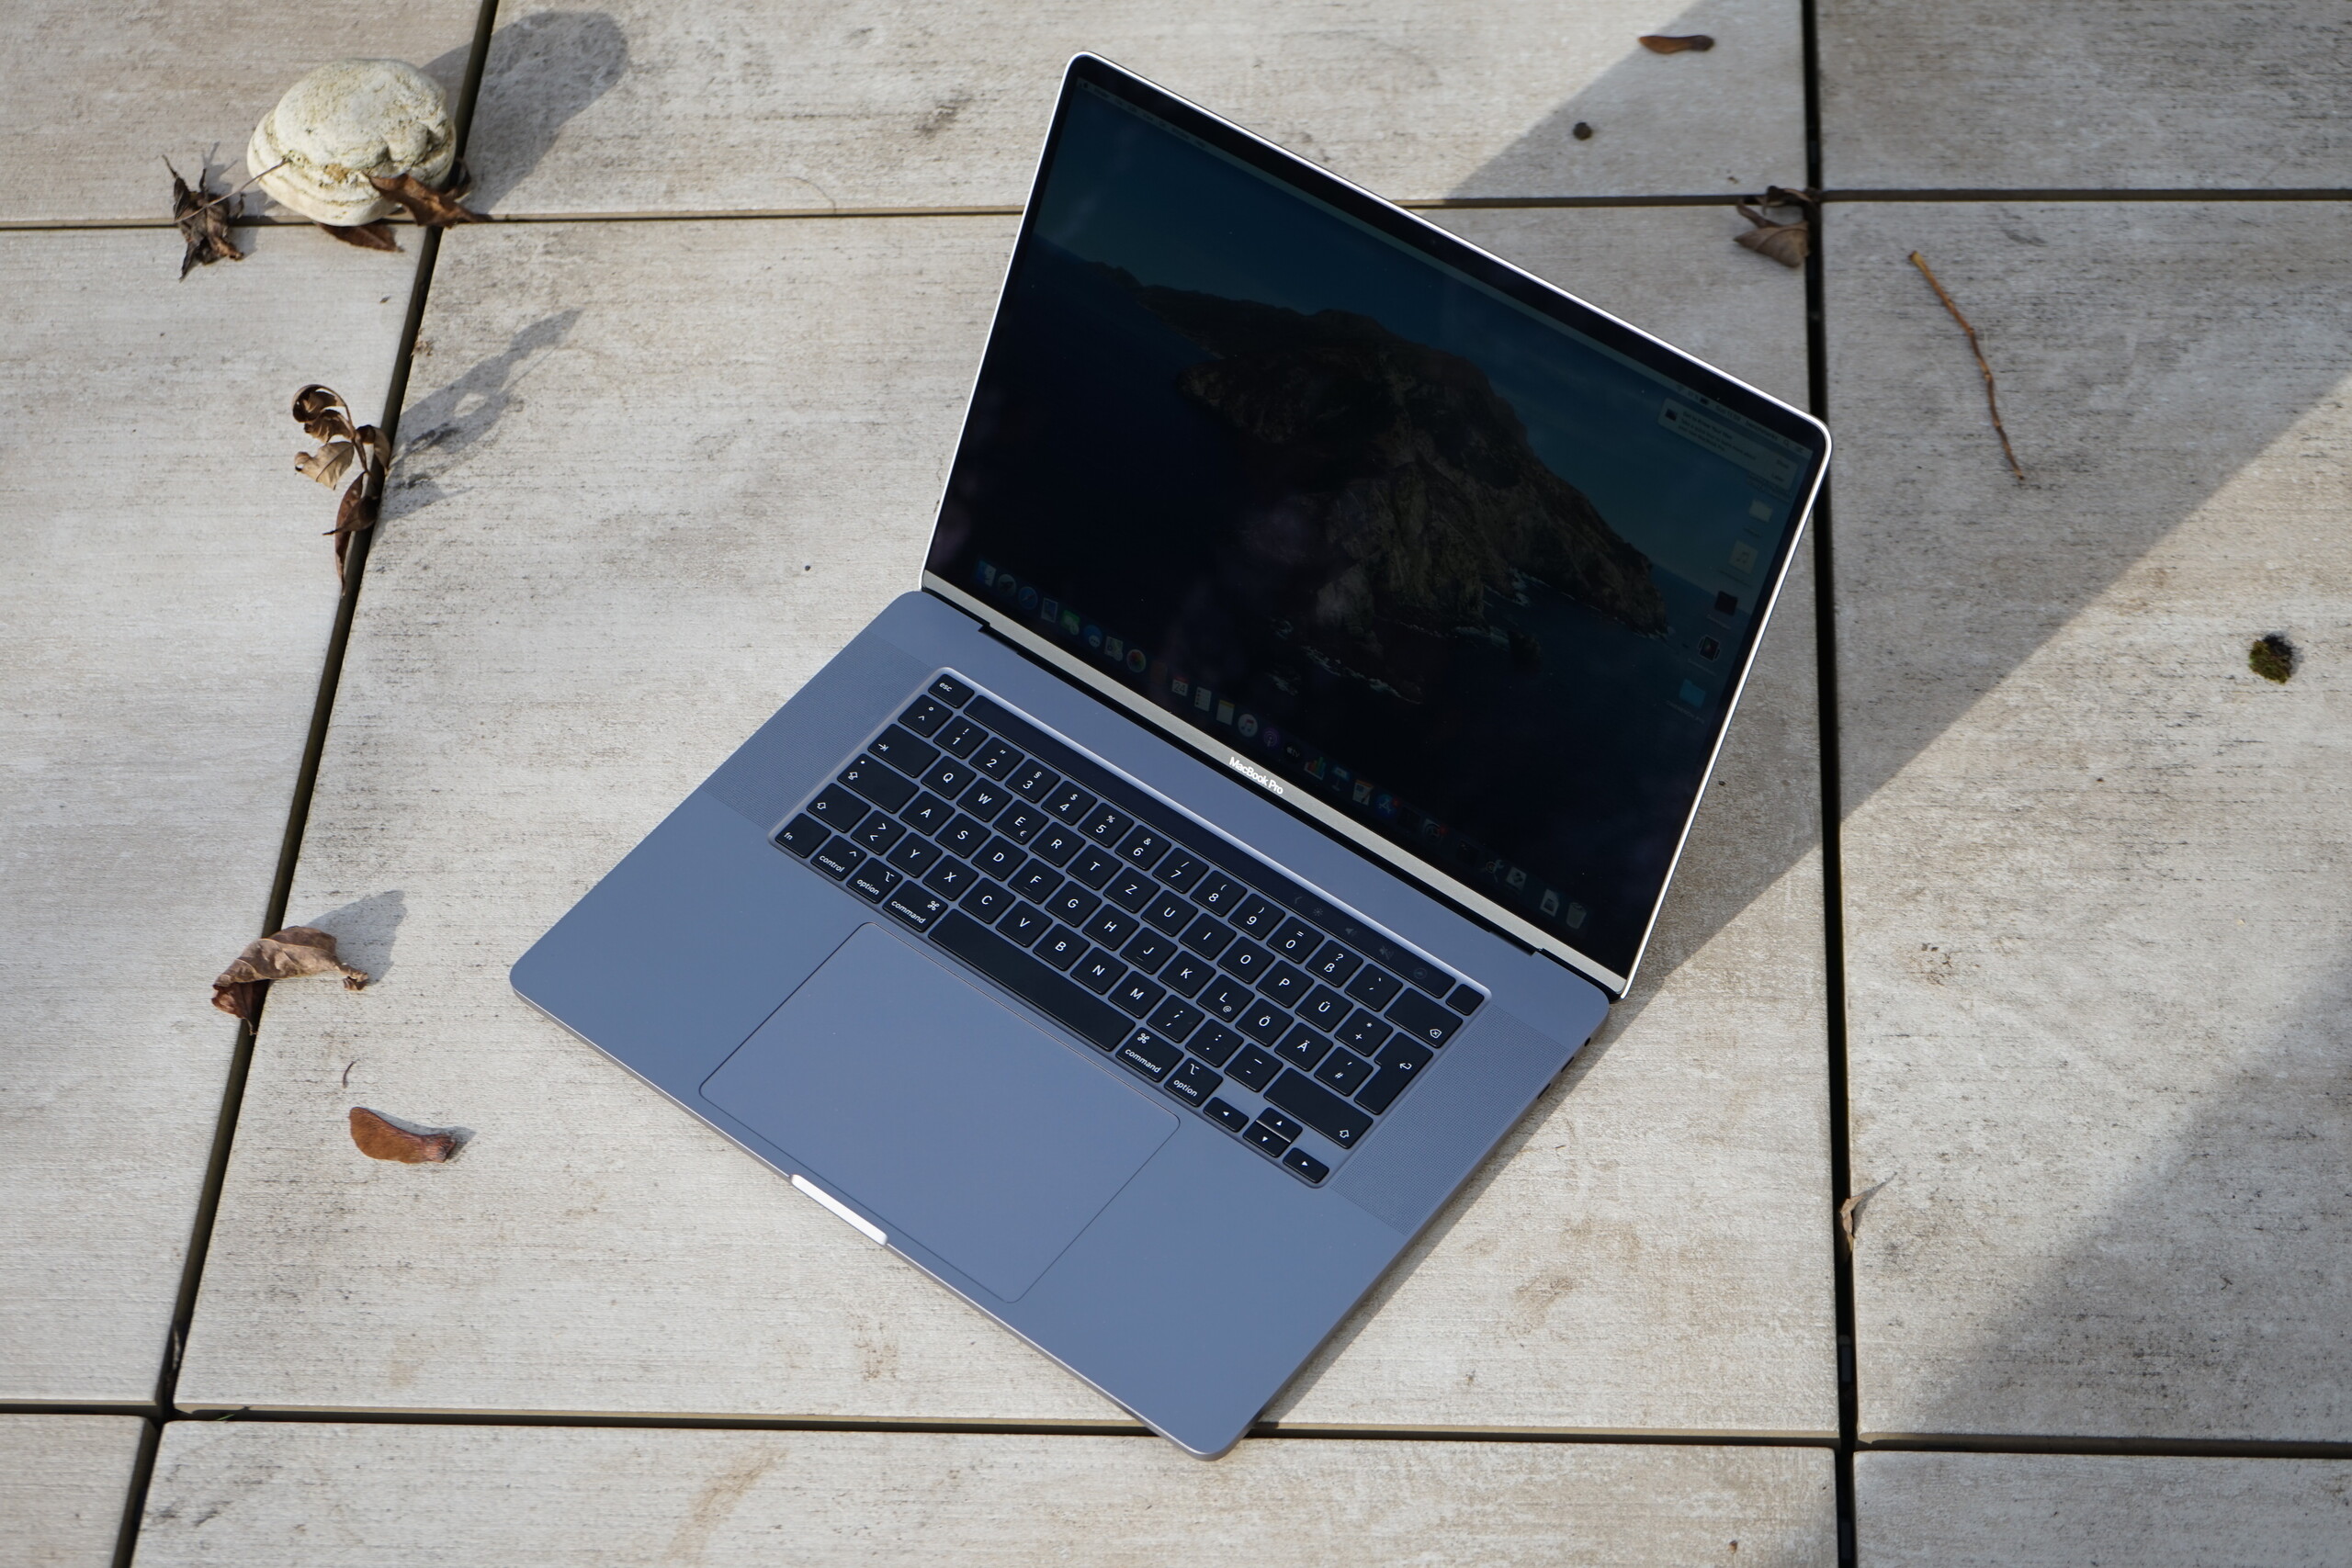
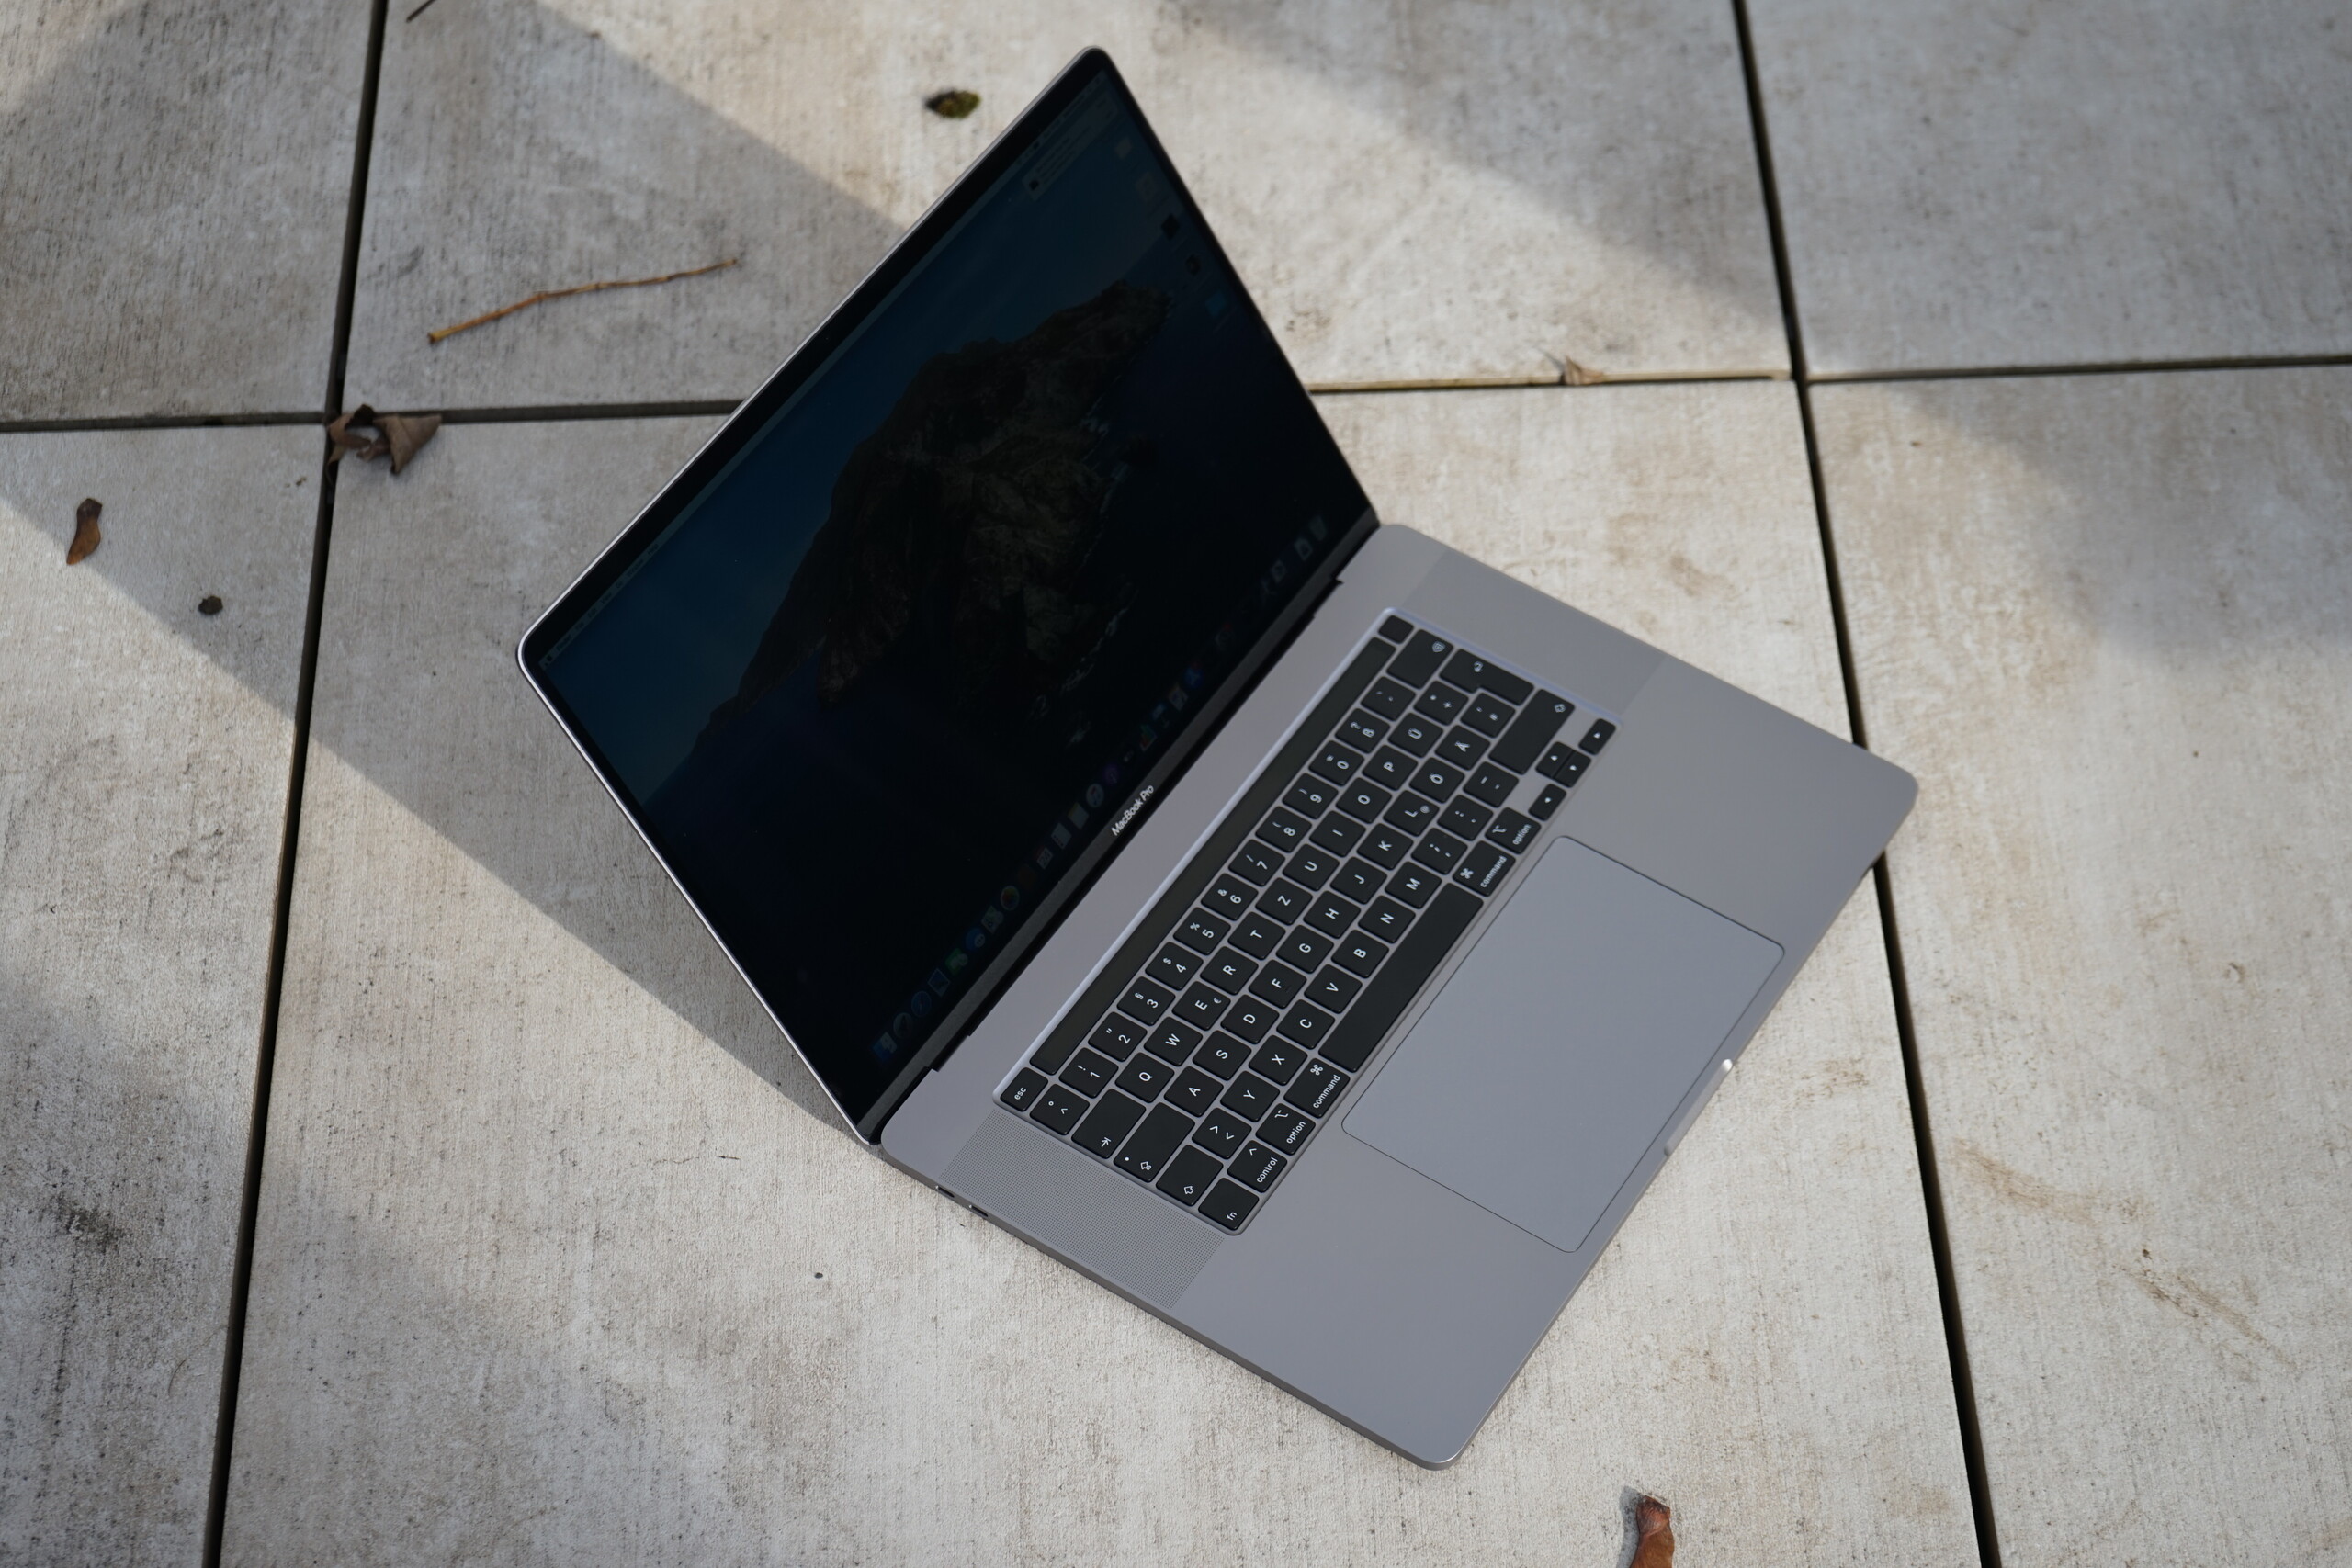
Összegzés - Egy fantasztikus, de drága multimédiás laptop

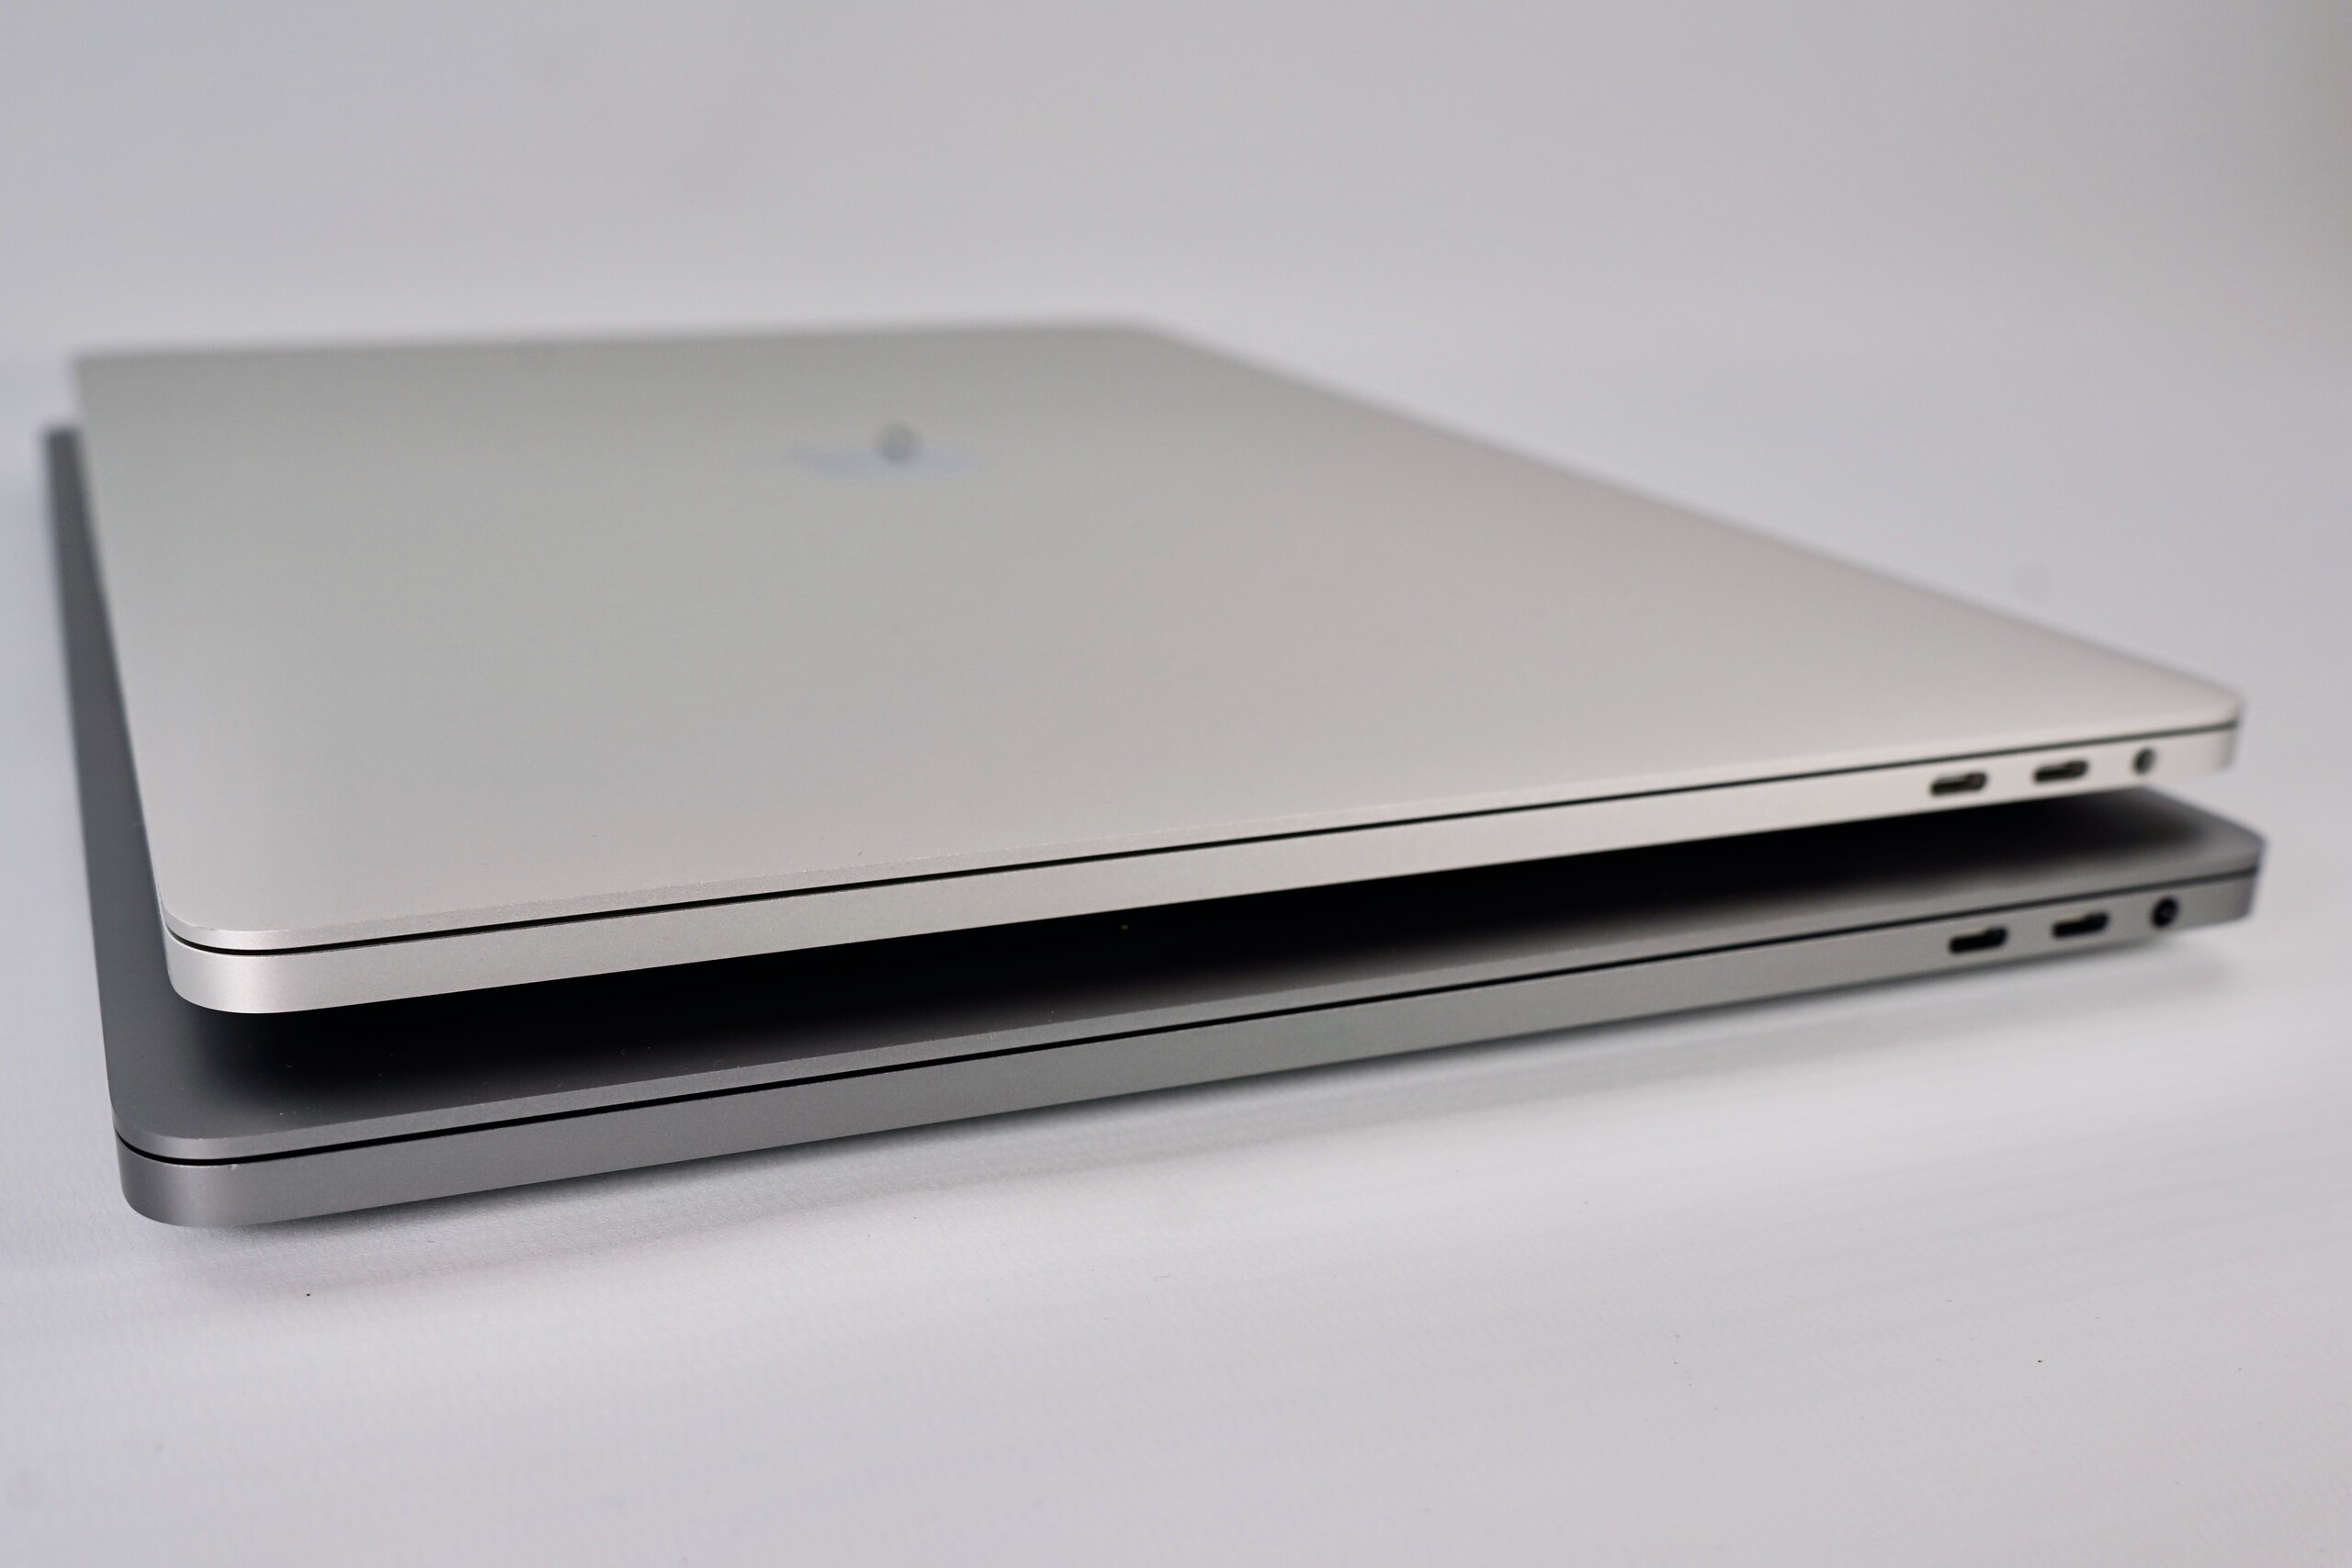
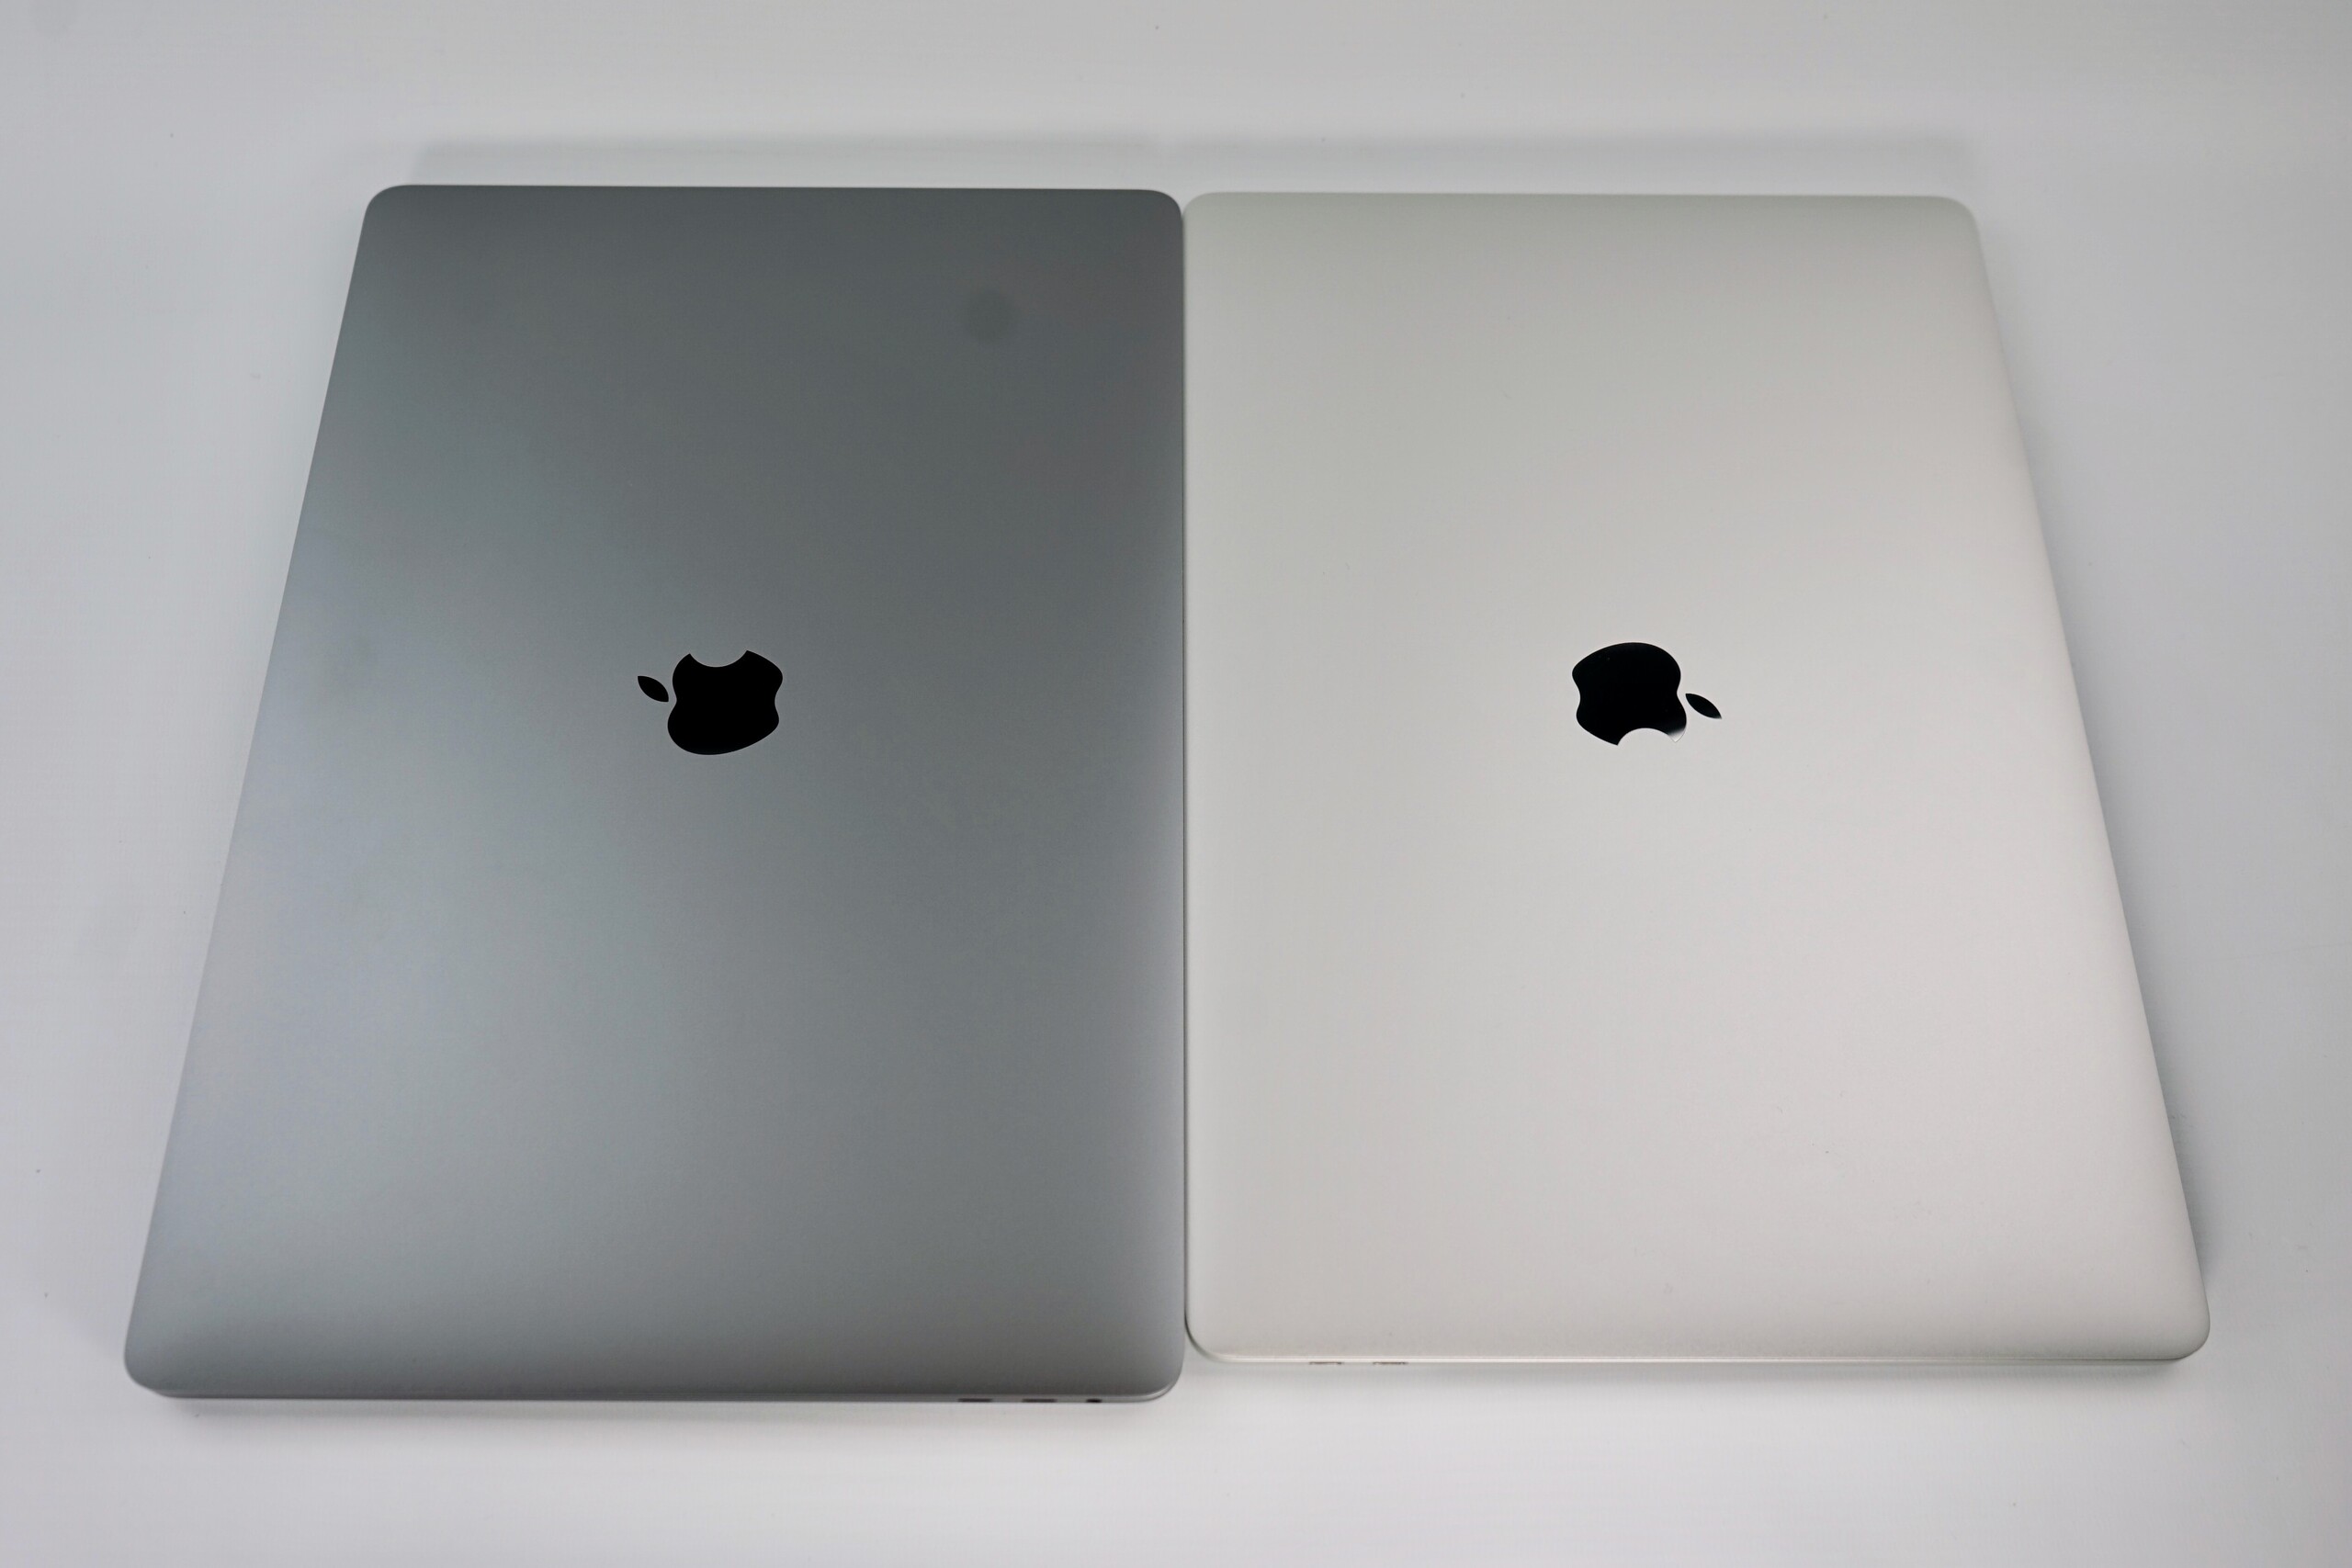
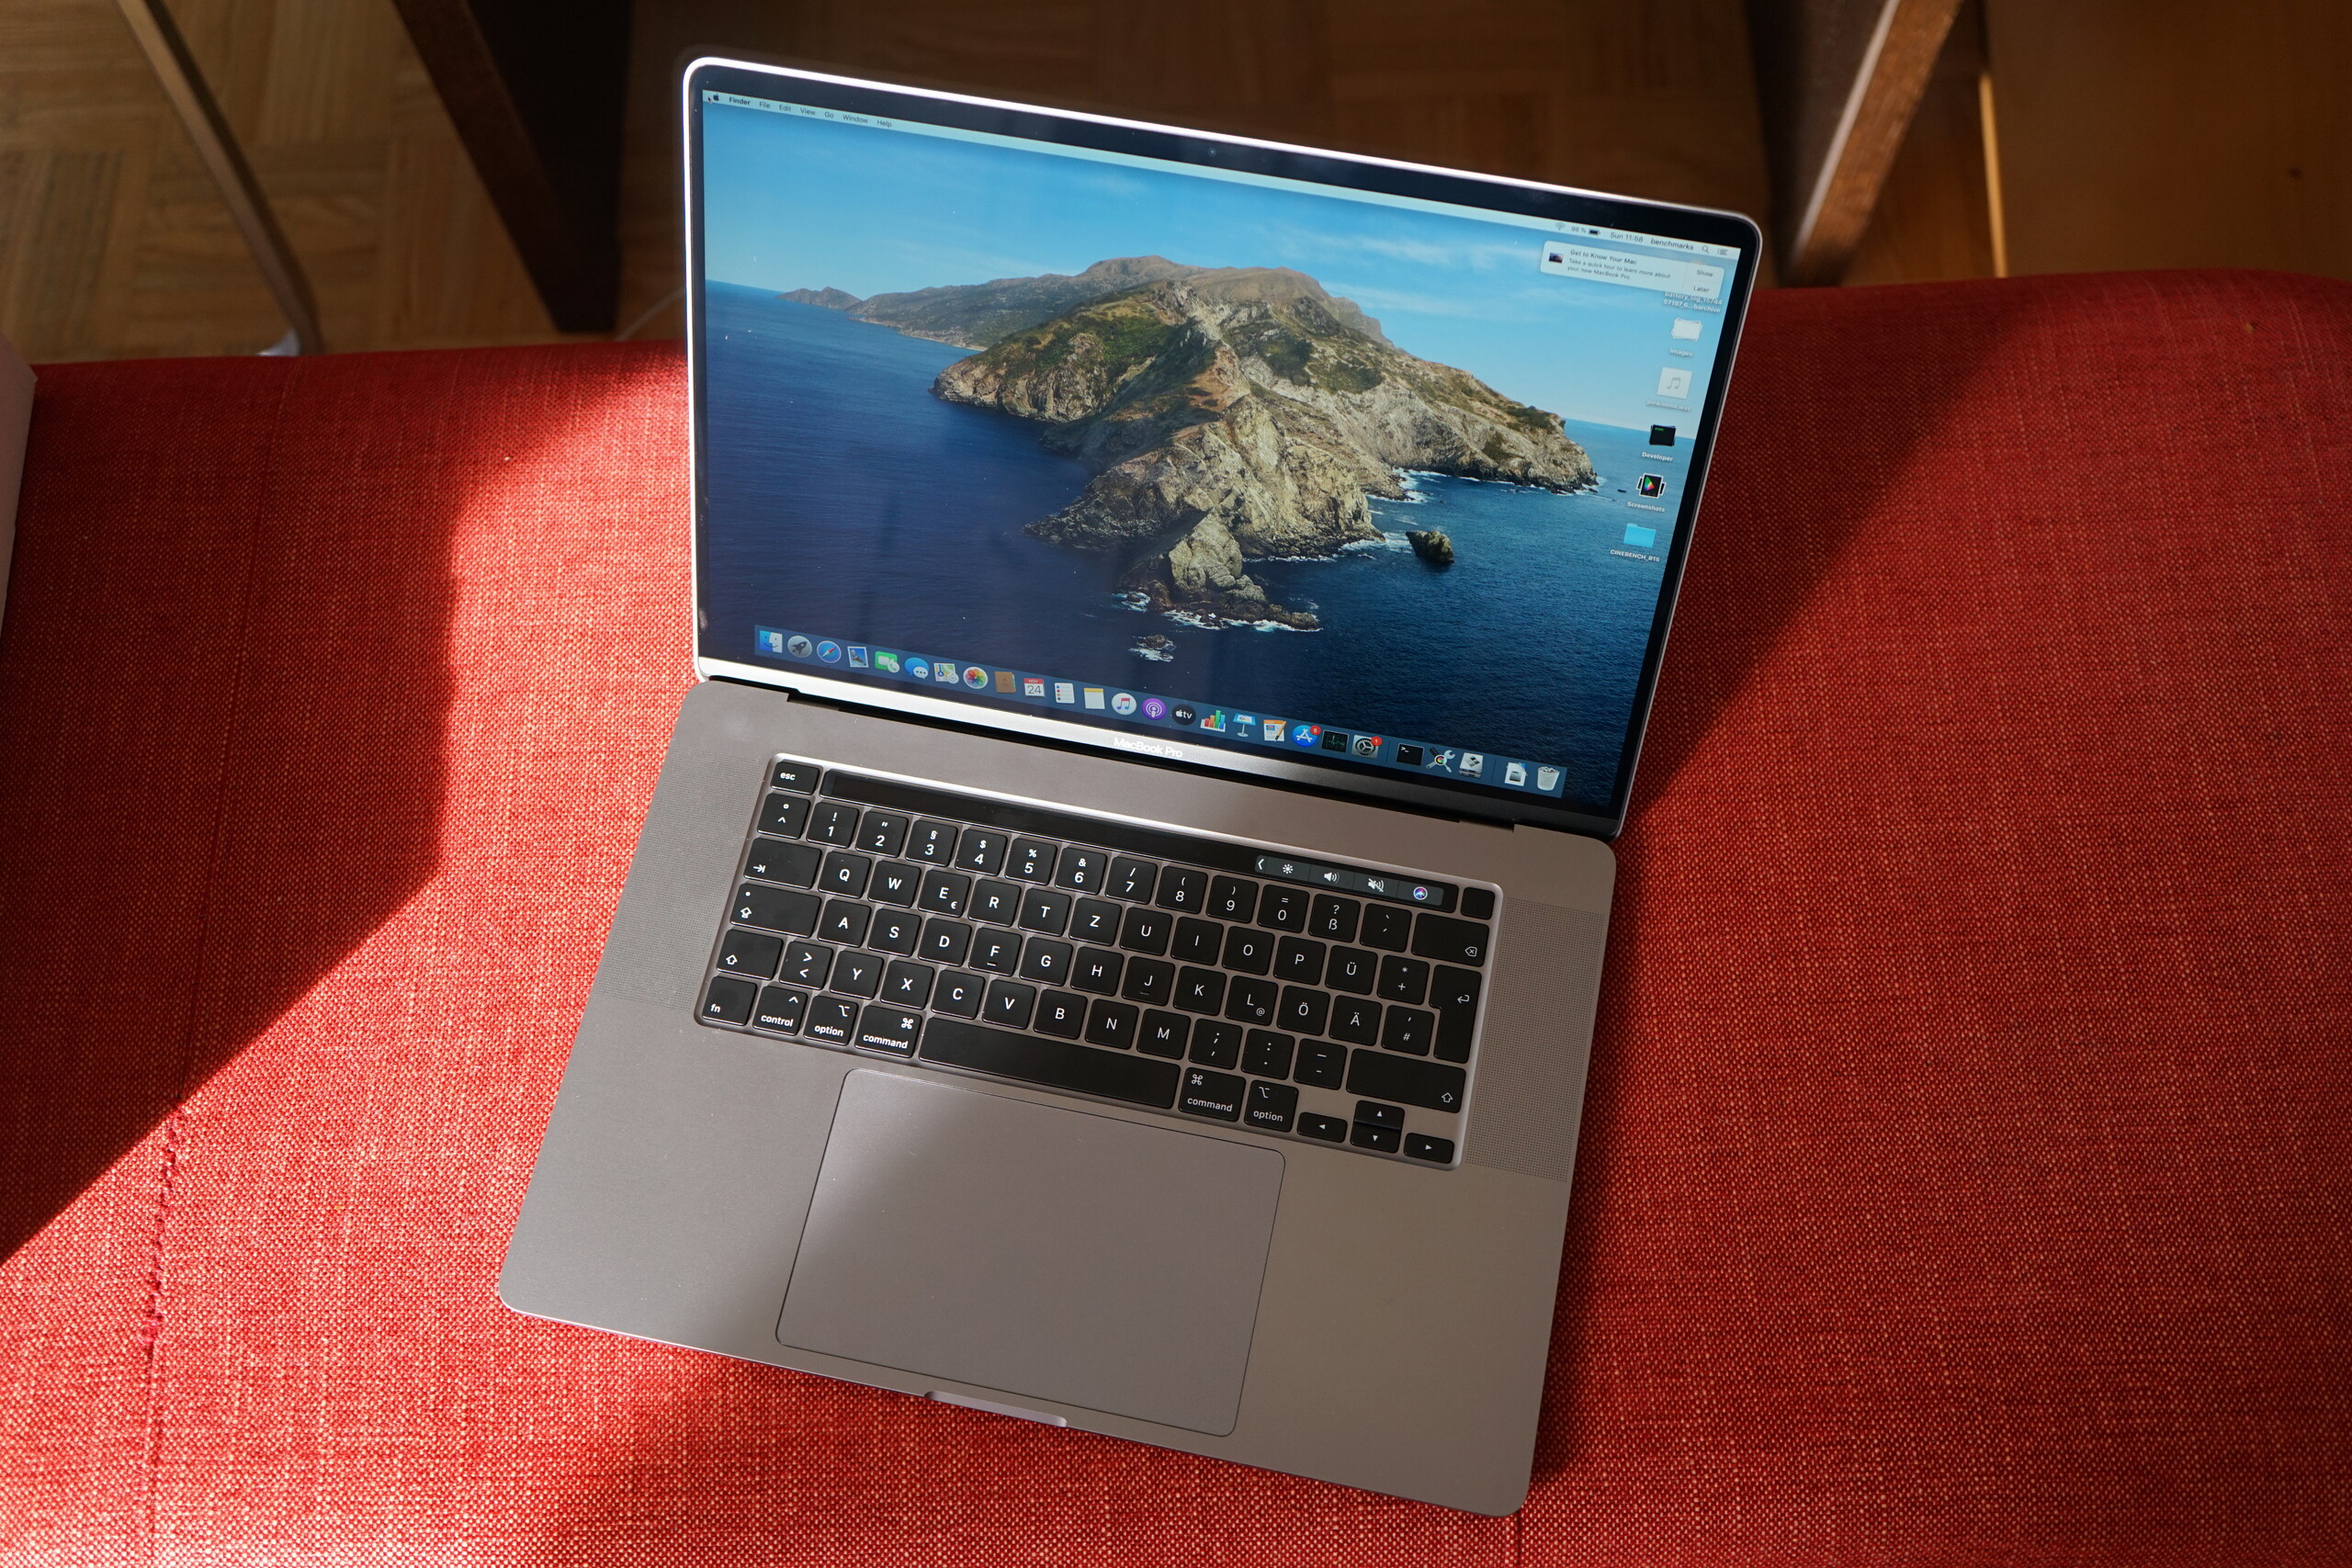
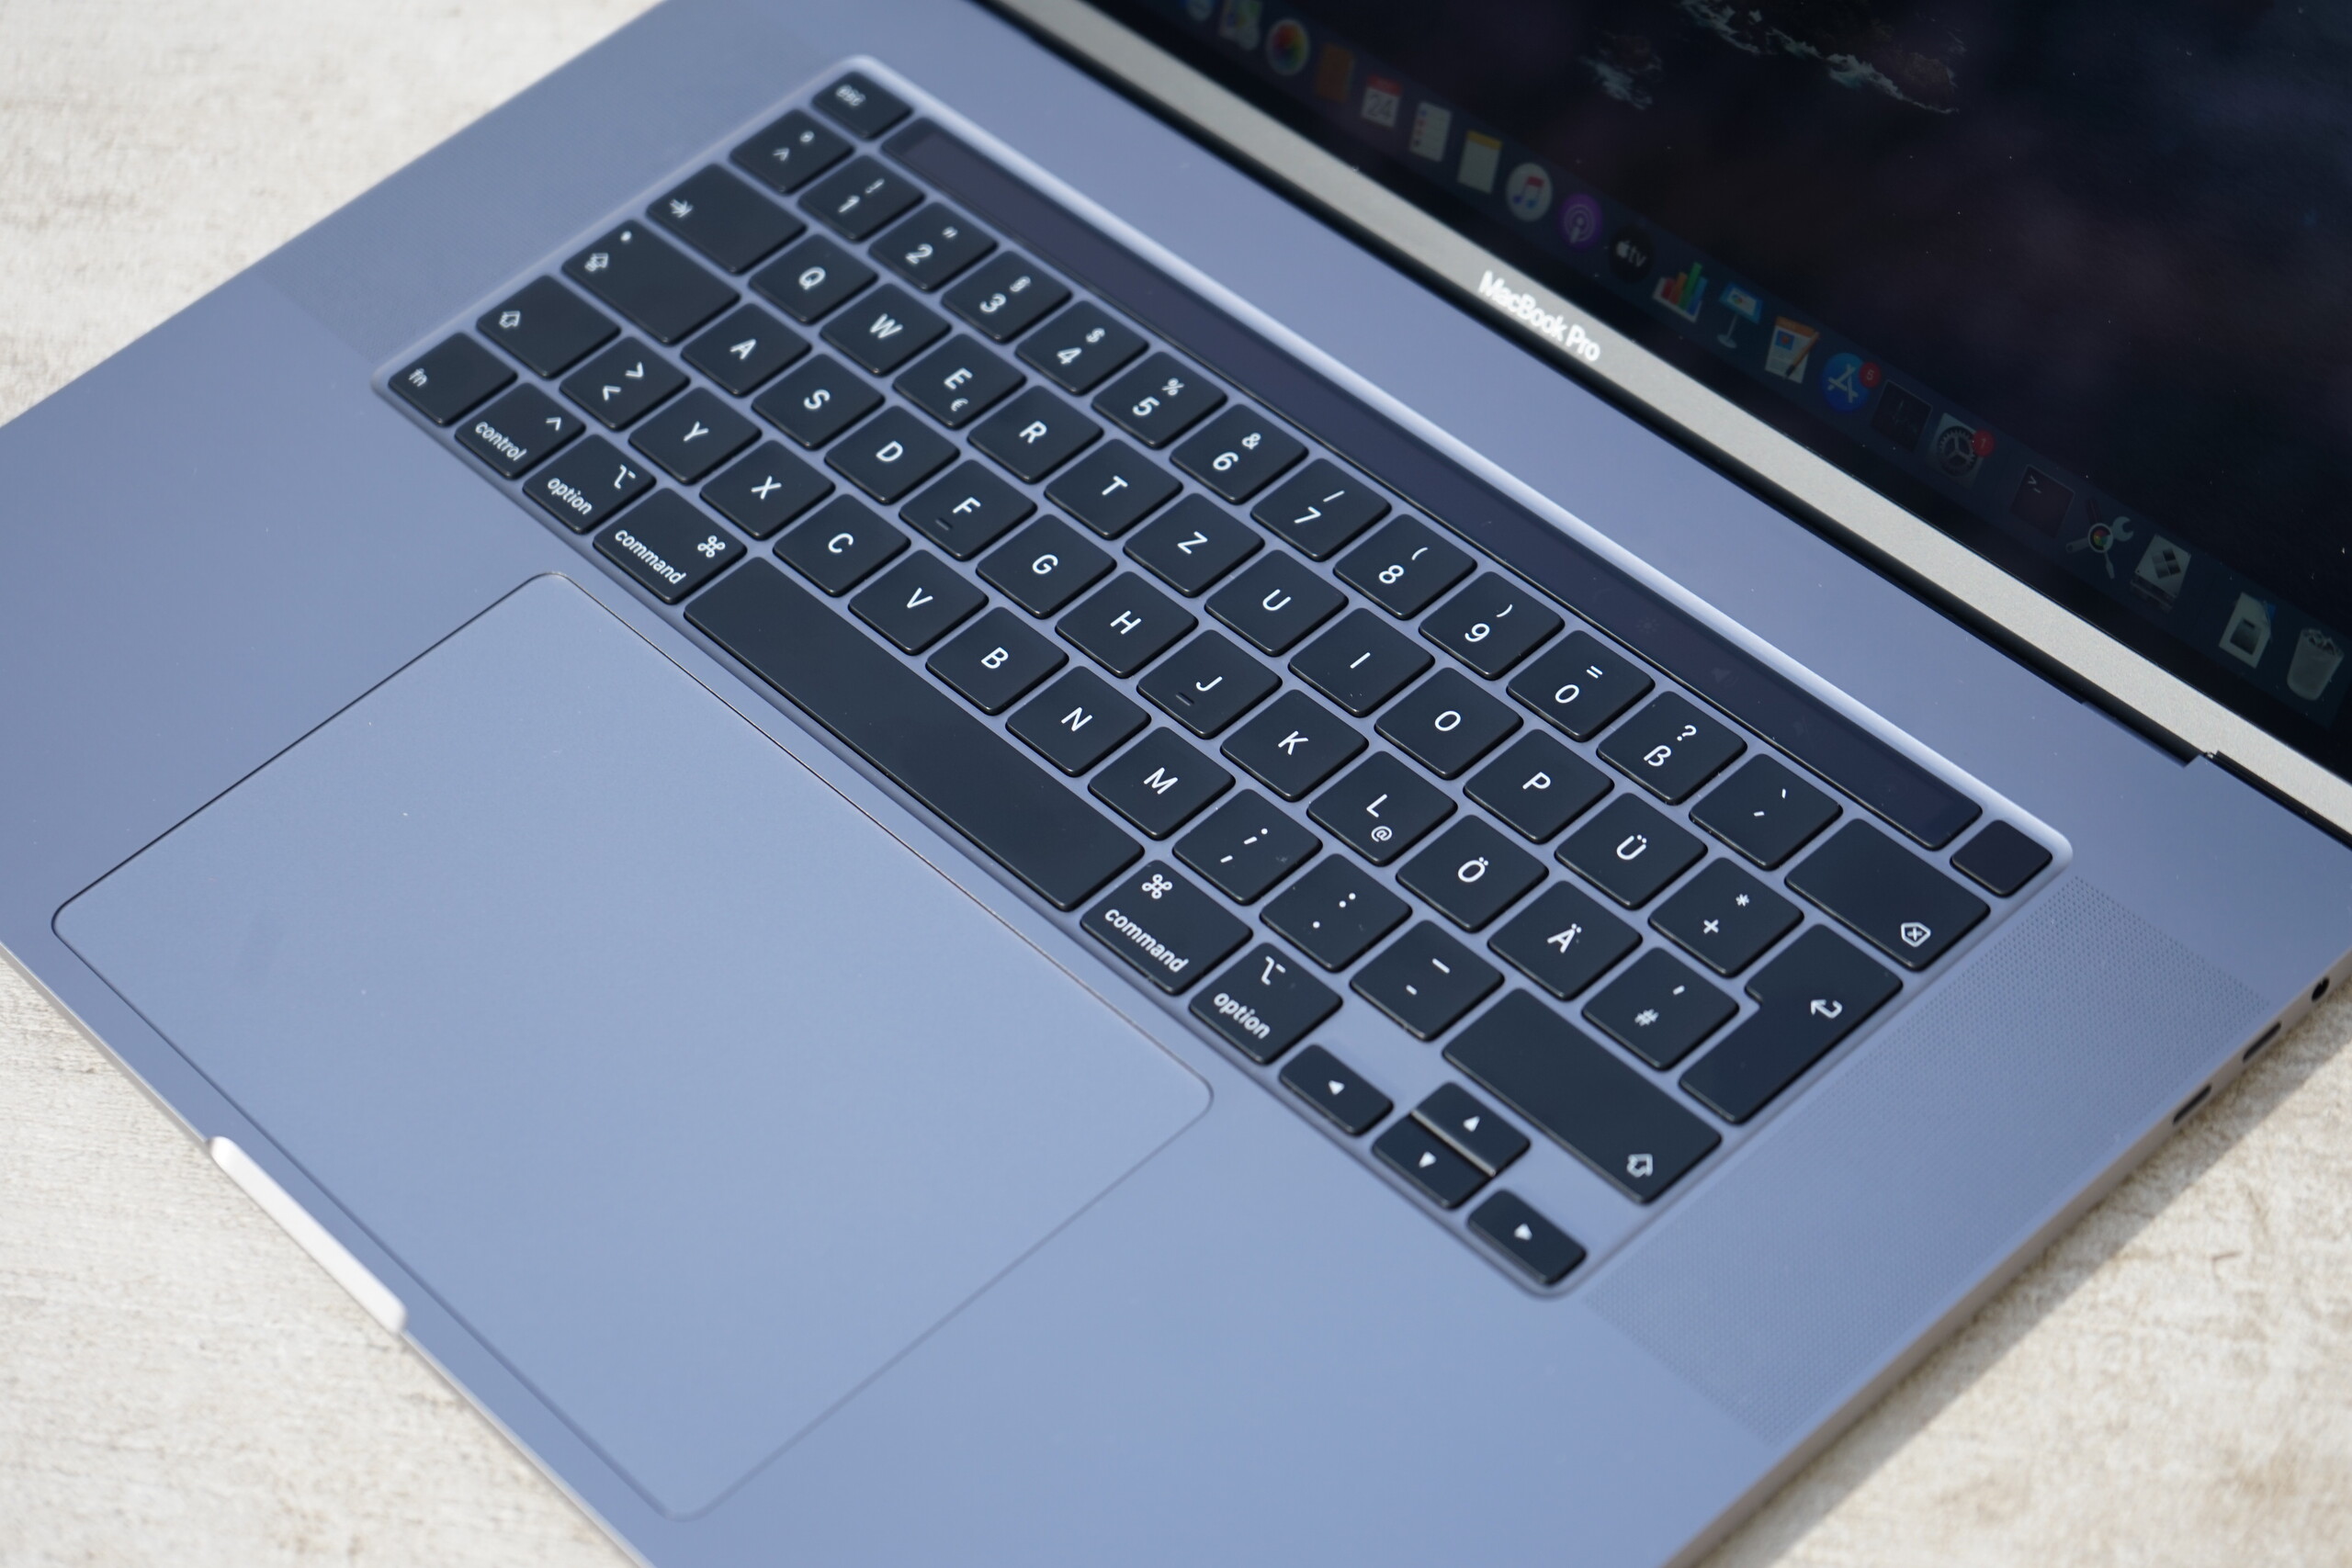
Az Apple néhány apró de jelentős változással finomított a régi 15 hüvelykes dizájnján az új 16 hüvelykes MacBook Pro-val. Először is lecserélte a billentyűzet sokat kritizált „pillangó” mechanizmusát egy „ollós” dizájnra, amely nem csak bevált és jobb visszajelzést ad, mint a „pillangó” billentyűk, hanem elvileg tartósabb is. Az Apple sokat kölcsönzött a legutóbbi MacBook Pro 15 dizájnjától az új 16 hüvelykes modellhez, de ez utóbbi valamivel vastagabb az elődjénél, és a hűtése is hatékonyabb.
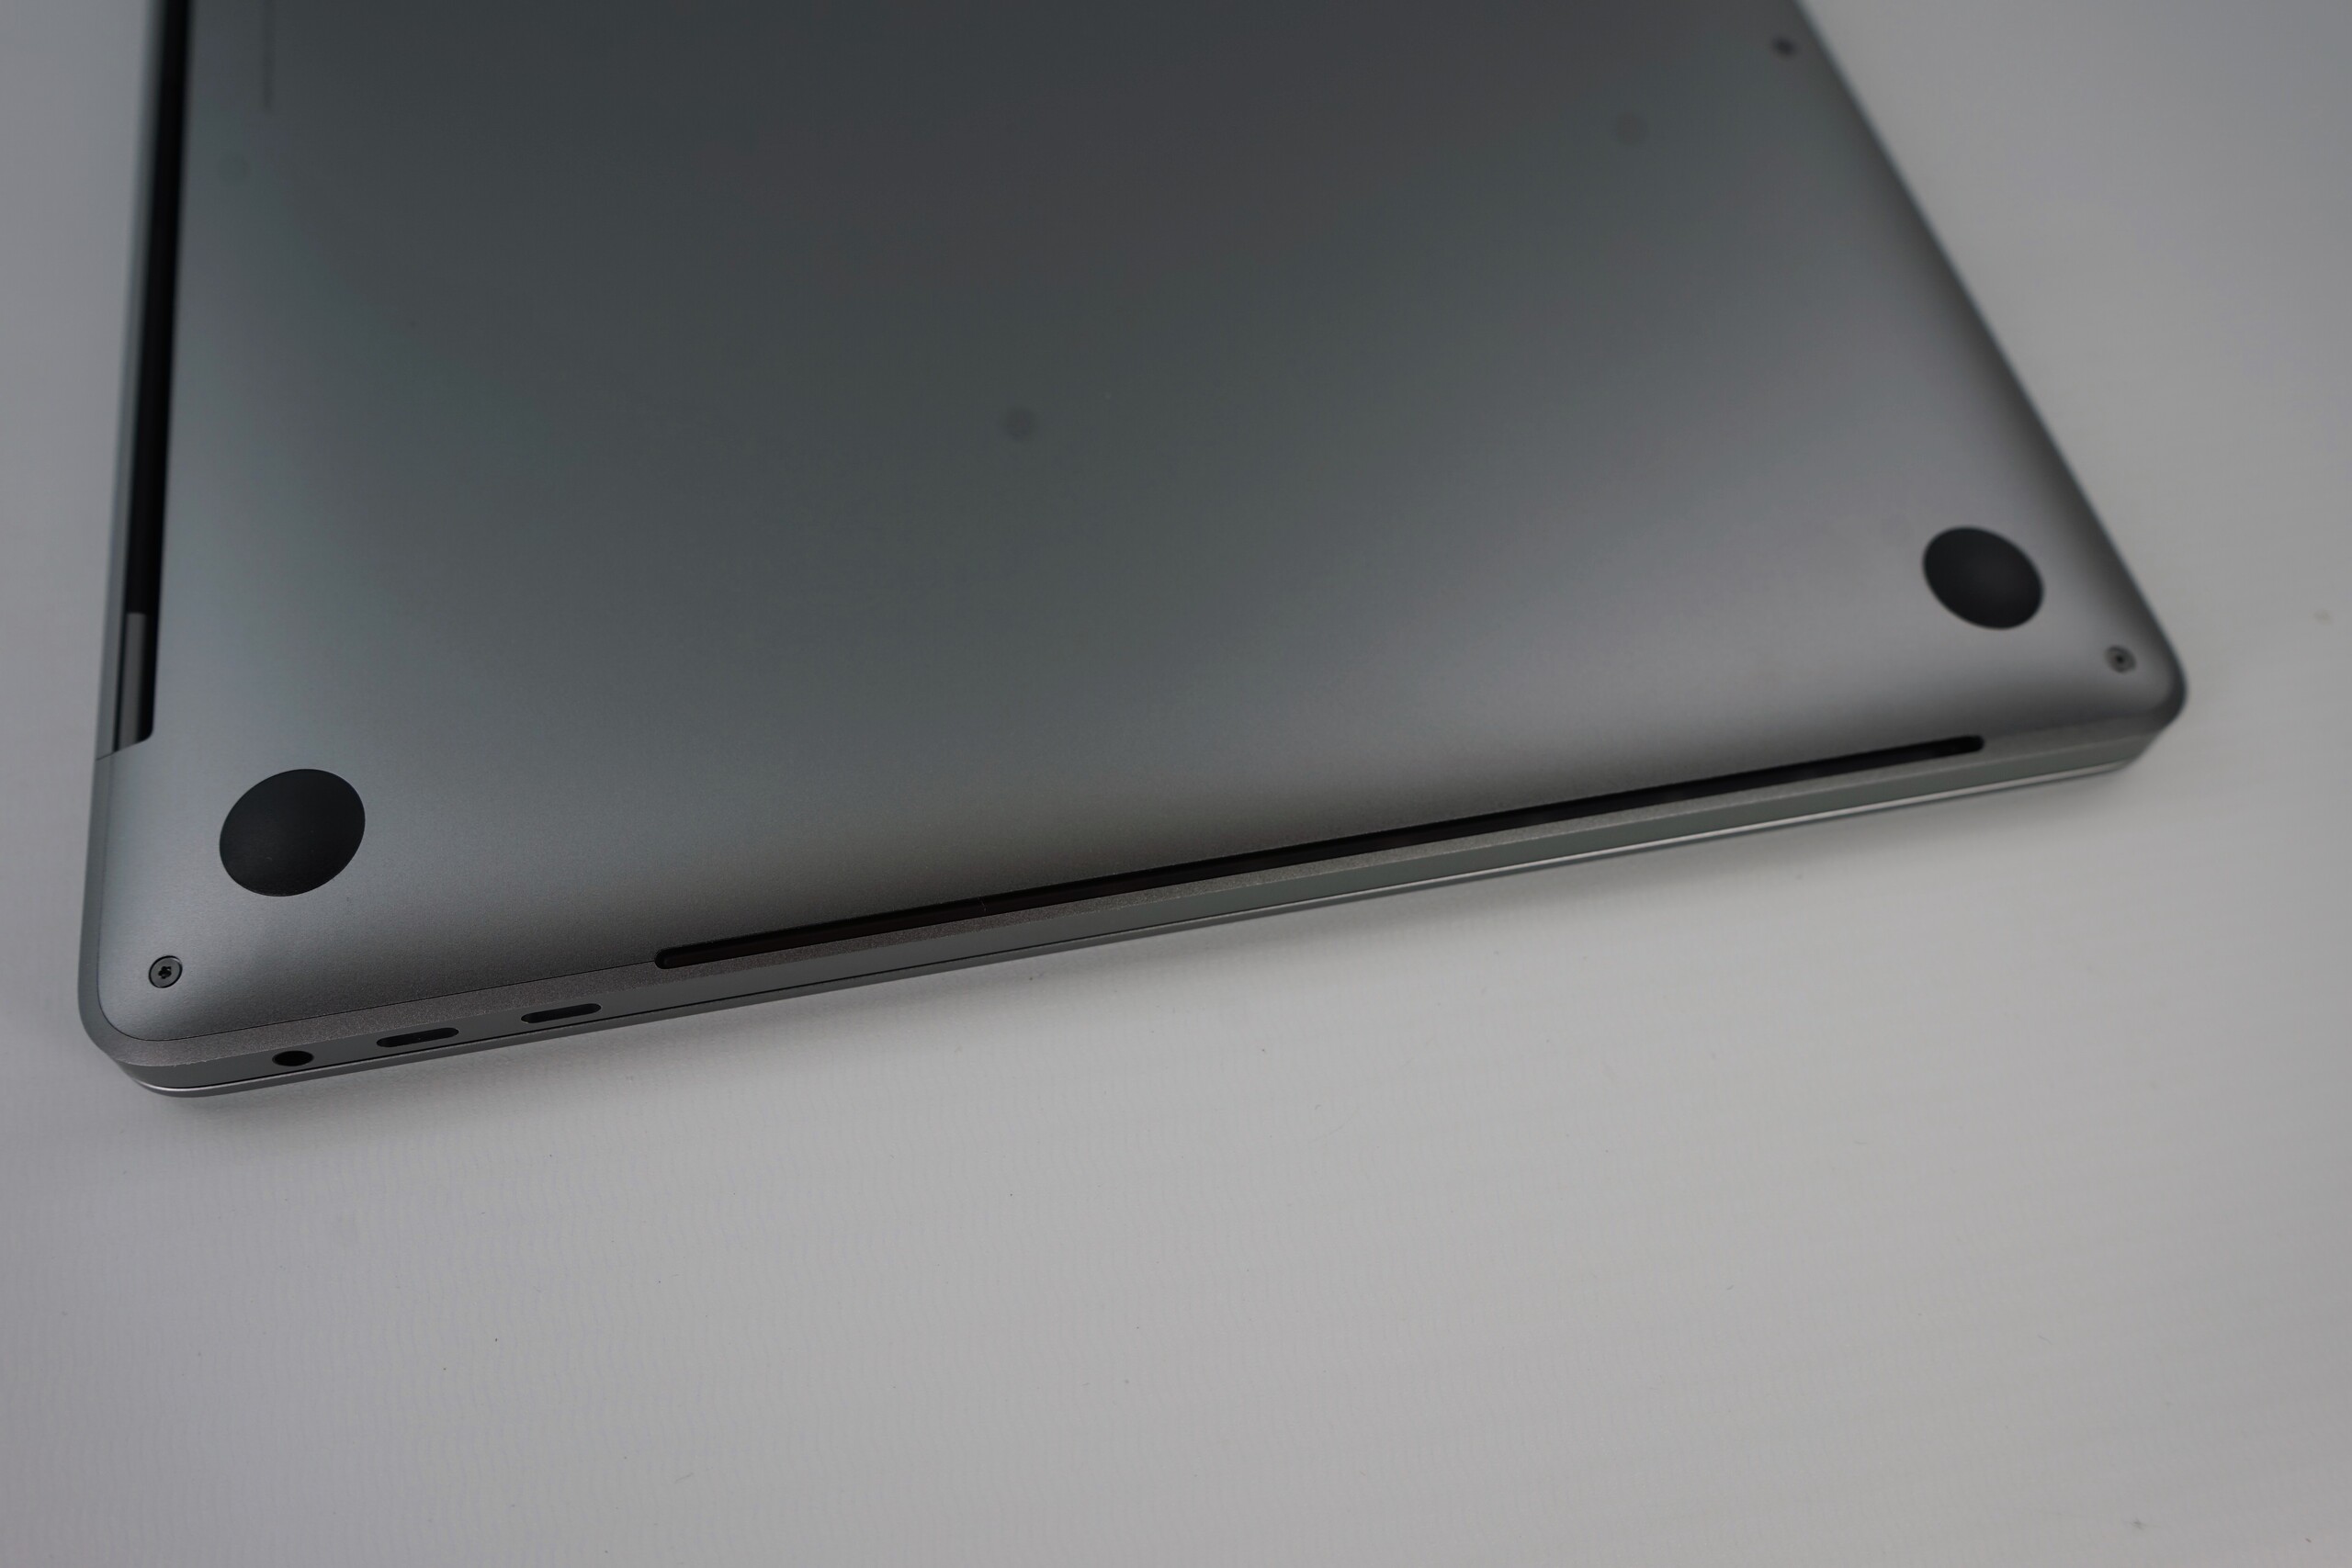
Sajnos az Apple csak négy Thunderbolt 3 port és egy fejhallgató jack beillesztéséhez ragaszkodott az új MacBook Pro-ban. Az Ethernet, HDMI, kártyaolvasó és USB-A portok mind a múltba tartoznak az Apple ökoszisztémájában, így valószínűleg szükséges lesz legalább egy dongle-t beszerezni. Úgyszintén, a bővítési és javítási lehetőségek most is olyan rosszak, mint korábban, mivel az Apple leforrasztotta a CPU-t, GPU-t, RAM-ot, SSD-t és a Wi-Fi chipet is az alaplapjára. Ez azt jelenti, hogy nem csak egy elavult 802.11ac Broadcom Wi-Fi chippel kell megelégednünk, hanem az egész alaplapot le kell cserélni, ha ezen komponensek bármelyike meghibásodik.
A MacBook Pro 16 egy kitűnő és fényűző multimédiás laptop rossz javíthatósággal.
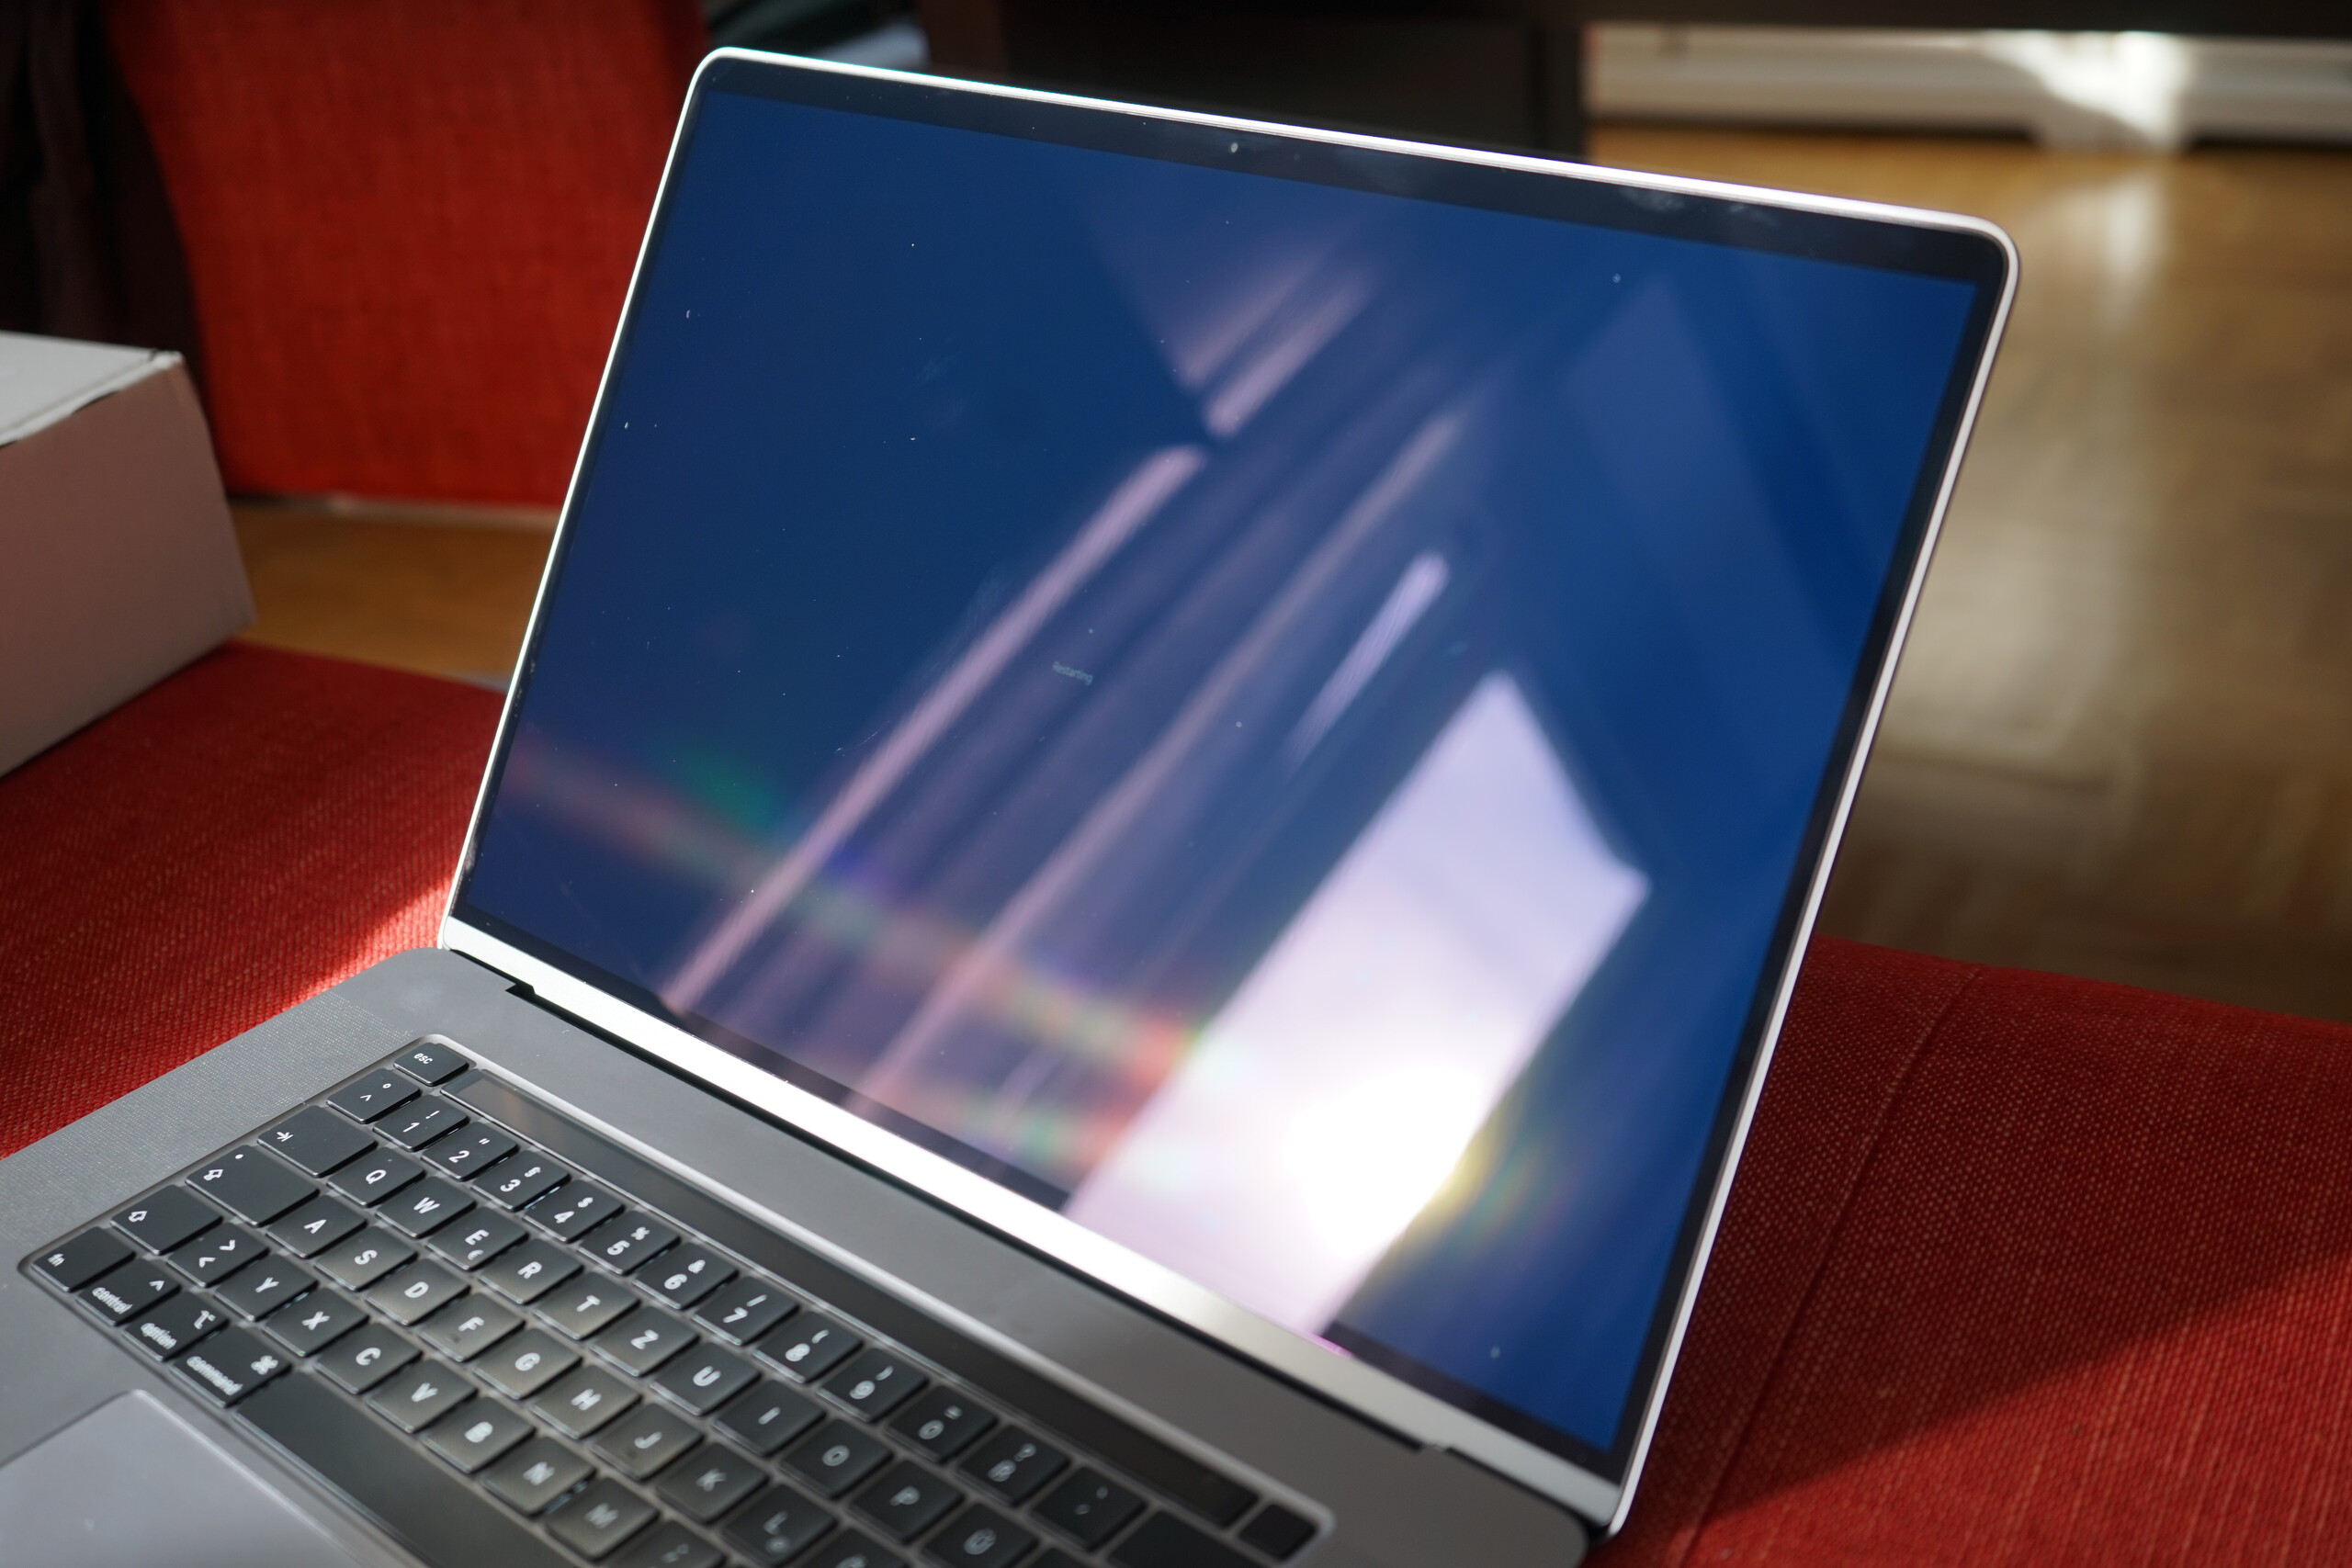
Az új 16 hüvelykes panel sem tartogat meglepetéseket. A panel sem 120 Hz-es frissítési rátát, sem pedig Adaptive Sync-et nem támogat, de a képminőség legalább olyan jó, mint korábbi MacBook Pro-ké, amelyeket értékeltünk. A nagyobb váznak köszönhetően az Apple az új MacBook Pro 16-ot lényegesen jobb hangszórókkal szerelhette fel, mint 15 hüvelykes elődjeit. A hatékonyabb hűtés szintén már régóta váratott magára, és az általunk értékelt gép ennek köszönhetően lényegesen jobb teljesítményt ért el a Core i9-9880H processzor által, mint az elődje. Az új Navi GPU nem egy csoda, de jó frissítésnek számít a Vega GPU-kkal szemben, amelyekkel az Apple a MacBook Pro 15-öt szerelte fel.
A MacBook Pro 16 üzemideje nem döntött rekordokat a multimédiás laptopok között, annak ellenére, hogy 100 Wh-s akkumulátora van, mivel a Core i9 processzor, a nagy kijelző és a dedikélt GPU mind energiaéhes komponensek. Viszont közel két órával több időt kaphatunk töltések között, amikor böngészünk az interneten, mint amit a MacBook Pro 15-tel kaptunk, ami egy kézzelfogható javulás. A MacBook Pro 16 legalább egy teljes munkanapig kell bírja töltések között, és ezt egyetlen összehasonlított készülékünk sem volt képes elérni.
Összességében, a MacBook Pro 16 egy kitűnő multimédiás laptop. Néhány gyengeségtől szenved, amelyek közül a legnagyobb az extrém ár. És 2,799 dollárért csak egy év garanciát kapunk, emellett megfontolandó legalább egy USB-C dongle beszerzése.
Apple MacBook Pro 16 2019 i9 5500M
- 12/02/2019 v7 (old)
Klaus Hinum, Andreas Osthoff
Price comparison

