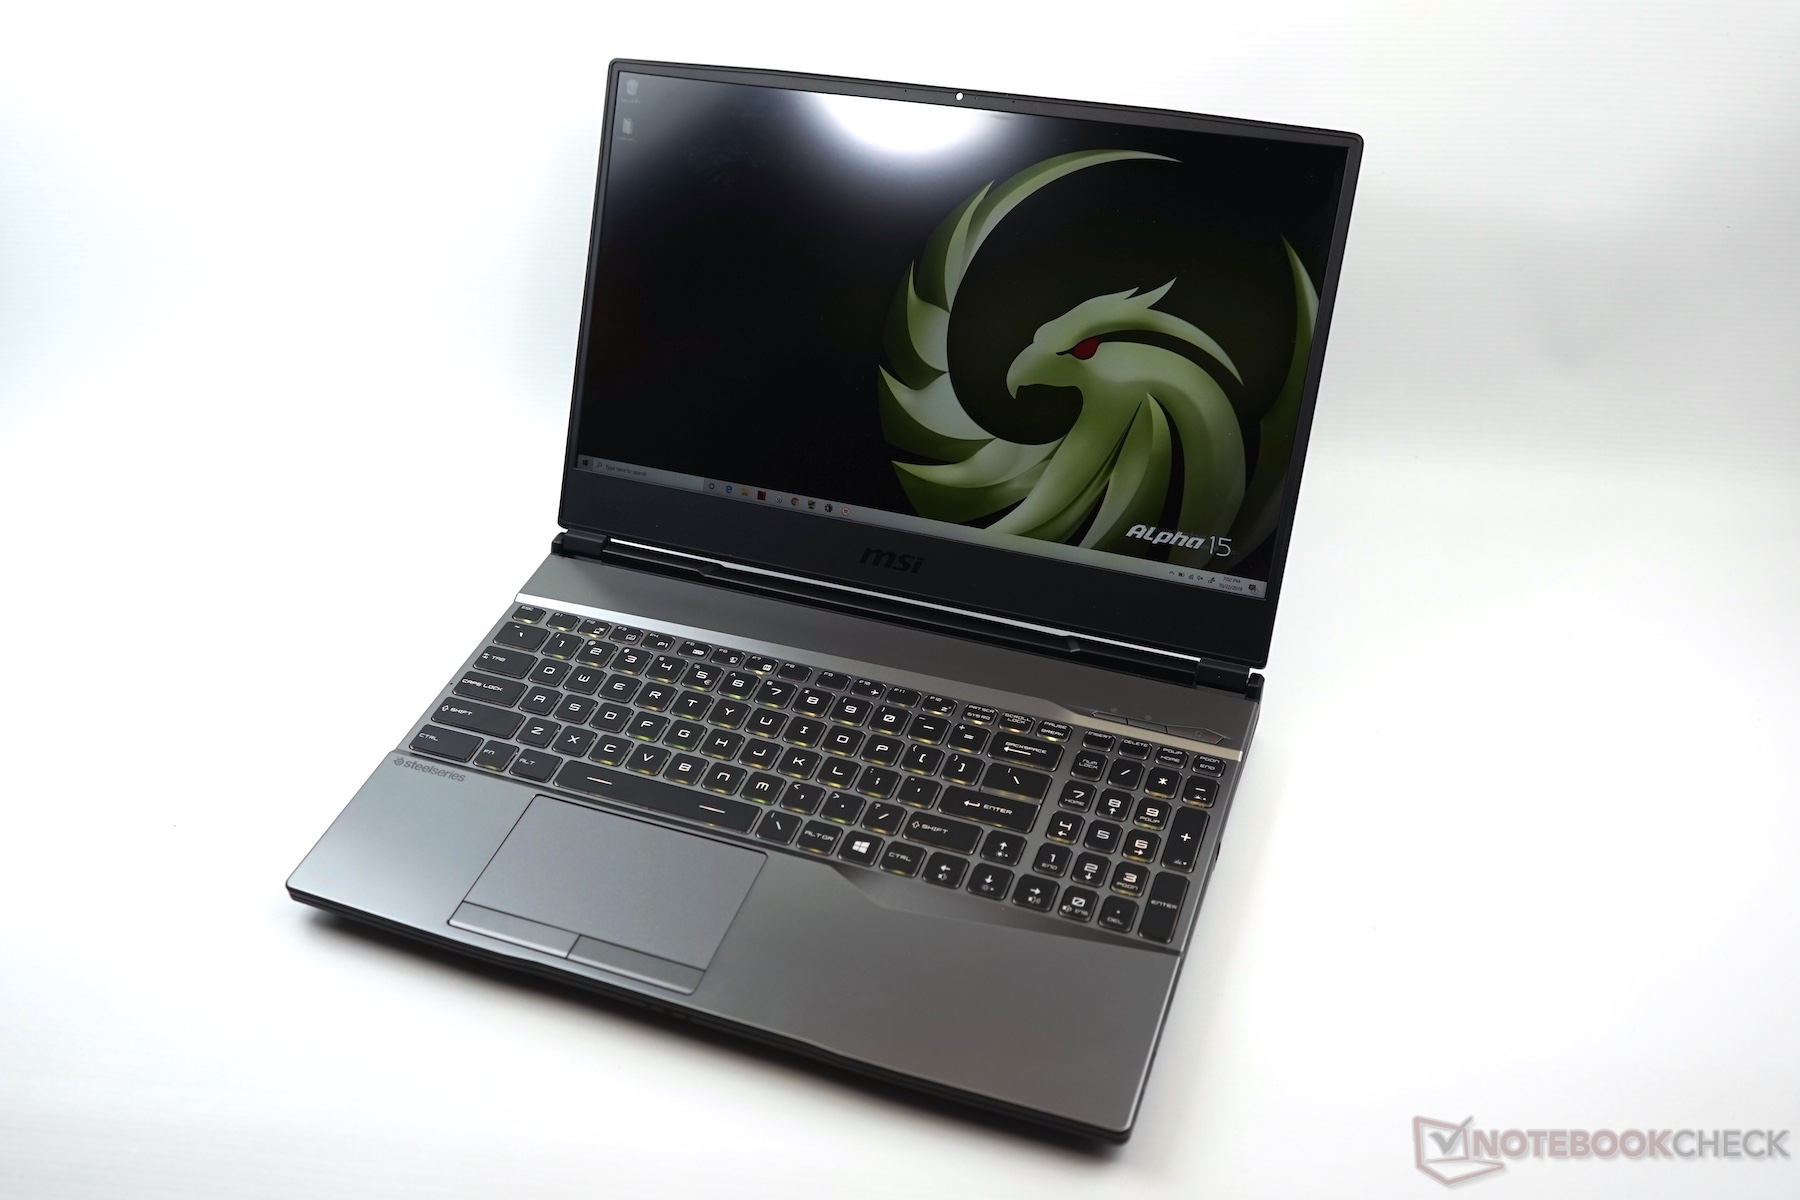
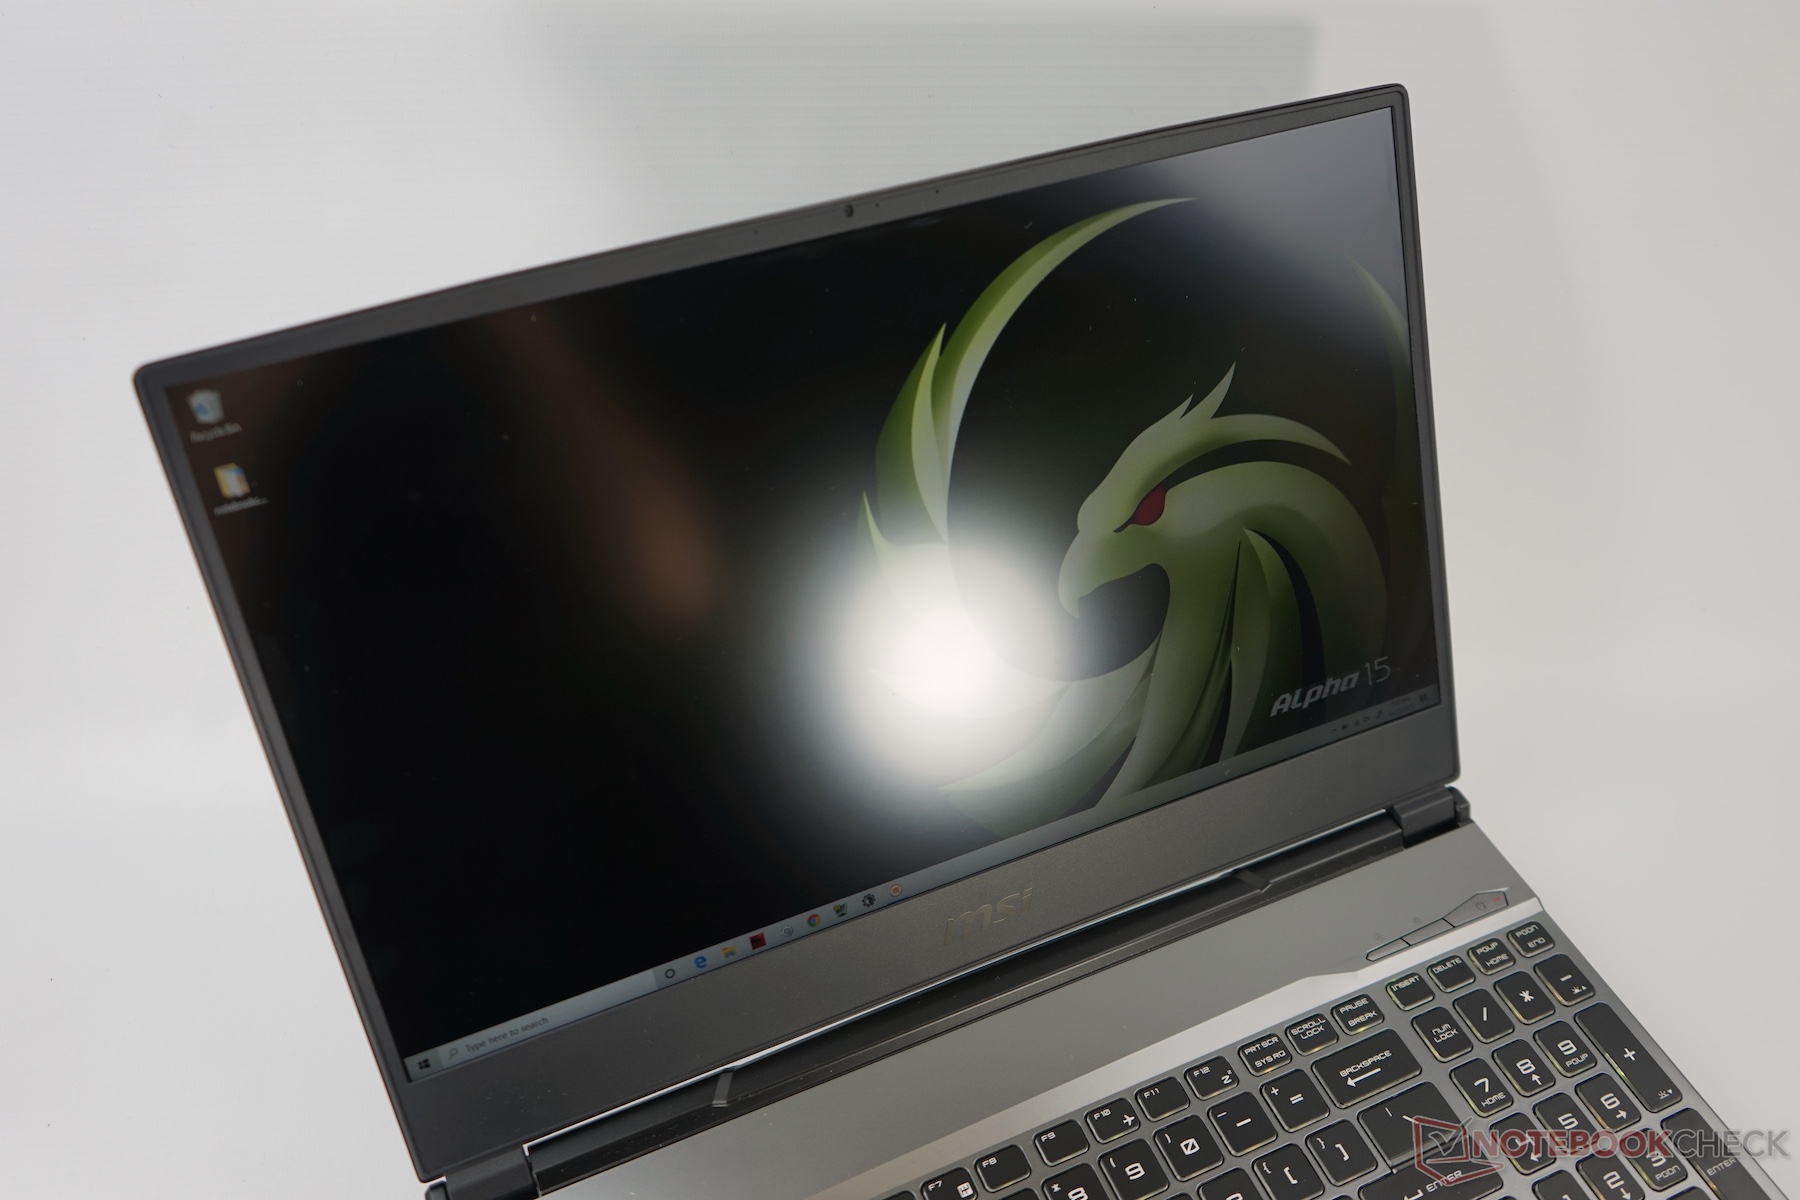
MSI Alpha 15 Gamer Laptop rövid értékelés: Ryzen és Navi az Intel és NVIDIA helyett
Device Overview
Értékelés | Dátum | Modell | Súly | Magasság | Méret | Felbontás | Legjobb ár |
|---|---|---|---|---|---|---|---|
v (old) | 01/2020 | MSI Alpha 15 A3DDK R7 3750H, Radeon RX 5500M | 2.3 kg | 27.5 mm | 15.60" | 1920x1080 | |
| 80.4 % v6 (old) | 08/2019 | Asus TUF FX505DT-EB73 R7 3750H, GeForce GTX 1650 Mobile | 2.2 kg | 26.8 mm | 15.60" | 1920x1080 | |
| 79.3 % v7 (old) | 12/2019 | Dell G3 3590 i5-9300H, GeForce GTX 1650 Mobile | 2.5 kg | 21.6 mm | 15.60" | 1920x1080 | |
| 77 % v7 (old) | 12/2019 | Lenovo IdeaPad L340-15IRH 81LK00BMGE i5-9300H, GeForce GTX 1650 Mobile | 2.1 kg | 23.9 mm | 15.60" | 1920x1080 | |
| 81.5 % v7 (old) | HP Omen 15-dc1020ng i5-9300H, GeForce GTX 1650 Mobile | 2.3 kg | 25 mm | 15.60" | 1920x1080 | ||
| 82.5 % v6 (old) | 06/2019 | Acer Aspire Nitro 5 AN515-54-53Z2 i5-9300H, GeForce GTX 1650 Mobile | 2.2 kg | 27 mm | 15.60" | 1920x1080 | |
| 82.3 % v7 (old) | 09/2019 | Lenovo Legion Y540-15IRH-81SX00B2GE i7-9750H, GeForce GTX 1660 Ti Mobile | 2.2 kg | 26 mm | 15.60" | 1920x1080 | |
| 83.9 % v7 (old) | 10/2019 | HP Gaming Pavilion 15-dk0009ng i7-9750H, GeForce GTX 1660 Ti Max-Q | 2.4 kg | 23.4 mm | 15.60" | 1920x1080 | |
| 83.3 % v6 (old) | 07/2019 | Asus ROG Zephyrus G15 GA502DU R7 3750H, GeForce GTX 1660 Ti Max-Q | 2.1 kg | 20.4 mm | 15.60" | 1920x1080 |
| |||||||||||||||||||||||||
Fényerő megoszlás: 91 %
Centrumban: 266 cd/m²
Kontraszt: 1506:1 (Fekete: 0.18 cd/m²)
ΔE ColorChecker Calman: 4.38 | ∀{0.5-29.43 Ø4.73}
calibrated: 4.29
ΔE Greyscale Calman: 2.1 | ∀{0.09-98 Ø4.97}
36.74% AdobeRGB 1998 (Argyll 3D)
53.5% sRGB (Argyll 3D)
35.56% Display P3 (Argyll 3D)
Gamma: 2.15
CCT: 6867 K
| MSI Alpha 15 A3DDK AU Optronics B156HAN13.0 (AUOD0ED), IPS, 1920x1080, 15.6" | Asus TUF FX505DT-EB73 Panda LM156LF-GL, IPS, 1920x1080, 15.6" | Dell G3 3590 BOE NV15N3D, IPS, 1920x1080, 15.6" | Lenovo IdeaPad L340-15IRH 81LK00BMGE CMN 156HCA-EAB, IPS, 1920x1080, 15.6" | Lenovo Legion Y540-15IRH-81SX00B2GE BOE 084D, IPS, 1920x1080, 15.6" | HP Gaming Pavilion 15-dk0009ng LG Philips LGD05FE, IPS, 1920x1080, 15.6" | |
|---|---|---|---|---|---|---|
| Display | 11% | 13% | 20% | 76% | 79% | |
| Display P3 Coverage (%) | 35.56 | 39.56 11% | 40.13 13% | 42.81 20% | 63.6 79% | 64.2 81% |
| sRGB Coverage (%) | 53.5 | 59.5 11% | 59.8 12% | 63.8 19% | 91.7 71% | 95.1 78% |
| AdobeRGB 1998 Coverage (%) | 36.74 | 40.91 11% | 41.47 13% | 44.31 21% | 65.2 77% | 65.8 79% |
| Response Times | 6% | -25% | -22% | 66% | 58% | |
| Response Time Grey 50% / Grey 80% * (ms) | 36.1 | 30.4 ? 16% | 46 ? -27% | 45.6 ? -26% | 8.8 ? 76% | 16.4 ? 55% |
| Response Time Black / White * (ms) | 26.4 | 27.6 ? -5% | 32.4 ? -23% | 30.8 ? -17% | 12 ? 55% | 10.4 ? 61% |
| PWM Frequency (Hz) | 200 ? | 25910 ? | ||||
| Screen | -34% | -20% | -15% | -5% | 15% | |
| Brightness middle (cd/m²) | 271 | 286.2 6% | 276.2 2% | 275 1% | 299 10% | 345 27% |
| Brightness (cd/m²) | 266 | 267 0% | 261 -2% | 253 -5% | 290 9% | 324 22% |
| Brightness Distribution (%) | 91 | 84 -8% | 86 -5% | 83 -9% | 89 -2% | 86 -5% |
| Black Level * (cd/m²) | 0.18 | 0.33 -83% | 0.24 -33% | 0.18 -0% | 0.29 -61% | 0.42 -133% |
| Contrast (:1) | 1506 | 867 -42% | 1151 -24% | 1528 1% | 1031 -32% | 821 -45% |
| Colorchecker dE 2000 * | 4.38 | 5.45 -24% | 5.56 -27% | 5.4 -23% | 3.7 16% | 1.3 70% |
| Colorchecker dE 2000 max. * | 17.6 | 18.08 -3% | 23.45 -33% | 21.3 -21% | 7 60% | 2.8 84% |
| Colorchecker dE 2000 calibrated * | 4.29 | 4.47 -4% | 5.23 -22% | 4.4 -3% | 2 53% | 1.1 74% |
| Greyscale dE 2000 * | 2.1 | 5.3 -152% | 2.8 -33% | 3.7 -76% | 4.1 -95% | 1.2 43% |
| Gamma | 2.15 102% | 2.1 105% | 2.37 93% | 2.12 104% | 2.19 100% | 2.31 95% |
| CCT | 6867 95% | 7679 85% | 6710 97% | 6376 102% | 7166 91% | 6476 100% |
| Color Space (Percent of AdobeRGB 1998) (%) | 37.6 | 37.8 | 40.8 | 59.3 | 60.5 | |
| Color Space (Percent of sRGB) (%) | 59.1 | 59 | 63.6 | 91.5 | 94.9 | |
| Teljes átlag (program / beállítások) | -6% /
-19% | -11% /
-14% | -6% /
-8% | 46% /
23% | 51% /
35% |
* ... a kisebb jobb
Megjelenítési válaszidők
| ↔ Válaszidő Fekete-fehér | ||
|---|---|---|
| 26.4 ms ... emelkedés és süllyedés ↘ kombinálva | ↗ ms emelkedés | 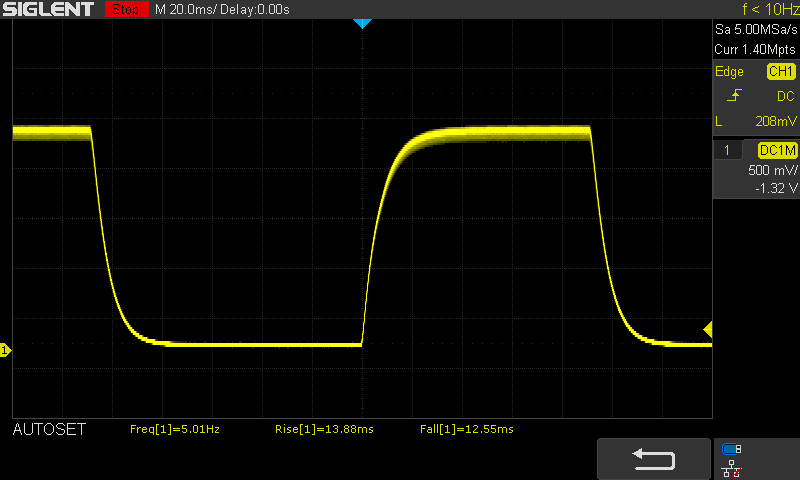 |
| ↘ ms ősz | ||
| A képernyő viszonylag lassú reakciósebességet mutat tesztjeinkben, és túl lassú lehet a játékosok számára. Összehasonlításképpen, az összes tesztelt eszköz 0.1 (minimum) és 240 (maximum) ms között mozog. » 66 % of all devices are better. Ez azt jelenti, hogy a mért válaszidő rosszabb, mint az összes vizsgált eszköz átlaga (19.9 ms). | ||
| ↔ Válaszidő 50% szürke és 80% szürke között | ||
| 36.1 ms ... emelkedés és süllyedés ↘ kombinálva | ↗ ms emelkedés | 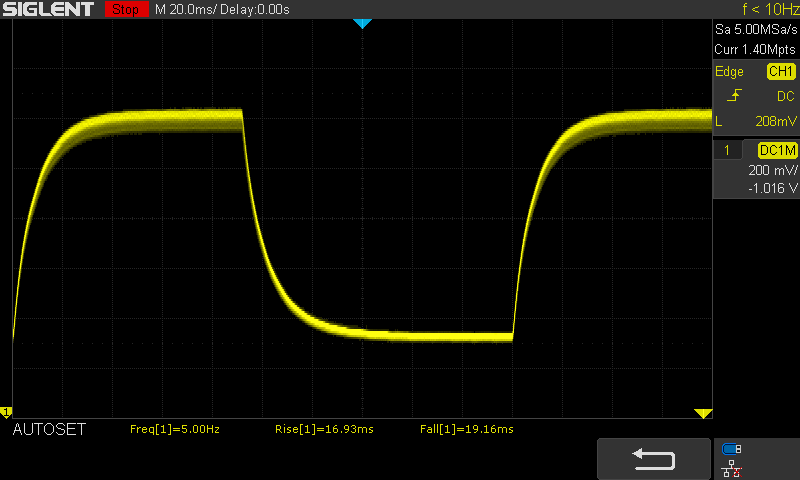 |
| ↘ ms ősz | ||
| A képernyő lassú reakciósebességet mutat tesztjeinkben, és nem lesz kielégítő a játékosok számára. Összehasonlításképpen, az összes tesztelt eszköz 0.165 (minimum) és 636 (maximum) ms között mozog. » 52 % of all devices are better. Ez azt jelenti, hogy a mért válaszidő rosszabb, mint az összes vizsgált eszköz átlaga (31.1 ms). | ||
Képernyő villogása / PWM (impulzusszélesség-moduláció)
| Képernyő villogása / PWM nem érzékelhető | 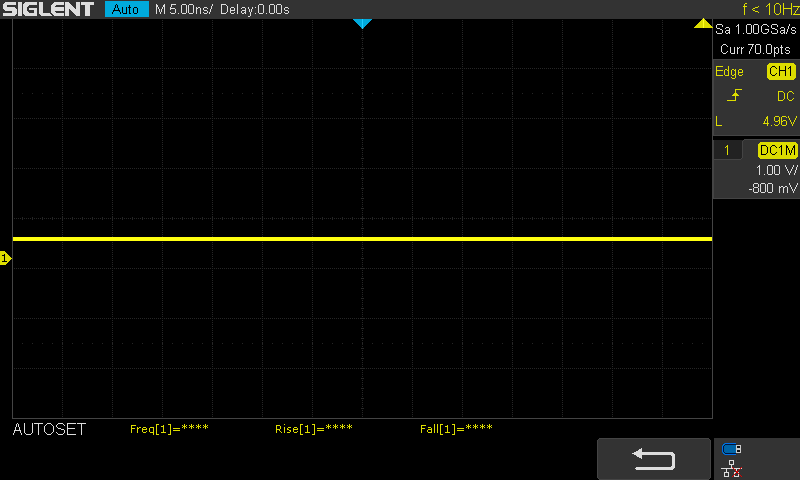 | ||
Összehasonlításképpen: az összes tesztelt eszköz 52 %-a nem használja a PWM-et a kijelző elsötétítésére. Ha PWM-et észleltek, akkor átlagosan 7798 (minimum: 5 - maximum: 343500) Hz-t mértek. | |||
| PCMark 8 Home Score Accelerated v2 | 4800 pontok | |
| PCMark 8 Creative Score Accelerated v2 | 6613 pontok | |
| PCMark 8 Work Score Accelerated v2 | 5167 pontok | |
| PCMark 10 Score | 4733 pontok | |
Segítség | ||
| 3DMark 06 Standard Score | 26559 pontok | |
| 3DMark 11 Performance | 13344 pontok | |
| 3DMark Cloud Gate Standard Score | 22627 pontok | |
| 3DMark Fire Strike Score | 10080 pontok | |
| 3DMark Time Spy Score | 4024 pontok | |
Segítség | ||
| Dota 2 Reborn - 1920x1080 ultra (3/3) best looking | |
| Lenovo Legion Y540-15IRH-81SX00B2GE | |
| Lenovo Legion Y540-15IRH-81SX00B2GE | |
| Átlagos NVIDIA GeForce GTX 1660 Ti Mobile (94.6 - 125, n=11) | |
| Átlagos NVIDIA GeForce GTX 1650 Mobile (58.5 - 119, n=20) | |
| HP Omen 15-dc1020ng | |
| Átlagos NVIDIA GeForce GTX 1660 Ti Max-Q (75.7 - 103, n=3) | |
| HP Omen 15-dc1020ng | |
| HP Pavilion Gaming 15-ec0017ng | |
| Lenovo IdeaPad L340-15IRH 81LK00BMGE | |
| MSI Alpha 15 A3DDK | |
| F1 2019 - 1920x1080 Ultra High Preset AA:T AF:16x | |
| Átlagos NVIDIA GeForce GTX 1660 Ti Mobile (91 - 99, n=4) | |
| HP Pavilion Gaming 15-ec0017ng | |
| Átlagos NVIDIA GeForce GTX 1660 Ti Max-Q (71 - 77, n=2) | |
| HP Gaming Pavilion 15-dk0009ng | |
| MSI Alpha 15 A3DDK | |
| HP Omen 15-dc1020ng | |
| Átlagos NVIDIA GeForce GTX 1650 Mobile (59 - 65, n=5) | |
| HP Omen 15-dc1020ng | |
| Dell G5 15 5590-PCNJJ | |
| Rage 2 - 1920x1080 Ultra Preset (Resolution Scale Off) | |
| Átlagos NVIDIA GeForce GTX 1660 Ti Mobile (67.9 - 68.8, n=2) | |
| HP Pavilion Gaming 15-ec0017ng | |
| Átlagos NVIDIA GeForce GTX 1660 Ti Max-Q (58.2 - 64.8, n=2) | |
| HP Omen 15-dc1020ng | |
| HP Gaming Pavilion 15-dk0009ng | |
| MSI Alpha 15 A3DDK | |
| Átlagos NVIDIA GeForce GTX 1650 Mobile (45.1 - 60, n=3) | |
| HP Omen 15-dc1020ng | |
| Dell G5 15 5590-PCNJJ | |
| Ghost Recon Breakpoint - 1920x1080 Ultra Preset AA:T | |
| Átlagos NVIDIA GeForce GTX 1660 Ti Mobile (51 - 55, n=2) | |
| Átlagos NVIDIA GeForce GTX 1660 Ti Max-Q (48 - 51, n=2) | |
| HP Pavilion Gaming 15-ec0017ng | |
| Átlagos NVIDIA GeForce GTX 1650 Mobile (30 - 37, n=2) | |
| Dell G5 15 5590-PCNJJ | |
| MSI Alpha 15 A3DDK | |
| Borderlands 3 - 1920x1080 Badass Overall Quality (DX11) | |
| Átlagos NVIDIA GeForce GTX 1660 Ti Mobile (46.6 - 48.6, n=3) | |
| Átlagos NVIDIA GeForce GTX 1660 Ti Max-Q (41.5 - 42.3, n=2) | |
| HP Pavilion Gaming 15-ec0017ng | |
| MSI Alpha 15 A3DDK | |
| Átlagos NVIDIA GeForce GTX 1650 Mobile (29 - 34.6, n=5) | |
| Dell G5 15 5590-PCNJJ | |
| Total War: Three Kingdoms - 1920x1080 Ultra (incl textures) | |
| Átlagos NVIDIA GeForce GTX 1660 Ti Mobile (n=1) | |
| HP Gaming Pavilion 15-dk0009ng | |
| Átlagos NVIDIA GeForce GTX 1660 Ti Max-Q (41.1 - 41.6, n=2) | |
| HP Pavilion Gaming 15-ec0017ng | |
| MSI Alpha 15 A3DDK | |
| Átlagos NVIDIA GeForce GTX 1650 Mobile (24.4 - 26.9, n=4) | |
| Dell G5 15 5590-PCNJJ | |
| alacsony | közepes | magas | ultra | QHD | 4K | |
|---|---|---|---|---|---|---|
| Counter-Strike: GO (2012) | 191 | 137 | 76.3 | |||
| BioShock Infinite (2013) | 201 | 169 | 123 | |||
| GTA V (2015) | 93 | 48.6 | 20.2 | |||
| The Witcher 3 (2015) | 165 | 72 | 43.6 | |||
| Dota 2 Reborn (2015) | 93 | 86 | 81 | 72 | 53 | |
| World of Warships (2015) | 93 | 54.9 | ||||
| Rainbow Six Siege (2015) | 151 | 143 | 59.6 | |||
| Overwatch (2016) | 124 | 109 | 74 | |||
| Rocket League (2017) | 175 | 175 | 72 | |||
| Playerunknown's Battlegrounds (PUBG) (2017) | 59.4 | |||||
| Middle-earth: Shadow of War (2017) | 70 | 24 | ||||
| Assassin´s Creed Origins (2017) | 41 | 35 | ||||
| Fortnite (2018) | 65 | |||||
| Far Cry 5 (2018) | 62 | 59 | 48 | |||
| Shadow of the Tomb Raider (2018) | 59 | 53 | 32 | 15 | ||
| Assassin´s Creed Odyssey (2018) | 48 | 43 | 40 | 31 | ||
| Call of Duty Black Ops 4 (2018) | 67.5 | 53.9 | 28.8 | |||
| Battlefield V (2018) | 61 | 43.7 | 16.2 | |||
| Farming Simulator 19 (2018) | 70 | 49.1 | 32.8 | |||
| Apex Legends (2019) | 72 | 51.7 | 28.4 | |||
| Far Cry New Dawn (2019) | 51 | 47 | 25 | |||
| Metro Exodus (2019) | 92.3 | 45.4 | 38.1 | 32.2 | 25 | |
| Anthem (2019) | 48 (stuttering) | 47 (stuttering) | 44 (stuttering) | 32 (stuttering) | ||
| Dirt Rally 2.0 (2019) | 58.4 | 38.1 | 22.8 | |||
| The Division 2 (2019) | 51 | 42 | ||||
| Anno 1800 (2019) | 60 | 46.3 | 23.9 | |||
| Rage 2 (2019) | 67 | 55.7 | 53.4 | 15.4 | ||
| Total War: Three Kingdoms (2019) | 134 | 69.1 | 48.7 | 35.8 | 19.4 | 6.9 |
| F1 2019 (2019) | 79 | 74 | 64 | 64 | 49.1 | 33.3 |
| Control (2019) | 119 | 47.5 | 34.2 | |||
| Borderlands 3 (2019) | 76 | 66 | 47.2 | 35.6 | 23.9 | 6.7 |
| FIFA 20 (2019) | 122 | 122 | 96 | |||
| Ghost Recon Breakpoint (2019) | 58 | 53 | 48 | 26 | ||
| GRID 2019 (2019) | 81 | 67 | 36.7 | 29.9 | 15.2 | |
| Call of Duty Modern Warfare 2019 (2019) | 112 | 94 | 81 | 64 | 35.4 | 20.1 |
| Need for Speed Heat (2019) | 63 | 57.7 | 52.3 | 45.8 | 41 | 14.1 |
| Star Wars Jedi Fallen Order (2019) | 58.6 | 40.1 | 19.8 | |||
| Red Dead Redemption 2 (2019) | 92 | 63 | 40.5 | 23.8 | ||
| God of War (2022) | 36.1 | 36 | 33 | 9.06 | ||
| Rainbow Six Extraction (2022) | 95 | 78 | 76 | 36 | ||
| GRID Legends (2022) | 81 | 71.8 | 71.1 | 59.2 | ||
| Elden Ring (2022) | 37 | 35.8 | 35.2 | 35.2 | ||
| Cyberpunk 2077 1.6 (2022) | 55.9 | 44.9 | 34.4 | 27.7 | ||
| Elex 2 (2022) | 20.1 | 19.3 | 19.4 | 18.8 | ||
| Ghostwire Tokyo (2022) | 56 | 56 | 55.7 | 54.9 | ||
| Tiny Tina's Wonderlands (2022) | 88.5 | 71.2 | 38.6 | 28.3 | ||
| Vampire Bloodhunt (2022) | 93.8 | 82.1 | 78.7 | 77.3 | ||
| F1 22 (2022) | 95 | 92 | 78 | 66 | ||
| The Quarry (2022) | 65.5 | 47 | 40.3 | 23.8 | ||
| FIFA 23 (2022) | 46.6 | 38.4 | 33.3 | 33.2 | ||
| A Plague Tale Requiem (2022) | 47.2 | 36.9 | 26.9 | 20.7 | ||
| Uncharted Legacy of Thieves Collection (2022) | 36.6 | 32.3 | 20.6 | 18.6 | ||
| Call of Duty Modern Warfare 2 2022 (2022) | 70 | 66 | 56 | 43 | ||
| Spider-Man Miles Morales (2022) | 48 | 43.3 | 30.6 | 26 | ||
| The Callisto Protocol (2022) | 57.7 | 47.4 | 29.8 | 28.6 | ||
| Need for Speed Unbound (2022) | 43.2 | 41 | 34.7 | 27.3 |
Zajszint
| Üresjárat |
| 31.1 / 34.8 / 35.5 dB(A) |
| Terhelés |
| 43 / 53.6 dB(A) |
 | ||
30 dB csendes 40 dB(A) hallható 50 dB(A) hangos |
||
min: | ||
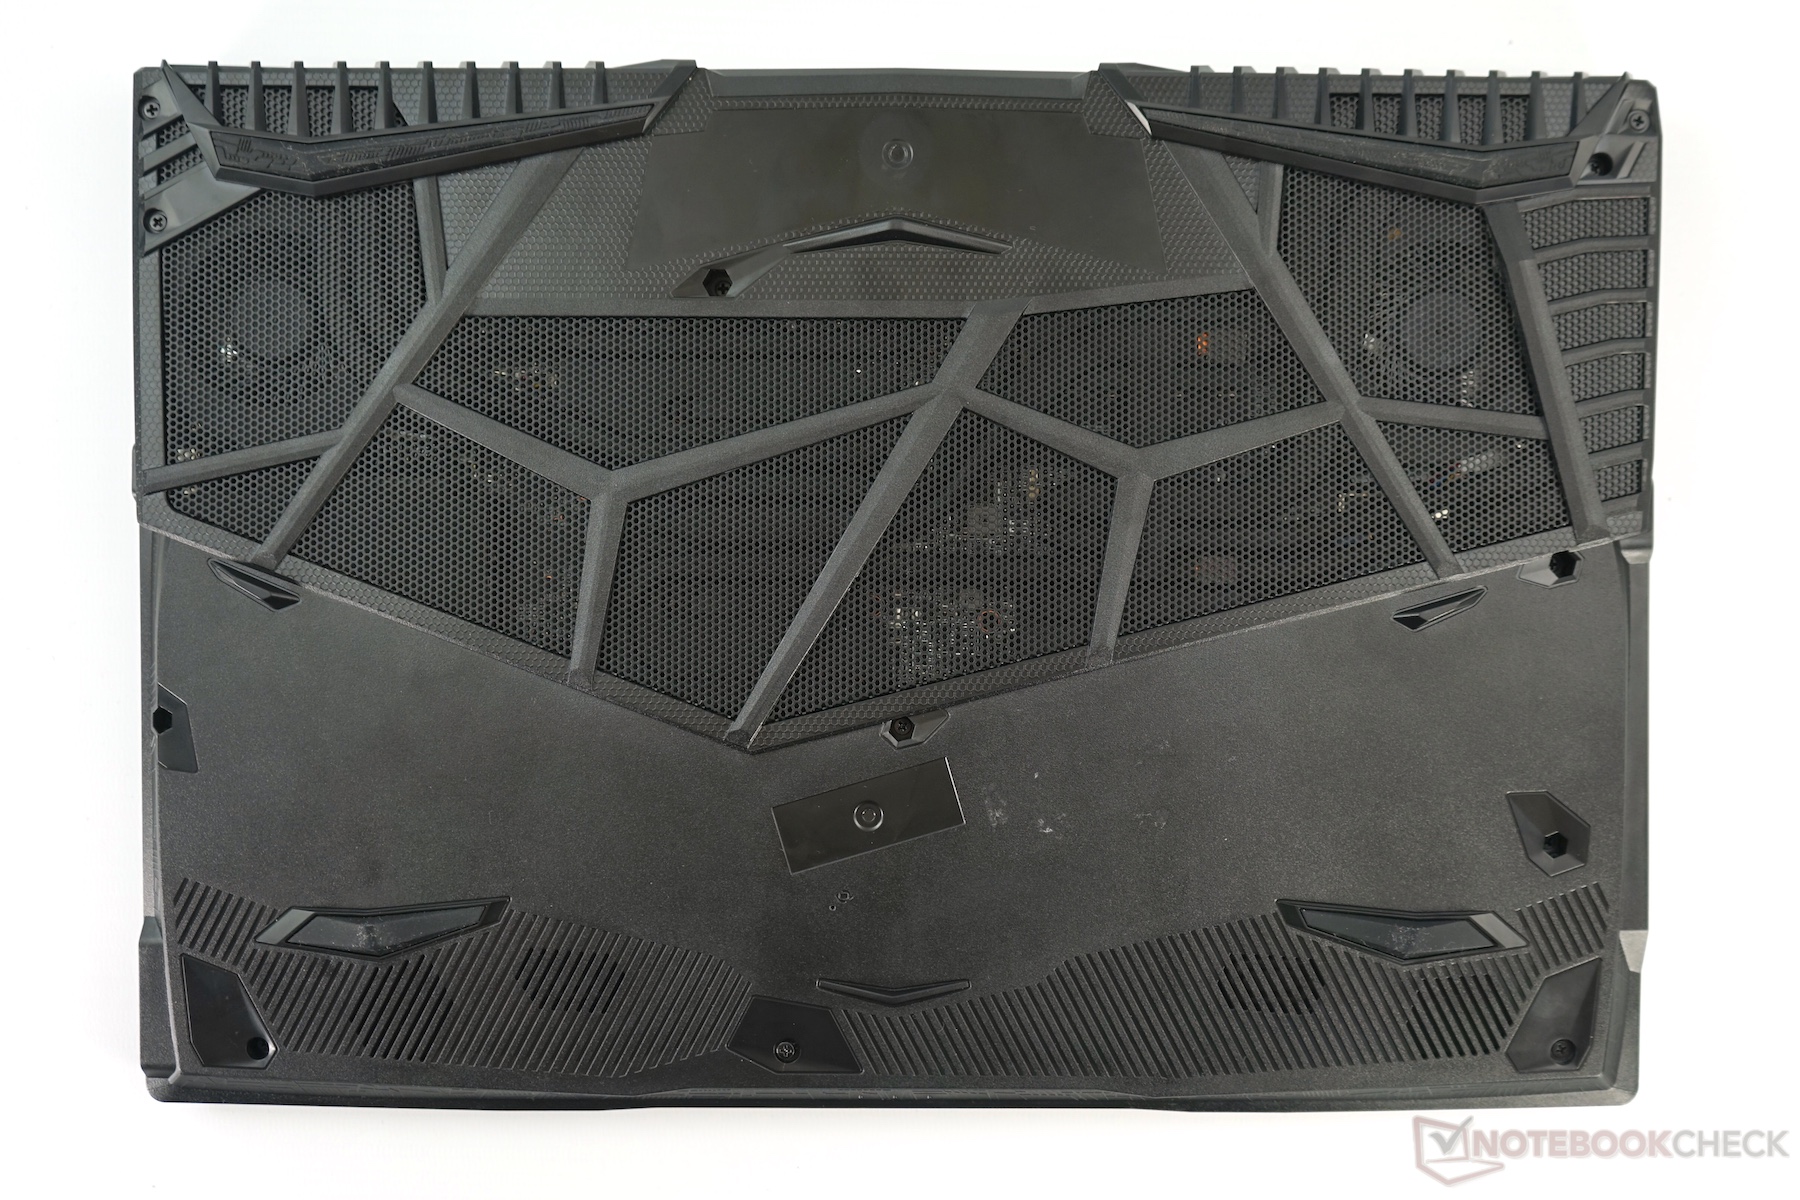
(±) A felső oldalon a maximális hőmérséklet 42 °C / 108 F, összehasonlítva a 40.4 °C / 105 F átlagával , 21.2 és 68.8 °C között a Gaming osztálynál.
(±) Az alsó maximum 45 °C / 113 F-ig melegszik fel, összehasonlítva a 43.2 °C / 110 F átlagával
(+) Üresjáratban a felső oldal átlagos hőmérséklete 29.1 °C / 84 F, összehasonlítva a 33.9 °C / ### eszközátlaggal class_avg_f### F.
(+) A The Witcher 3 játék során a felső oldal átlaghőmérséklete 31.3 °C / 88 F, összehasonlítva a 33.9 °C / ## eszközátlaggal #class_avg_f### F.
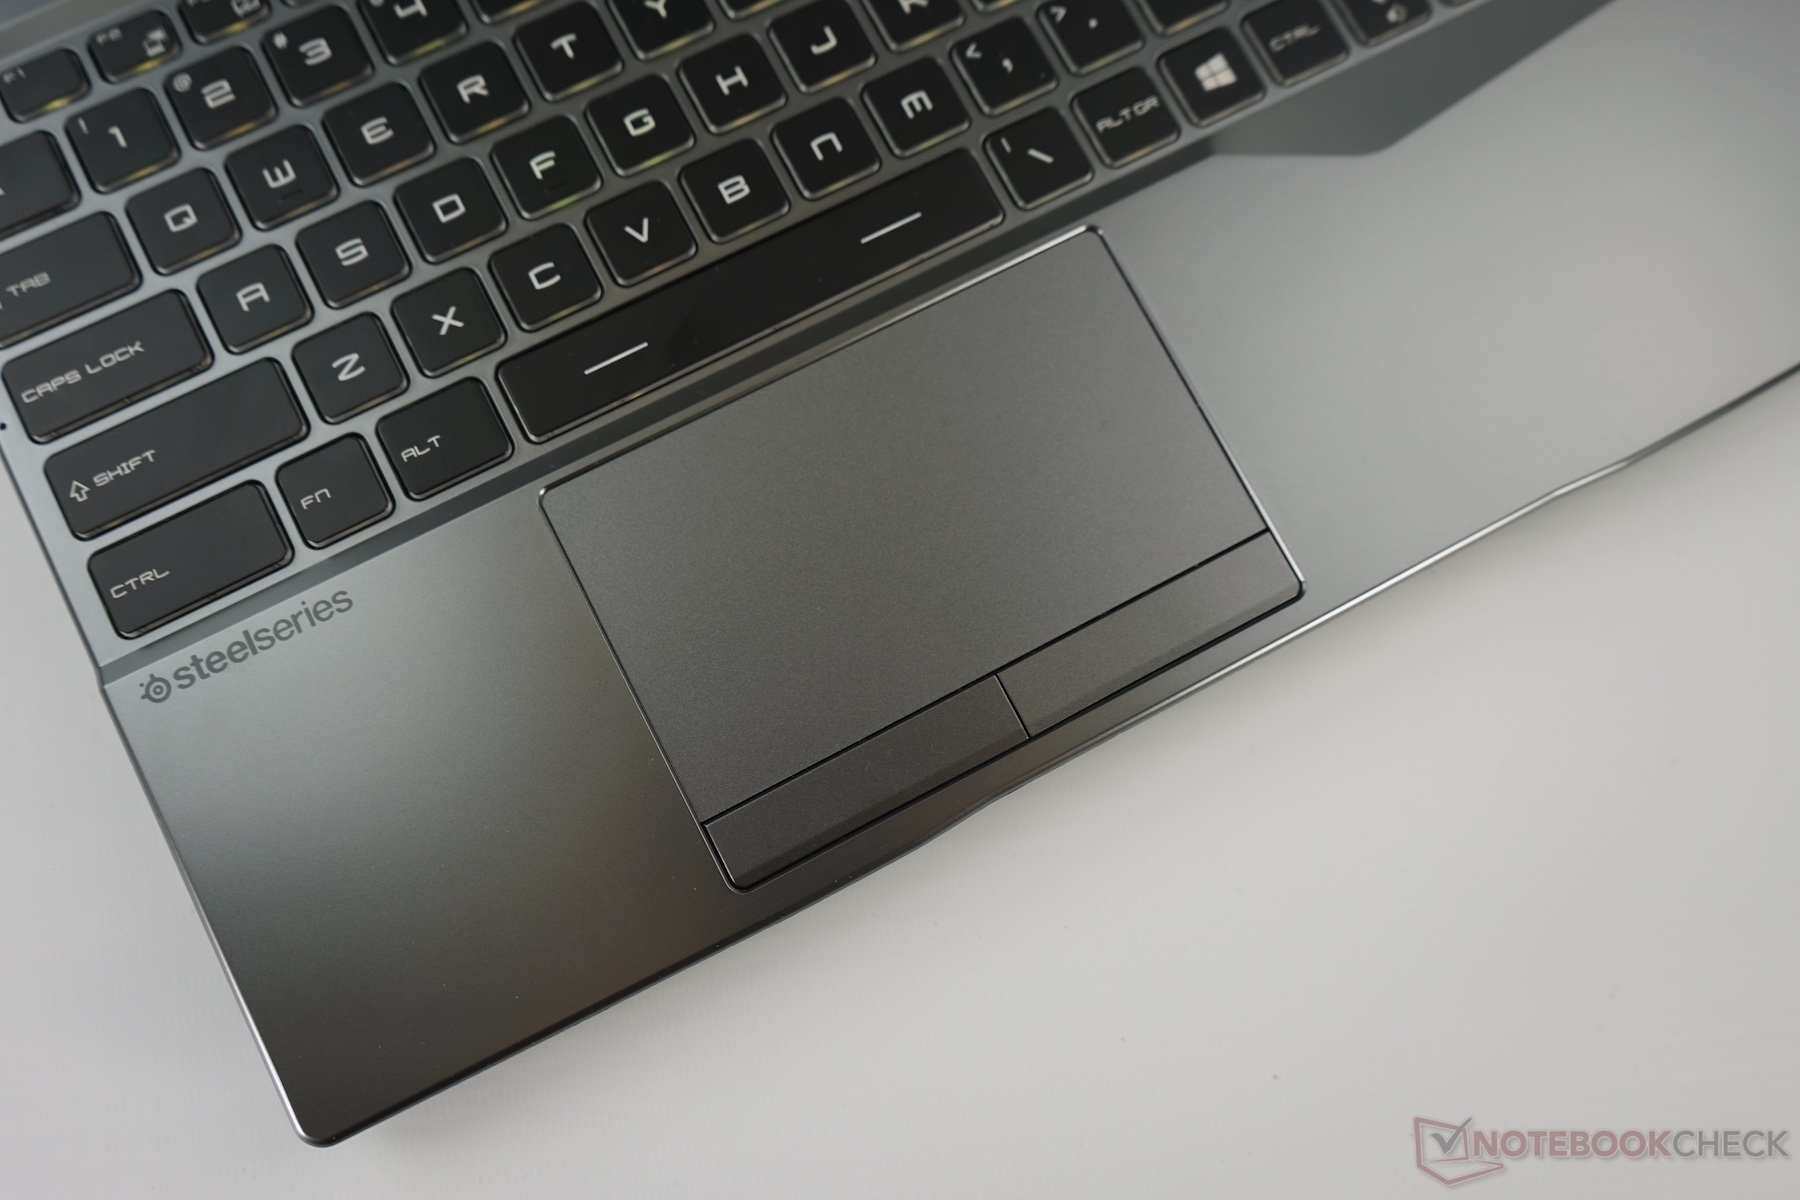
(+) A csuklótámasz és az érintőpad eléri a bőr maximális hőmérsékletét (32 °C / 89.6 F), ezért nem forrók.
(-) A hasonló eszközök csuklótámasz területének átlagos hőmérséklete 28.8 °C / 83.8 F volt (-3.2 °C / -5.8 F).
MSI Alpha 15 A3DDK hangelemzés
(+) | a hangszórók viszonylag hangosan tudnak játszani (90.6 dB)
Basszus 100 - 315 Hz
(-) | szinte nincs basszus – átlagosan 26.4%-kal alacsonyabb a mediánnál
(±) | a basszus linearitása átlagos (7.3% delta az előző frekvenciához)
Közepes 400-2000 Hz
(±) | magasabb középértékek – átlagosan 6.9%-kal magasabb, mint a medián
(±) | a középpontok linearitása átlagos (7.6% delta az előző gyakorisághoz)
Maximum 2-16 kHz
(+) | kiegyensúlyozott csúcsok – csak 2% választja el a mediántól
(+) | a csúcsok lineárisak (6.2% delta az előző frekvenciához képest)
Összességében 100 - 16.000 Hz
(±) | az általános hang linearitása átlagos (17.7% eltérés a mediánhoz képest)
Ugyanazon osztályhoz képest
» 52%Ebben az osztályban az összes tesztelt eszköz %-a jobb volt, 10% hasonló, 38%-kal rosszabb
» A legjobb delta értéke 6%, az átlag 18%, a legrosszabb 132% volt
Az összes tesztelt eszközzel összehasonlítva
» 35% az összes tesztelt eszköz jobb volt, 8% hasonló, 57%-kal rosszabb
» A legjobb delta értéke 4%, az átlag 24%, a legrosszabb 134% volt
Apple MacBook 12 (Early 2016) 1.1 GHz hangelemzés
(+) | a hangszórók viszonylag hangosan tudnak játszani (83.6 dB)
Basszus 100 - 315 Hz
(±) | csökkentett basszus – átlagosan 11.3%-kal alacsonyabb, mint a medián
(±) | a basszus linearitása átlagos (14.2% delta az előző frekvenciához)
Közepes 400-2000 Hz
(+) | kiegyensúlyozott középpontok – csak 2.4% választja el a mediántól
(+) | a középpontok lineárisak (5.5% delta az előző frekvenciához)
Maximum 2-16 kHz
(+) | kiegyensúlyozott csúcsok – csak 2% választja el a mediántól
(+) | a csúcsok lineárisak (4.5% delta az előző frekvenciához képest)
Összességében 100 - 16.000 Hz
(+) | általános hangzás lineáris (10.2% eltérés a mediánhoz képest)
Ugyanazon osztályhoz képest
» 7%Ebben az osztályban az összes tesztelt eszköz %-a jobb volt, 2% hasonló, 91%-kal rosszabb
» A legjobb delta értéke 5%, az átlag 18%, a legrosszabb 53% volt
Az összes tesztelt eszközzel összehasonlítva
» 5% az összes tesztelt eszköz jobb volt, 1% hasonló, 94%-kal rosszabb
» A legjobb delta értéke 4%, az átlag 24%, a legrosszabb 134% volt
| Kikapcsolt állapot / Készenlét | |
| Üresjárat | |
| Terhelés |
|
Kulcs:
min: | |
| MSI Alpha 15 A3DDK R7 3750H, Radeon RX 5500M, Toshiba KBG30ZMV256G, IPS, 1920x1080, 15.6" | Asus TUF FX505DT-EB73 R7 3750H, GeForce GTX 1650 Mobile, Intel SSD 660p SSDPEKNW512G8, IPS, 1920x1080, 15.6" | Dell G3 3590 i5-9300H, GeForce GTX 1650 Mobile, Toshiba BG4 KBG40ZNS128G, IPS, 1920x1080, 15.6" | Acer Aspire Nitro 5 AN515-54-53Z2 i5-9300H, GeForce GTX 1650 Mobile, WDC PC SN520 SDAPNUW-512G, IPS, 1920x1080, 15.6" | Asus ROG Zephyrus G15 GA502DU R7 3750H, GeForce GTX 1660 Ti Max-Q, Intel SSD 660p SSDPEKNW512G8, IPS, 1920x1080, 15.6" | Lenovo IdeaPad L340-15IRH 81LK00BMGE i5-9300H, GeForce GTX 1650 Mobile, WDC PC SN520 SDAPMUW-512, IPS, 1920x1080, 15.6" | HP Omen 15-dc1020ng i5-9300H, GeForce GTX 1650 Mobile, WDC PC SN720 SDAQNTW-512G, IPS, 1920x1080, 15.6" | Dell G5 15 5590-PCNJJ i5-9300H, GeForce GTX 1650 Mobile, KBG30ZMS128G, IPS, 1920x1080, 15.6" | HP Pavilion Gaming 15-ec0017ng R7 3750H, GeForce GTX 1660 Ti Max-Q, WDC PC SN720 SDAPNTW-256G, IPS, 1920x1080, 15.6" | |
|---|---|---|---|---|---|---|---|---|---|
| Power Consumption | 32% | 18% | 35% | 11% | 43% | 36% | 34% | 38% | |
| Idle Minimum * (Watt) | 11.7 | 7 40% | 6.2 47% | 5 57% | 7.4 37% | 3.8 68% | 4.04 65% | 4 66% | 3.4 71% |
| Idle Average * (Watt) | 15.7 | 9.9 37% | 8.4 46% | 7 55% | 8.6 45% | 6.6 58% | 7.2 54% | 7 55% | 7.6 52% |
| Idle Maximum * (Watt) | 22.4 | 12 46% | 27.7 -24% | 11 51% | 39.1 -75% | 8.9 60% | 11.4 49% | 12 46% | 10.2 54% |
| Load Average * (Watt) | 70.7 | 68.4 3% | 91 -29% | 89 -26% | 65.9 7% | 78.4 -11% | 80.8 -14% | 95 -34% | 73 -3% |
| Witcher 3 ultra * (Watt) | 148 | 94.9 36% | 94.4 36% | 90 39% | 106.9 28% | 82 45% | 93.6 37% | 86 42% | 107 28% |
| Load Maximum * (Watt) | 191 | 130.9 31% | 131.5 31% | 132 31% | 141.3 26% | 124 35% | 144.5 24% | 135 29% | 140.5 26% |
* ... a kisebb jobb
Előzetes Összegzés
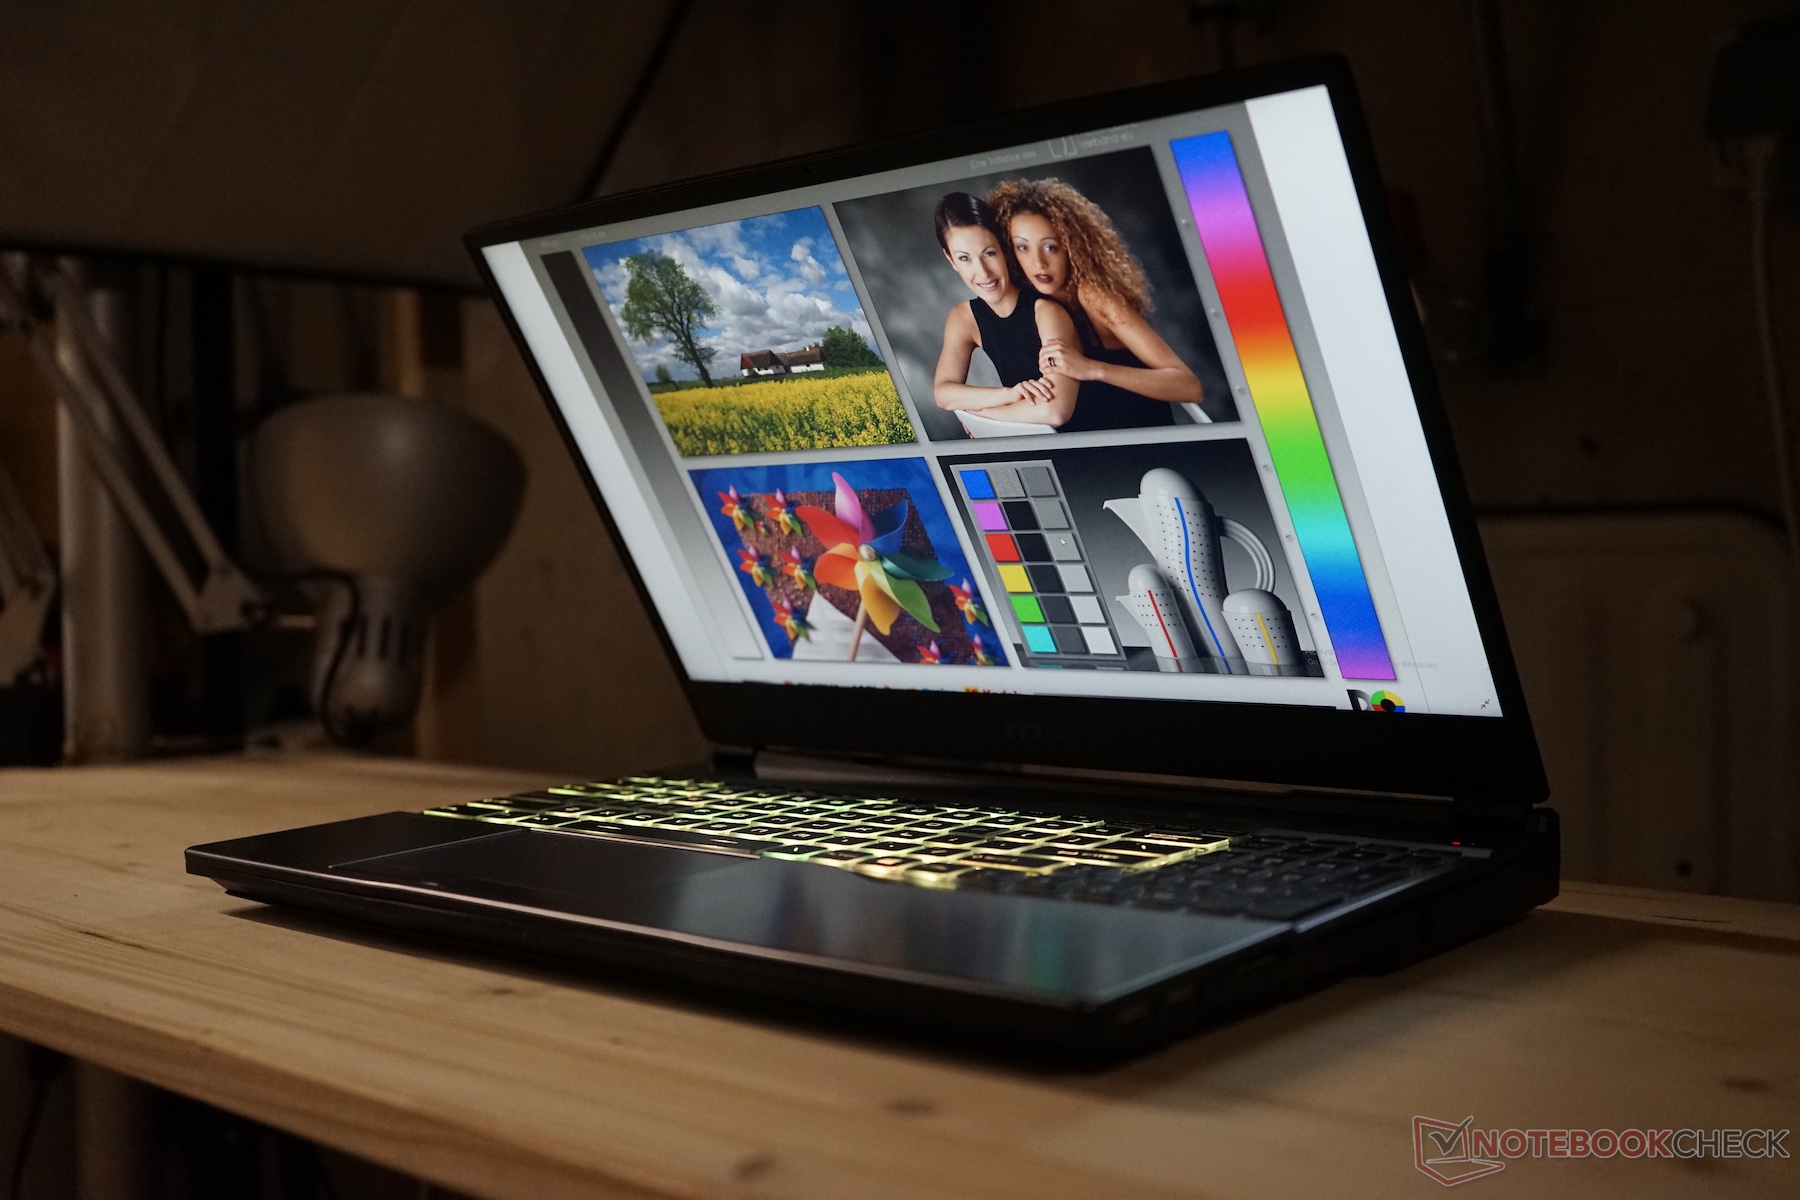
Habár az MSI nem próbálta meg letarolni a kategóriája csúcsán levő Alpha 15-öt, de egy olyan csomaggal jött elő, amely alig enyhén provokálja a középkategóriát, amelyet eddig az Intel és az NVIDIA uralt. Röviden, az Alpha 15 kiindulási pontot jelent egy olyan piacra, amelyben az AMD gyökeret ereszthet.
Az Alpha 15 legfőbb jellemzője a Radeon RX 5500M GPU, amely az AMD Navi architektúráján alapszik. A 7 nm-es processzorra épített GPU a GeForce GTX 1650 és a GTX 1660 Ti Max-Q között helyezkedik el, papíron, és ezt a gyártás előtti modellen végzett tesztjeink is igazolták. Az viszont megjegyzendő, hogy a lehetséges eredmények skálája egyelőre széles. Például, míg az RX 5500M nem haladja meg a GTX 1650 szintjét bizonyos játékokban, másokban viszont a GTX 1660 Ti Max-Q szintjét éri el. Általánosan értékelve amúgy a kettő között helyezkedik el.
Az MSI Alpha 15 képes felvenni a versenyt a Core i5-9300H-val, és bizonyos játékokban a GeForce 1660 Ti Max-Q által hajtott laptopokkal is a Ryzen 7 3750H processzornak és az új Radeon RX 5500M GPU-nak köszönhetően.
Az, hogy a készülékről az AMD vagy az MSI sikereként lehet-e beszélni, attól függ, hogy az Alpha 15 milyen áron kerül piacra. Előzetes információk arra engednek következtetni, hogy a gép 999 és 1099 dollár között fog piacra kerülni a 120 és 144 Hz-es opciók esetében, ezzel az árral pedig az Alpha 15-öt meghaladja a Core i5-9300H és GTX 1650 alapú gépeket, amelyek általában jóval 1000 dollár alatt vannak. Mondjuk a GTX 1660 Ti Max-Q laptopok általában meghaladják az 1000 dollárt, így az RX 5500M már kedvezőbb fényben tűnik fel. Úgy képzeljük, hogy a három GPU közötti döntés attól fog függeni, hogy milyen funkciókat kínálnak az adott laptopok is, amelyekben helyet kapnak.
Összességében, az Alpha 15 pozitív benyomást keltett a Radeon RX 5500M és az RDNA architektúrát illetően a laptopokon. Úgy tűnik, hogy az AMD és az NVIDIA közötti döntés újra nehéz lesz, bár azt még nem tudni, hogy az AMD mennyire lesz képes behatolni a csúcskategóriás gamer notebookok szegmensébe. Ami biztos, hogy az RX 5500M-nél erősebb laptop GPU-k valószínűleg már útban vannak.
Price comparison

