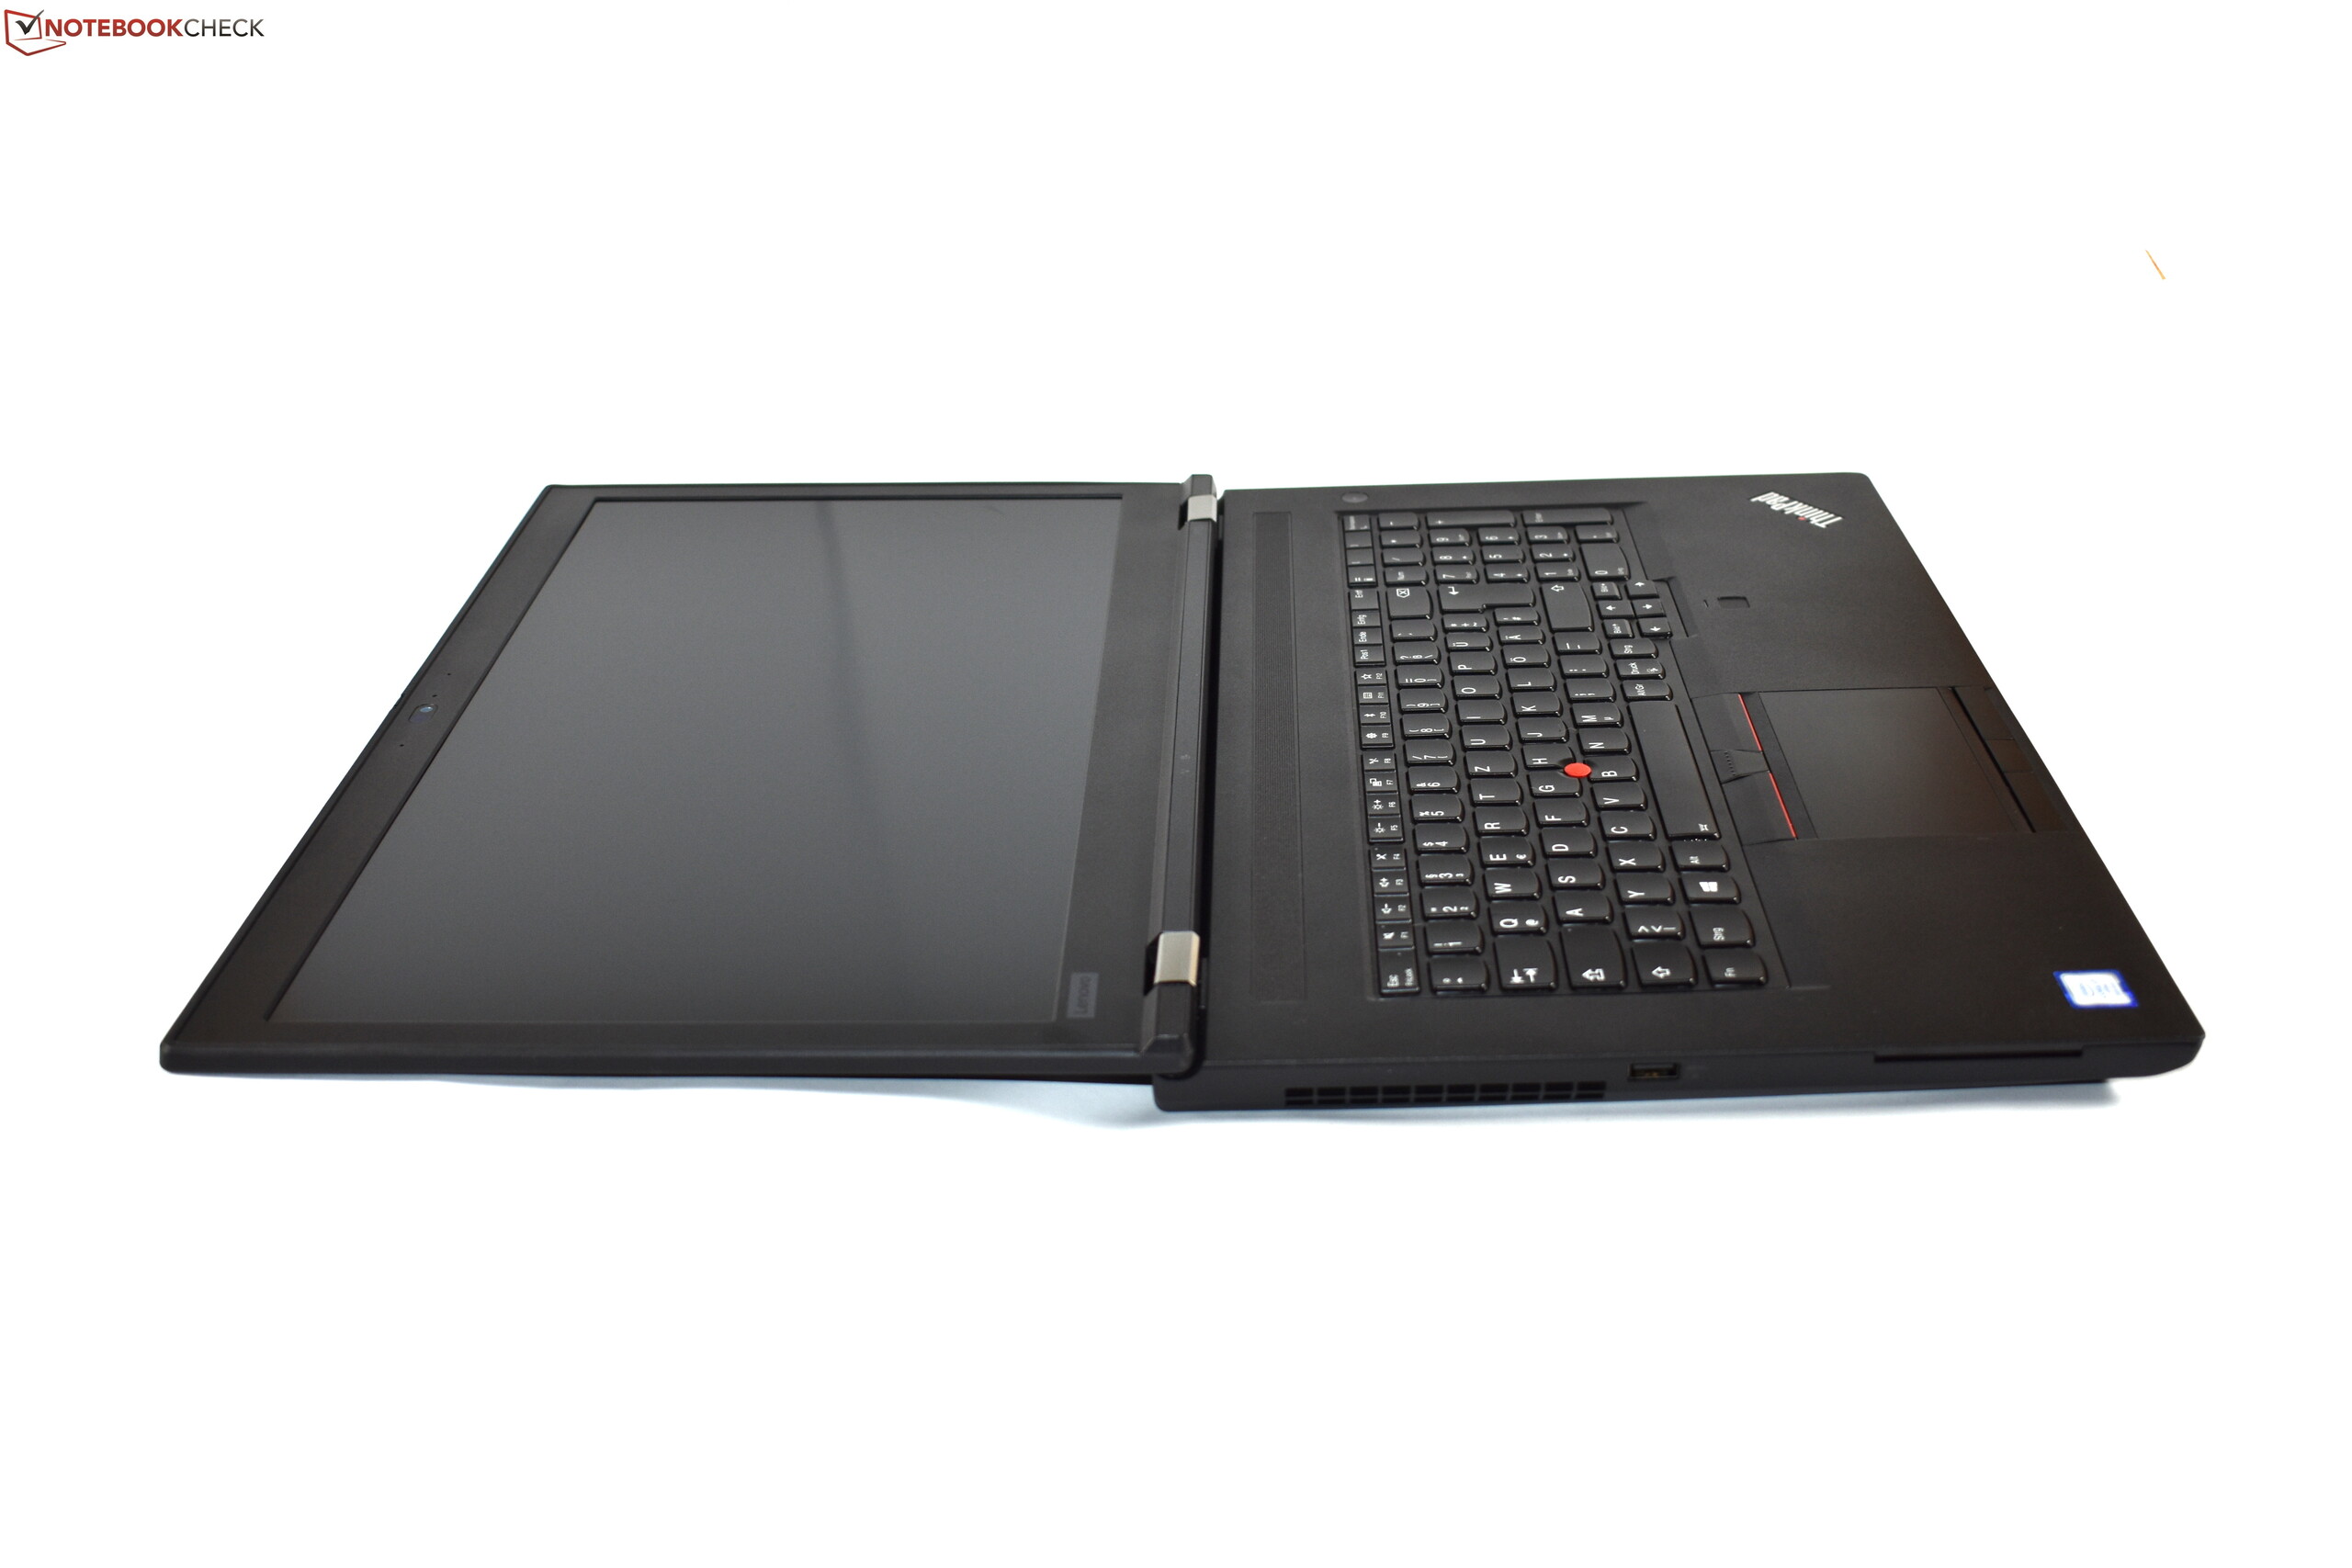
Lenovo ThinkPad P73 Laptop rövid értékelés: Nagy munkaállomás gyenge hőkezelés által lassítva
Értékelés | Dátum | Modell | Súly | Magasság | Méret | Felbontás | Legjobb ár |
|---|---|---|---|---|---|---|---|
| 86.6 % v7 (old) | 01/2020 | Lenovo ThinkPad P73-20QR002DGE i7-9850H, Quadro RTX 3000 (Laptop) | 3.5 kg | 31 mm | 17.30" | 1920x1080 | |
| 85.7 % v7 (old) | Dell Precision 7730 i7-8850H, Quadro P3200 | 3.3 kg | 30 mm | 17.30" | 1920x1080 | ||
| 84.6 % v7 (old) | Fujitsu Celsius H980 i7-8750H, Quadro P3200 | 3.5 kg | 30 mm | 17.30" | 1920x1080 | ||
| 85.2 % v7 (old) | MSI WT75 8SM E-2176G, Quadro P5200 | 4.1 kg | 51 mm | 17.30" | 3840x2160 | ||
v (old) | Lenovo ThinkPad P72-20MB000EGE i7-8850H, Quadro P3200 | 3.4 kg | 29.4 mm | 17.30" | 1920x1080 |

| SD Card Reader | |
| average JPG Copy Test (av. of 3 runs) | |
| Dell Precision 7730 (Toshiba Exceria Pro SDXC 64 GB UHS-II) | |
| Lenovo ThinkPad P73-20QR002DGE (Toshiba Exceria Pro SDXC 64 GB UHS-II) | |
| MSI WT75 8SM (Toshiba Exceria Pro SDXC 64 GB UHS-II) | |
| Lenovo ThinkPad P72-20MB000EGE (Toshiba Exceria Pro SDXC 64 GB UHS-II) | |
| Fujitsu Celsius H980 (Toshiba Exceria Pro SDXC 64 GB UHS-II) | |
| Az osztály átlaga Workstation (49.6 - 681, n=14, az elmúlt 2 évben) | |
| maximum AS SSD Seq Read Test (1GB) | |
| Az osztály átlaga Workstation (87.6 - 1455, n=14, az elmúlt 2 évben) | |
| Dell Precision 7730 (Toshiba Exceria Pro SDXC 64 GB UHS-II) | |
| Lenovo ThinkPad P73-20QR002DGE (Toshiba Exceria Pro SDXC 64 GB UHS-II) | |
| Lenovo ThinkPad P72-20MB000EGE (Toshiba Exceria Pro SDXC 64 GB UHS-II) | |
| MSI WT75 8SM (Toshiba Exceria Pro SDXC 64 GB UHS-II) | |
| Fujitsu Celsius H980 (Toshiba Exceria Pro SDXC 64 GB UHS-II) | |
| Networking | |
| iperf3 transmit AX12 | |
| Dell Precision 7730 | |
| Lenovo ThinkPad P73-20QR002DGE | |
| Fujitsu Celsius H980 | |
| Lenovo ThinkPad P72-20MB000EGE | |
| MSI WT75 8SM | |
| iperf3 receive AX12 | |
| Fujitsu Celsius H980 | |
| Lenovo ThinkPad P72-20MB000EGE | |
| MSI WT75 8SM | |
| Dell Precision 7730 | |
| Lenovo ThinkPad P73-20QR002DGE | |
| |||||||||||||||||||||||||
Fényerő megoszlás: 83 %
Centrumban: 332 cd/m²
Kontraszt: 854:1 (Fekete: 0.39 cd/m²)
ΔE ColorChecker Calman: 4.4 | ∀{0.5-29.43 Ø4.72}
calibrated: 2
ΔE Greyscale Calman: 5.1 | ∀{0.09-98 Ø4.97}
94% sRGB (Argyll 1.6.3 3D)
61.1% AdobeRGB 1998 (Argyll 1.6.3 3D)
67.8% AdobeRGB 1998 (Argyll 3D)
94.2% sRGB (Argyll 3D)
67.5% Display P3 (Argyll 3D)
Gamma: 2.39
CCT: 7061 K
| Lenovo ThinkPad P73-20QR002DGE N173HCE-E31, IPS LED, 1920x1080, 17.3" | Dell Precision 7730 B173HAN01.3, IPS LED, 1920x1080, 17.3" | Fujitsu Celsius H980 LG Philips, LP173WF4-SPF5, IPS, 1920x1080, 17.3" | MSI WT75 8SM AU Optronics B173ZAN01.0, IPS, 3840x2160, 17.3" | Lenovo ThinkPad P72-20MB000EGE LP173WF4_SPF7, IPS, 1920x1080, 17.3" | |
|---|---|---|---|---|---|
| Display | -2% | -6% | 22% | -6% | |
| Display P3 Coverage (%) | 67.5 | 65 -4% | 67.3 0% | 80.8 20% | 67.4 0% |
| sRGB Coverage (%) | 94.2 | 93.4 -1% | 85 -10% | 98.3 4% | 85 -10% |
| AdobeRGB 1998 Coverage (%) | 67.8 | 66.3 -2% | 62.2 -8% | 95.3 41% | 62.2 -8% |
| Response Times | -20% | 11% | 11% | -3% | |
| Response Time Grey 50% / Grey 80% * (ms) | 40 ? | 48.8 ? -22% | 38 ? 5% | 36 ? 10% | 40.8 ? -2% |
| Response Time Black / White * (ms) | 28 ? | 32.8 ? -17% | 23.2 ? 17% | 24.8 ? 11% | 28.8 ? -3% |
| PWM Frequency (Hz) | 25000 ? | 120500 ? | |||
| Screen | 23% | -13% | 6% | -0% | |
| Brightness middle (cd/m²) | 333 | 322 -3% | 400 20% | 327.9 -2% | 338 2% |
| Brightness (cd/m²) | 310 | 316 2% | 394 27% | 311 0% | 317 2% |
| Brightness Distribution (%) | 83 | 84 1% | 92 11% | 88 6% | 86 4% |
| Black Level * (cd/m²) | 0.39 | 0.24 38% | 0.51 -31% | 0.43 -10% | 0.28 28% |
| Contrast (:1) | 854 | 1342 57% | 784 -8% | 763 -11% | 1207 41% |
| Colorchecker dE 2000 * | 4.4 | 2.2 50% | 5.3 -20% | 4.41 -0% | 4.3 2% |
| Colorchecker dE 2000 max. * | 7.5 | 4.6 39% | 9.3 -24% | 10.07 -34% | 10.2 -36% |
| Colorchecker dE 2000 calibrated * | 2 | 1.9 5% | 3.8 -90% | 1.43 28% | 3.7 -85% |
| Greyscale dE 2000 * | 5.1 | 1.6 69% | 5.5 -8% | 2.9 43% | 2.2 57% |
| Gamma | 2.39 92% | 2.19 100% | 2.17 101% | 2.17 101% | 2.17 101% |
| CCT | 7061 92% | 6621 98% | 6686 97% | 6916 94% | 6621 98% |
| Color Space (Percent of AdobeRGB 1998) (%) | 61.1 | 60.4 -1% | 55.8 -9% | 84.2 38% | 55.8 -9% |
| Color Space (Percent of sRGB) (%) | 94 | 93.3 -1% | 84.9 -10% | 99 5% | 84.7 -10% |
| Teljes átlag (program / beállítások) | 0% /
13% | -3% /
-9% | 13% /
9% | -3% /
-2% |
* ... a kisebb jobb
Megjelenítési válaszidők
| ↔ Válaszidő Fekete-fehér | ||
|---|---|---|
| 28 ms ... emelkedés és süllyedés ↘ kombinálva | ↗ 17.2 ms emelkedés | 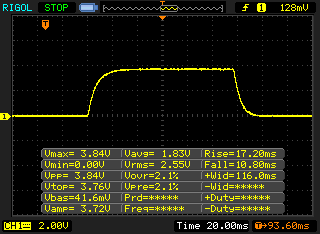 |
| ↘ 10.8 ms ősz | ||
| A képernyő viszonylag lassú reakciósebességet mutat tesztjeinkben, és túl lassú lehet a játékosok számára. Összehasonlításképpen, az összes tesztelt eszköz 0.1 (minimum) és 240 (maximum) ms között mozog. » 71 % of all devices are better. Ez azt jelenti, hogy a mért válaszidő rosszabb, mint az összes vizsgált eszköz átlaga (19.8 ms). | ||
| ↔ Válaszidő 50% szürke és 80% szürke között | ||
| 40 ms ... emelkedés és süllyedés ↘ kombinálva | ↗ 20.4 ms emelkedés | 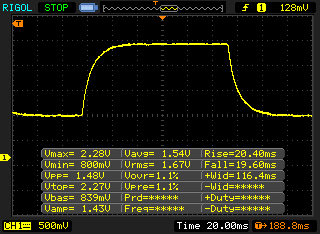 |
| ↘ 19.6 ms ősz | ||
| A képernyő lassú reakciósebességet mutat tesztjeinkben, és nem lesz kielégítő a játékosok számára. Összehasonlításképpen, az összes tesztelt eszköz 0.165 (minimum) és 636 (maximum) ms között mozog. » 61 % of all devices are better. Ez azt jelenti, hogy a mért válaszidő rosszabb, mint az összes vizsgált eszköz átlaga (31 ms). | ||
Képernyő villogása / PWM (impulzusszélesség-moduláció)
| Képernyő villogása / PWM észlelve | 25000 Hz | ≤ 50 % fényerő beállítása | 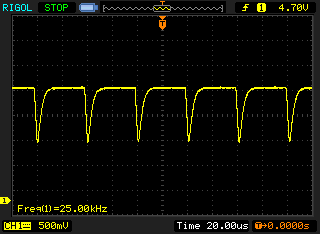 |
A kijelző háttérvilágítása 25000 Hz-en villog (a legrosszabb esetben, pl. PWM használatával) Villódzás észlelve a 50 % vagy annál kisebb fényerő-beállításnál. E fényerő-beállítás felett nem lehet villogás vagy PWM. A 25000 Hz frekvenciája meglehetősen magas, így a legtöbb PWM-re érzékeny felhasználó nem észlel semmilyen villogást. Összehasonlításképpen: az összes tesztelt eszköz 52 %-a nem használja a PWM-et a kijelző elsötétítésére. Ha PWM-et észleltek, akkor átlagosan 7769 (minimum: 5 - maximum: 343500) Hz-t mértek. | |||
| Cinebench R15 | |
| CPU Single 64Bit | |
| Az osztály átlaga Workstation (191.4 - 328, n=24, az elmúlt 2 évben) | |
| MSI WT75 8SM | |
| Átlagos Intel Core i7-9850H (192 - 196.5, n=3) | |
| Lenovo ThinkPad P73-20QR002DGE | |
| Lenovo ThinkPad P72-20MB000EGE | |
| Dell Precision 7730 | |
| Fujitsu Celsius H980 | |
| CPU Multi 64Bit | |
| Az osztály átlaga Workstation (2489 - 5810, n=24, az elmúlt 2 évben) | |
| MSI WT75 8SM | |
| Dell Precision 7730 | |
| Lenovo ThinkPad P73-20QR002DGE | |
| Lenovo ThinkPad P72-20MB000EGE | |
| Lenovo ThinkPad P72-20MB000EGE | |
| Átlagos Intel Core i7-9850H (1114 - 1272, n=3) | |
| Fujitsu Celsius H980 | |
| PCMark 8 | |
| Home Score Accelerated v2 | |
| MSI WT75 8SM | |
| Dell Precision 7730 | |
| Lenovo ThinkPad P72-20MB000EGE | |
| Fujitsu Celsius H980 | |
| Lenovo ThinkPad P73-20QR002DGE | |
| Átlagos Intel Core i7-9850H, NVIDIA Quadro RTX 3000 (Laptop) (n=1) | |
| Work Score Accelerated v2 | |
| Lenovo ThinkPad P72-20MB000EGE | |
| Dell Precision 7730 | |
| Lenovo ThinkPad P73-20QR002DGE | |
| Átlagos Intel Core i7-9850H, NVIDIA Quadro RTX 3000 (Laptop) (n=1) | |
| Fujitsu Celsius H980 | |
| MSI WT75 8SM | |
| PCMark 8 Home Score Accelerated v2 | 4271 pontok | |
| PCMark 8 Creative Score Accelerated v2 | 4087 pontok | |
| PCMark 8 Work Score Accelerated v2 | 5432 pontok | |
| PCMark 10 Score | 5768 pontok | |
Segítség | ||
| Lenovo ThinkPad P73-20QR002DGE Intel SSD Pro 7600p SSDPEKKF512G8L | Dell Precision 7730 Samsung SSD PM981 MZVLB512HAJQ | Fujitsu Celsius H980 Samsung SSD PM981 MZVLB512HAJQ | MSI WT75 8SM Samsung SSD PM981 MZVLB512HAJQ | Lenovo ThinkPad P72-20MB000EGE Lenovo LENSE20256GMSP34MEAT2TA | Átlagos Intel SSD Pro 7600p SSDPEKKF512G8L | |
|---|---|---|---|---|---|---|
| CrystalDiskMark 5.2 / 6 | -12% | -20% | -8% | -19% | -11% | |
| Write 4K (MB/s) | 154.3 | 103.2 -33% | 111.8 -28% | 131.4 -15% | 101 -35% | 133.9 ? -13% |
| Read 4K (MB/s) | 66.4 | 41.39 -38% | 32.02 -52% | 46.15 -30% | 45.37 -32% | 59.1 ? -11% |
| Write Seq (MB/s) | 1561 | 1880 20% | 1539 -1% | 1584 1% | 1409 -10% | 1378 ? -12% |
| Read Seq (MB/s) | 2460 | 2350 -4% | 1252 -49% | 1787 -27% | 2129 -13% | 2341 ? -5% |
| Write 4K Q32T1 (MB/s) | 438 | 282.3 -36% | 355.4 -19% | 361.2 -18% | 320.3 -27% | 355 ? -19% |
| Read 4K Q32T1 (MB/s) | 568 | 314.3 -45% | 408.7 -28% | 426.1 -25% | 348.3 -39% | 429 ? -24% |
| Write Seq Q32T1 (MB/s) | 1581 | 1881 19% | 1913 21% | 1984 25% | 1529 -3% | 1514 ? -4% |
| Read Seq Q32T1 (MB/s) | 2724 | 3216 18% | 2530 -7% | 3374 24% | 2957 9% | 2677 ? -2% |

| 3DMark 11 - 1280x720 Performance GPU | |
| Az osztály átlaga Workstation (12535 - 69594, n=24, az elmúlt 2 évben) | |
| MSI WT75 8SM | |
| Lenovo ThinkPad P53-20QN000YGE | |
| Razer Blade Pro 17 RTX 2060 | |
| Átlagos NVIDIA Quadro RTX 3000 (Laptop) (17569 - 20542, n=4) | |
| Lenovo ThinkPad P73-20QR002DGE | |
| Lenovo ThinkPad P72-20MB000EGE | |
| Fujitsu Celsius H980 | |
| Dell Precision 7730 | |
| 3DMark | |
| 1280x720 Cloud Gate Standard Graphics | |
| Lenovo ThinkPad P53-20QN000YGE | |
| Az osztály átlaga Workstation (58392 - 152418, n=14, az elmúlt 2 évben) | |
| Razer Blade Pro 17 RTX 2060 | |
| MSI WT75 8SM | |
| Lenovo ThinkPad P73-20QR002DGE | |
| Átlagos NVIDIA Quadro RTX 3000 (Laptop) (62730 - 106470, n=3) | |
| Lenovo ThinkPad P72-20MB000EGE | |
| Dell Precision 7730 | |
| Fujitsu Celsius H980 | |
| 1920x1080 Fire Strike Graphics | |
| Az osztály átlaga Workstation (8293 - 52560, n=24, az elmúlt 2 évben) | |
| MSI WT75 8SM | |
| Lenovo ThinkPad P53-20QN000YGE | |
| Razer Blade Pro 17 RTX 2060 | |
| Átlagos NVIDIA Quadro RTX 3000 (Laptop) (13802 - 15881, n=2) | |
| Lenovo ThinkPad P73-20QR002DGE | |
| Dell Precision 7730 | |
| Lenovo ThinkPad P72-20MB000EGE | |
| Fujitsu Celsius H980 | |
| 2560x1440 Time Spy Graphics | |
| Az osztály átlaga Workstation (2725 - 24806, n=24, az elmúlt 2 évben) | |
| Lenovo ThinkPad P53-20QN000YGE | |
| Razer Blade Pro 17 RTX 2060 | |
| MSI WT75 8SM | |
| Átlagos NVIDIA Quadro RTX 3000 (Laptop) (5503 - 6014, n=3) | |
| Lenovo ThinkPad P73-20QR002DGE | |
| Lenovo ThinkPad P72-20MB000EGE | |
| Fujitsu Celsius H980 | |
| LuxMark v2.0 64Bit | |
| Room GPUs-only | |
| Az osztály átlaga Workstation (1760 - 6990, n=4, az elmúlt 2 évben) | |
| Lenovo ThinkPad P73-20QR002DGE | |
| Átlagos NVIDIA Quadro RTX 3000 (Laptop) (n=1) | |
| Dell Precision 7730 | |
| Fujitsu Celsius H980 | |
| Lenovo ThinkPad P53-20QN000YGE | |
| Lenovo ThinkPad P72-20MB000EGE | |
| Sala GPUs-only | |
| Az osztály átlaga Workstation (5177 - 13967, n=4, az elmúlt 2 évben) | |
| Lenovo ThinkPad P73-20QR002DGE | |
| Átlagos NVIDIA Quadro RTX 3000 (Laptop) (n=1) | |
| Lenovo ThinkPad P53-20QN000YGE | |
| Fujitsu Celsius H980 | |
| Dell Precision 7730 | |
| Lenovo ThinkPad P72-20MB000EGE | |
| 3DMark 06 Standard Score | 37304 pontok | |
| 3DMark Vantage P Result | 50309 pontok | |
| 3DMark 11 Performance | 15944 pontok | |
| 3DMark Ice Storm Standard Score | 98035 pontok | |
| 3DMark Cloud Gate Standard Score | 32163 pontok | |
| 3DMark Fire Strike Score | 12693 pontok | |
| 3DMark Time Spy Score | 5566 pontok | |
Segítség | ||
| The Witcher 3 - 1920x1080 Ultra Graphics & Postprocessing (HBAO+) | |
| Az osztály átlaga Workstation (51 - 91.7, n=2, az elmúlt 2 évben) | |
| Lenovo ThinkPad P53-20QN000YGE | |
| MSI WT75 8SM | |
| Razer Blade Pro 17 RTX 2060 | |
| Átlagos NVIDIA Quadro RTX 3000 (Laptop) (53.9 - 59, n=2) | |
| Lenovo ThinkPad P73-20QR002DGE | |
| Dell Precision 7730 | |
| Lenovo ThinkPad P72-20MB000EGE | |
| alacsony | közepes | magas | ultra | 4K | |
|---|---|---|---|---|---|
| BioShock Infinite (2013) | 349.5 | 294.1 | 275.2 | 140.3 | |
| The Witcher 3 (2015) | 274.9 | 182.7 | 101.3 | 53.9 | |
| Dota 2 Reborn (2015) | 142 | 130 | 132 | 121 | 88 |
| Rise of the Tomb Raider (2016) | 213.9 | 174.6 | 99.4 | 83 | |
| Rocket League (2017) | 219.1 | ||||
| X-Plane 11.11 (2018) | 114 | 102 | 86 | ||
| Assassin´s Creed Odyssey (2018) | 96 | 77 | 62 | 39 | |
| Far Cry New Dawn (2019) | 114 | 91 | 86 | 77 | |
| Total War: Three Kingdoms (2019) | 226.5 | 107.7 | 69.2 | 46 | |
| F1 2019 (2019) | 102 | 92 | 84 | 73 |
Zajszint
| Üresjárat |
| 29.3 / 29.3 / 29.3 dB(A) |
| Terhelés |
| 30.2 / 33.1 dB(A) |
 | ||
30 dB csendes 40 dB(A) hallható 50 dB(A) hangos |
||
min: | ||
(-) A felső oldalon a maximális hőmérséklet 52.2 °C / 126 F, összehasonlítva a 38.2 °C / 101 F átlagával , 22.2 és 69.8 °C között a Workstation osztálynál.
(-) Az alsó maximum 47.8 °C / 118 F-ig melegszik fel, összehasonlítva a 41.1 °C / 106 F átlagával
(+) Üresjáratban a felső oldal átlagos hőmérséklete 26.3 °C / 79 F, összehasonlítva a 32 °C / ### eszközátlaggal class_avg_f### F.
(-) A The Witcher 3 játék során a felső oldal átlaghőmérséklete 43.1 °C / 110 F, összehasonlítva a 32 °C / ## eszközátlaggal #class_avg_f### F.
(±) A csuklótámasz és az érintőpad tapintásra nagyon felforrósodhat, maximum 37.6 °C / 99.7 F.
(-) A hasonló eszközök csuklótámasz területének átlagos hőmérséklete 27.8 °C / 82 F volt (-9.8 °C / -17.7 F).
Lenovo ThinkPad P73-20QR002DGE hangelemzés
(-) | nem túl hangos hangszórók (70.2 dB)
Basszus 100 - 315 Hz
(±) | csökkentett basszus – átlagosan 14.5%-kal alacsonyabb, mint a medián
(±) | a basszus linearitása átlagos (14% delta az előző frekvenciához)
Közepes 400-2000 Hz
(±) | magasabb középértékek – átlagosan 7.3%-kal magasabb, mint a medián
(+) | a középpontok lineárisak (5.1% delta az előző frekvenciához)
Maximum 2-16 kHz
(±) | csökkentett csúcsok – átlagosan 5.1%-kal alacsonyabb a mediánnál
(±) | a csúcsok linearitása átlagos (8% delta az előző gyakorisághoz)
Összességében 100 - 16.000 Hz
(±) | az általános hang linearitása átlagos (29.3% eltérés a mediánhoz képest)
Ugyanazon osztályhoz képest
» 96%Ebben az osztályban az összes tesztelt eszköz %-a jobb volt, 1% hasonló, 3%-kal rosszabb
» A legjobb delta értéke 7%, az átlag 17%, a legrosszabb 35% volt
Az összes tesztelt eszközzel összehasonlítva
» 87% az összes tesztelt eszköz jobb volt, 3% hasonló, 10%-kal rosszabb
» A legjobb delta értéke 4%, az átlag 24%, a legrosszabb 134% volt
Dell Precision 7730 hangelemzés
(±) | a hangszóró hangereje átlagos, de jó (81.1 dB)
Basszus 100 - 315 Hz
(-) | szinte nincs basszus – átlagosan 16.7%-kal alacsonyabb a mediánnál
(±) | a basszus linearitása átlagos (11.6% delta az előző frekvenciához)
Közepes 400-2000 Hz
(±) | csökkentett középértékek – átlagosan 5.4%-kal alacsonyabb, mint a medián
(+) | a középpontok lineárisak (5.4% delta az előző frekvenciához)
Maximum 2-16 kHz
(+) | kiegyensúlyozott csúcsok – csak 4% választja el a mediántól
(+) | a csúcsok lineárisak (5.8% delta az előző frekvenciához képest)
Összességében 100 - 16.000 Hz
(±) | az általános hang linearitása átlagos (17% eltérés a mediánhoz képest)
Ugyanazon osztályhoz képest
» 49%Ebben az osztályban az összes tesztelt eszköz %-a jobb volt, 10% hasonló, 41%-kal rosszabb
» A legjobb delta értéke 7%, az átlag 17%, a legrosszabb 35% volt
Az összes tesztelt eszközzel összehasonlítva
» 30% az összes tesztelt eszköz jobb volt, 8% hasonló, 62%-kal rosszabb
» A legjobb delta értéke 4%, az átlag 24%, a legrosszabb 134% volt
| Kikapcsolt állapot / Készenlét | |
| Üresjárat | |
| Terhelés |
|
Kulcs:
min: | |
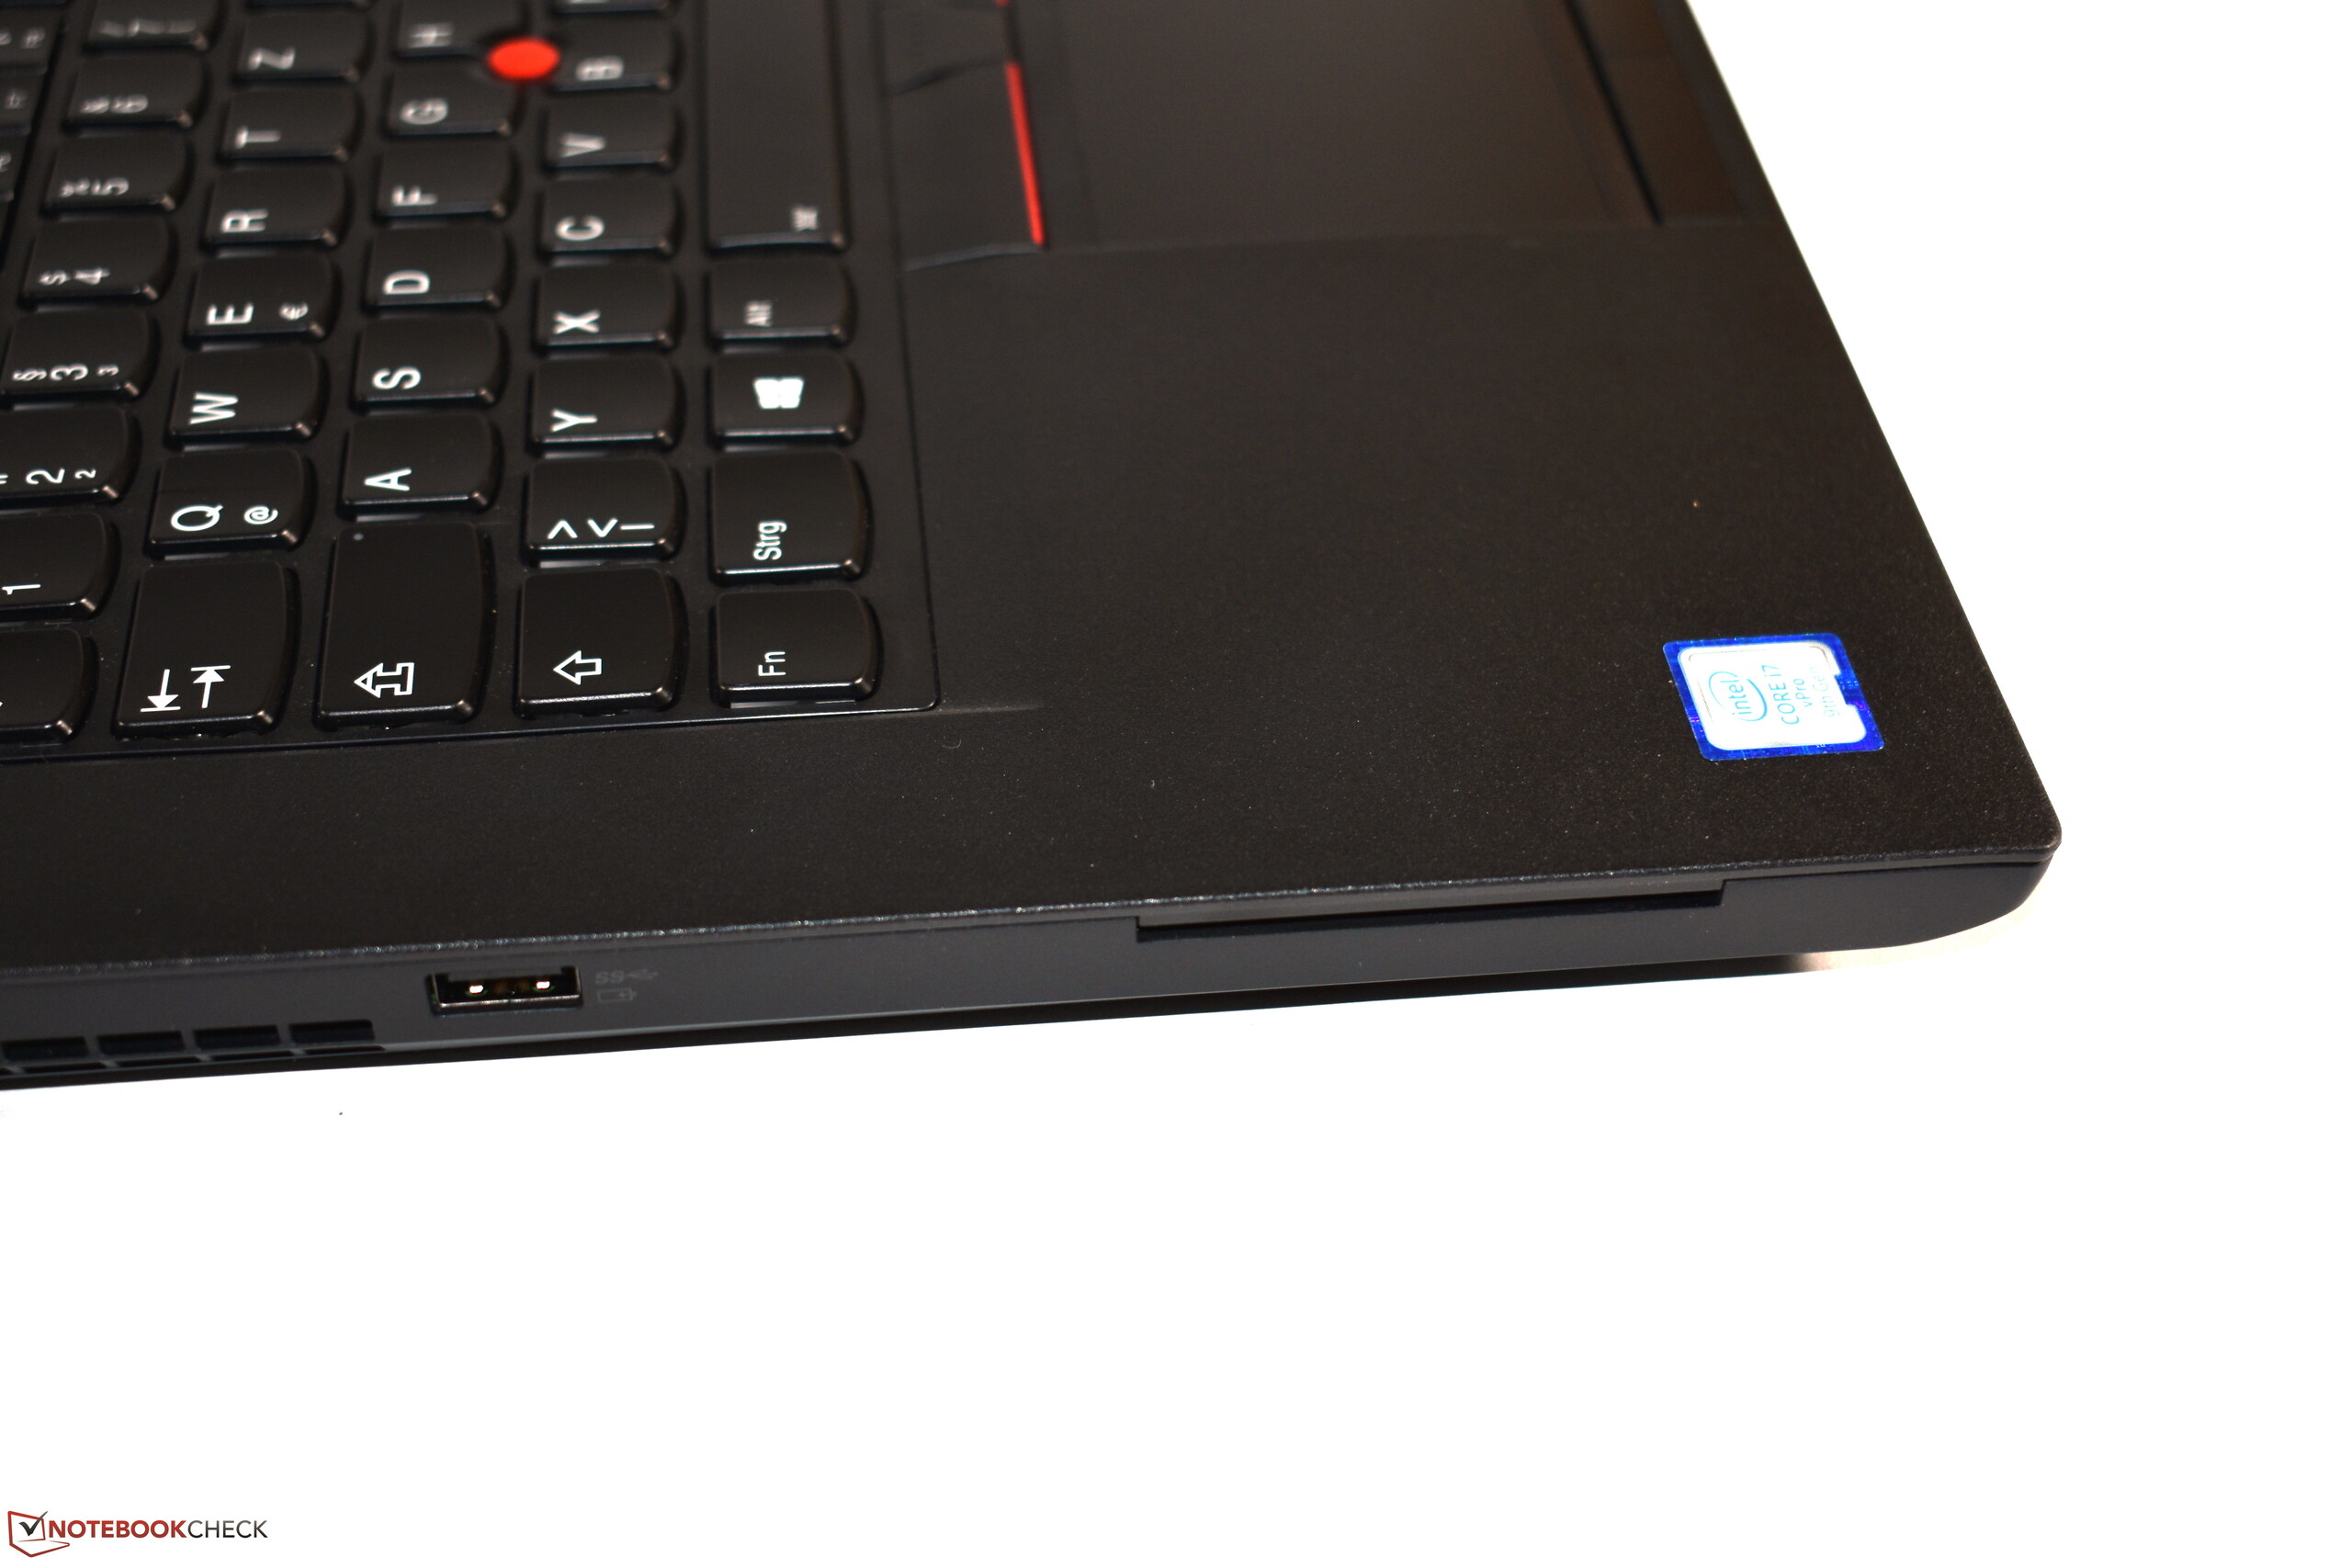
| Lenovo ThinkPad P73-20QR002DGE i7-9850H, Quadro RTX 3000 (Laptop), Intel SSD Pro 7600p SSDPEKKF512G8L, IPS LED, 1920x1080, 17.3" | Dell Precision 7730 i7-8850H, Quadro P3200, Samsung SSD PM981 MZVLB512HAJQ, IPS LED, 1920x1080, 17.3" | Fujitsu Celsius H980 i7-8750H, Quadro P3200, Samsung SSD PM981 MZVLB512HAJQ, IPS, 1920x1080, 17.3" | MSI WT75 8SM E-2176G, Quadro P5200, Samsung SSD PM981 MZVLB512HAJQ, IPS, 3840x2160, 17.3" | Lenovo ThinkPad P72-20MB000EGE i7-8850H, Quadro P3200, Lenovo LENSE20256GMSP34MEAT2TA, IPS, 1920x1080, 17.3" | Átlagos NVIDIA Quadro RTX 3000 (Laptop) | Az osztály átlaga Workstation | |
|---|---|---|---|---|---|---|---|
| Power Consumption | -11% | -35% | -120% | 21% | -9% | -3% | |
| Idle Minimum * (Watt) | 8.9 | 10.1 -13% | 14.8 -66% | 29 -226% | 4.6 48% | 9.8 ? -10% | 9.04 ? -2% |
| Idle Average * (Watt) | 12.8 | 18 -41% | 20.4 -59% | 37.1 -190% | 12.2 5% | 15.5 ? -21% | 13.8 ? -8% |
| Idle Maximum * (Watt) | 16.4 | 19.7 -20% | 21.5 -31% | 39.5 -141% | 15.4 6% | 17.5 ? -7% | 17.7 ? -8% |
| Load Average * (Watt) | 108.4 | 89.6 17% | 98.4 9% | 133.6 -23% | 79.6 27% | 109.8 ? -1% | 96.2 ? 11% |
| Witcher 3 ultra * (Watt) | 153 | 134 12% | 236.3 -54% | 86 44% | |||
| Load Maximum * (Watt) | 166 | 204 -23% | 213.5 -29% | 310 -87% | 176 -6% | 179.9 ? -8% | 178.5 ? -8% |
* ... a kisebb jobb
| Lenovo ThinkPad P73-20QR002DGE i7-9850H, Quadro RTX 3000 (Laptop), 99 Wh | Dell Precision 7730 i7-8850H, Quadro P3200, 92 Wh | Fujitsu Celsius H980 i7-8750H, Quadro P3200, 96 Wh | MSI WT75 8SM E-2176G, Quadro P5200, 90 Wh | Lenovo ThinkPad P72-20MB000EGE i7-8850H, Quadro P3200, 99 Wh | Az osztály átlaga Workstation | |
|---|---|---|---|---|---|---|
| Akkumulátor üzemidő | -28% | -22% | -41% | 7% | -8% | |
| H.264 (h) | 9.8 | 5.8 -41% | 5.9 -40% | 12.3 26% | 9.51 ? -3% | |
| WiFi v1.3 (h) | 11.1 | 5.6 -50% | 8.3 -25% | 3.7 -67% | 11.2 1% | 8.52 ? -23% |
| Load (h) | 1.4 | 1.5 7% | 1.4 0% | 1.2 -14% | 1.3 -7% | 1.429 ? 2% |
| Reader / Idle (h) | 13.5 | 4 | 28.3 | 26.1 ? |
Pro
Kontra
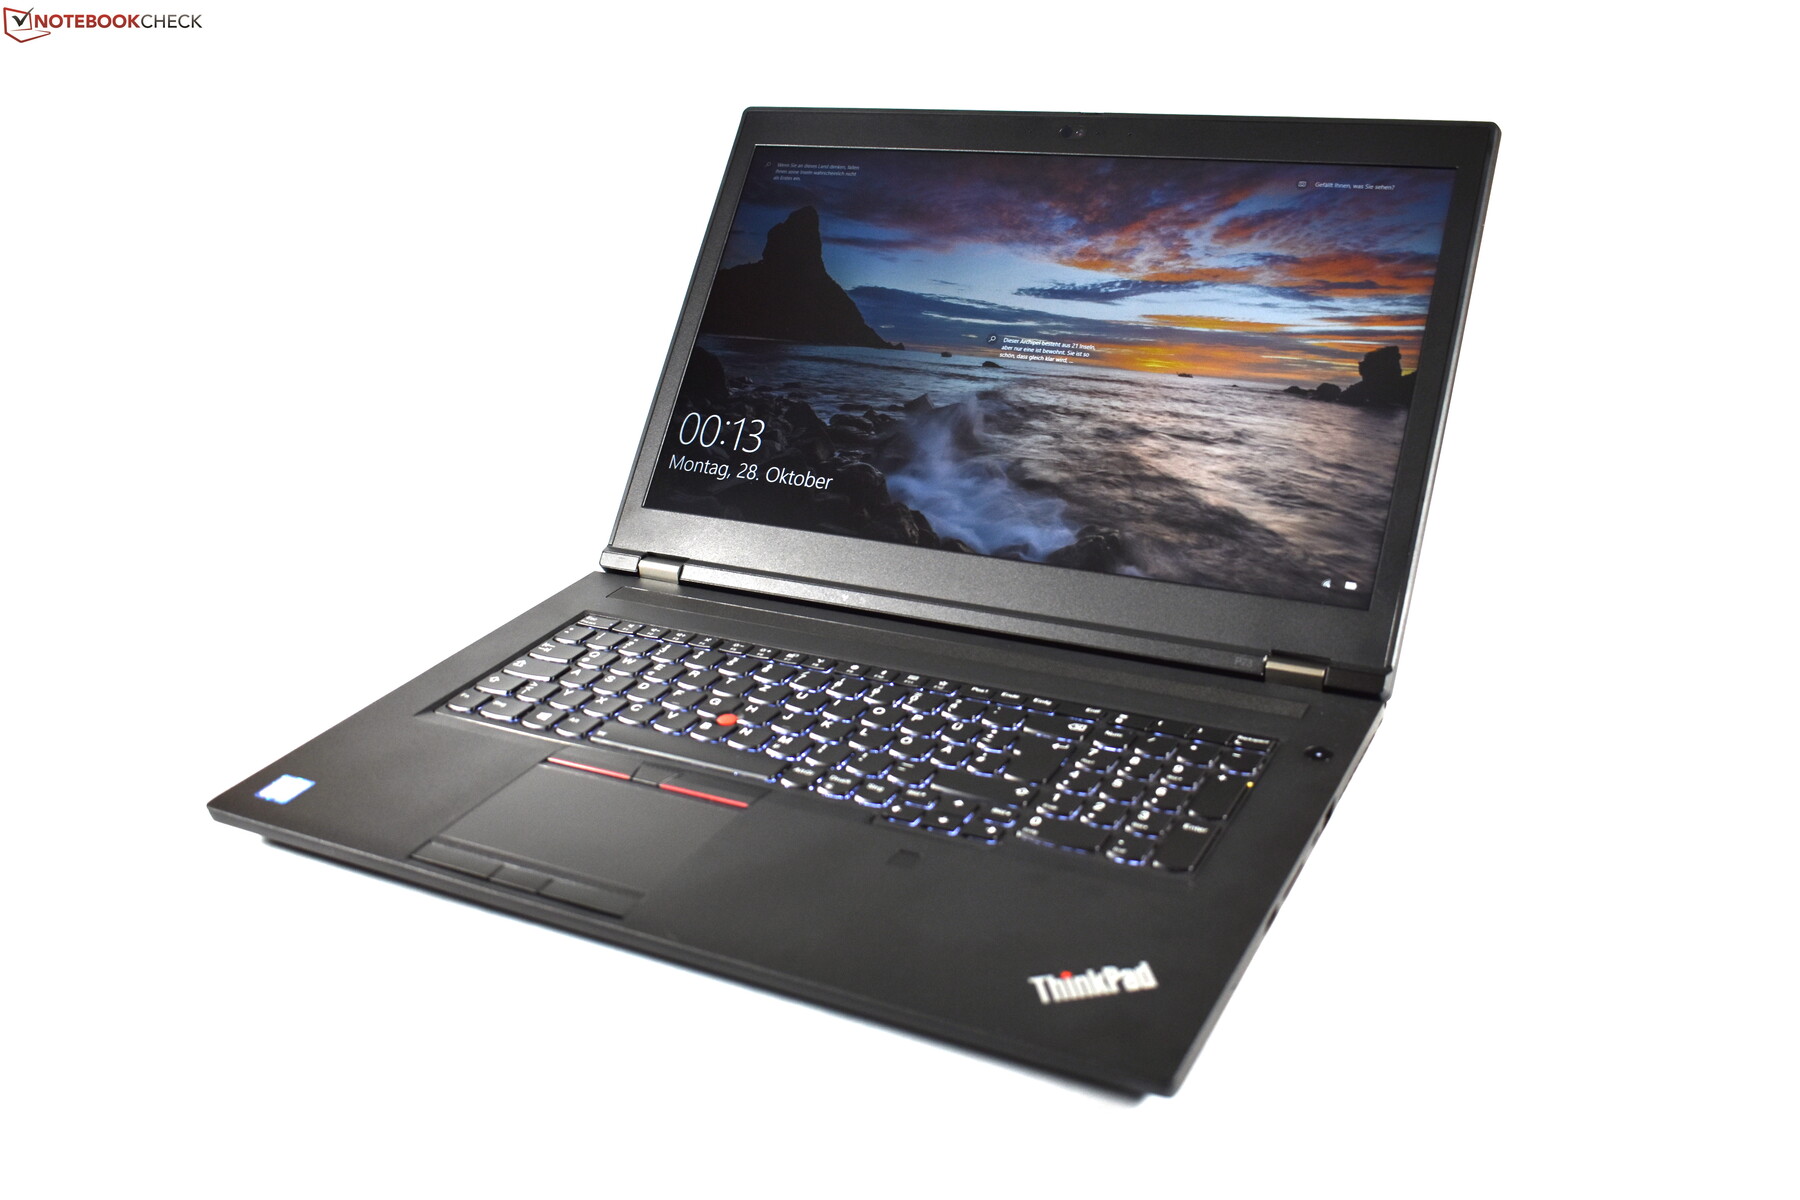

A Lenovo ThinkPad P73 ezen konfigurációja több mint 3,000 Euróba kerül. Annak ellenére, hogy nagyon drága, ez a munkaállomás laptop nem egy tökéletes készülék.
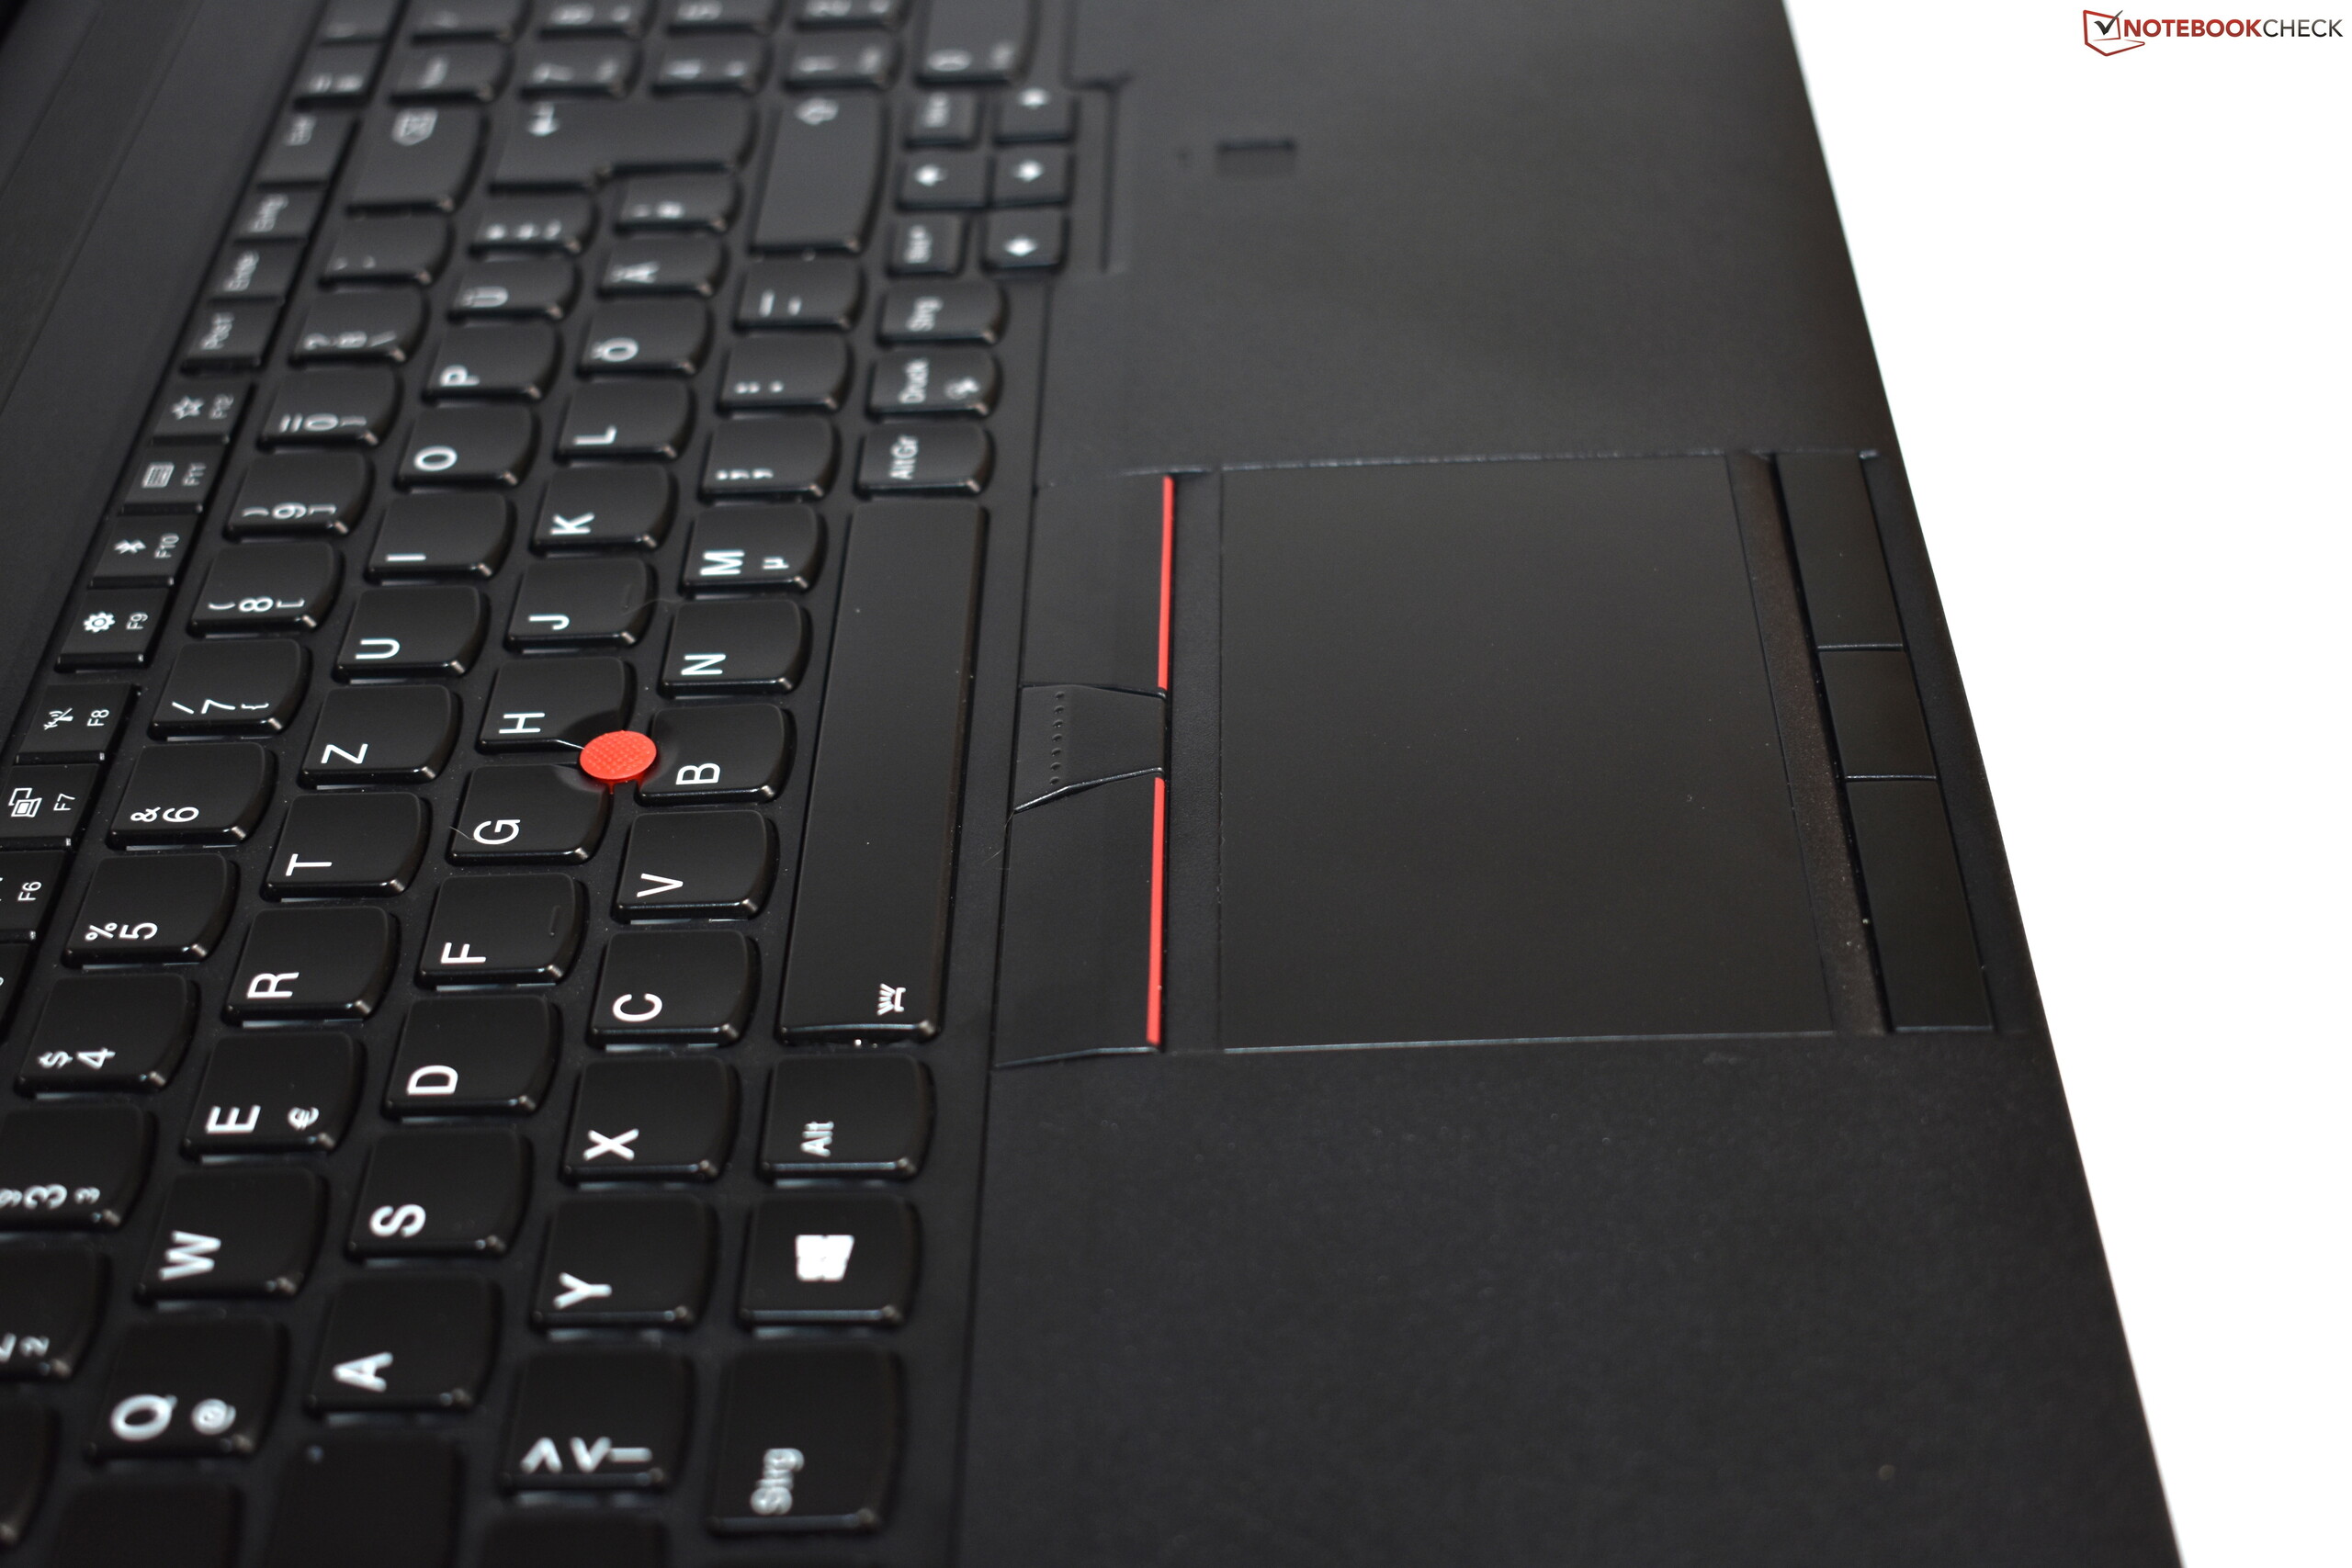
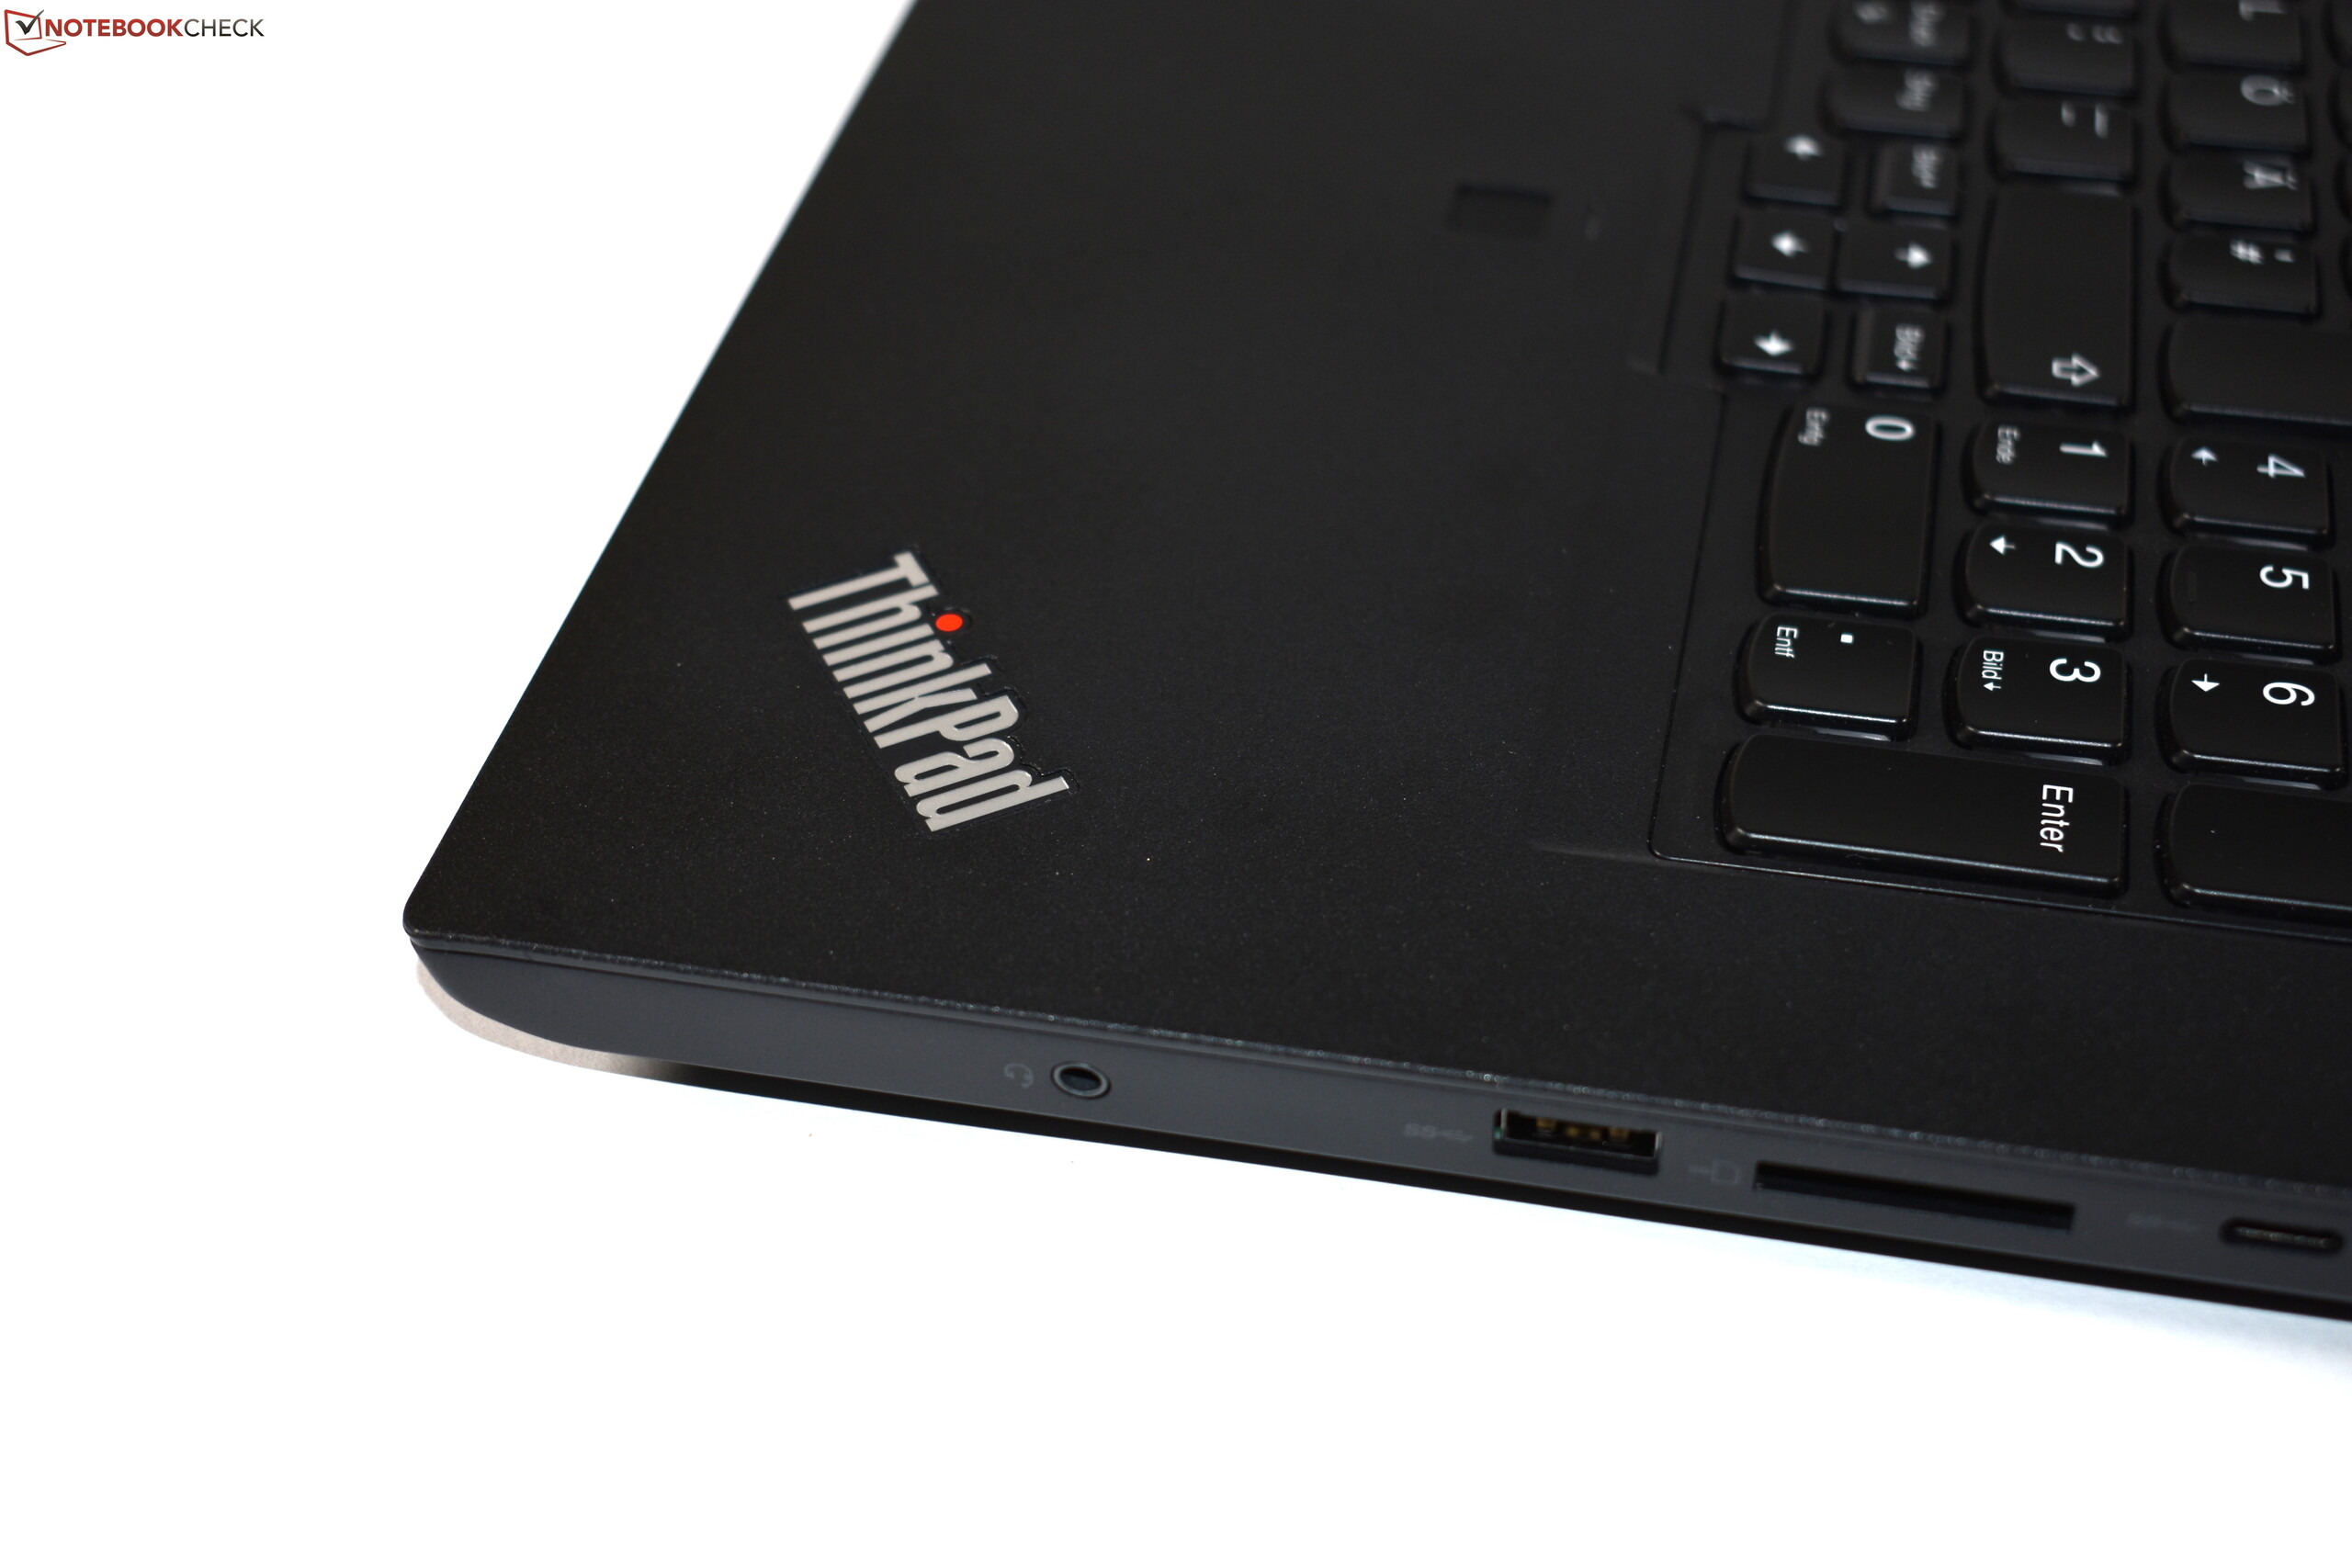
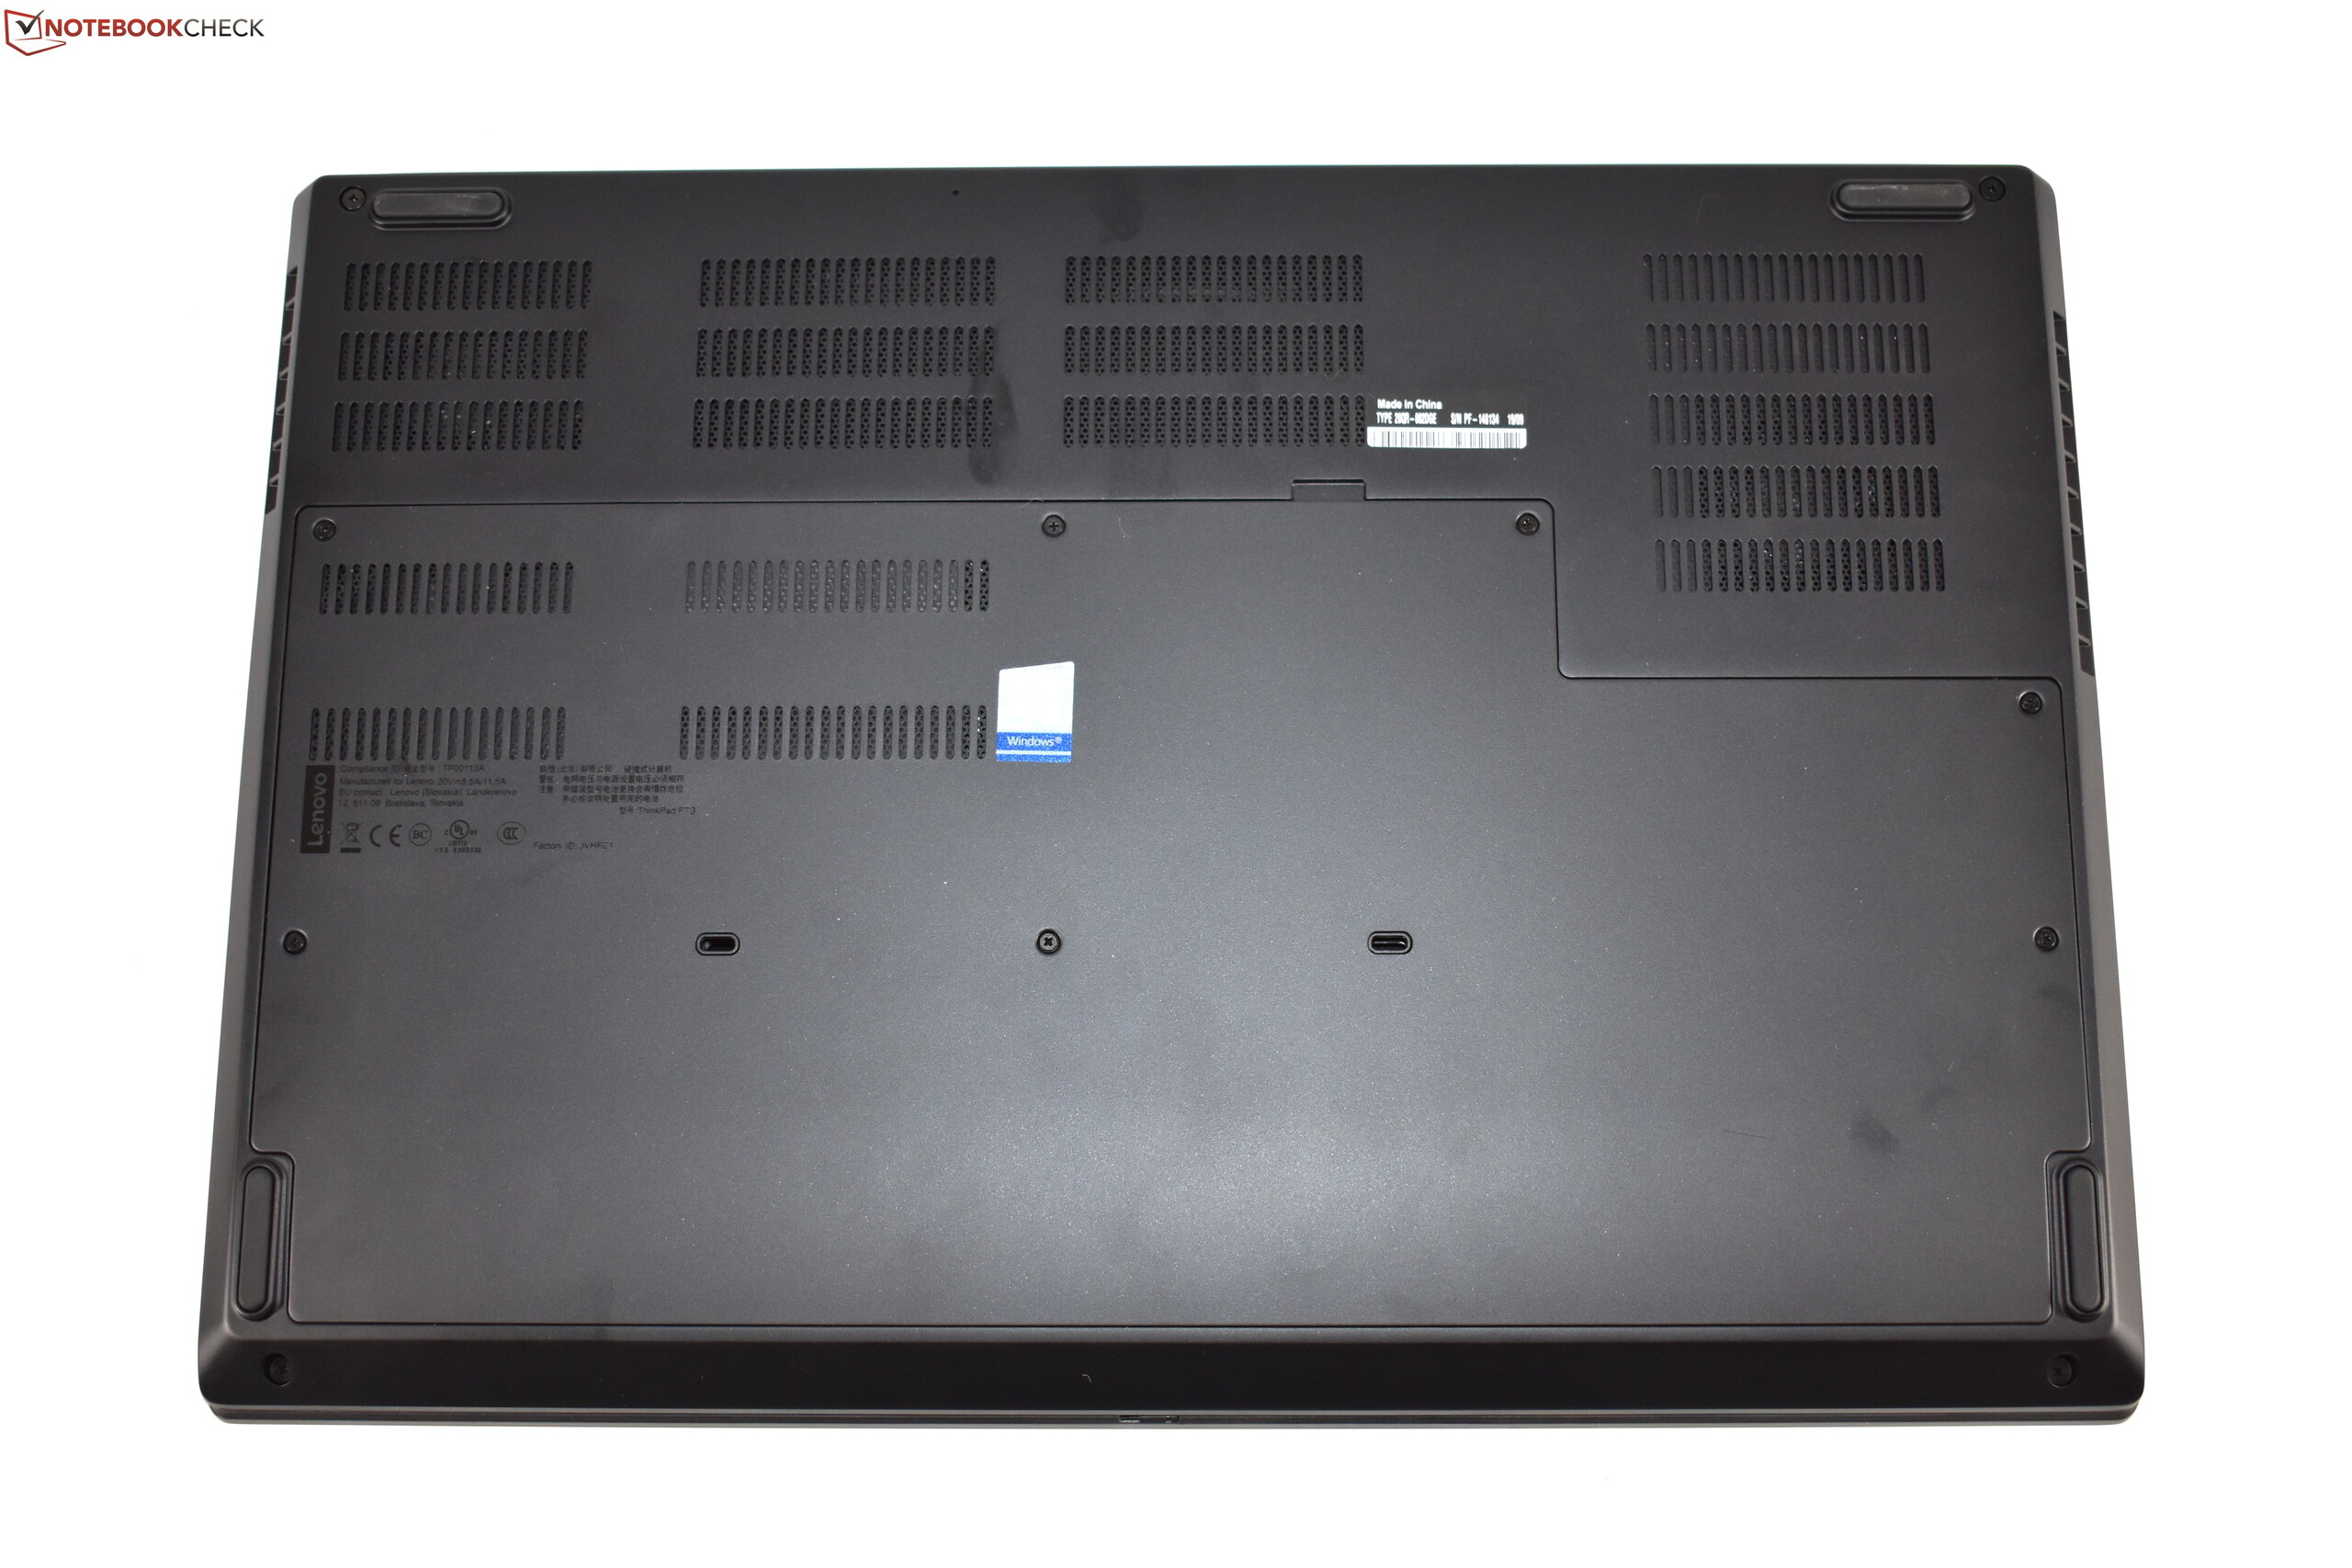
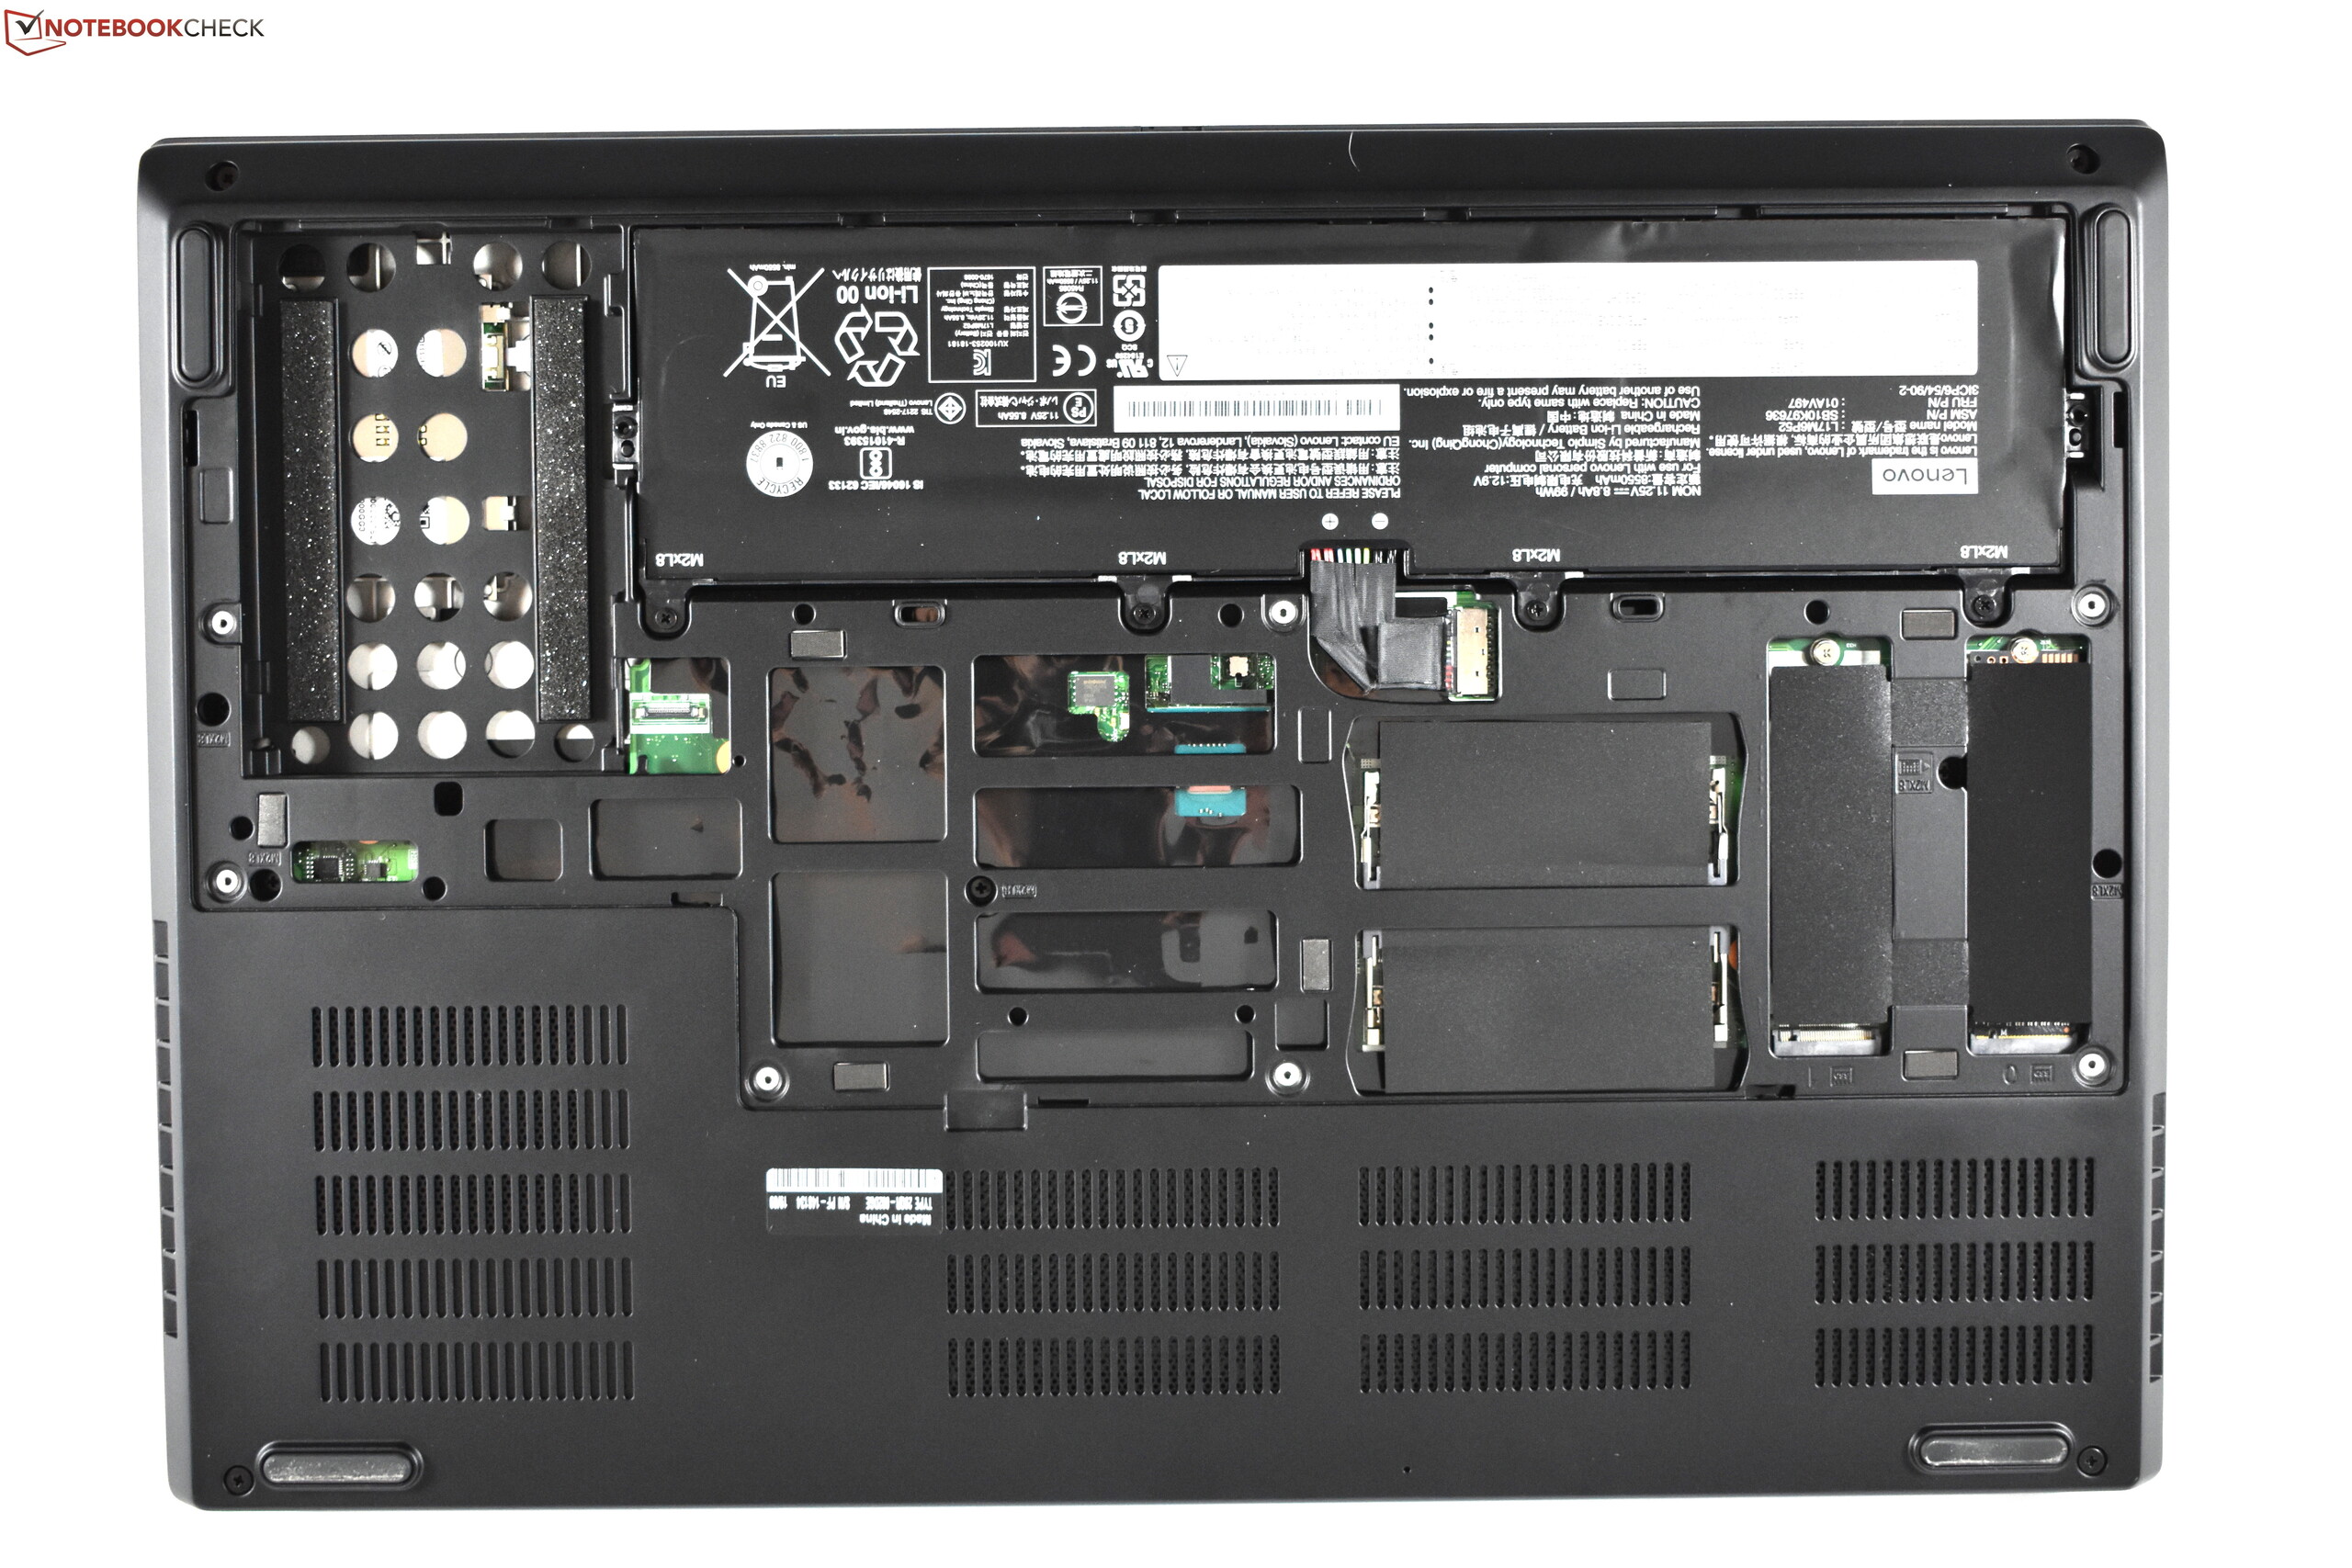
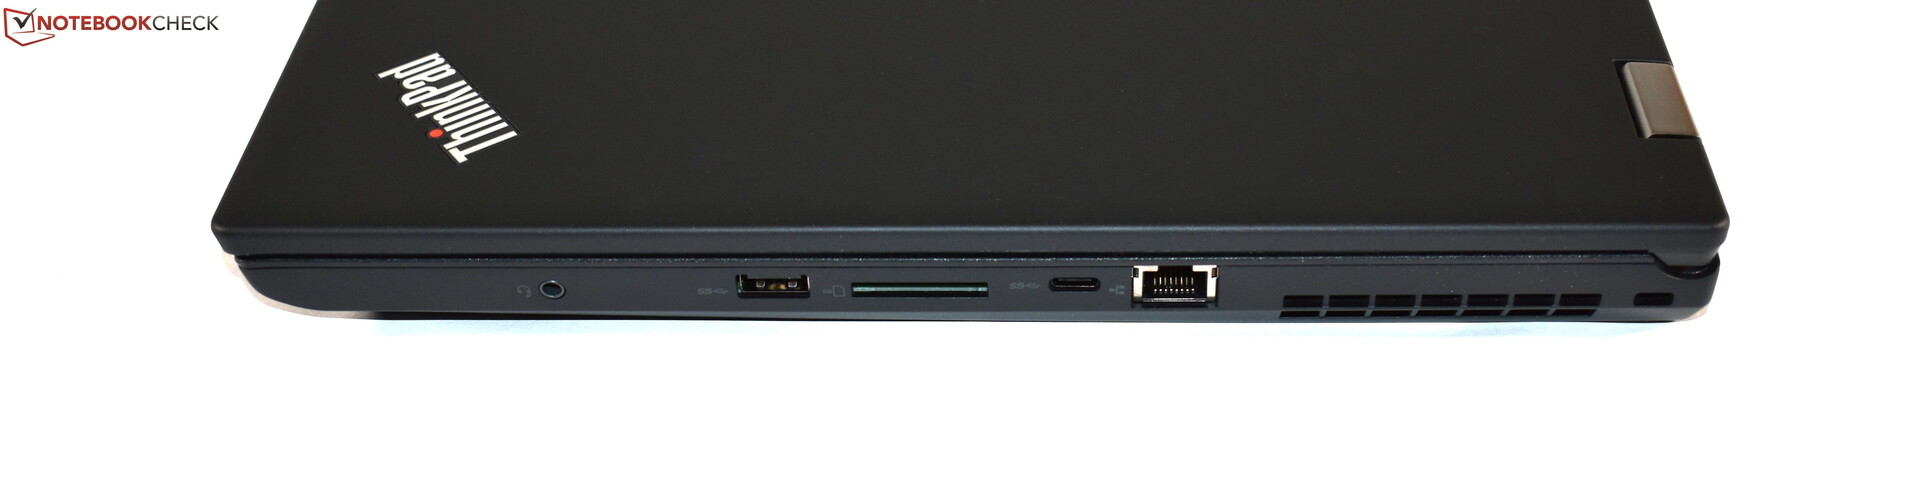
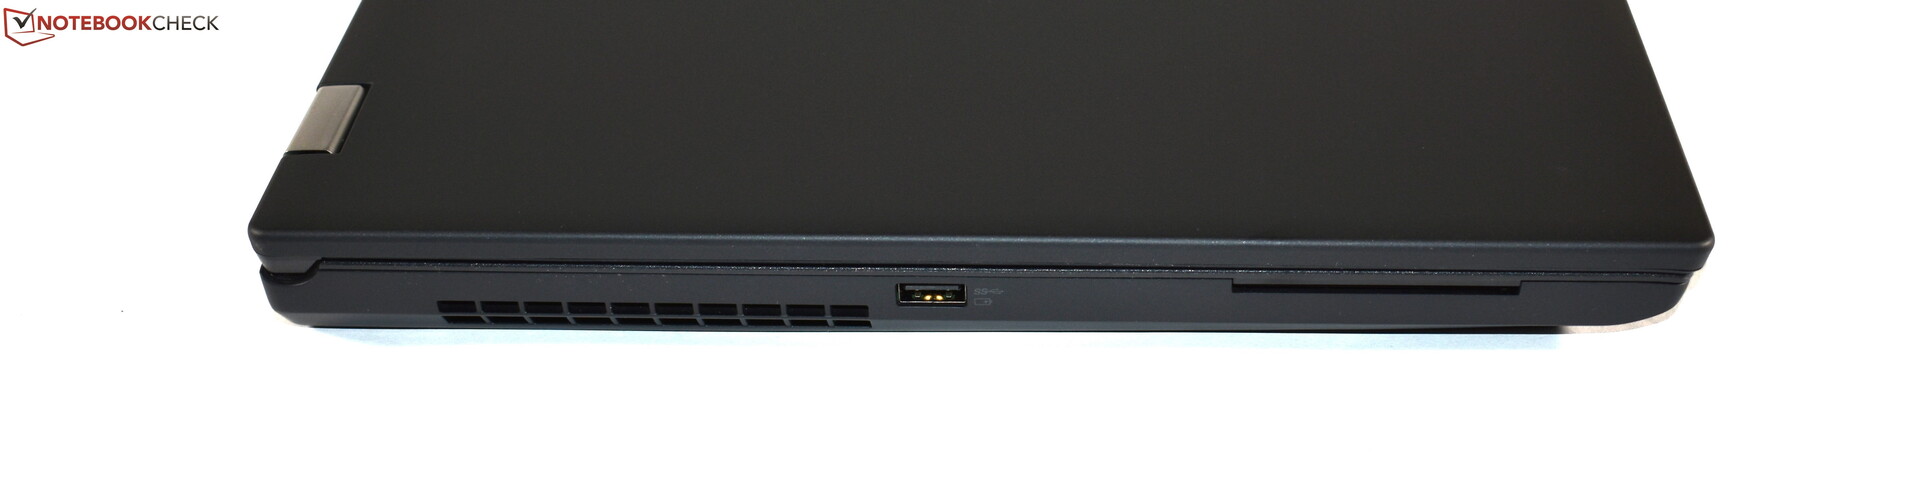
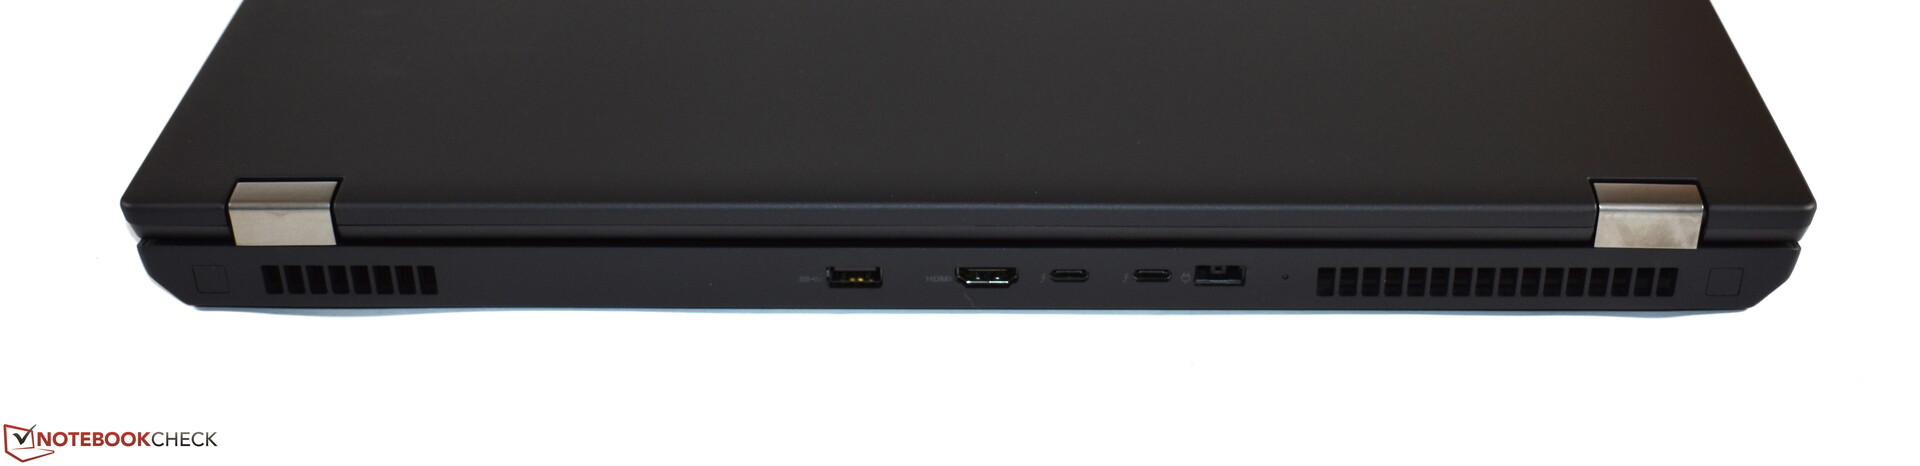
Az előnyök listájába tartozik az erős ThinkPad váz, a kitűnő bemeneti eszközök és a meglepően jó üzemidő. Szintén pozitívum: A hűtőrendszer nagyrészt csendes marad, még terhelés alatt is alig hallható. A bővíthetőség három tároló hellyel és négy RAM hellyel szintén példaértékű, ahogy a portválaszték is az.
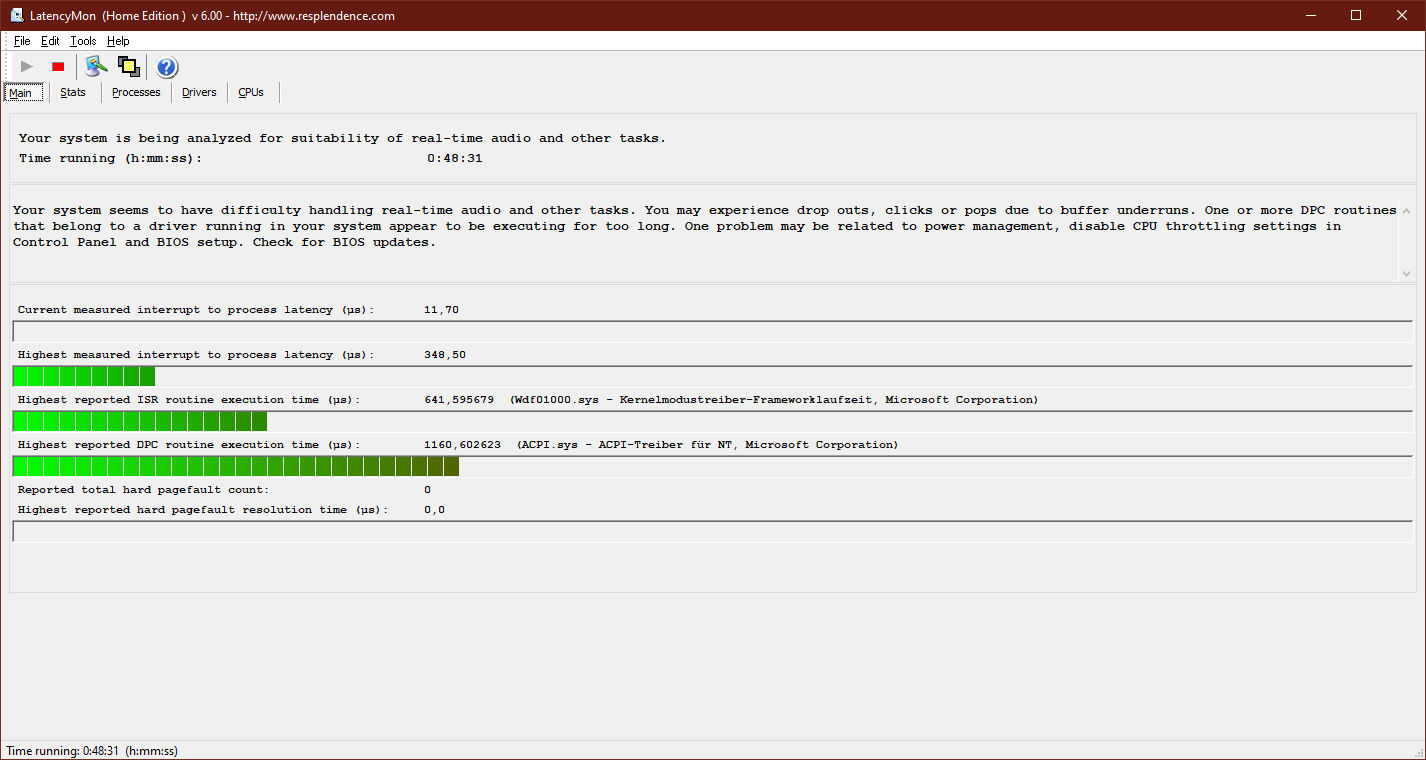
Munkaállomásoknál nagyon fontos a teljesítmény. A Lenovo ThinkPad P73 CPU-ja valóban nagyon gyors. Sajnos a GPU kiábrándít minket, mivel az Nvidia Quadro RTX 3000 teljesítménye folyamatos terhelés alatt csökken. A ThinkPad P73 terhelés alatt erősen fel is melegszik. A váz 50 Celsius-fok fölötti hőmérséklete túl magas. Ilyen esetben jó lett volna egy aktívabb ventilátor. Egy másik gond a teljesítménykorlátozás, amikor a készülék akkumulátoron működik.
Az összességében erős Lenovo ThinkPad P73-at visszatartja a magas hőmérséklet és az ebből kifolyólag instabil GPU teljesítmény.
Ennek ellenére ajánlani tudjuk a Lenovo ThinkPad P73-at. Ahogy viszont van, teljesítményben semmivel több előnye nincs a régebbi ThinkPad P72-höz képest. Talán a Lenovo-nak kicsit újra kéne dolgoznia a ventilátor profilt, hogy a ventilátorok többet működjenek a gép terhelése közben.
Lenovo ThinkPad P73-20QR002DGE
- 11/21/2019 v7 (old)
Benjamin Herzig
Price comparison

