Razer Blade Pro 17 RTX 2060 Laptop rövid értékelés: Milyen az RTX 2080 Max-Q-hoz képest?

| SD Card Reader | |
| average JPG Copy Test (av. of 3 runs) | |
| Razer Blade Pro 17 RTX 2060 (Toshiba Exceria Pro SDXC 64 GB UHS-II) | |
| Razer Blade Pro 2017 (Toshiba Exceria Pro SDXC 64 GB UHS-II) | |
| maximum AS SSD Seq Read Test (1GB) | |
| Razer Blade Pro 17 RTX 2060 (Toshiba Exceria Pro SDXC 64 GB UHS-II) | |
| Razer Blade Pro 2017 (Toshiba Exceria Pro SDXC 64 GB UHS-II) | |
| |||||||||||||||||||||||||
Fényerő megoszlás: 93 %
Centrumban: 300.4 cd/m²
Kontraszt: 939:1 (Fekete: 0.32 cd/m²)
ΔE ColorChecker Calman: 2.32 | ∀{0.5-29.43 Ø4.73}
calibrated: 2.95
ΔE Greyscale Calman: 1.5 | ∀{0.09-98 Ø4.97}
89% sRGB (Argyll 1.6.3 3D)
57.4% AdobeRGB 1998 (Argyll 1.6.3 3D)
62.5% AdobeRGB 1998 (Argyll 3D)
89.4% sRGB (Argyll 3D)
61.1% Display P3 (Argyll 3D)
Gamma: 2.3
CCT: 6764 K
| Razer Blade Pro 17 RTX 2060 AU Optronics B173HAN04.0, IPS, 17.3", 1920x1080 | Asus Zephyrus S GX701GX B173HAN04.0 (AUO409D), IPS, 17.3", 1920x1080 | MSI GS75 Stealth 9SG Chi Mei N173HCE-G33 (CMN175C), IPS, 17.3", 1920x1080 | Asus ASUS ROG Strix SCAR III G731GW-XB74 AU Optronics AUO409D, IPS, 17.3", 1920x1080 | Razer Blade Pro 2017 Sharp LQ173D1JW33 (SHP145A), IGZO, 17.3", 3840x2160 | Acer Predator Helios 500 PH517-51-93LS B173ZAN01.0, IPS LED, 17.3", 3840x2160 | |
|---|---|---|---|---|---|---|
| Display | 1% | 4% | -0% | 39% | 38% | |
| Display P3 Coverage (%) | 61.1 | 62.9 3% | 62.6 2% | 61.9 1% | 88.9 45% | 86.7 42% |
| sRGB Coverage (%) | 89.4 | 87.8 -2% | 93.5 5% | 86.3 -3% | 100 12% | 100 12% |
| AdobeRGB 1998 Coverage (%) | 62.5 | 63.9 2% | 64.7 4% | 62.9 1% | 99.7 60% | 99.4 59% |
| Response Times | -8% | -10% | -19% | -565% | -303% | |
| Response Time Grey 50% / Grey 80% * (ms) | 6.8 ? | 7.2 ? -6% | 7.2 ? -6% | 7.2 ? -6% | 60.8 ? -794% | 36 ? -429% |
| Response Time Black / White * (ms) | 8.8 ? | 9.6 ? -9% | 10 ? -14% | 11.6 ? -32% | 38.4 ? -336% | 24.4 ? -177% |
| PWM Frequency (Hz) | 25510 ? | 204.9 ? | ||||
| Screen | 7% | 17% | -34% | -45% | -15% | |
| Brightness middle (cd/m²) | 300.4 | 288 -4% | 366 22% | 297.4 -1% | 230 -23% | 366 22% |
| Brightness (cd/m²) | 289 | 287 -1% | 343 19% | 306 6% | 207 -28% | 349 21% |
| Brightness Distribution (%) | 93 | 91 -2% | 91 -2% | 80 -14% | 83 -11% | 86 -8% |
| Black Level * (cd/m²) | 0.32 | 0.2 37% | 0.29 9% | 0.31 3% | 0.2 37% | 0.46 -44% |
| Contrast (:1) | 939 | 1440 53% | 1262 34% | 959 2% | 1150 22% | 796 -15% |
| Colorchecker dE 2000 * | 2.32 | 2.33 -0% | 1.51 35% | 4.08 -76% | 5.62 -142% | 2.9 -25% |
| Colorchecker dE 2000 max. * | 3.81 | 5.34 -40% | 3.22 15% | 6.88 -81% | 10.24 -169% | 5.4 -42% |
| Colorchecker dE 2000 calibrated * | 2.95 | 2.47 16% | 0.71 76% | 4 -36% | 3.1 -5% | |
| Greyscale dE 2000 * | 1.5 | 1.19 21% | 1.93 -29% | 4 -167% | 4.54 -203% | 3.5 -133% |
| Gamma | 2.3 96% | 2.41 91% | 2.38 92% | 2.259 97% | 2.36 93% | 2.37 93% |
| CCT | 6764 96% | 6710 97% | 6881 94% | 7205 90% | 6625 98% | 6616 98% |
| Color Space (Percent of AdobeRGB 1998) (%) | 57.4 | 57 -1% | 60 5% | 56 -2% | 88 53% | 88.1 53% |
| Color Space (Percent of sRGB) (%) | 89 | 88 -1% | 94 6% | 86 -3% | 100 12% | 100 12% |
| Teljes átlag (program / beállítások) | 0% /
4% | 4% /
11% | -18% /
-26% | -190% /
-98% | -93% /
-41% |
* ... a kisebb jobb
Megjelenítési válaszidők
| ↔ Válaszidő Fekete-fehér | ||
|---|---|---|
| 8.8 ms ... emelkedés és süllyedés ↘ kombinálva | ↗ 4.4 ms emelkedés | 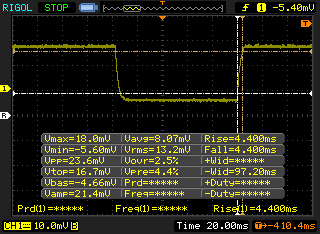 |
| ↘ 4.4 ms ősz | ||
| A képernyő gyors reakciósebességet mutat tesztjeinkben, és játékra is alkalmasnak kell lennie. Összehasonlításképpen, az összes tesztelt eszköz 0.1 (minimum) és 240 (maximum) ms között mozog. » 24 % of all devices are better. Ez azt jelenti, hogy a mért válaszidő jobb, mint az összes vizsgált eszköz átlaga (19.9 ms). | ||
| ↔ Válaszidő 50% szürke és 80% szürke között | ||
| 6.8 ms ... emelkedés és süllyedés ↘ kombinálva | ↗ 3.6 ms emelkedés | 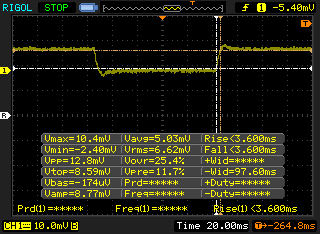 |
| ↘ 3.2 ms ősz | ||
| A képernyő tesztjeinkben nagyon gyors reakciósebességet mutatott, és nagyon jól használható gyors tempójú játékokhoz. Összehasonlításképpen, az összes tesztelt eszköz 0.165 (minimum) és 636 (maximum) ms között mozog. » 19 % of all devices are better. Ez azt jelenti, hogy a mért válaszidő jobb, mint az összes vizsgált eszköz átlaga (31.1 ms). | ||
Képernyő villogása / PWM (impulzusszélesség-moduláció)
| Képernyő villogása / PWM nem érzékelhető | 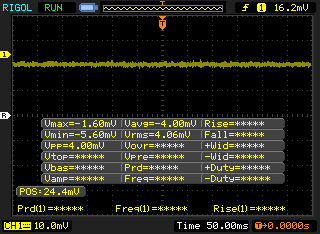 | ||
Összehasonlításképpen: az összes tesztelt eszköz 52 %-a nem használja a PWM-et a kijelző elsötétítésére. Ha PWM-et észleltek, akkor átlagosan 7801 (minimum: 5 - maximum: 343500) Hz-t mértek. | |||
| Cinebench R15 | |
| CPU Single 64Bit | |
| Schenker XMG Ultra 15 Turing | |
| MSI GE75 9SG | |
| Átlagos Intel Core i7-9750H (170 - 194, n=82) | |
| Razer Blade Pro 17 RTX 2060 | |
| Razer Blade Pro 17 RTX 2080 Max-Q | |
| Lenovo Legion Y540-17IRH | |
| Alienware m15 P79F | |
| Razer Blade Pro 2017 | |
| Asus Strix GL703VM-DB74 | |
| CPU Multi 64Bit | |
| MSI GE75 9SG | |
| Schenker XMG Ultra 15 Turing | |
| Alienware m15 P79F | |
| Átlagos Intel Core i7-9750H (952 - 1306, n=85) | |
| Razer Blade Pro 17 RTX 2080 Max-Q | |
| Razer Blade Pro 17 RTX 2060 | |
| Lenovo Legion Y540-17IRH | |
| Razer Blade Pro 2017 | |
| Asus Strix GL703VM-DB74 | |
| Cinebench R10 | |
| Rendering Multiple CPUs 32Bit | |
| Schenker XMG Ultra 15 Turing | |
| MSI GE75 9SG | |
| Átlagos Intel Core i7-9750H (28251 - 36304, n=13) | |
| Lenovo Legion Y540-17IRH | |
| Asus Strix GL703VM-DB74 | |
| Rendering Single 32Bit | |
| Schenker XMG Ultra 15 Turing | |
| MSI GE75 9SG | |
| Átlagos Intel Core i7-9750H (6659 - 7214, n=13) | |
| Lenovo Legion Y540-17IRH | |
| Asus Strix GL703VM-DB74 | |
| wPrime 2.10 - 1024m | |
| Asus Strix GL703VM-DB74 | |
| Átlagos Intel Core i7-9750H (n=1) | |
| MSI GE75 9SG | |
* ... a kisebb jobb
| PCMark 8 Home Score Accelerated v2 | 4401 pontok | |
| PCMark 8 Work Score Accelerated v2 | 5676 pontok | |
| PCMark 10 Score | 5641 pontok | |
Segítség | ||
| Razer Blade Pro 17 RTX 2060 Samsung SSD PM981 MZVLB512HAJQ | Asus Zephyrus S GX701GX Samsung SSD PM981 MZVLB1T0HALR | MSI GS75 Stealth 9SG 2x Samsung SSD PM981 MZVLB1T0HALR (RAID 0) | Asus ASUS ROG Strix SCAR III G731GW-XB74 Intel SSD 660p 1TB SSDPEKNW010T8 | Razer Blade Pro 2017 2x Samsung SSD PM951 MZVLV256HCHP (RAID 0) | |
|---|---|---|---|---|---|
| AS SSD | 5% | 6% | -34% | -19% | |
| Seq Read (MB/s) | 1810 | 911 -50% | 2855 58% | 1427 -21% | 2599 44% |
| Seq Write (MB/s) | 1797 | 2347 31% | 2687 50% | 1610 -10% | 588 -67% |
| 4K Read (MB/s) | 48.43 | 53 9% | 30.31 -37% | 25.63 -47% | 37.57 -22% |
| 4K Write (MB/s) | 106 | 122.5 16% | 96.3 -9% | 84.2 -21% | 104.4 -2% |
| 4K-64 Read (MB/s) | 1156 | 1577 36% | 1460 26% | 588 -49% | 1116 -3% |
| 4K-64 Write (MB/s) | 1748 | 1734 -1% | 1224 -30% | 732 -58% | 513 -71% |
| Access Time Read * (ms) | 0.057 | 0.08 -40% | 0.054 5% | 0.054 5% | 0.051 11% |
| Access Time Write * (ms) | 0.035 | 0.031 11% | 0.038 -9% | 0.071 -103% | 0.036 -3% |
| Score Read (Points) | 1385 | 1721 24% | 1776 28% | 756 -45% | 1414 2% |
| Score Write (Points) | 2033 | 2091 3% | 1589 -22% | 978 -52% | 676 -67% |
| Score Total (Points) | 4135 | 4771 15% | 4259 3% | 2134 -48% | 2715 -34% |
| Copy ISO MB/s (MB/s) | 1984 | 2226 12% | 1489 -25% | ||
| Copy Program MB/s (MB/s) | 588 | 426.4 -27% | 514 -13% | ||
| Copy Game MB/s (MB/s) | 835 | 1152 38% | 893 7% |
* ... a kisebb jobb

| 3DMark 11 | |
| 1280x720 Performance GPU | |
| MSI GE75 9SG | |
| Razer Blade Pro 17 RTX 2080 Max-Q | |
| MSI GS75 Stealth 9SG | |
| Schenker XMG Ultra 15 Turing | |
| MSI RTX 2060 Gaming Z 6G | |
| Razer Blade Pro 2017 | |
| Alienware m15 P79F | |
| Alienware 17 R5 | |
| Razer Blade Pro 17 RTX 2060 | |
| Átlagos NVIDIA GeForce RTX 2060 Mobile (19143 - 24662, n=40) | |
| Lenovo Legion Y540-17IRH | |
| Asus Strix GL703VM-DB74 | |
| MSI GF75 Thin 9SC | |
| 1280x720 Performance Combined | |
| MSI GE75 9SG | |
| Schenker XMG Ultra 15 Turing | |
| MSI RTX 2060 Gaming Z 6G | |
| MSI GS75 Stealth 9SG | |
| Razer Blade Pro 17 RTX 2060 | |
| Razer Blade Pro 17 RTX 2080 Max-Q | |
| MSI GF75 Thin 9SC | |
| Átlagos NVIDIA GeForce RTX 2060 Mobile (1107 - 14726, n=40) | |
| Alienware m15 P79F | |
| Alienware 17 R5 | |
| Lenovo Legion Y540-17IRH | |
| Razer Blade Pro 2017 | |
| Asus Strix GL703VM-DB74 | |
| 3DMark 11 Performance | 18741 pontok | |
| 3DMark Cloud Gate Standard Score | 37458 pontok | |
| 3DMark Fire Strike Score | 15132 pontok | |
| 3DMark Time Spy Score | 6608 pontok | |
Segítség | ||
| Shadow of the Tomb Raider - 1920x1080 Highest Preset AA:T | |
| MSI GE75 9SG | |
| MSI RTX 2060 Gaming Z 6G | |
| Asus ASUS ROG Strix SCAR III G731GW-XB74 | |
| Alienware m15 P79F | |
| Razer Blade Pro 17 RTX 2060 | |
| Asus Zephyrus S GX701GX | |
| Átlagos NVIDIA GeForce RTX 2060 Mobile (54 - 86, n=22) | |
| Asus ROG Strix G GL731GU-RB74 | |
| MSI GF75 Thin 9SC | |
| The Witcher 3 - 1920x1080 Ultra Graphics & Postprocessing (HBAO+) | |
| MSI GE75 9SG | |
| Razer Blade Pro 17 RTX 2080 Max-Q | |
| Asus Zephyrus S GX701GX | |
| MSI GS75 Stealth 9SG | |
| Schenker XMG Ultra 15 Turing | |
| MSI RTX 2060 Gaming Z 6G | |
| Razer Blade Pro 17 RTX 2060 | |
| Razer Blade Pro 2017 | |
| Alienware m15 P79F | |
| Asus ASUS ROG Strix SCAR III G731GW-XB74 | |
| Acer Predator Helios 500 PH517-51-93LS | |
| Átlagos NVIDIA GeForce RTX 2060 Mobile (50.6 - 74, n=40) | |
| Alienware 17 R5 | |
| Lenovo Legion Y540-17IRH | |
| Asus ROG Strix G GL731GU-RB74 | |
| Asus Strix GL703VM-DB74 | |
| MSI GF75 Thin 9SC | |
| alacsony | közepes | magas | ultra | |
|---|---|---|---|---|
| BioShock Infinite (2013) | 320.8 | 278 | 246.3 | 153.4 |
| The Witcher 3 (2015) | 279.4 | 196.4 | 118.5 | 65 |
| Shadow of the Tomb Raider (2018) | 130 | 97 | 92 | 81 |
| Razer Blade Pro 17 RTX 2060 GeForce RTX 2060 Mobile, i7-9750H, Samsung SSD PM981 MZVLB512HAJQ | Asus Zephyrus S GX701GX GeForce RTX 2080 Max-Q, i7-8750H, Samsung SSD PM981 MZVLB1T0HALR | MSI GS75 Stealth 9SG GeForce RTX 2080 Max-Q, i7-9750H, 2x Samsung SSD PM981 MZVLB1T0HALR (RAID 0) | Asus ASUS ROG Strix SCAR III G731GW-XB74 GeForce RTX 2070 Mobile, i7-9750H, Intel SSD 660p 1TB SSDPEKNW010T8 | Razer Blade Pro 2017 GeForce GTX 1080 Mobile, i7-7820HK, 2x Samsung SSD PM951 MZVLV256HCHP (RAID 0) | Razer Blade Pro 17 RTX 2080 Max-Q GeForce RTX 2080 Max-Q, i7-9750H, Samsung SSD PM981 MZVLB512HAJQ | Acer Predator Helios 500 PH517-51-93LS GeForce GTX 1070 Mobile, i9-8950HK, Liteon CA1-8D512 | |
|---|---|---|---|---|---|---|---|
| Noise | -6% | -9% | -6% | -9% | -2% | 6% | |
| off / környezet * (dB) | 28.2 | 29 -3% | 30 -6% | 28.2 -0% | 30 -6% | 28.2 -0% | 29.4 -4% |
| Idle Minimum * (dB) | 28.2 | 29 -3% | 31 -10% | 28.2 -0% | 30 -6% | 28.2 -0% | 29.4 -4% |
| Idle Average * (dB) | 28.2 | 32 -13% | 32 -13% | 28.5 -1% | 31 -10% | 28.2 -0% | 29.4 -4% |
| Idle Maximum * (dB) | 28.2 | 33 -17% | 38 -35% | 30 -6% | 33 -17% | 30.8 -9% | 30.1 -7% |
| Load Average * (dB) | 43 | 47 -9% | 47 -9% | 51.5 -20% | 43 -0% | 42 2% | 36 16% |
| Witcher 3 ultra * (dB) | 48.4 | 49 -1% | 48 1% | 55.3 -14% | 55 -14% | 51 -5% | 37.6 22% |
| Load Maximum * (dB) | 53.4 | 51 4% | 49 8% | 55.3 -4% | 58 -9% | 53 1% | 42.2 21% |
* ... a kisebb jobb
Zajszint
| Üresjárat |
| 28.2 / 28.2 / 28.2 dB(A) |
| Terhelés |
| 43 / 53.4 dB(A) |
 | ||
30 dB csendes 40 dB(A) hallható 50 dB(A) hangos |
||
min: | ||
(±) A felső oldalon a maximális hőmérséklet 40.6 °C / 105 F, összehasonlítva a 40.4 °C / 105 F átlagával , 21.2 és 68.8 °C között a Gaming osztálynál.
(-) Az alsó maximum 45.4 °C / 114 F-ig melegszik fel, összehasonlítva a 43.2 °C / 110 F átlagával
(+) Üresjáratban a felső oldal átlagos hőmérséklete 28.6 °C / 83 F, összehasonlítva a 33.9 °C / ### eszközátlaggal class_avg_f### F.
(±) A The Witcher 3 játék során a felső oldal átlaghőmérséklete 32.8 °C / 91 F, összehasonlítva a 33.9 °C / ## eszközátlaggal #class_avg_f### F.
(+) A csuklótámasz és az érintőpad hűvösebb, mint a bőr hőmérséklete, maximum 30 °C / 86 F, ezért hűvös tapintású.
(±) A hasonló eszközök csuklótámasz területének átlagos hőmérséklete 28.8 °C / 83.8 F volt (-1.2 °C / -2.2 F).
Razer Blade Pro 17 RTX 2060 hangelemzés
(+) | a hangszórók viszonylag hangosan tudnak játszani (84.9 dB)
Basszus 100 - 315 Hz
(±) | csökkentett basszus – átlagosan 9.6%-kal alacsonyabb, mint a medián
(±) | a basszus linearitása átlagos (14.4% delta az előző frekvenciához)
Közepes 400-2000 Hz
(±) | magasabb középértékek – átlagosan 6.7%-kal magasabb, mint a medián
(+) | a középpontok lineárisak (5.1% delta az előző frekvenciához)
Maximum 2-16 kHz
(+) | kiegyensúlyozott csúcsok – csak 2.4% választja el a mediántól
(+) | a csúcsok lineárisak (4.4% delta az előző frekvenciához képest)
Összességében 100 - 16.000 Hz
(±) | az általános hang linearitása átlagos (18.1% eltérés a mediánhoz képest)
Ugyanazon osztályhoz képest
» 57%Ebben az osztályban az összes tesztelt eszköz %-a jobb volt, 8% hasonló, 35%-kal rosszabb
» A legjobb delta értéke 6%, az átlag 18%, a legrosszabb 132% volt
Az összes tesztelt eszközzel összehasonlítva
» 38% az összes tesztelt eszköz jobb volt, 8% hasonló, 54%-kal rosszabb
» A legjobb delta értéke 4%, az átlag 24%, a legrosszabb 134% volt
Apple MacBook 12 (Early 2016) 1.1 GHz hangelemzés
(+) | a hangszórók viszonylag hangosan tudnak játszani (83.6 dB)
Basszus 100 - 315 Hz
(±) | csökkentett basszus – átlagosan 11.3%-kal alacsonyabb, mint a medián
(±) | a basszus linearitása átlagos (14.2% delta az előző frekvenciához)
Közepes 400-2000 Hz
(+) | kiegyensúlyozott középpontok – csak 2.4% választja el a mediántól
(+) | a középpontok lineárisak (5.5% delta az előző frekvenciához)
Maximum 2-16 kHz
(+) | kiegyensúlyozott csúcsok – csak 2% választja el a mediántól
(+) | a csúcsok lineárisak (4.5% delta az előző frekvenciához képest)
Összességében 100 - 16.000 Hz
(+) | általános hangzás lineáris (10.2% eltérés a mediánhoz képest)
Ugyanazon osztályhoz képest
» 7%Ebben az osztályban az összes tesztelt eszköz %-a jobb volt, 2% hasonló, 91%-kal rosszabb
» A legjobb delta értéke 5%, az átlag 18%, a legrosszabb 53% volt
Az összes tesztelt eszközzel összehasonlítva
» 5% az összes tesztelt eszköz jobb volt, 1% hasonló, 94%-kal rosszabb
» A legjobb delta értéke 4%, az átlag 24%, a legrosszabb 134% volt
| Kikapcsolt állapot / Készenlét | |
| Üresjárat | |
| Terhelés |
|
Kulcs:
min: | |
| Razer Blade Pro 17 RTX 2060 i7-9750H, GeForce RTX 2060 Mobile, Samsung SSD PM981 MZVLB512HAJQ, IPS, 1920x1080, 17.3" | Razer Blade Pro 17 RTX 2080 Max-Q i7-9750H, GeForce RTX 2080 Max-Q, Samsung SSD PM981 MZVLB512HAJQ, IPS, 1920x1080, 17.3" | Asus ASUS ROG Strix SCAR III G731GW-XB74 i7-9750H, GeForce RTX 2070 Mobile, Intel SSD 660p 1TB SSDPEKNW010T8, IPS, 1920x1080, 17.3" | Razer Blade Pro 2017 i7-7820HK, GeForce GTX 1080 Mobile, 2x Samsung SSD PM951 MZVLV256HCHP (RAID 0), IGZO, 3840x2160, 17.3" | Acer Predator Helios 500 PH517-51-93LS i9-8950HK, GeForce GTX 1070 Mobile, Liteon CA1-8D512, IPS LED, 3840x2160, 17.3" | Asus GL704GM-DH74 i7-8750H, GeForce GTX 1060 Mobile, WDC PC SN520 SDAPNUW-256G, IPS, 1920x1080, 17.3" | |
|---|---|---|---|---|---|---|
| Power Consumption | 1% | -16% | -46% | -31% | 8% | |
| Idle Minimum * (Watt) | 16 | 16.2 -1% | 18.2 -14% | 31 -94% | 24.6 -54% | 15.2 5% |
| Idle Average * (Watt) | 21.7 | 20.4 6% | 23 -6% | 36 -66% | 33.1 -53% | 20.4 6% |
| Idle Maximum * (Watt) | 26.1 | 26.1 -0% | 33.1 -27% | 44 -69% | 37.2 -43% | 27.3 -5% |
| Load Average * (Watt) | 105.6 | 96.5 9% | 124.8 -18% | 107 -1% | 124 -17% | 92.9 12% |
| Witcher 3 ultra * (Watt) | 161.8 | 182.9 -13% | 180.8 -12% | 212 -31% | 180 -11% | 143 12% |
| Load Maximum * (Watt) | 225.3 | 214.3 5% | 263 -17% | 258 -15% | 236.5 -5% | 190.6 15% |
* ... a kisebb jobb
| Razer Blade Pro 17 RTX 2060 i7-9750H, GeForce RTX 2060 Mobile, 70 Wh | Asus Zephyrus S GX701GX i7-8750H, GeForce RTX 2080 Max-Q, 76 Wh | MSI GS75 Stealth 9SG i7-9750H, GeForce RTX 2080 Max-Q, 80.25 Wh | Asus ASUS ROG Strix SCAR III G731GW-XB74 i7-9750H, GeForce RTX 2070 Mobile, 66 Wh | Razer Blade Pro 2017 i7-7820HK, GeForce GTX 1080 Mobile, 99 Wh | Acer Predator Helios 500 PH517-51-93LS i9-8950HK, GeForce GTX 1070 Mobile, 74 Wh | Razer Blade Pro 17 RTX 2080 Max-Q i7-9750H, GeForce RTX 2080 Max-Q, 70 Wh | |
|---|---|---|---|---|---|---|---|
| Akkumulátor üzemidő | -16% | 33% | -13% | -27% | -36% | 4% | |
| WiFi v1.3 (h) | 4.5 | 3.8 -16% | 6 33% | 3.9 -13% | 3.3 -27% | 2.9 -36% | 4.7 4% |
| Reader / Idle (h) | 5 | 7.7 | 4.2 | 4.2 | 4.9 | ||
| Load (h) | 0.9 | 1.2 | 1.4 | 1.4 | 1.4 |
Pro
Kontra
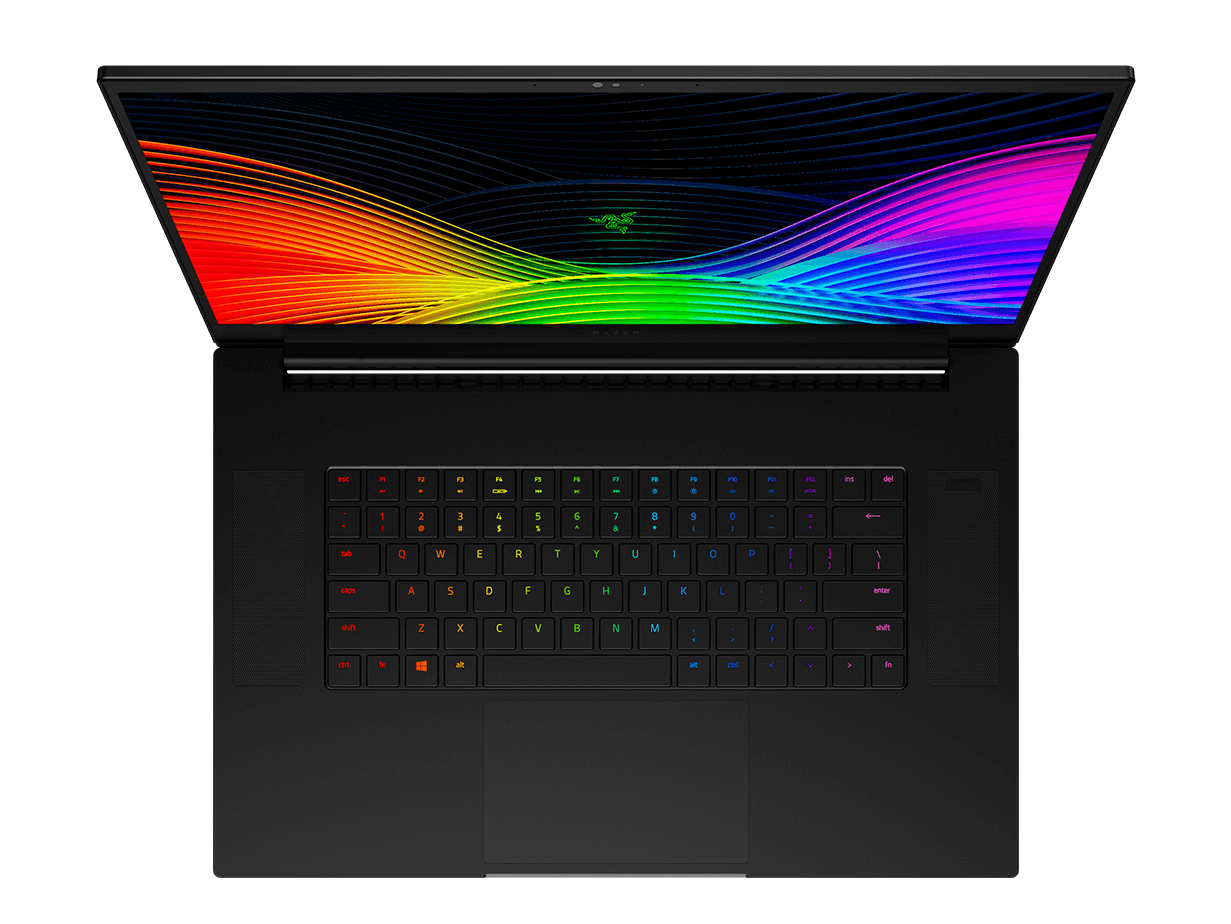
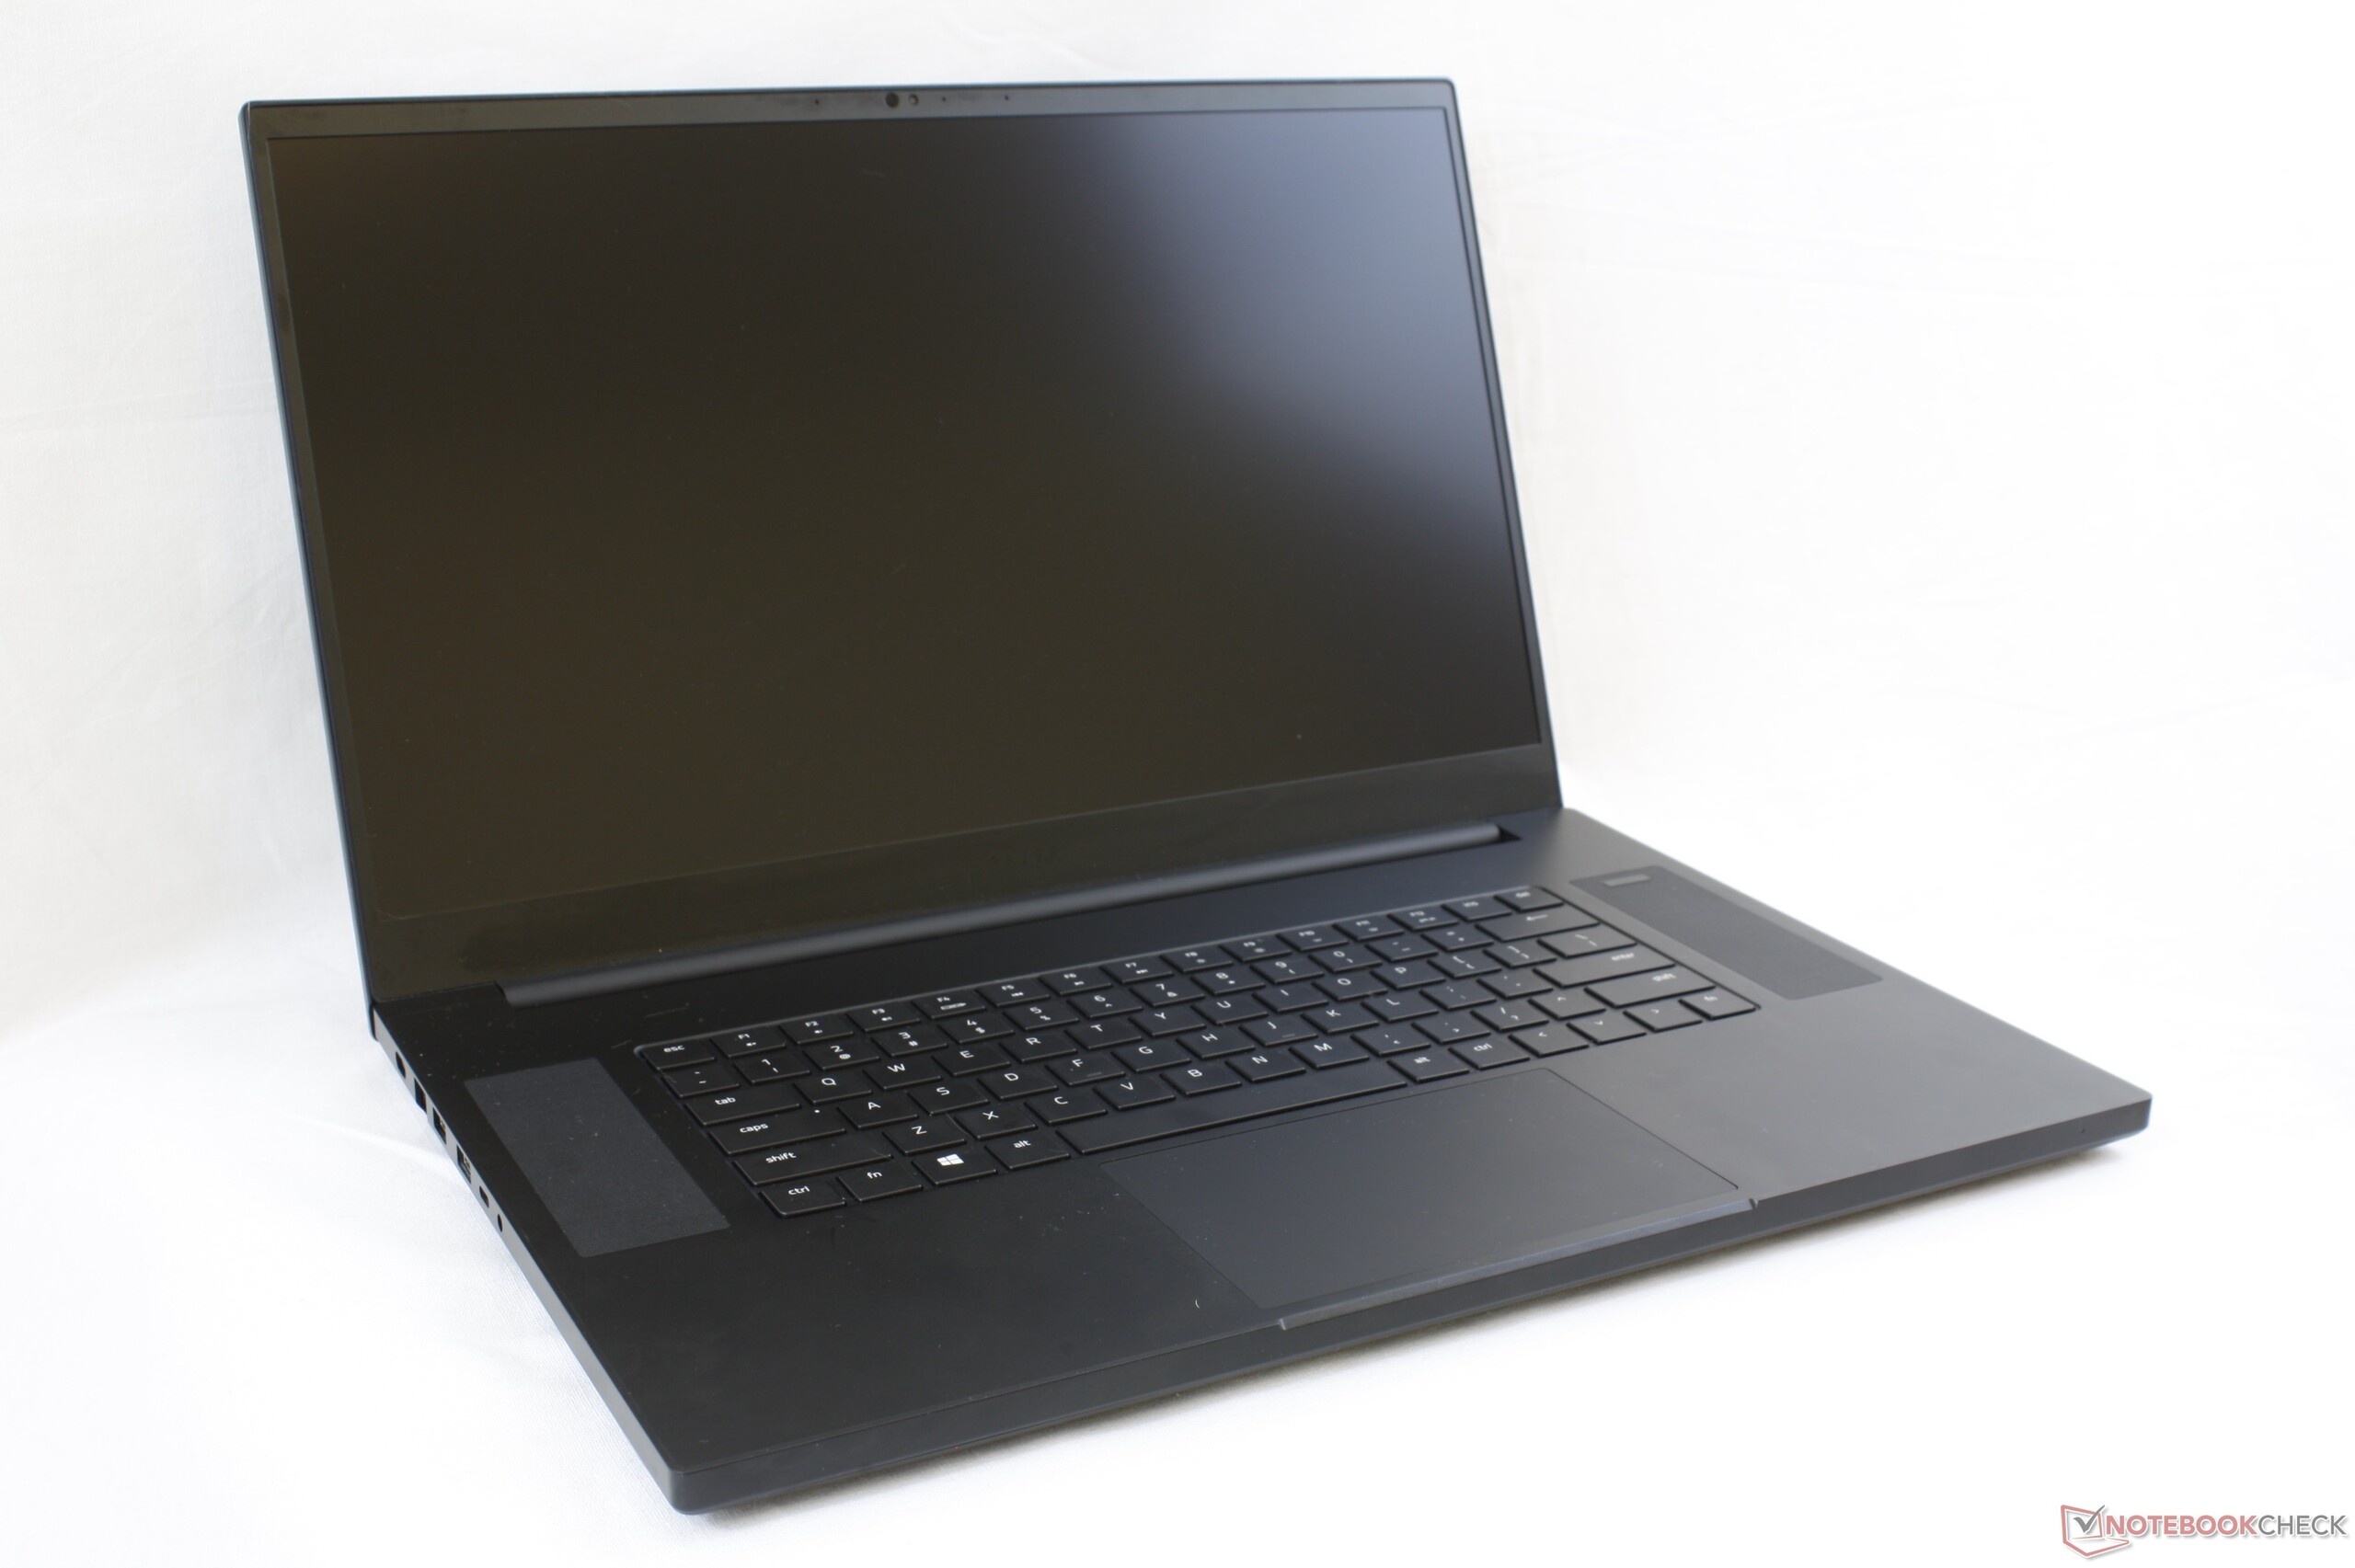
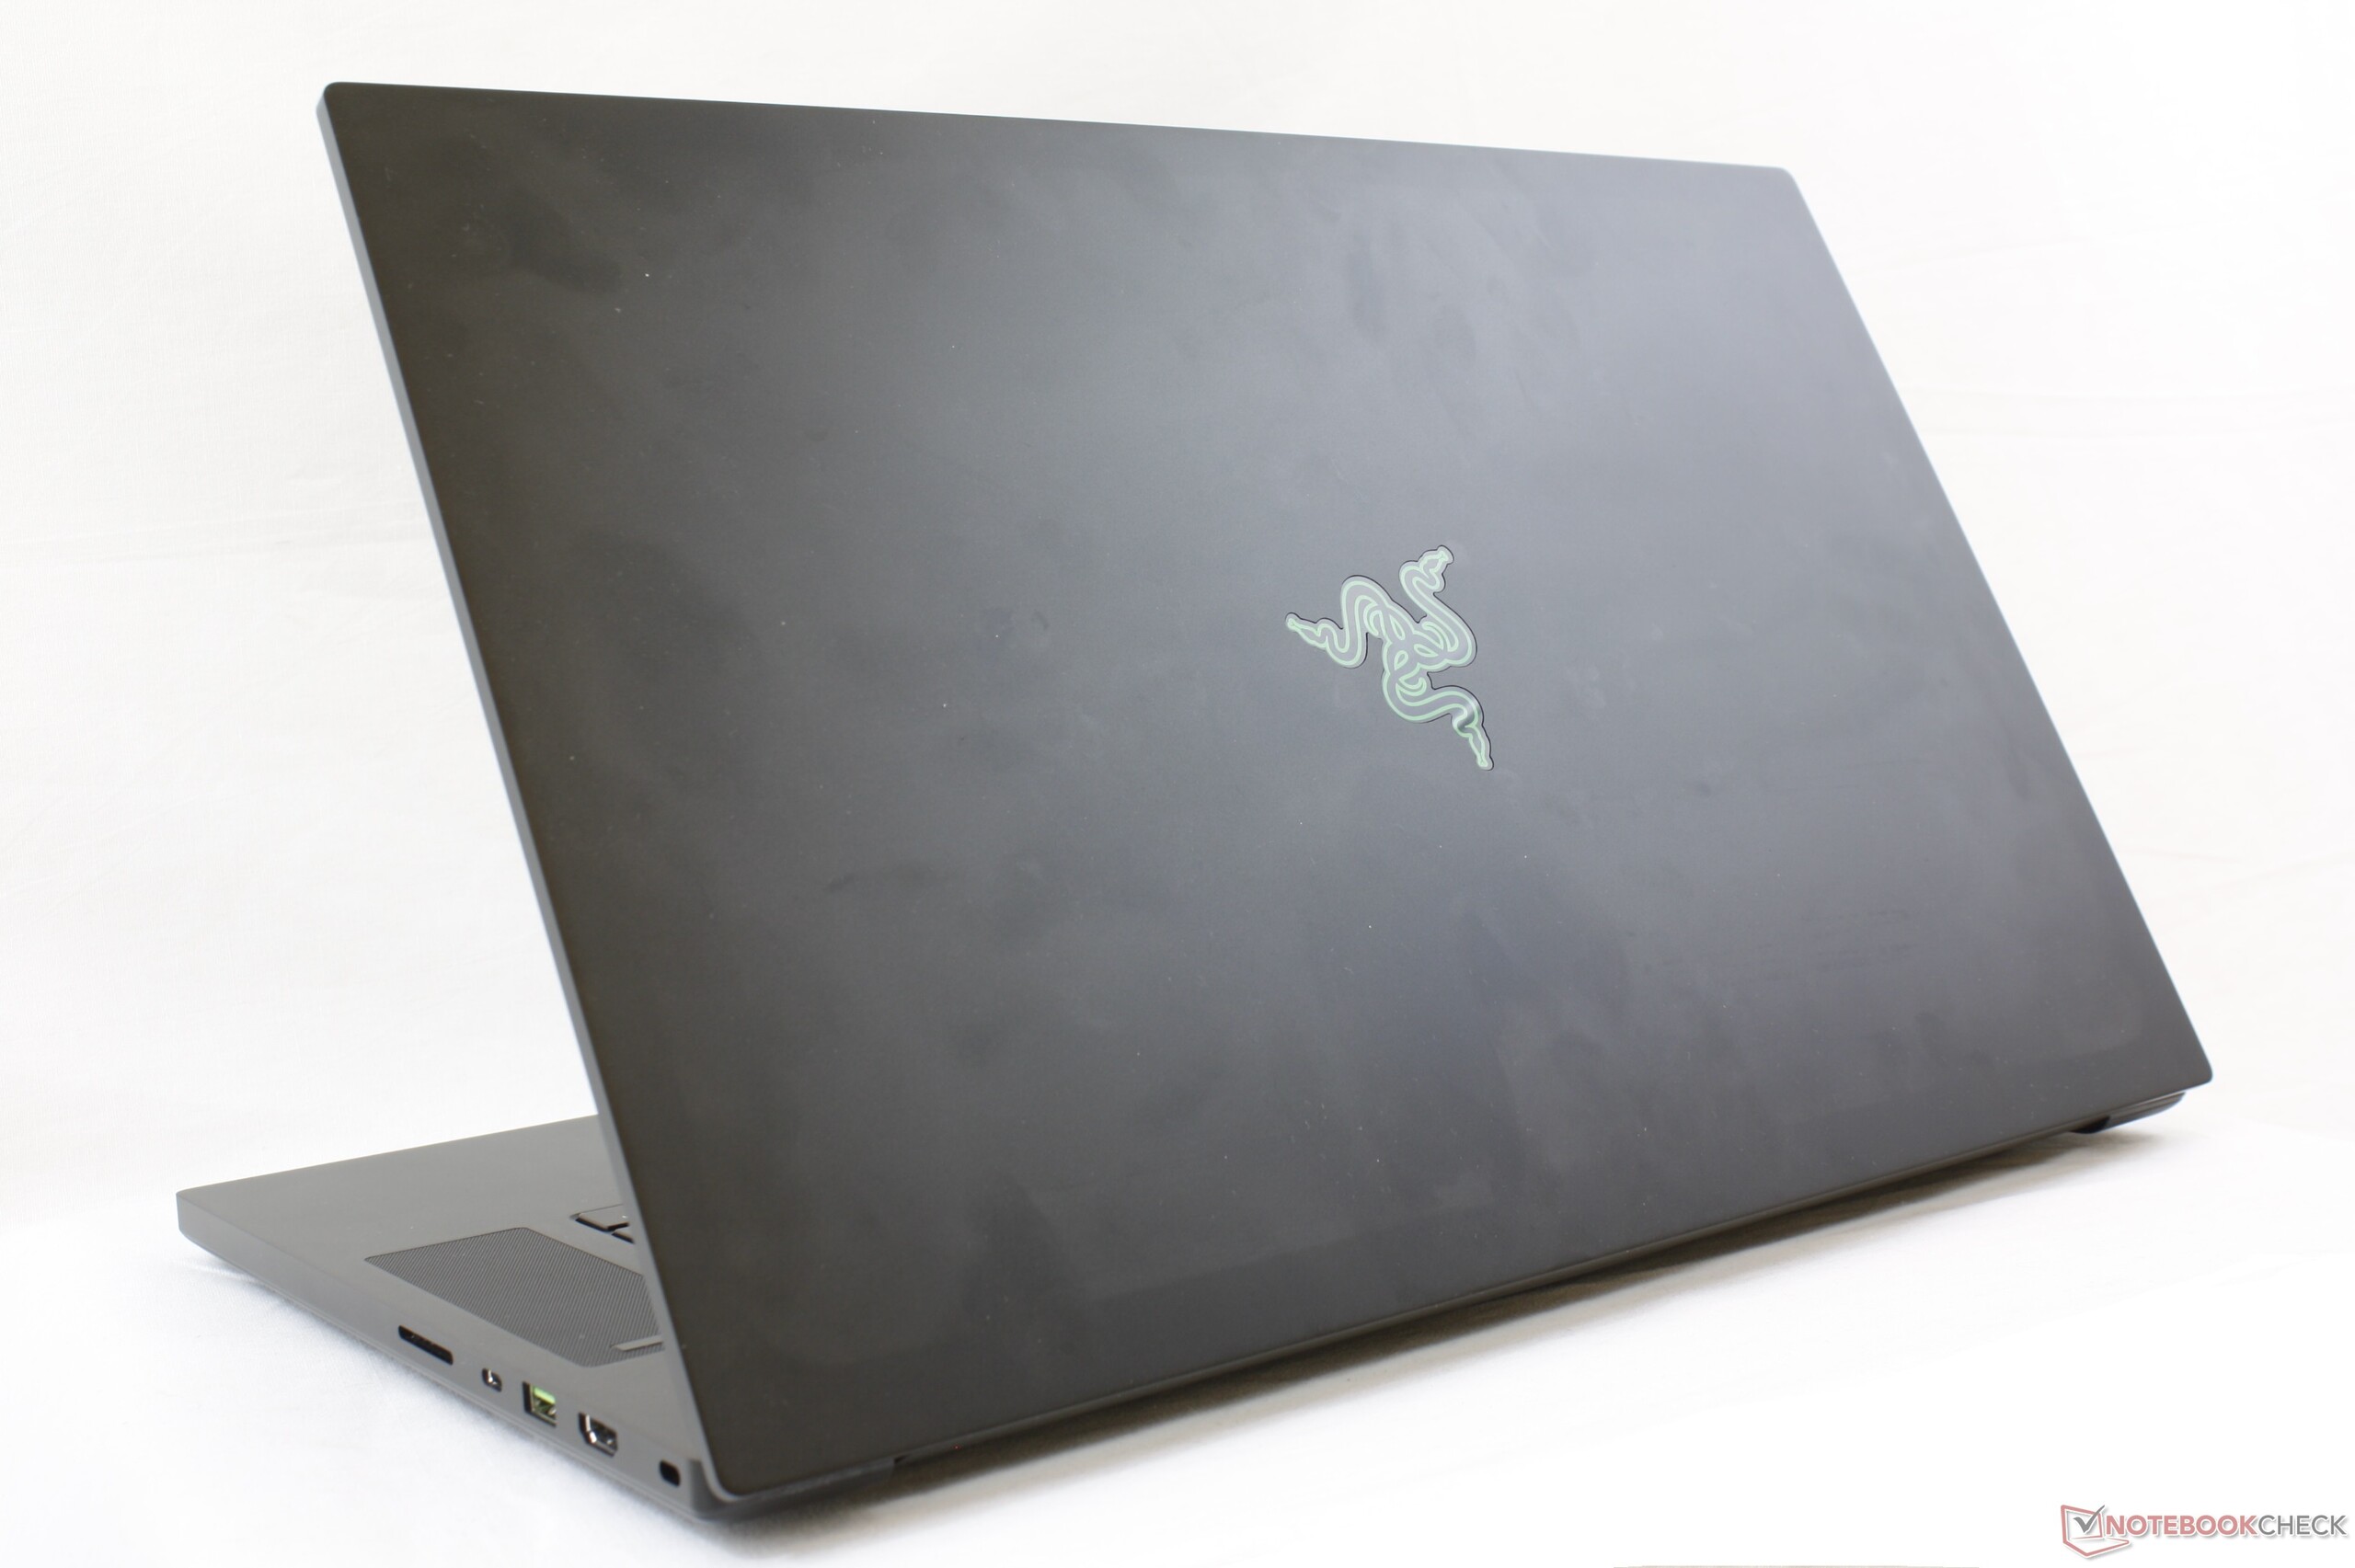
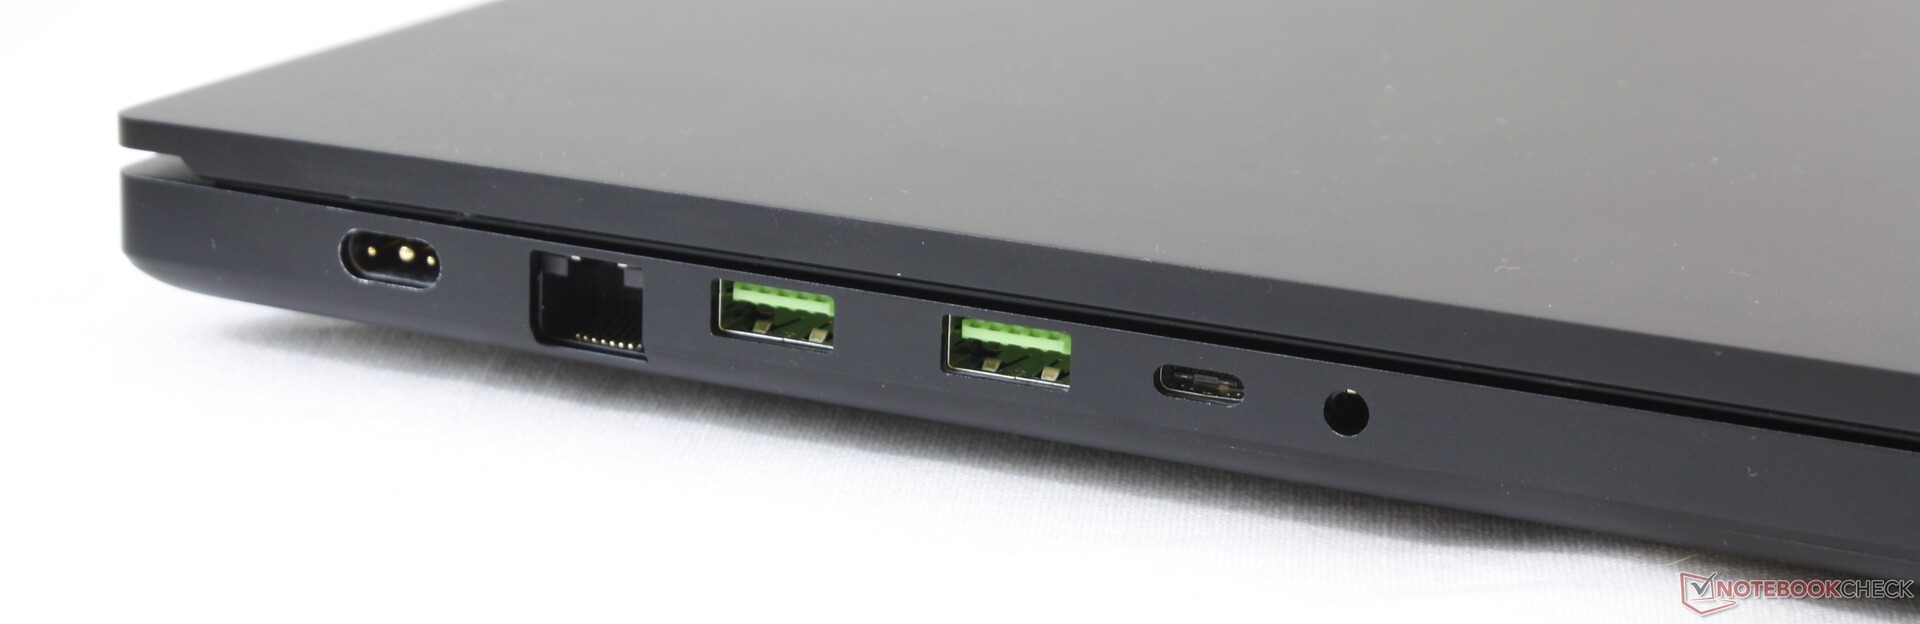
2500 dollárért a Razer Blade Pro 17 RTX 2060 drágább, mint a legtöbb alternatíva, mint amilyen az Asus ROG Scar II GL704GV, a Zephyrus S GX701GV vagy az MSI GS75, amelyek ugyanazzal a GPU-val konfigurálhatók. A plusz ár oka nem csak a Razer minimalista és erősebb váz dizájnja, hanem a gőzkamrás hűtés, az UHS-III kártyaolvasó, a 2.5 Gbites RJ-45 és a Wi-Fi 6 kapcsolat is, amelyek ritkaságoknak számítanak a versengő RTX 2060-as notebookokon. A Blade-et asztroszürkére festve a járókelők valószínűleg összetévesztenék egy jobban kinéző MacBook Pro-val, és jó okkal.
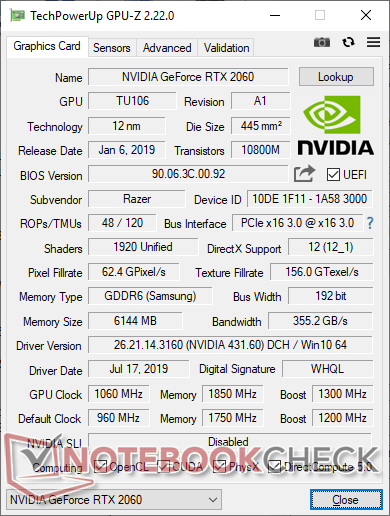
A Blade Pro 17 apró, de figyelemre méltó előnye, hogy az RTX 2060 GPU gyorsabb órajeleken fut, mint más notebookok ugyanazzal a GPU-val, valamivel gyorsabb teljesítményt eredményezve a játékokban. A különbség elég nagy ahhoz, hogy a játékteljesítmény megközelítse az RTX 2070 Max-Q-t, ami voltaképpen csökkenti a Blade Pro 17 RTX 2070 Max-Q SKU ár/érték arányát. Az RTX 2060 SKU-t az RTX 2080 Max-Q-hoz hasonlítva, az utóbbi 35 százalékkal gyorsabb teljesítményt nyújt, ami 13 százalékkal nagyobb energiafogyasztással jár. Más alapvető szempontok, mint az üzemidő, a ventilátorzaj és a hőmérséklet szinte megegyeznek a különféle Blade Pro 17 SKU-k között, annak ellenére, hogy grafikus teljesítményük eltérő.
A Blade Pro 17 a legjobbat hozza ki a GeForce RTX 2060-ból. Az olyan kiegészítő jellemzők, mint a négyes ventilátorok, a gőzkamrás hűtés, az UHS-III kártyaolvasó, a 2.5 Gbites RJ-45 és a Wi-Fi 6 kapcsolat egyetlen más, RTX 2060 GPU-val felszerelt gamer notebookon sem találhatók meg.
Razer Blade Pro 17 RTX 2060
- 08/05/2019 v6 (old)
Allen Ngo
Price comparison

