Dell Alienware m17 R2 Laptop rövid értékelés: Érdemessé teszi a Core i9-et.
Értékelés | Dátum | Modell | Súly | Magasság | Méret | Felbontás | Legjobb ár |
|---|---|---|---|---|---|---|---|
| 84.2 % v7 (old) | 04/2020 | Alienware m17 R2 P41E i9-9980HK, GeForce RTX 2080 Max-Q | 2.6 kg | 20.5 mm | 17.30" | 1920x1080 | |
| 82.9 % v7 (old) | 07/2019 | MSI GS75 Stealth 9SG i7-9750H, GeForce RTX 2080 Max-Q | 2.3 kg | 18.9 mm | 17.30" | 1920x1080 | |
| 87.7 % v7 (old) | 08/2019 | Razer Blade Pro 17 RTX 2080 Max-Q i7-9750H, GeForce RTX 2080 Max-Q | 2.8 kg | 19.9 mm | 17.30" | 1920x1080 | |
| 86.1 % v7 (old) | 12/2019 | Gigabyte Aero 17 XA RP77 i9-9980HK, GeForce RTX 2070 Max-Q | 2.5 kg | 21.4 mm | 17.30" | 3840x2160 | |
| 85.6 % v6 (old) | 04/2019 | Asus ROG Strix Scar II GL704GW i7-8750H, GeForce RTX 2070 Mobile | 2.9 kg | 26.4 mm | 17.30" | 1920x1080 |
| Networking | |
| iperf3 transmit AX12 | |
| Acer Aspire 5 A514-52 | |
| Alienware m17 R2 P41E | |
| iperf3 receive AX12 | |
| Acer Aspire 5 A514-52 | |
| Alienware m17 R2 P41E | |

| |||||||||||||||||||||||||
Fényerő megoszlás: 90 %
Kontraszt: 1325:1 (Fekete: 0.29 cd/m²)
ΔE ColorChecker Calman: 1.35 | ∀{0.5-29.43 Ø4.73}
calibrated: 1.42
ΔE Greyscale Calman: 1.2 | ∀{0.09-98 Ø4.97}
98.5% sRGB (Argyll 1.6.3 3D)
65.5% AdobeRGB 1998 (Argyll 1.6.3 3D)
72.2% AdobeRGB 1998 (Argyll 3D)
98.5% sRGB (Argyll 3D)
70.8% Display P3 (Argyll 3D)
Gamma: 2.23
CCT: 6580 K
| Alienware m17 R2 P41E Chi Mei 173HCE, CMN175F, IPS, 17.3", 1920x1080 | Alienware m17 P37E AU Optronics B173ZAN01.0, IPS, 17.3", 3840x2160 | MSI GS75 Stealth 9SG Chi Mei N173HCE-G33 (CMN175C), IPS, 17.3", 1920x1080 | Razer Blade Pro 17 RTX 2080 Max-Q AU Optronics B173HAN04.0, IPS, 17.3", 1920x1080 | Gigabyte Aero 17 XA RP77 AU Optronics B173ZAN03.2, IPS, 17.3", 3840x2160 | Asus ROG Strix Scar II GL704GW B173HAN04.0 (AUO409D), AHVA, 17.3", 1920x1080 | |
|---|---|---|---|---|---|---|
| Display | 20% | -9% | -13% | 21% | -12% | |
| Display P3 Coverage (%) | 70.8 | 86.4 22% | 62.6 -12% | 60.6 -14% | 86.8 23% | 62.9 -11% |
| sRGB Coverage (%) | 98.5 | 99.9 1% | 93.5 -5% | 89 -10% | 100 2% | 87.1 -12% |
| AdobeRGB 1998 Coverage (%) | 72.2 | 99.1 37% | 64.7 -10% | 62.1 -14% | 99.5 38% | 63.7 -12% |
| Response Times | -133% | 33% | 36% | -173% | -3% | |
| Response Time Grey 50% / Grey 80% * (ms) | 17.2 ? | 35.6 ? -107% | 7.2 ? 58% | 6.8 ? 60% | 45.6 ? -165% | 17.6 ? -2% |
| Response Time Black / White * (ms) | 10.8 ? | 28 ? -159% | 10 ? 7% | 9.6 ? 11% | 30.4 ? -181% | 11.2 ? -4% |
| PWM Frequency (Hz) | 26320 ? | 25510 ? | ||||
| Screen | -110% | -4% | -46% | -24% | -40% | |
| Brightness middle (cd/m²) | 384.2 | 357.9 -7% | 366 -5% | 299.3 -22% | 667.3 74% | 295 -23% |
| Brightness (cd/m²) | 357 | 347 -3% | 343 -4% | 294 -18% | 633 77% | 291 -18% |
| Brightness Distribution (%) | 90 | 94 4% | 91 1% | 94 4% | 90 0% | 96 7% |
| Black Level * (cd/m²) | 0.29 | 0.33 -14% | 0.29 -0% | 0.29 -0% | 0.46 -59% | 0.24 17% |
| Contrast (:1) | 1325 | 1085 -18% | 1262 -5% | 1032 -22% | 1451 10% | 1229 -7% |
| Colorchecker dE 2000 * | 1.35 | 6.57 -387% | 1.51 -12% | 2.55 -89% | 3.53 -161% | 3.2 -137% |
| Colorchecker dE 2000 max. * | 3.45 | 9.86 -186% | 3.22 7% | 4.73 -37% | 6.88 -99% | 6.64 -92% |
| Colorchecker dE 2000 calibrated * | 1.42 | 6.74 -375% | 0.71 50% | 2.9 -104% | 3.79 -167% | 2.52 -77% |
| Greyscale dE 2000 * | 1.2 | 4.3 -258% | 1.93 -61% | 3.5 -192% | 0.9 25% | 2.16 -80% |
| Gamma | 2.23 99% | 2.6 85% | 2.38 92% | 2.28 96% | 2.17 101% | 2.46 89% |
| CCT | 6580 99% | 6403 102% | 6881 94% | 7101 92% | 6533 99% | 6872 95% |
| Color Space (Percent of AdobeRGB 1998) (%) | 65.5 | 88.4 35% | 60 -8% | 57 -13% | 87.1 33% | 57 -13% |
| Color Space (Percent of sRGB) (%) | 98.5 | 100 2% | 94 -5% | 88.7 -10% | 100 2% | 87 -12% |
| Teljes átlag (program / beállítások) | -74% /
-88% | 7% /
-0% | -8% /
-29% | -59% /
-34% | -18% /
-30% |
* ... a kisebb jobb
Megjelenítési válaszidők
| ↔ Válaszidő Fekete-fehér | ||
|---|---|---|
| 10.8 ms ... emelkedés és süllyedés ↘ kombinálva | ↗ 6 ms emelkedés | 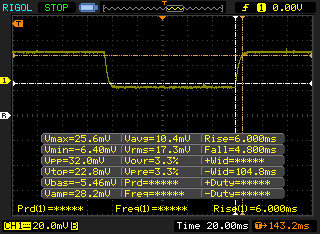 |
| ↘ 4.8 ms ősz | ||
| A képernyő jó reakciósebességet mutat tesztjeinkben, de túl lassú lehet a versenyképes játékosok számára. Összehasonlításképpen, az összes tesztelt eszköz 0.1 (minimum) és 240 (maximum) ms között mozog. » 29 % of all devices are better. Ez azt jelenti, hogy a mért válaszidő jobb, mint az összes vizsgált eszköz átlaga (19.9 ms). | ||
| ↔ Válaszidő 50% szürke és 80% szürke között | ||
| 17.2 ms ... emelkedés és süllyedés ↘ kombinálva | ↗ 8.8 ms emelkedés | 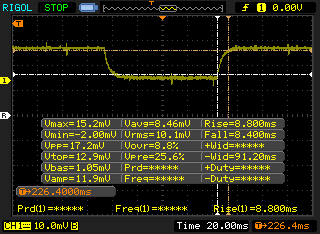 |
| ↘ 8.4 ms ősz | ||
| A képernyő jó reakciósebességet mutat tesztjeinkben, de túl lassú lehet a versenyképes játékosok számára. Összehasonlításképpen, az összes tesztelt eszköz 0.165 (minimum) és 636 (maximum) ms között mozog. » 31 % of all devices are better. Ez azt jelenti, hogy a mért válaszidő jobb, mint az összes vizsgált eszköz átlaga (31.1 ms). | ||
Képernyő villogása / PWM (impulzusszélesség-moduláció)
| Képernyő villogása / PWM észlelve | 26320 Hz | ≤ 25 % fényerő beállítása | 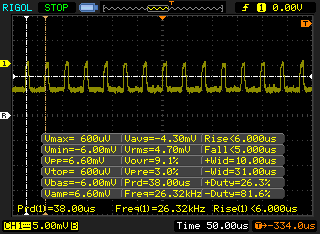 |
A kijelző háttérvilágítása 26320 Hz-en villog (a legrosszabb esetben, pl. PWM használatával) Villódzás észlelve a 25 % vagy annál kisebb fényerő-beállításnál. E fényerő-beállítás felett nem lehet villogás vagy PWM. A 26320 Hz frekvenciája meglehetősen magas, így a legtöbb PWM-re érzékeny felhasználó nem észlel semmilyen villogást. Összehasonlításképpen: az összes tesztelt eszköz 52 %-a nem használja a PWM-et a kijelző elsötétítésére. Ha PWM-et észleltek, akkor átlagosan 7798 (minimum: 5 - maximum: 343500) Hz-t mértek. | |||
| Cinebench R20 | |
| CPU (Multi Core) | |
| Eurocom Sky X4C i9-9900KS | |
| Alienware m17 R2 P41E | |
| Átlagos Intel Core i9-9980HK (2974 - 4150, n=10) | |
| MSI GE65 Raider 9SF-049US | |
| Apple MacBook Pro 15 2019 i9 Vega 20 | |
| Medion Erazer X15805 | |
| Alienware m15 R2 P87F | |
| MSI GE63 Raider 8SG | |
| MSI GF63 Thin 9SC | |
| MSI Alpha 15 A3DDK-034 | |
| Razer Blade Stealth i7-1065G7 Iris Plus | |
| CPU (Single Core) | |
| Eurocom Sky X4C i9-9900KS | |
| Medion Erazer X15805 | |
| Apple MacBook Pro 15 2019 i9 Vega 20 | |
| Alienware m17 R2 P41E | |
| MSI GE65 Raider 9SF-049US | |
| Átlagos Intel Core i9-9980HK (431 - 505, n=10) | |
| Alienware m15 R2 P87F | |
| MSI GF63 Thin 9SC | |
| MSI GE63 Raider 8SG | |
| Razer Blade Stealth i7-1065G7 Iris Plus | |
| MSI Alpha 15 A3DDK-034 | |
| Cinebench R15 | |
| CPU Single 64Bit | |
| Eurocom Sky X4C i9-9900KS | |
| Medion Erazer X15805 | |
| Átlagos Intel Core i9-9980HK (181 - 215, n=13) | |
| MSI GE65 Raider 9SF-049US | |
| Alienware m17 R2 P41E | |
| Apple MacBook Pro 15 2019 i9 Vega 20 | |
| Alienware m15 R2 P87F | |
| MSI GF63 Thin 9SC | |
| MSI GE63 Raider 8SG | |
| Razer Blade Stealth i7-1065G7 Iris Plus | |
| MSI Alpha 15 A3DDK-034 | |
| CPU Multi 64Bit | |
| Eurocom Sky X4C i9-9900KS | |
| Alienware m17 R2 P41E | |
| Átlagos Intel Core i9-9980HK (1327 - 1930, n=14) | |
| MSI GE65 Raider 9SF-049US | |
| Apple MacBook Pro 15 2019 i9 Vega 20 | |
| Medion Erazer X15805 | |
| Alienware m15 R2 P87F | |
| MSI GE63 Raider 8SG | |
| MSI GF63 Thin 9SC | |
| MSI Alpha 15 A3DDK-034 | |
| Razer Blade Stealth i7-1065G7 Iris Plus | |
| Cinebench R11.5 | |
| CPU Single 64Bit | |
| Eurocom Sky X4C i9-9900KS | |
| Átlagos Intel Core i9-9980HK (2.25 - 2.4, n=3) | |
| CPU Multi 64Bit | |
| Eurocom Sky X4C i9-9900KS | |
| Átlagos Intel Core i9-9980HK (14.8 - 18, n=3) | |
| Cinebench R10 | |
| Rendering Multiple CPUs 32Bit | |
| Eurocom Sky X4C i9-9900KS | |
| Átlagos Intel Core i9-9980HK (39440 - 50439, n=4) | |
| Medion Erazer X15805 | |
| MSI Alpha 15 A3DDK-034 | |
| Rendering Single 32Bit | |
| Átlagos Intel Core i9-9980HK (7709 - 9734, n=4) | |
| Eurocom Sky X4C i9-9900KS | |
| Medion Erazer X15805 | |
| MSI Alpha 15 A3DDK-034 | |
| wPrime 2.10 - 1024m | |
| Átlagos Intel Core i9-9980HK (110.4 - 120.2, n=2) | |
| Eurocom Sky X4C i9-9900KS | |
* ... a kisebb jobb
| PCMark 8 Home Score Accelerated v2 | 4384 pontok | |
| PCMark 8 Work Score Accelerated v2 | 5818 pontok | |
| PCMark 10 Score | 5502 pontok | |
Segítség | ||
| Alienware m17 R2 P41E 2x SK Hynix PC601 NVMe 512 GB (RAID 0) | Alienware m17 P37E SK Hynix PC401 512GB M.2 (HFS512GD9TNG) | MSI GS75 Stealth 9SG 2x Samsung SSD PM981 MZVLB1T0HALR (RAID 0) | Gigabyte Aero 17 XA RP77 Intel SSD 760p SSDPEKKW512G8 | Asus ROG Strix Scar II GL704GW Intel SSD 660p SSDPEKNW512G8 | Lenovo ThinkBook 15 Samsung SSD PM981 MZVLB512HAJQ | |
|---|---|---|---|---|---|---|
| AS SSD | -23% | 13% | -34% | -26% | 28% | |
| Seq Read (MB/s) | 1938 | 1835 -5% | 2855 47% | 1812 -7% | 1315 -32% | 2564 32% |
| Seq Write (MB/s) | 2094 | 1121 -46% | 2687 28% | 1512 -28% | 927 -56% | 2268 8% |
| 4K Read (MB/s) | 25.88 | 23.98 -7% | 30.31 17% | 32.68 26% | 52.4 102% | 57 120% |
| 4K Write (MB/s) | 100.8 | 100 -1% | 96.3 -4% | 107.7 7% | 122.8 22% | 141.4 40% |
| 4K-64 Read (MB/s) | 1217 | 687 -44% | 1460 20% | 504 -59% | 326.5 -73% | 1175 -3% |
| 4K-64 Write (MB/s) | 1137 | 776 -32% | 1224 8% | 534 -53% | 727 -36% | 1665 46% |
| Access Time Read * (ms) | 0.051 | 0.047 8% | 0.054 -6% | 0.05 2% | 0.11 -116% | 0.032 37% |
| Access Time Write * (ms) | 0.107 | 0.053 50% | 0.038 64% | 0.227 -112% | 0.045 58% | 0.025 77% |
| Score Read (Points) | 1437 | 895 -38% | 1776 24% | 718 -50% | 510 -65% | 1488 4% |
| Score Write (Points) | 1447 | 988 -32% | 1589 10% | 793 -45% | 942 -35% | 2033 40% |
| Score Total (Points) | 3624 | 2306 -36% | 4259 18% | 1871 -48% | 1715 -53% | 4279 18% |
| Copy ISO MB/s (MB/s) | 1926 | 773 -60% | 2226 16% | 946 -51% | 2118 10% | |
| Copy Program MB/s (MB/s) | 626 | 493 -21% | 426.4 -32% | 414.3 -34% | 495.6 -21% | |
| Copy Game MB/s (MB/s) | 1533 | 647 -58% | 1152 -25% | 1263 -18% | 1174 -23% | |
| CrystalDiskMark 5.2 / 6 | -18% | 6% | 2% | -33% | 6% | |
| Write 4K (MB/s) | 110.6 | 120.2 9% | 95.5 -14% | 169.6 53% | 99.6 -10% | 176.3 59% |
| Read 4K (MB/s) | 41.46 | 44.3 7% | 42.59 3% | 58 40% | 48.99 18% | 48.98 18% |
| Write Seq (MB/s) | 2378 | 1278 -46% | 2851 20% | 1516 -36% | 972 -59% | 1789 -25% |
| Read Seq (MB/s) | 2114 | 1389 -34% | 2696 28% | 2362 12% | 1515 -28% | 1671 -21% |
| Write 4K Q32T1 (MB/s) | 445.4 | 436.2 -2% | 402.6 -10% | 481.8 8% | 280.6 -37% | 433.5 -3% |
| Read 4K Q32T1 (MB/s) | 509 | 515 1% | 443.9 -13% | 506 -1% | 327.8 -36% | 526 3% |
| Write Seq Q32T1 (MB/s) | 2735 | 1157 -58% | 3420 25% | 1530 -44% | 970 -65% | 2983 9% |
| Read Seq Q32T1 (MB/s) | 3206 | 2671 -17% | 3514 10% | 2645 -17% | 1757 -45% | 3555 11% |
| Write 4K Q8T8 (MB/s) | 1688 | |||||
| Read 4K Q8T8 (MB/s) | 1036 | |||||
| Teljes átlag (program / beállítások) | -21% /
-21% | 10% /
11% | -16% /
-21% | -30% /
-29% | 17% /
20% |
* ... a kisebb jobb

| 3DMark | |
| 1280x720 Cloud Gate Standard Graphics | |
| MSI RTX 2080 Ti Gaming X Trio | |
| MSI GE65 Raider 9SF-049US | |
| Alienware m17 R2 P41E | |
| Walmart EVOO Gaming 17 | |
| Alienware 17 R5 | |
| Átlagos NVIDIA GeForce RTX 2080 Max-Q (38256 - 129506, n=17) | |
| Dell G5 15 5590-P8RVW | |
| Maingear Vector 15 | |
| HP Omen X 17-ap0xx | |
| MSI GE63 Raider 8SG | |
| MSI GT72S-6QEG16SR421BW | |
| 1920x1080 Fire Strike Graphics | |
| MSI RTX 2080 Ti Gaming X Trio | |
| MSI GE63 Raider 8SG | |
| Alienware m17 R2 P41E | |
| MSI GE65 Raider 9SF-049US | |
| Átlagos NVIDIA GeForce RTX 2080 Max-Q (18048 - 23032, n=19) | |
| HP Omen X 17-ap0xx | |
| Walmart EVOO Gaming 17 | |
| Alienware 17 R5 | |
| Dell G5 15 5590-P8RVW | |
| Maingear Vector 15 | |
| MSI GT72S-6QEG16SR421BW | |
| 2560x1440 Time Spy Graphics | |
| MSI RTX 2080 Ti Gaming X Trio | |
| MSI GE63 Raider 8SG | |
| Alienware m17 R2 P41E | |
| MSI GE65 Raider 9SF-049US | |
| Átlagos NVIDIA GeForce RTX 2080 Max-Q (6464 - 8844, n=19) | |
| Walmart EVOO Gaming 17 | |
| HP Omen X 17-ap0xx | |
| Dell G5 15 5590-P8RVW | |
| Alienware 17 R5 | |
| Maingear Vector 15 | |
| MSI GT72S-6QEG16SR421BW | |
| 3DMark 11 | |
| 1280x720 Performance GPU | |
| MSI RTX 2080 Ti Gaming X Trio | |
| MSI GE63 Raider 8SG | |
| Alienware m17 R2 P41E | |
| Átlagos NVIDIA GeForce RTX 2080 Max-Q (23386 - 30910, n=20) | |
| HP Omen X 17-ap0xx | |
| MSI GE65 Raider 9SF-049US | |
| Walmart EVOO Gaming 17 | |
| Alienware 17 R5 | |
| Dell G5 15 5590-P8RVW | |
| Maingear Vector 15 | |
| MSI GT72S-6QEG16SR421BW | |
| 1280x720 Performance Combined | |
| MSI RTX 2080 Ti Gaming X Trio | |
| MSI GE65 Raider 9SF-049US | |
| Alienware m17 R2 P41E | |
| Walmart EVOO Gaming 17 | |
| Maingear Vector 15 | |
| Dell G5 15 5590-P8RVW | |
| Átlagos NVIDIA GeForce RTX 2080 Max-Q (9212 - 14894, n=20) | |
| Alienware 17 R5 | |
| HP Omen X 17-ap0xx | |
| MSI GT72S-6QEG16SR421BW | |
| MSI GE63 Raider 8SG | |
| 3DMark 11 Performance | 23774 pontok | |
| 3DMark Cloud Gate Standard Score | 50705 pontok | |
| 3DMark Fire Strike Score | 19583 pontok | |
| 3DMark Time Spy Score | 8604 pontok | |
Segítség | ||
| Shadow of the Tomb Raider | |
| 1280x720 Lowest Preset | |
| Corsair One i160 | |
| MSI GE75 9SG | |
| MSI GE65 Raider 9SF-049US | |
| Alienware m17 R2 P41E | |
| Walmart EVOO Gaming 17 | |
| Átlagos NVIDIA GeForce RTX 2080 Max-Q (114 - 142, n=5) | |
| HP Omen 15-dc0015ng | |
| HP Omen X 2S 15-dg0075cl | |
| Acer Predator Triton 700 | |
| Razer Blade 15 GTX 1660 Ti | |
| Dell G3 3590 | |
| HP Pavilion Gaming 15-ec0017ng | |
| 1920x1080 Highest Preset AA:T | |
| Corsair One i160 | |
| MSI GE75 9SG | |
| Alienware m17 R2 P41E | |
| MSI GE65 Raider 9SF-049US | |
| Átlagos NVIDIA GeForce RTX 2080 Max-Q (71 - 105, n=8) | |
| HP Omen X 2S 15-dg0075cl | |
| Walmart EVOO Gaming 17 | |
| Acer Predator Triton 700 | |
| Razer Blade 15 GTX 1660 Ti | |
| HP Omen 15-dc0015ng | |
| HP Pavilion Gaming 15-ec0017ng | |
| Asus TUF FX705GM | |
| The Witcher 3 - 1920x1080 Ultra Graphics & Postprocessing (HBAO+) | |
| Corsair One i160 | |
| MSI GE75 9SG | |
| Átlagos NVIDIA GeForce RTX 2080 Max-Q (65.7 - 92.7, n=22) | |
| MSI GE65 Raider 9SF-049US | |
| Alienware m17 R2 P41E | |
| HP Omen X 2S 15-dg0075cl | |
| Walmart EVOO Gaming 17 | |
| HP Omen 15-dc0015ng | |
| HP Pavilion Gaming 15-ec0017ng | |
| Razer Blade 15 GTX 1660 Ti | |
| Asus TUF FX705GM | |
| Dell G3 3590 | |
| alacsony | közepes | magas | ultra | |
|---|---|---|---|---|
| BioShock Infinite (2013) | 396.1 | 337.3 | 321 | 179 |
| The Witcher 3 (2015) | 326.6 | 239.3 | 149.6 | 78 |
| Shadow of the Tomb Raider (2018) | 142 | 110 | 105 | 99 |
| Alienware m17 R2 P41E GeForce RTX 2080 Max-Q, i9-9980HK, 2x SK Hynix PC601 NVMe 512 GB (RAID 0) | Alienware m17 P37E GeForce RTX 2080 Max-Q, i9-8950HK, SK Hynix PC401 512GB M.2 (HFS512GD9TNG) | MSI GS75 Stealth 9SG GeForce RTX 2080 Max-Q, i7-9750H, 2x Samsung SSD PM981 MZVLB1T0HALR (RAID 0) | Razer Blade Pro 17 RTX 2080 Max-Q GeForce RTX 2080 Max-Q, i7-9750H, Samsung SSD PM981 MZVLB512HAJQ | Gigabyte Aero 17 XA RP77 GeForce RTX 2070 Max-Q, i9-9980HK, Intel SSD 760p SSDPEKKW512G8 | Asus ROG Strix Scar II GL704GW GeForce RTX 2070 Mobile, i7-8750H, Intel SSD 660p SSDPEKNW512G8 | |
|---|---|---|---|---|---|---|
| Noise | 2% | -3% | 4% | -2% | -4% | |
| off / környezet * (dB) | 29.1 | 28.2 3% | 30 -3% | 28.2 3% | 29.3 -1% | 29 -0% |
| Idle Minimum * (dB) | 29.4 | 28.2 4% | 31 -5% | 28.2 4% | 33 -12% | 29 1% |
| Idle Average * (dB) | 29.4 | 28.2 4% | 32 -9% | 28.2 4% | 33 -12% | 32 -9% |
| Idle Maximum * (dB) | 31.5 | 31 2% | 38 -21% | 30.8 2% | 33 -5% | 40 -27% |
| Load Average * (dB) | 49.7 | 50.8 -2% | 47 5% | 42 15% | 42.5 14% | 46 7% |
| Witcher 3 ultra * (dB) | 49.5 | 50.8 -3% | 48 3% | 51 -3% | 42 15% | 51 -3% |
| Load Maximum * (dB) | 53.3 | 50.8 5% | 49 8% | 53 1% | 59.6 -12% | 52 2% |
* ... a kisebb jobb
Zajszint
| Üresjárat |
| 29.4 / 29.4 / 31.5 dB(A) |
| Terhelés |
| 49.7 / 53.3 dB(A) |
 | ||
30 dB csendes 40 dB(A) hallható 50 dB(A) hangos |
||
min: | ||
(-) A felső oldalon a maximális hőmérséklet 54.2 °C / 130 F, összehasonlítva a 40.4 °C / 105 F átlagával , 21.2 és 68.8 °C között a Gaming osztálynál.
(-) Az alsó maximum 61.4 °C / 143 F-ig melegszik fel, összehasonlítva a 43.2 °C / 110 F átlagával
(+) Üresjáratban a felső oldal átlagos hőmérséklete 31.9 °C / 89 F, összehasonlítva a 33.9 °C / ### eszközátlaggal class_avg_f### F.
(±) A The Witcher 3 játék során a felső oldal átlaghőmérséklete 33.8 °C / 93 F, összehasonlítva a 33.9 °C / ## eszközátlaggal #class_avg_f### F.
(+) A csuklótámasz és az érintőpad hűvösebb, mint a bőr hőmérséklete, maximum 31.4 °C / 88.5 F, ezért hűvös tapintású.
(-) A hasonló eszközök csuklótámasz területének átlagos hőmérséklete 28.8 °C / 83.8 F volt (-2.6 °C / -4.7 F).
| Kikapcsolt állapot / Készenlét | |
| Üresjárat | |
| Terhelés |
|
Kulcs:
min: | |
| Alienware m17 R2 P41E i9-9980HK, GeForce RTX 2080 Max-Q, 2x SK Hynix PC601 NVMe 512 GB (RAID 0), IPS, 1920x1080, 17.3" | Alienware m17 P37E i9-8950HK, GeForce RTX 2080 Max-Q, SK Hynix PC401 512GB M.2 (HFS512GD9TNG), IPS, 3840x2160, 17.3" | MSI GS75 Stealth 9SG i7-9750H, GeForce RTX 2080 Max-Q, 2x Samsung SSD PM981 MZVLB1T0HALR (RAID 0), IPS, 1920x1080, 17.3" | Razer Blade Pro 17 RTX 2080 Max-Q i7-9750H, GeForce RTX 2080 Max-Q, Samsung SSD PM981 MZVLB512HAJQ, IPS, 1920x1080, 17.3" | Gigabyte Aero 17 XA RP77 i9-9980HK, GeForce RTX 2070 Max-Q, Intel SSD 760p SSDPEKKW512G8, IPS, 3840x2160, 17.3" | Asus ROG Strix Scar II GL704GW i7-8750H, GeForce RTX 2070 Mobile, Intel SSD 660p SSDPEKNW512G8, AHVA, 1920x1080, 17.3" | |
|---|---|---|---|---|---|---|
| Power Consumption | 17% | 35% | 30% | 25% | 25% | |
| Idle Minimum * (Watt) | 24.7 | 21.2 14% | 13 47% | 16.2 34% | 13.9 44% | 19 23% |
| Idle Average * (Watt) | 35.9 | 29.6 18% | 17 53% | 20.4 43% | 24.3 32% | 22 39% |
| Idle Maximum * (Watt) | 69.6 | 34 51% | 25 64% | 26.1 62% | 35.5 49% | 29 58% |
| Load Average * (Watt) | 141.8 | 130.9 8% | 96 32% | 96.5 32% | 127.6 10% | 102 28% |
| Witcher 3 ultra * (Watt) | 185.8 | 177.5 4% | 156 16% | 182.9 2% | 158 15% | 190 -2% |
| Load Maximum * (Watt) | 235.4 | 219.7 7% | 239 -2% | 214.3 9% | 237.5 -1% | 231 2% |
* ... a kisebb jobb
| Alienware m17 R2 P41E i9-9980HK, GeForce RTX 2080 Max-Q, 76 Wh | Alienware m17 P37E i9-8950HK, GeForce RTX 2080 Max-Q, 90 Wh | MSI GS75 Stealth 9SG i7-9750H, GeForce RTX 2080 Max-Q, 80.25 Wh | Razer Blade Pro 17 RTX 2080 Max-Q i7-9750H, GeForce RTX 2080 Max-Q, 70 Wh | Gigabyte Aero 17 XA RP77 i9-9980HK, GeForce RTX 2070 Max-Q, 94.24 Wh | Asus ROG Strix Scar II GL704GW i7-8750H, GeForce RTX 2070 Mobile, 66 Wh | |
|---|---|---|---|---|---|---|
| Akkumulátor üzemidő | 30% | 58% | 49% | 113% | 29% | |
| Reader / Idle (h) | 7.1 | 9.1 28% | 7.7 8% | 4.9 -31% | 11.9 68% | 6.2 -13% |
| WiFi v1.3 (h) | 4.8 | 4.9 2% | 6 25% | 4.7 -2% | 7.2 50% | 3.9 -19% |
| Load (h) | 0.5 | 0.8 60% | 1.2 140% | 1.4 180% | 1.6 220% | 1.1 120% |
| Witcher 3 ultra (h) | 0.9 |
Pro
Kontra
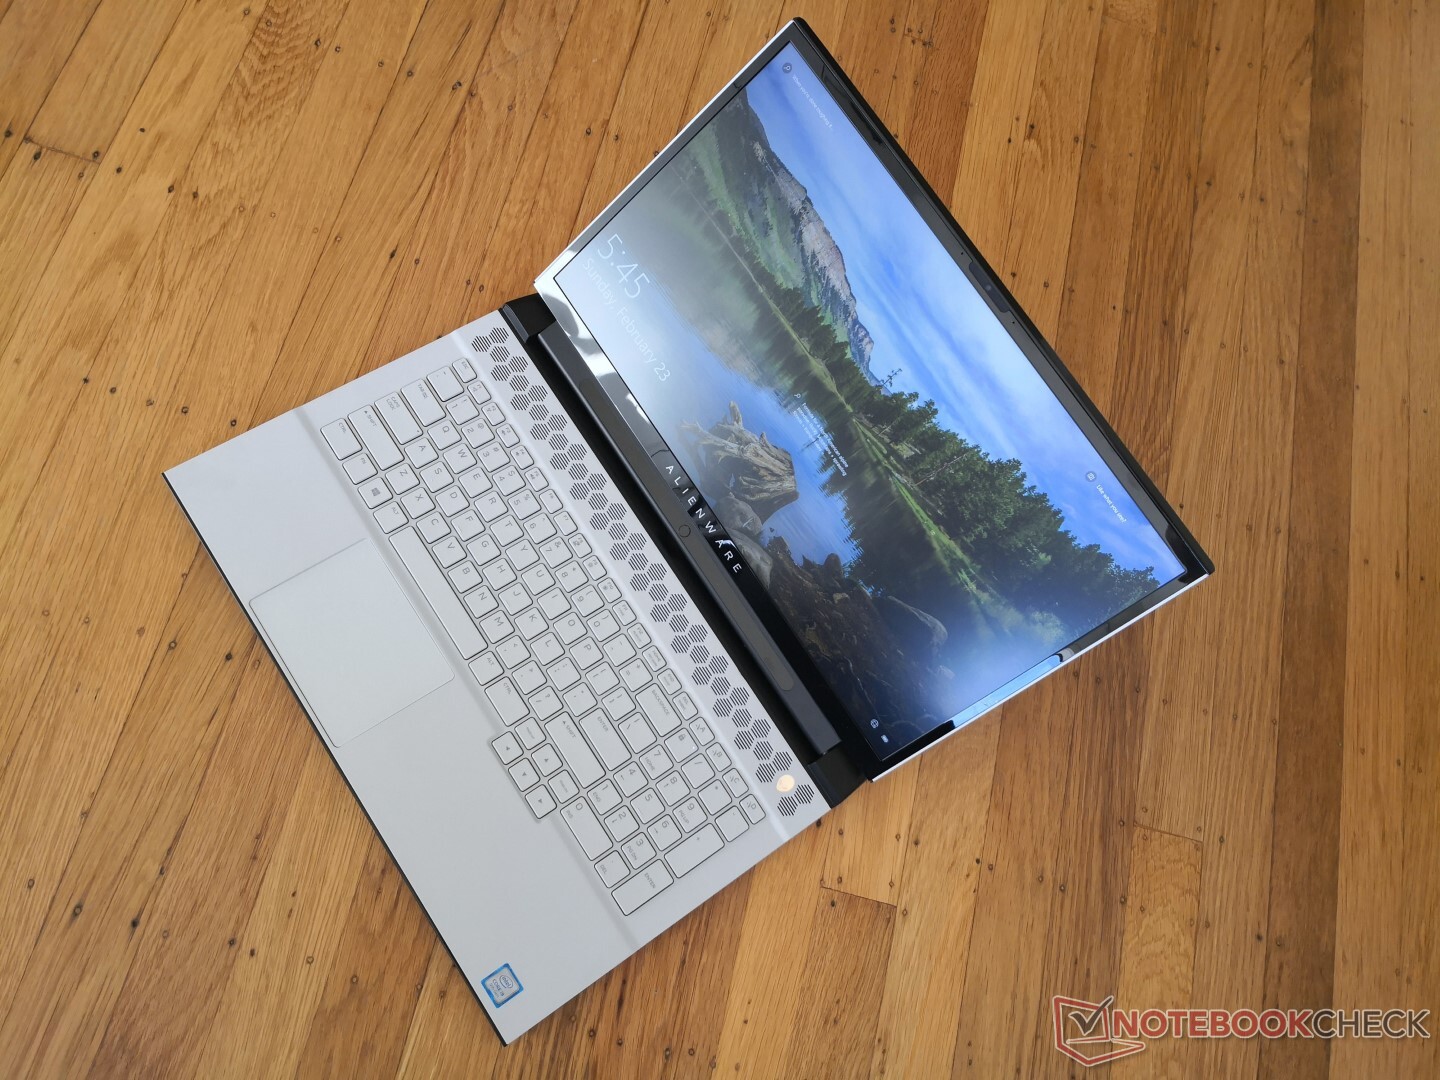
A felhasználók mindig arra számítanak, hogy a második generációs modellek minden tekintetben jobbak az első generációs modelleknél. Az Alienware m17 R2 esetében viszont inkább egy oldallépésről van szó az Alienware m17 R1-től. Ez a legutóbbi iteráció egyszerre hozzáad és eltávolít olyan funkciókat, amelyek bosszanthatnak néhány rajongót. A tulajdonosok kénytelenek felcserélni a cserélhető RAM-ot, a cserélhető Wi-Fi-t, a 2.5 hüvelykes SATA III opciókat, a 4K UHD kijelző opciókat és egy, az eredeti m17 R1-ben található, nagyobb akkumulátort a továbbfejlesztett billentyűzettel, a nagyobb érintőpaddal, a gombonkénti RGB világítással és az újabb váz dizájnnal. Akinek a munkaterhelése nagyon RAM- és tárhely-igényes, az inkább fontolja meg a nagyobb Alienware Area-51m-et.
Ami a teljesítményt illeti, a CPU Turbo Boost fenntarthatósága meggyőzött minket. A Core i9 laptopok - különösen a vékonyabbak - általában csalódást okoznak, mivel a legtöbb kivitelezés nem képes teljes mértékben kihasználni a processzor potenciálját, de ez az Alienware kivételnek számít. Fő hátrányai a nagyság, a jóval magasabb belső hőmérsékletek és a hangos ventilátor, amelyek nem igazán javultak az m17 R1 óta. Ezek sajnálatos következményei annak, hogy ennyire vékony vázba préselték a Core i9 CPU-t. Ennek ellenére azt gyanítjuk, hogy a kevésbé felszerelt SKU-k a Core i5 vagy Core i7-tel csendesebben fognak működni, mint amit mi itt mértünk.
Elegendő-e az Alienware m17 R2 egy erős ajánláshoz? Kivéve ha értékeljük a jobb billentyűzetet, a Core i9-et és Tobii szemkövető opciókat, hasonló játékteljesítményt kaphatunk kisebb és hordozhatóbb Core i7 alternatíváktól, mint az Asus ROG Strix Scar GL704GW vagy a Razer Blade Pro 17.
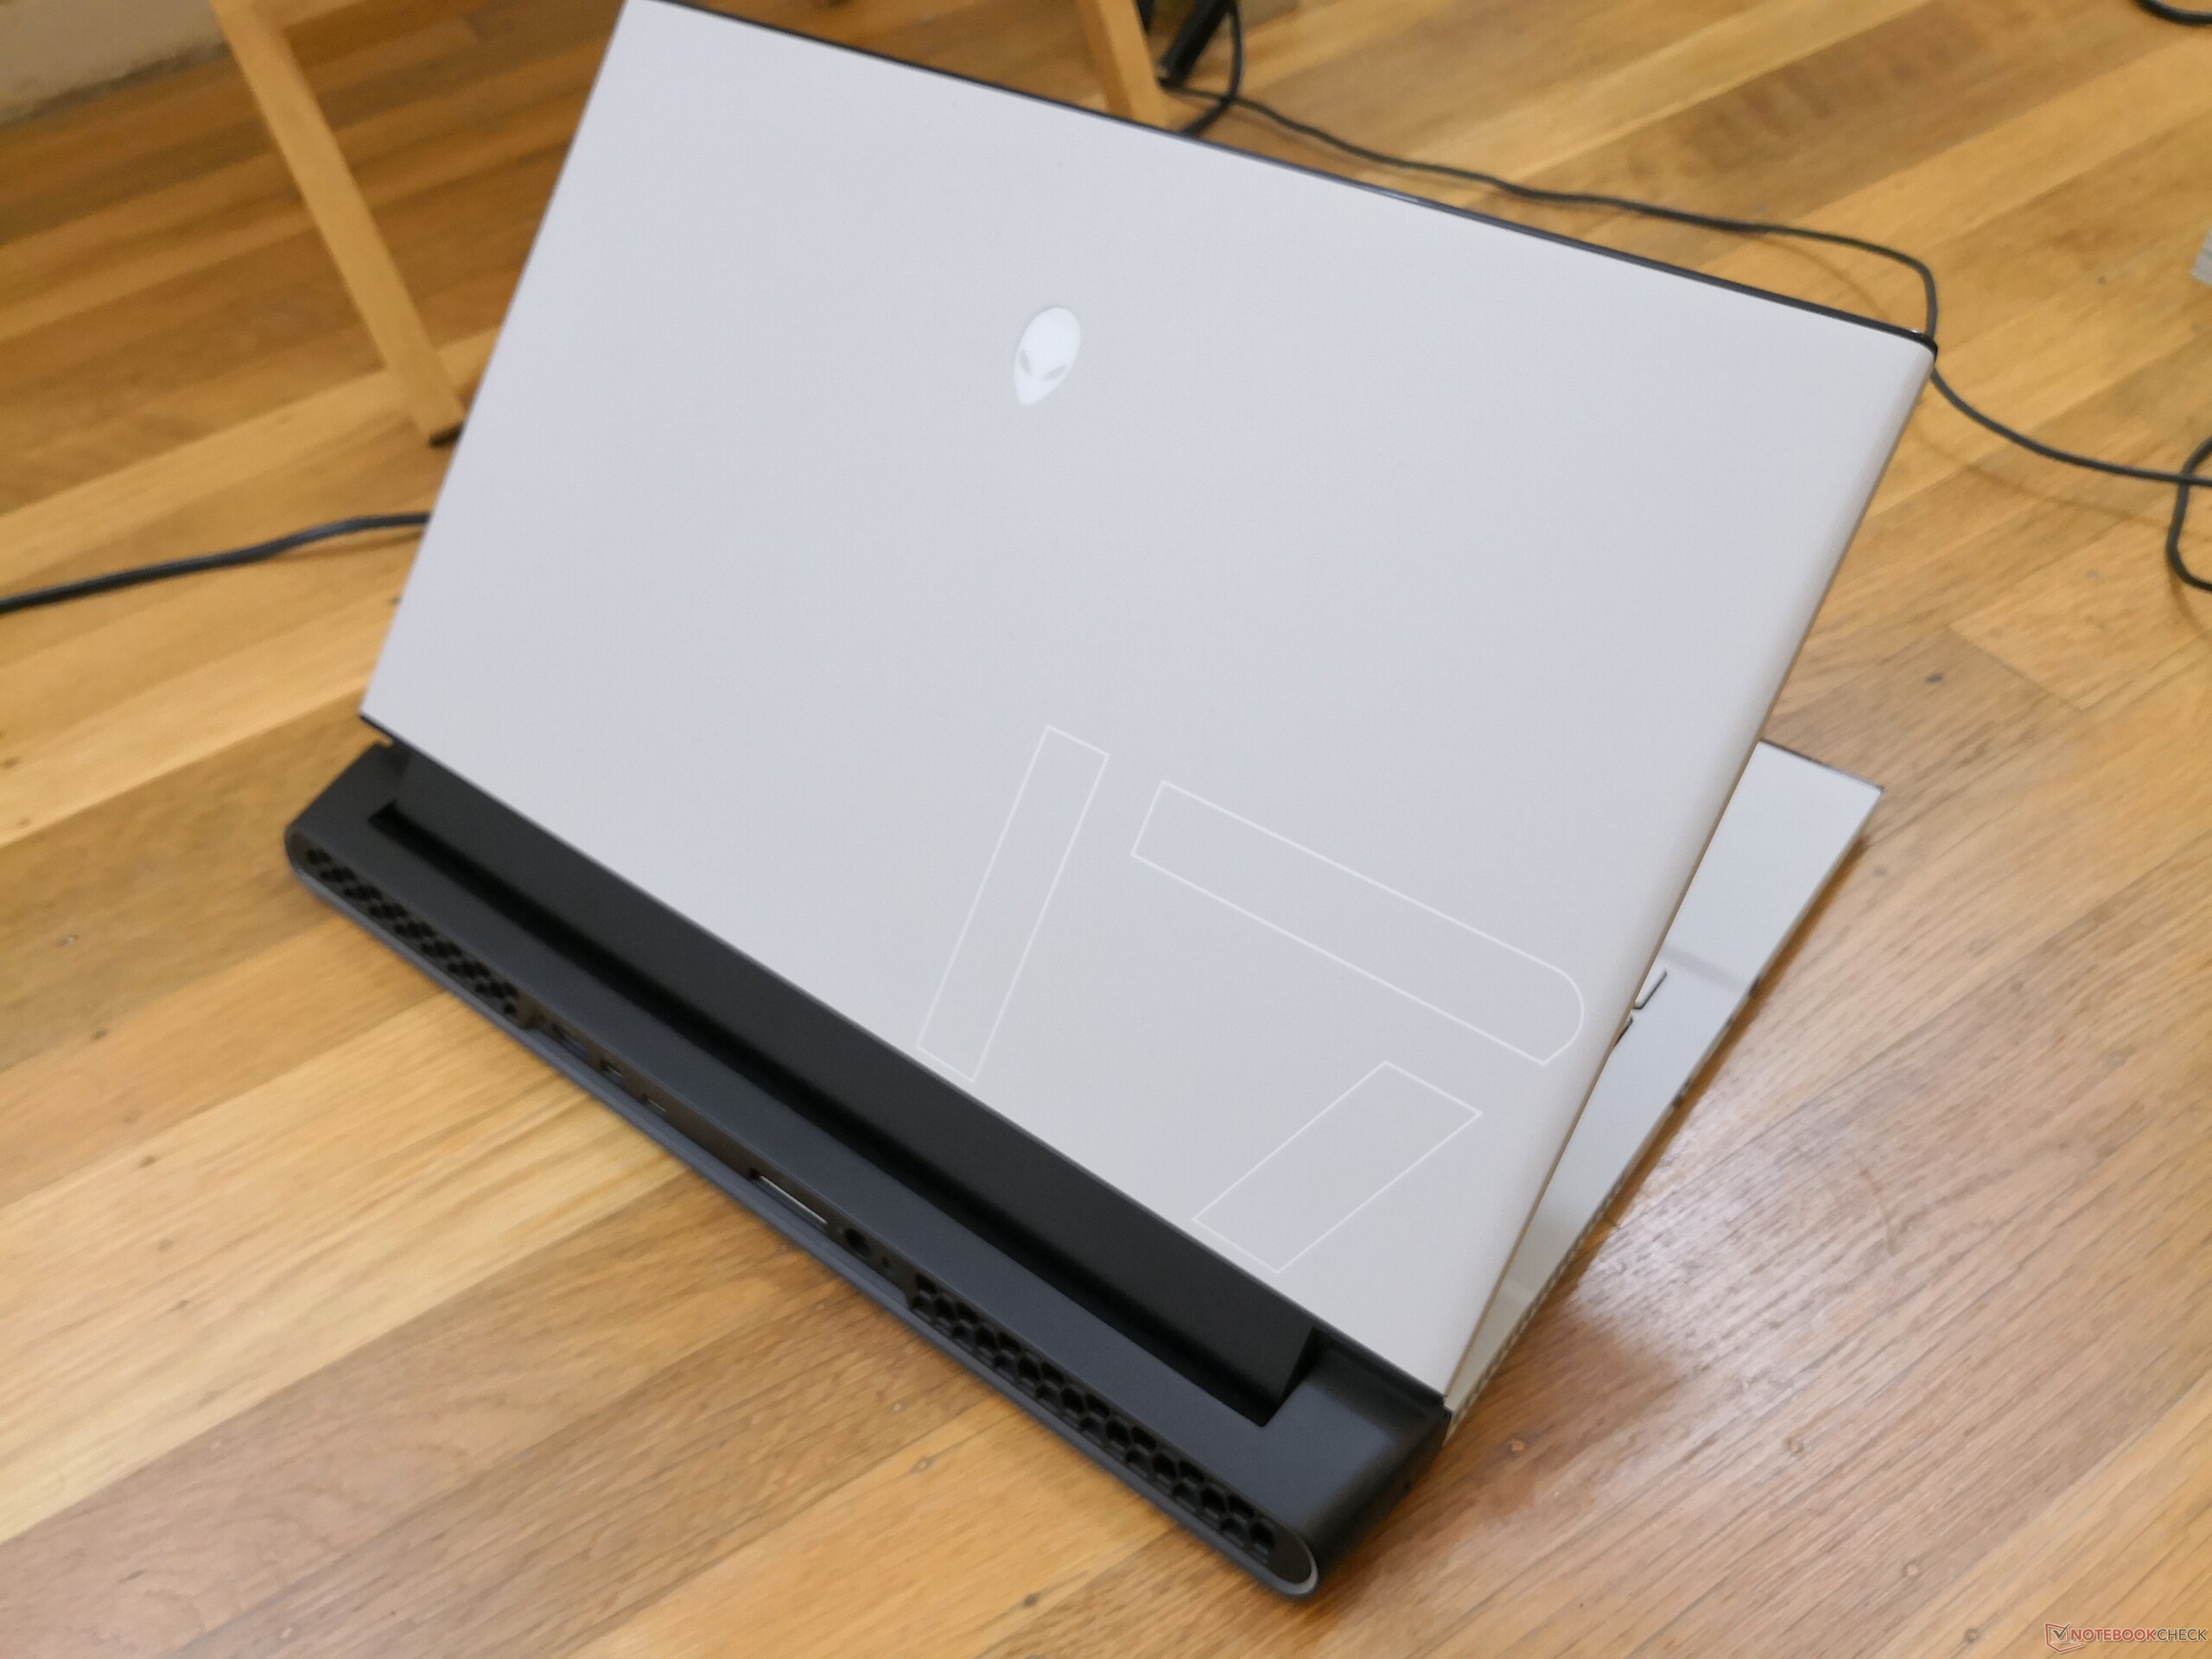
Az Alienware m17 R2 a maximális teljesítményről szól a sorozat eddigi legvékonyabb házában. A tulajdonosoknak meg kell birkózniuk az elkerülhetetlenül hangosabb ventilátorokkal, a magasabb hőmérsékletekkel és a még egy 17.3 hüvelykes laptophoz képest is nagyobb mérettel, ha teljes mértékben ki akarják aknázni azt, amit a rendszer nyújtani képes.
Alienware m17 R2 P41E
- 07/31/2020 v7 (old)
Allen Ngo
Price comparison

