Notebookcheck Logo

Intel Core i7-1365U

Intel i7-1365U

Az Intel Core i7-1365U egy csúcskategóriás mobil CPU vékony és könnyű laptopok számára, amely az Alder Lake architektúrán (Raptor Lake-U / RPL-U sorozat) alapul. A 2023 elején jelentették be, és 2 teljesítménymagot (P-magok, Golden Cove architektúra) és 8 hatékony magot (E-magok, Gracemont architektúra) kínál. A P-magok támogatják a Hyper-Threadinget, ami az E-magokkal kombinálva 12 támogatott szálat eredményez. Az órajelek 1,8 és 5,2 GHz között mozognak a teljesítőképes fürtön és 1,3 és 3,9 GHz között a hatékony fürtön. Az E-magok teljesítményének a régi Skylake-magokhoz kell hasonlónak lennie (vö Core i7-6700HQ). Minden mag legfeljebb 12 MB L3 gyorsítótárat használhat. A CPU támogatja az összes "Enterprise" vPro menedzsment funkciót. A P-sorozathoz (28 W) vagy a H-sorozathoz (45 W) képest a 15 W-os TDP korlátozhatja a tartós teljesítményt.

Teljesítmény

A magas órajelnek köszönhetően a Core i7-1365U teljesítménye valamivel jobb lehet, mint a régebbi magoké i7-1265U (akár 4,8 GHz-ig).

Architektúra

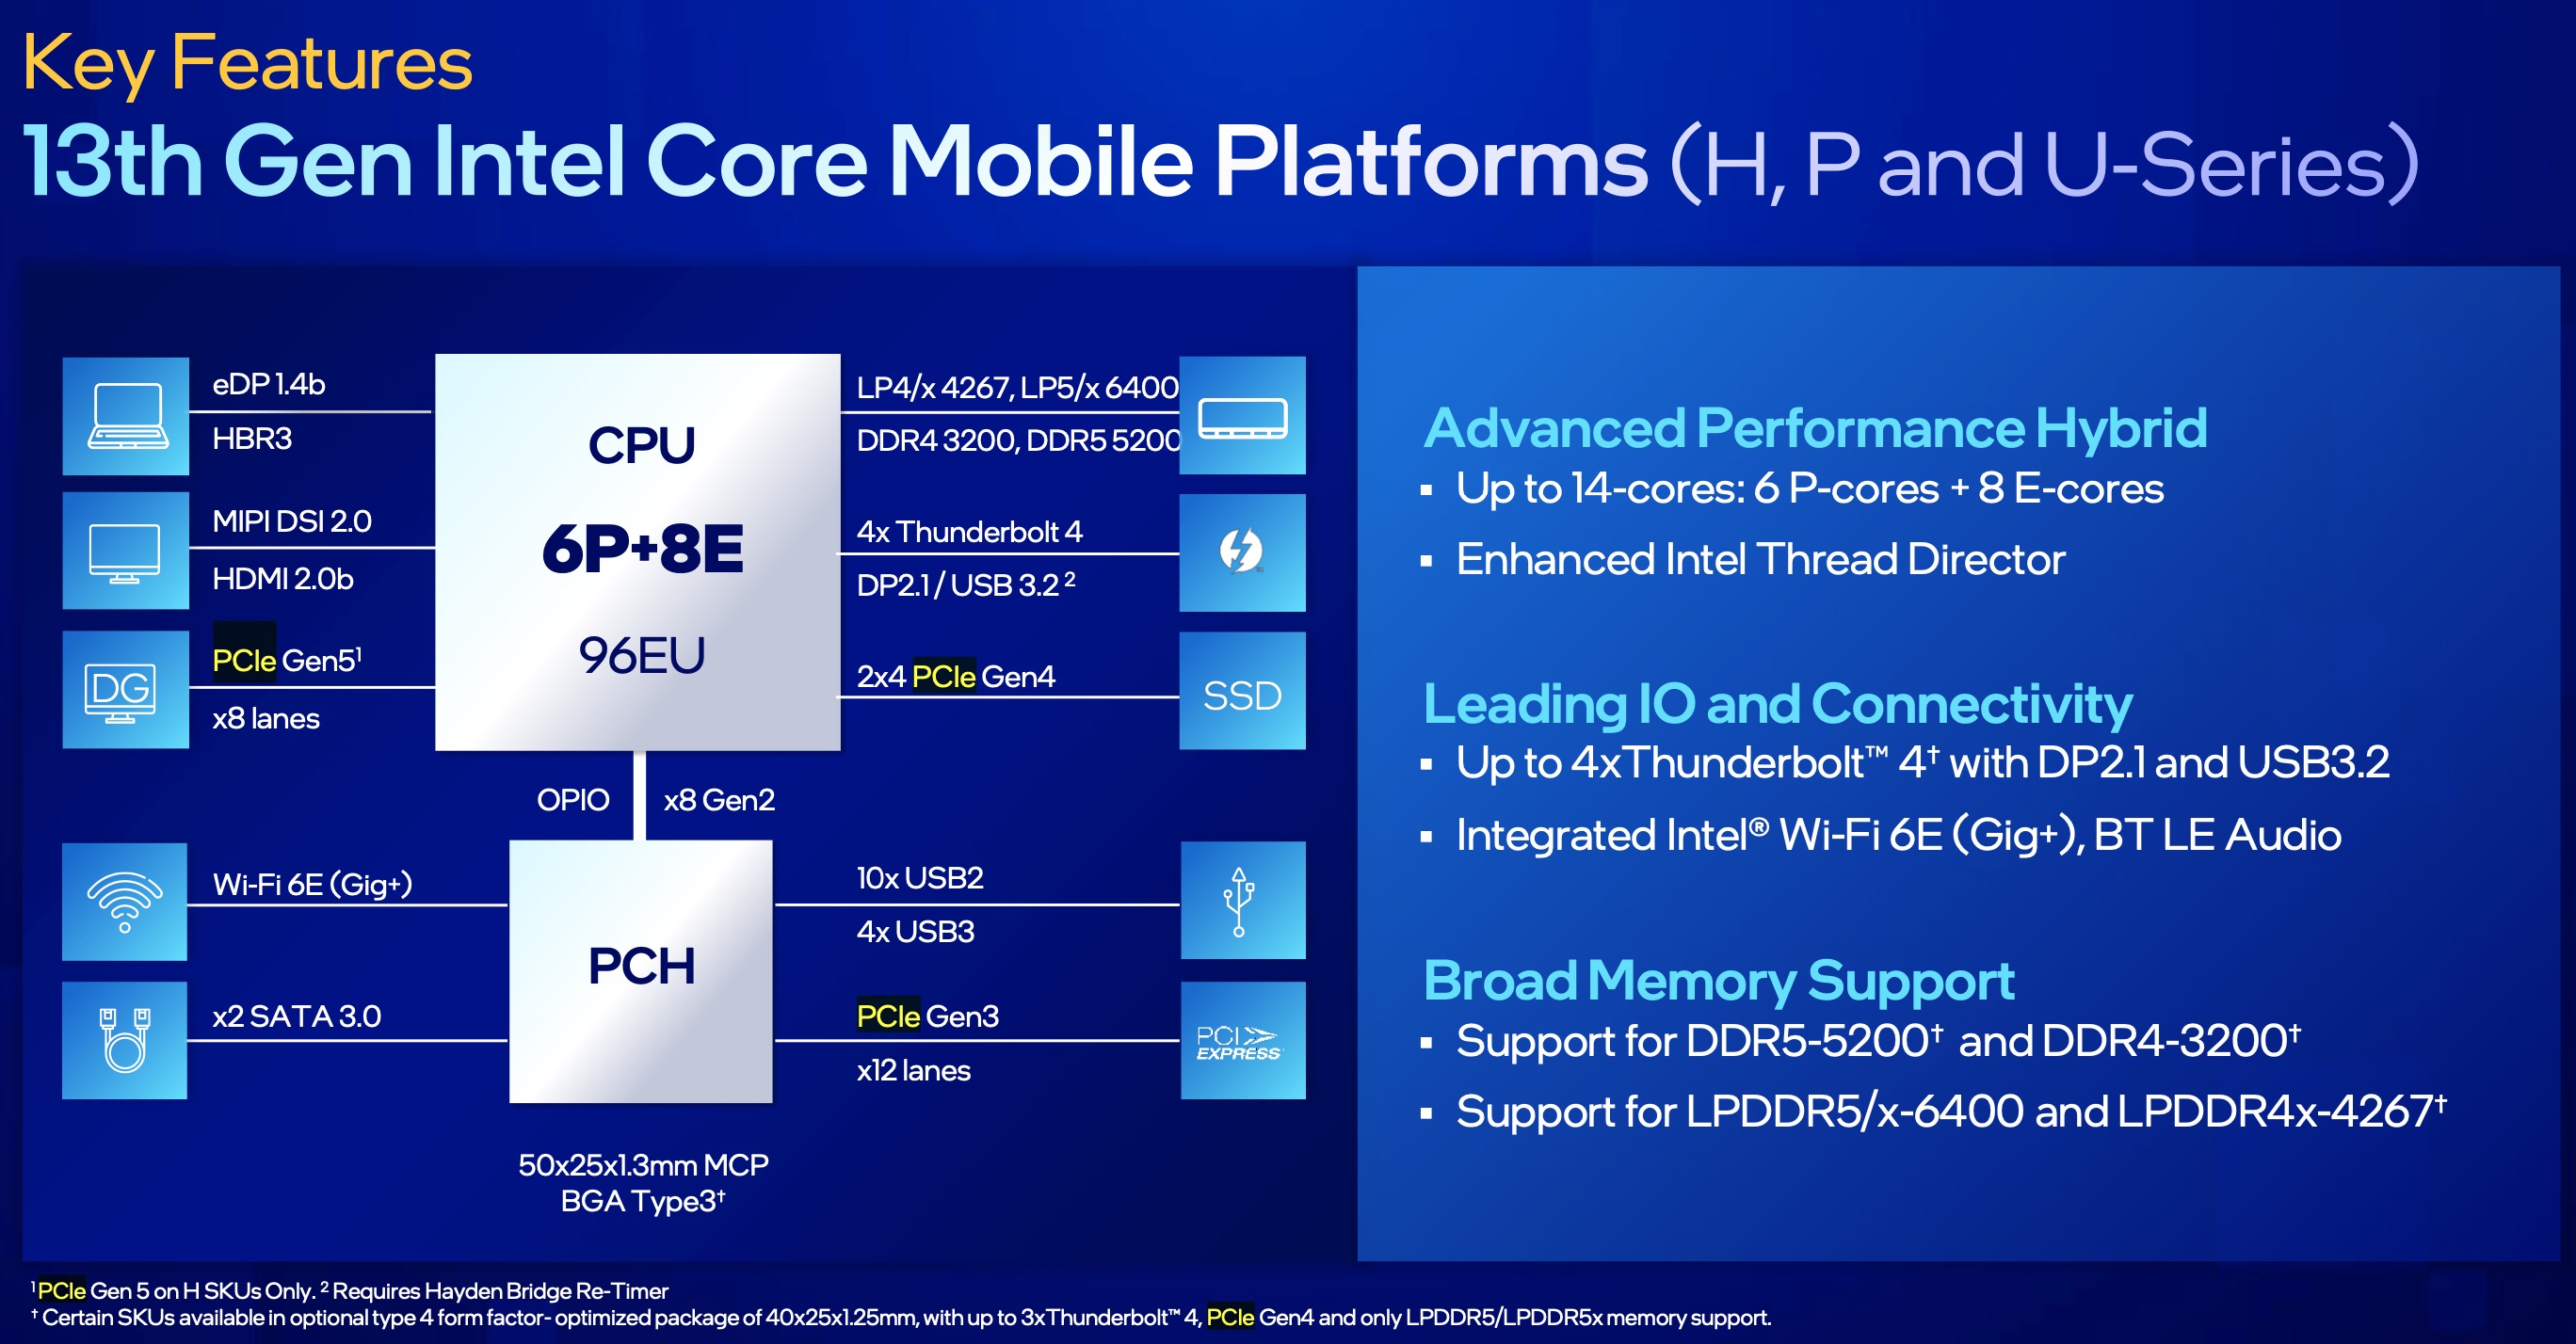
Az integrált memóriavezérlő különböző memóriatípusokat támogat LPDDR5-6400-ig. A szálirányító (hardveresen) támogathatja az operációs rendszert abban, hogy eldöntse, melyik szálat használja a teljesítményt vagy a hatékony magokon a legjobb teljesítmény érdekében. A mesterséges intelligencia feladatokhoz a CPU a GNA 3.0-t és a DL Boostot is integrálja (AVX2-n keresztül). A Quick Sync a 8-as verzióban ugyanaz, mint a Rocket Lake CPU-kban, és hardveresen támogatja az MPEG-2, AVC, VC-1 dekódolást, JPEG, VP8 dekódolást, VP9, HEVC és AV1 dekódolást. A CPU továbbra is csak a PCIe 4.0 x8-as PCIe-t támogatja a GPU számára és két PCIe 4.0 x4-es PCIe-t az SSD-k számára.

Az integrált grafikus kártya az Xe-architektúrán alapul, és mind a 96 EU (Execution Unit) akár 1,3 GHz-es órajelen üzemel.

Energiafogyasztás

Ez a Core i7 CPU 15 W-os TDP-értékkel rendelkezik (alapteljesítmény, PL1), a maximális turbó teljesítmény pedig 55 W (PL2). Az RPL-U processzorok egy továbbfejlesztett Intel 7-es eljárással (10 nm-es SuperFin) készülnek, amely magasabb órajeleket tesz lehetővé.

SzériaIntel Raptor Lake-U
KódnévRaptor Lake-U

Széria: Raptor Lake-U Raptor Lake-U

Intel Core i7-1365U « 1.3 - 5.2 GHz10 / 12 cores12 MB L3
Intel Core i7-1355U1.2 - 5 GHz10 / 12 cores12 MB L3
Intel Core i5-1345U1.2 - 4.7 GHz10 / 12 cores12 MB L3
Intel Core i5-1335U0.9 - 4.6 GHz10 / 12 cores12 MB L3
Intel Core i5-1334U0.9 - 4.6 GHz10 / 12 cores12 MB L3
Intel Core i3-1315U0.9 - 4.5 GHz6 / 8 cores10 MB L3
Intel Core i3-1305U1.2 - 4.5 GHz5 / 6 cores10 MB L3
Intel Processor U3000.9 - 4.4 GHz5 / 6 cores8 MB L3
Órajel1300 - 5200 MHz
Level 1 Cache928 KB
Level 2 Cache9.5 MB
Level 3 Cache12 MB
Magok / Szálak10 / 12
Max. Áramfelvétel (TDP - Thermal Design Power)15 Watt
Gyártástechnológia10 nm
Max. Hőmérséklet100 °C
SocketBGA1700
JellegzetességekThread Director
GPUIntel Iris Xe Graphics G7 96EUs ( - 1300 MHz)
64 bit64 bites támogatás
Architecturex86
Bejelentés dátuma01/04/2022
Termék hivatkozás (külső)ark.intel.com

Benchmarkok

Performance Rating - CB R15 + R20 + 7-Zip + X265 + Blender + 3DM11 CPU
41 pt (57%)
Cinebench R23 - Cinebench R23 Multi Core
min: 7532     avg: 8750     median: 8946 (8%)     max: 9576 Points
AMD E1-2100
202 -98%
...
8383 -4%
8410 -4%
8479 -3%
8565 -2%
8637 -1%
Apple M2
8654 -1%
Intel Core i9-9880H
8670 -1%
8670 -1%
8676 -1%
Intel Core i7-1365U
8750
8762 0%
8809 1%
8851 1%
8990 3%
9131 4%
9160 5%
9164 5%
9385 7%
9438 8%
...
32782 275%
max:
107681 1131%
0%
100%
Cinebench R23 - Cinebench R23 Single Core
min: 1877     avg: 1886     median: 1887 (80%)     max: 1891 Points
Cinebench R20 - Cinebench R20 CPU (Single Core)
min: 703     avg: 724     median: 726.5 (81%)     max: 741 Points
Cinebench R20 - Cinebench R20 CPU (Multi Core)
min: 2902     avg: 3391     median: 3495.5 (9%)     max: 3669 Points
Cinebench R15 - Cinebench R15 CPU Multi 64 Bit
min: 1348     avg: 1471     median: 1466.5 (9%)     max: 1604 Points
AMD A4-1200
31 -98%
...
1411 -4%
1417 -4%
1428 -3%
1443 -2%
1444 -2%
1447 -2%
1448 -2%
1464 0%
1469 0%
Intel Core i7-1365U
1471
1493 1%
1499 2%
1502 2%
1505 2%
Intel Core i9-9880H
1506 2%
Intel Xeon W-10885M
1509 3%
1528 4%
1547 5%
1554 6%
...
5600 281%
max:
15842 977%
0%
100%
0851702553404255105956807658509351020110511901275136014451530Tooltip
Cinebench R15 - Cinebench R15 CPU Single 64 Bit
min: 261     avg: 265     median: 265.5 (80%)     max: 268 Points
7-Zip 18.03 - 7-Zip 18.03 Multli Thread 4 runs
min: 33476     avg: 38339     median: 39727 (23%)     max: 40424 MIPS
7-Zip 18.03 - 7-Zip 18.03 Single Thread 4 runs
min: 5722     avg: 5841     median: 5850.5 (70%)     max: 5941 MIPS
HWBOT x265 Benchmark v2.2 - HWBOT x265 4k Preset
min: 8.61     avg: 9.6     median: 9.8 (17%)     max: 10.3 fps
012345678910111213141516171819Tooltip
Blender - Blender 3.3 Classroom CPU *
min: 660     avg: 727     median: 726.5 (9%)     max: 796 Seconds
Blender - Blender 2.79 BMW27 CPU *
min: 373     avg: 395.3     median: 383 (3%)     max: 430 Seconds
R Benchmark 2.5 - R Benchmark 2.5 *
min: 0.4504     avg: 0.5     median: 0.5 (10%)     max: 0.4586 sec
3DMark 11 - 3DM11 Performance Physics
min: 11465     avg: 12579     median: 12071.5 (33%)     max: 14708 Points
3DMark - 3DMark Cloud Gate Physics
10387 Points (26%)
3DMark - 3DMark Fire Strike Standard Physics
min: 15179     avg: 16981     median: 17182 (31%)     max: 18379 Points
3DMark - 3DMark Time Spy CPU
min: 5497     avg: 6435     median: 6438.5 (27%)     max: 7364 Points
Geekbench 6.2 - Geekbench 6.2 Single-Core
2583 pontok (78%)
Geekbench 5.5 - Geekbench 5.1 - 5.4 64 Bit Single-Core
min: 1841     avg: 1884     median: 1878.5 (79%)     max: 1938 pontok
Geekbench 5.5 - Geekbench 5.1 - 5.4 64 Bit Multi-Core
min: 8272     avg: 8565     median: 8605.5 (15%)     max: 8778 pontok
Geekbench 5.0 - Geekbench 5.0 64 Bit Single-Core
min: 1797     avg: 1813     median: 1812.5 (8%)     max: 1828 pontok
Geekbench 5.0 - Geekbench 5.0 64 Bit Multi-Core
min: 8334     avg: 8500     median: 8500 (27%)     max: 8666 pontok
Mozilla Kraken 1.1 - Kraken 1.1 Total Score *
min: 487     avg: 493.5     median: 494 (1%)     max: 499 ms
Octane V2 - Octane V2 Total Score
93596 Points (84%)
WebXPRT 4 - WebXPRT 4 Score
min: 261     avg: 263     median: 262.5 (75%)     max: 266 Points
WebXPRT 3 - WebXPRT 3 Score
min: 290     avg: 298.8     median: 300 (63%)     max: 305 Points
CrossMark - CrossMark Overall
min: 1605     avg: 1638     median: 1636 (63%)     max: 1675 Points
Power Consumption - Prime95 Power Consumption - external Monitor *
min: 35.5     avg: 41.3     median: 41.3 (7%)     max: 47.1 Watt
05101520253035404550556065Tooltip
Power Consumption - Cinebench R15 Multi Power Consumption - external Monitor *
min: 46.9     avg: 53.6     median: 53.5 (10%)     max: 60.6 Watt
05101520253035404550556065Tooltip
Power Consumption - Idle Power Consumption - external Monitor *
min: 4.69     avg: 6.5     median: 6.1 (4%)     max: 9.22 Watt
012345678910111213Tooltip
Power Consumption - Idle Power Consumption 150cd 1min *
min: 3.84     avg: 5.3     median: 5.5 (6%)     max: 6.47 Watt
012345678910Tooltip
Power Consumption - Cinebench R15 Multi Power Efficiency - external Monitor
min: 25.8     avg: 27.6     median: 26.5 (20%)     max: 30.5 Points per Watt
- A keresett grafikus kártyához tartozó benchmark értékek skálája
- A keresett grafikus kártyához tartozó átlagos benchmark értékek
* A kisebb számok nagyobb teljesítményt jelentenek.

v1.26
log 24. 11:56:24

#0 no ids found in url (should be separated by "_") +0s ... 0s

#1 not redirecting to Ajax server +0s ... 0s

#2 did not recreate cache, as it is less than 5 days old! Created at Tue, 23 Apr 2024 05:40:15 +0200 +0.002s ... 0.002s

#3 no comparison url found in template nbc.compare_page_2 needed +0.013s ... 0.014s

#4 no comparison url found in template nbc.compare_page_2 needed +0s ... 0.015s

#5 no comparison url found in template nbc.compare_page_2 needed +0s ... 0.015s

#6 no comparison url found in template nbc.compare_page_2 needed +0s ... 0.015s

#7 no comparison url found in template nbc.compare_page_2 needed +0s ... 0.015s

#8 no comparison url found in template nbc.compare_page_2 needed +0s ... 0.016s

#9 no comparison url found in template nbc.compare_page_2 needed +0s ... 0.016s

#10 composed specs +0s ... 0.016s

#11 did output specs +0s ... 0.016s

#12 getting avg benchmarks for device 14914 +0.017s ... 0.033s

#13 got single benchmarks 14914 +0.023s ... 0.057s

#14 got avg benchmarks for devices +0s ... 0.057s

#15 min, max, avg, median took s +0.644s ... 0.701s

#16 no comparison url found in template nbc.compare_page_2 needed +0s ... 0.701s

#17 return log +0s ... 0.701s

Tesztek a következőre Intel Core i7-1365U processzor

Lenovo ThinkPad X13 Yoga G4, i7-1365U: Intel Iris Xe Graphics G7 96EUs, 13.30", 1.2 kg
  Külsős Teszt » Lenovo ThinkPad X13 Yoga G4, i7-1365U

Lenovo ThinkPad X1 Yoga G8, i7-1365U: Intel Iris Xe Graphics G7 96EUs, 14.00", 1.4 kg
  Külsős Teszt » Lenovo ThinkPad X1 Yoga G8, i7-1365U

Dell Latitude 5540: Intel Iris Xe Graphics G7 96EUs, 15.60", 1.6 kg
  Külsős Teszt » Dell Latitude 5540

Dell Latitude 7440 2-in-1: Intel Iris Xe Graphics G7 96EUs, 14.00", 1.5 kg
  Külsős Teszt » Dell Latitude 7440 2-in-1

Lenovo ThinkPad T14s G4 i7-1365U: Intel Iris Xe Graphics G7 96EUs, 14.00", 1.4 kg
  Külsős Teszt » Lenovo ThinkPad T14s G4 i7-1365U

Lenovo ThinkPad L15 G4, i7-1365U: Intel Iris Xe Graphics G7 96EUs, 15.60", 1.8 kg
  Külsős Teszt » Lenovo ThinkPad L15 G4, i7-1365U

Dell Latitude 16 7640: Intel Iris Xe Graphics G7 96EUs, 16.00", 1.8 kg
  Külsős Teszt » Dell Latitude 16 7640

Lenovo ThinkPad X13 G4: Intel Iris Xe Graphics G7 96EUs, 13.30", 1.1 kg
  Külsős Teszt » Lenovo ThinkPad X13 G4

HP ZBook Firefly 16 G10: NVIDIA RTX A500 Laptop GPU, 16.00", 1.8 kg
  Külsős Teszt » HP ZBook Firefly 16 G10

Dell Latitude 9440 2-in-1: Intel Iris Xe Graphics G7 96EUs, 14.00", 1.6 kg
  Külsős Teszt » Dell Latitude 9440 2-in-1

Lenovo ThinkPad X1 Carbon G11-21HNS00000: Intel Iris Xe Graphics G7 96EUs, 14.00", 1.2 kg
  Külsős Teszt » Lenovo ThinkPad X1 Carbon G11-21HNS00000

Please share our article, every link counts!

» Mobil processzorok összehasonlítása
Minden, noteszgépekben megtalálható CPU összehasonlítása

» Mobil processzorok Benchmark listája
Minden ismert noteszgép processzor benchmark listája

A széria további processzorai Raptor Lake-U

» Intel Core 7 150U
   10x 1.2 GHz - 5.4 GHz
» Intel Core i7-1365U
   10x 1.3 GHz - 5.2 GHz
» Intel Core 5 120U
   10x 0.9 GHz - 5 GHz
» Intel Core i7-1355U
   10x 1.2 GHz - 5 GHz
» Intel Core i5-1345U
   10x 1.2 GHz - 4.7 GHz
» Intel Core i5-1335U
   10x 0.9 GHz - 4.6 GHz
» Intel Core i5-1334U
   10x 0.9 GHz - 4.6 GHz
» Intel Core 3 100U
   6x 0.9 GHz - 4.7 GHz
» Intel Core i3-1315U
   6x 0.9 GHz - 4.5 GHz
» Intel Core i3-1305U
   5x 1.2 GHz - 4.5 GHz
» Intel Processor U300
   5x 0.9 GHz - 4.4 GHz

Hasonló processzorok

+ AMD Ryzen 7 7840U
   8x 3.3 GHz - 5.1 GHz
+ Intel Core Ultra 7 155U
   12x 3.8 GHz - 4.8 GHz
+ Intel Core Ultra 7 164U
   12x 3.8 GHz - 4.8 GHz
+ Intel Core i7-11850H
   8x 2.5 GHz - 4.8 GHz
+ Intel Core 7 150U
   10x 1.2 GHz - 5.4 GHz
» Intel Core i7-1365U
   10x 1.3 GHz - 5.2 GHz
- Intel Core i7-11800H
   8x 2.3 GHz - 4.6 GHz
- Intel Core 5 120U
   10x 0.9 GHz - 5 GHz
- Intel Core i7-1355U
   10x 1.2 GHz - 5 GHz
- AMD Ryzen 7 7735U
   8x 2.7 GHz - 4.75 GHz
- AMD Ryzen 7 PRO 6860Z
   8x 2.7 GHz - 4.75 GHz
> Magyarország - Kezdőlap > GYIK / Technológia / Benchmarkok > Noteszgép processzorok > Intel Raptor Lake-U i7-1365U SoC
Klaus Hinum (Update: 2023-12-14)