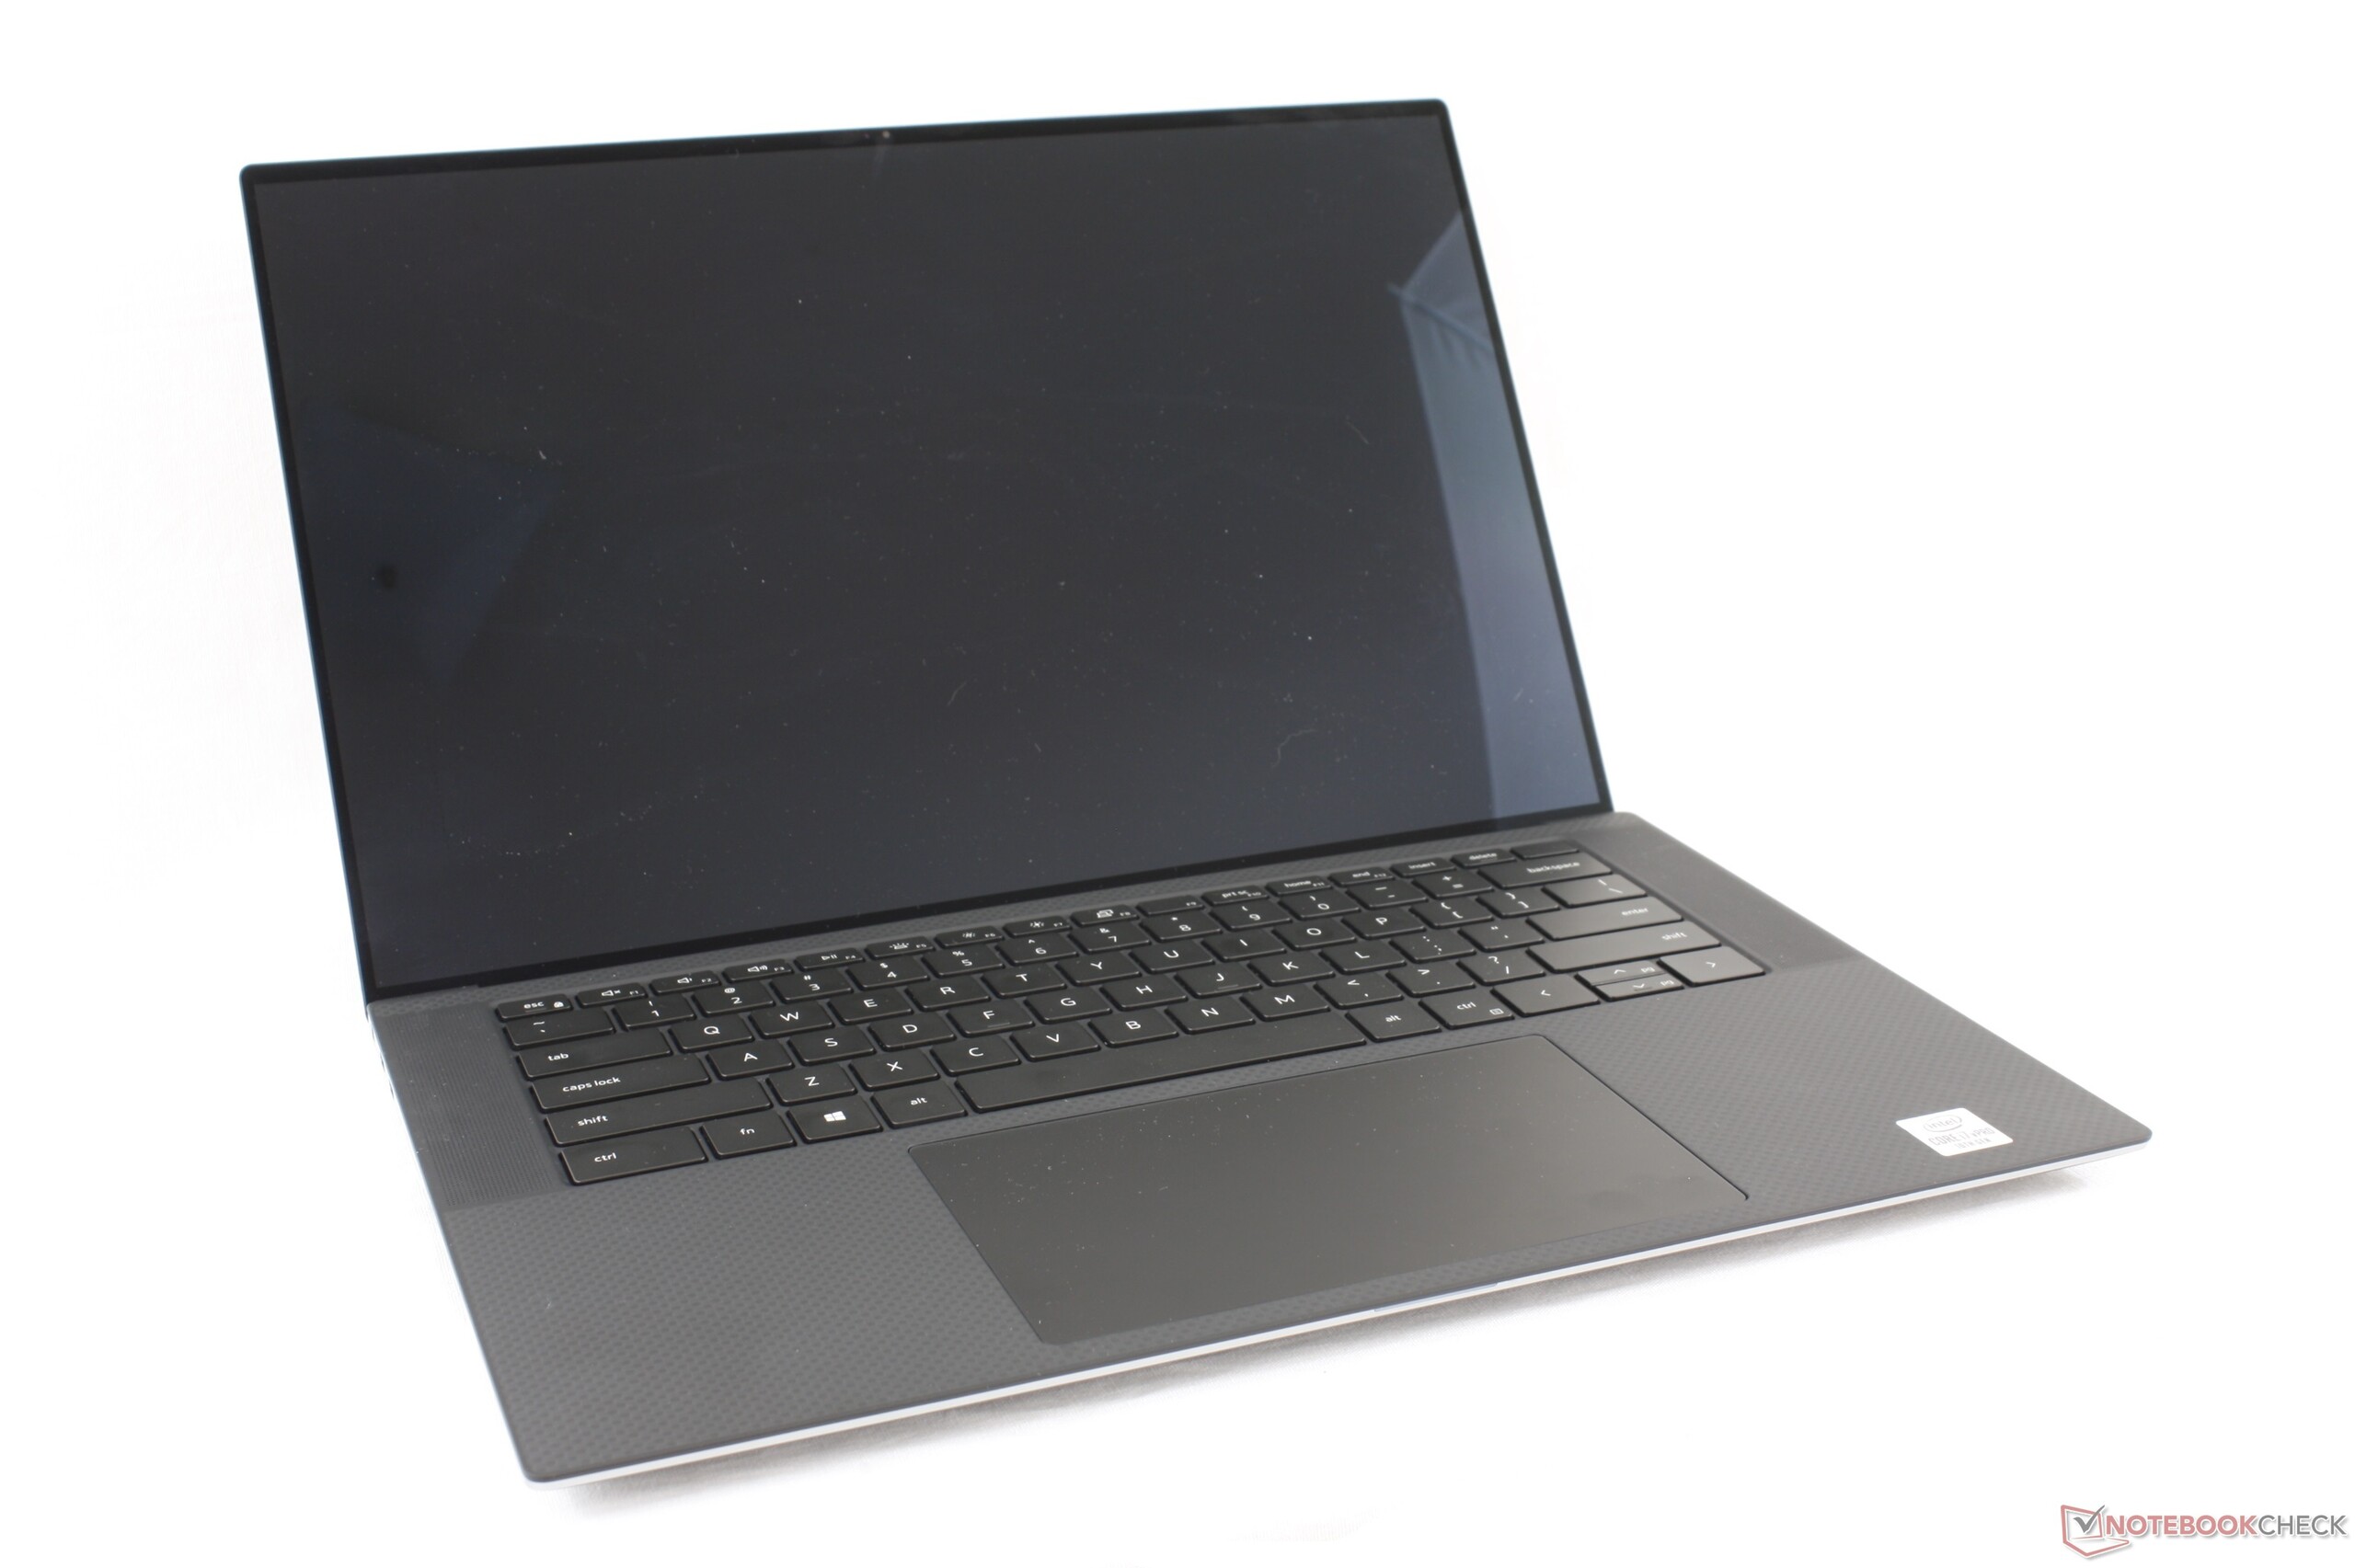
Dell Precision 5550 Munkaállomás rövid értékelés: Az XPS 15 Profiknak
Értékelés | Dátum | Modell | Súly | Magasság | Méret | Felbontás | Legjobb ár |
|---|---|---|---|---|---|---|---|
| 86.3 % v7 (old) | 12/2020 | Dell Precision 5550 P91F i7-10875H, Quadro T2000 Max-Q | 2 kg | 18 mm | 15.60" | 3840x2400 | |
| 86.9 % v7 (old) | 03/2020 | Dell Precision 5540 i9-9980HK, Quadro T2000 Max-Q | 2 kg | 17 mm | 15.60" | 3840x2160 | |
| 87 % v7 (old) | 08/2020 | Razer Blade 15 Studio Edition 2020 i7-10875H, Quadro RTX 5000 Max-Q | 2.2 kg | 13.98 mm | 15.60" | 3840x2160 | |
| 82.1 % v7 (old) | 03/2020 | Acer ConceptD 3 Pro CN315-71P-73W1 i7-9750H, Quadro T1000 (Laptop) | 2.4 kg | 23.4 mm | 15.60" | 1920x1080 | |
| 89.8 % v7 (old) | 01/2020 | Lenovo ThinkPad P53-20QN000YGE i7-9850H, Quadro RTX 5000 Max-Q | 2.7 kg | 29.4 mm | 15.60" | 1920x1080 | |
| 76 % v7 (old) | MSI WP65 i7-9750H, Quadro P620 | 1.9 kg | 21.7 mm | 15.60" | 1920x1080 |
| SD Card Reader - average JPG Copy Test (av. of 3 runs) | |
| Dell Precision 5550 P91F (Toshiba Exceria Pro SDXC 64 GB UHS-II) | |
| Lenovo ThinkPad P53-20QN000YGE (Toshiba Exceria Pro SDXC 64 GB UHS-II) | |
| Dell Precision 5540 (Toshiba Exceria Pro SDXC 64 GB UHS-II) | |
| Razer Blade 15 Studio Edition (Toshiba Exceria Pro SDXC 64 GB UHS-II) | |


| |||||||||||||||||||||||||
Fényerő megoszlás: 85 %
Centrumban: 469.8 cd/m²
Kontraszt: 1119:1 (Fekete: 0.42 cd/m²)
ΔE ColorChecker Calman: 5.16 | ∀{0.5-29.43 Ø4.72}
calibrated: 3.75
ΔE Greyscale Calman: 5.5 | ∀{0.09-98 Ø4.97}
100% sRGB (Argyll 1.6.3 3D)
89.2% AdobeRGB 1998 (Argyll 1.6.3 3D)
99.9% AdobeRGB 1998 (Argyll 3D)
100% sRGB (Argyll 3D)
89.9% Display P3 (Argyll 3D)
Gamma: 2
CCT: 6198 K
| Dell Precision 5550 P91F Sharp LQ156R1, IPS, 15.6", 3840x2400 | Dell Precision 5540 SDCA029, OLED, 15.6", 3840x2160 | Razer Blade 15 Studio Edition 2020 Samsung SDCA029, OLED, 15.6", 3840x2160 | Acer ConceptD 3 Pro CN315-71P-73W1 Chi Mei N156HCE-EN2, IPS, 15.6", 1920x1080 | Lenovo ThinkPad P53-20QN000YGE N156HCE-GN1, IPS, 15.6", 1920x1080 | MSI WP65 AU Optronics B156HAN02.1, IPS, 15.6", 1920x1080 | |
|---|---|---|---|---|---|---|
| Display | 3% | 3% | -1% | -24% | -52% | |
| Display P3 Coverage (%) | 89.9 | 99.9 11% | 99.9 11% | 97.9 9% | 63.2 -30% | 39.46 -56% |
| sRGB Coverage (%) | 100 | 100 0% | 100 0% | 99.9 0% | 92.9 -7% | 58.8 -41% |
| AdobeRGB 1998 Coverage (%) | 99.9 | 97.3 -3% | 97.3 -3% | 87.2 -13% | 64.3 -36% | 40.69 -59% |
| Response Times | 93% | 90% | 32% | 22% | 19% | |
| Response Time Grey 50% / Grey 80% * (ms) | 46 ? | 2.8 ? 94% | 4 ? 91% | 33 ? 28% | 38.4 ? 17% | 37.6 ? 18% |
| Response Time Black / White * (ms) | 34 ? | 3.2 ? 91% | 4 ? 88% | 22 ? 35% | 25.2 ? 26% | 27.6 ? 19% |
| PWM Frequency (Hz) | 240.9 ? | 26040 ? | ||||
| Screen | 14% | 171% | 14% | 20% | -25% | |
| Brightness middle (cd/m²) | 469.8 | 427 -9% | 380 -19% | 343 -27% | 510 9% | 267.4 -43% |
| Brightness (cd/m²) | 464 | 411 -11% | 388 -16% | 309 -33% | 468 1% | 259 -44% |
| Brightness Distribution (%) | 85 | 89 5% | 93 9% | 85 0% | 89 5% | 86 1% |
| Black Level * (cd/m²) | 0.42 | 0.018 96% | 0.22 48% | 0.36 14% | 0.37 12% | |
| Contrast (:1) | 1119 | 21111 1787% | 1559 39% | 1417 27% | 723 -35% | |
| Colorchecker dE 2000 * | 5.16 | 3.2 38% | 5.47 -6% | 3.73 28% | 2.3 55% | 4.21 18% |
| Colorchecker dE 2000 max. * | 9.33 | 8.4 10% | 8.19 12% | 6.51 30% | 5.5 41% | 21.1 -126% |
| Colorchecker dE 2000 calibrated * | 3.75 | 2.8 25% | 3.04 19% | 1.43 62% | 1.2 68% | 4.27 -14% |
| Greyscale dE 2000 * | 5.5 | 1.8 67% | 5.3 4% | 4.24 23% | 3.2 42% | 2.3 58% |
| Gamma | 2 110% | 2.15 102% | 2.15 102% | 2.2 100% | 2.34 94% | 2.2 100% |
| CCT | 6198 105% | 6176 105% | 6128 106% | 6329 103% | 7036 92% | 6578 99% |
| Color Space (Percent of AdobeRGB 1998) (%) | 89.2 | 86.8 -3% | 86 -4% | 78 -13% | 59.4 -33% | 37.2 -58% |
| Color Space (Percent of sRGB) (%) | 100 | 100 0% | 100 0% | 100 0% | 93.1 -7% | 58.5 -41% |
| Teljes átlag (program / beállítások) | 37% /
23% | 88% /
129% | 15% /
14% | 6% /
12% | -19% /
-24% |
* ... a kisebb jobb
Megjelenítési válaszidők
| ↔ Válaszidő Fekete-fehér | ||
|---|---|---|
| 34 ms ... emelkedés és süllyedés ↘ kombinálva | ↗ 17.6 ms emelkedés | 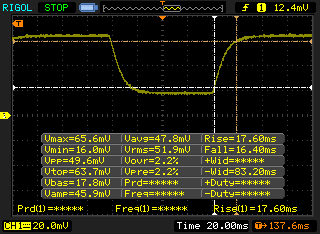 |
| ↘ 16.4 ms ősz | ||
| A képernyő lassú reakciósebességet mutat tesztjeinkben, és nem lesz kielégítő a játékosok számára. Összehasonlításképpen, az összes tesztelt eszköz 0.1 (minimum) és 240 (maximum) ms között mozog. » 91 % of all devices are better. Ez azt jelenti, hogy a mért válaszidő rosszabb, mint az összes vizsgált eszköz átlaga (19.8 ms). | ||
| ↔ Válaszidő 50% szürke és 80% szürke között | ||
| 46 ms ... emelkedés és süllyedés ↘ kombinálva | ↗ 24 ms emelkedés | 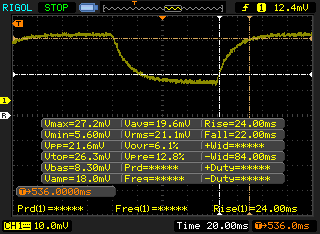 |
| ↘ 22 ms ősz | ||
| A képernyő lassú reakciósebességet mutat tesztjeinkben, és nem lesz kielégítő a játékosok számára. Összehasonlításképpen, az összes tesztelt eszköz 0.165 (minimum) és 636 (maximum) ms között mozog. » 79 % of all devices are better. Ez azt jelenti, hogy a mért válaszidő rosszabb, mint az összes vizsgált eszköz átlaga (31 ms). | ||
Képernyő villogása / PWM (impulzusszélesség-moduláció)
| Képernyő villogása / PWM nem érzékelhető |  | ||
Összehasonlításképpen: az összes tesztelt eszköz 52 %-a nem használja a PWM-et a kijelző elsötétítésére. Ha PWM-et észleltek, akkor átlagosan 7781 (minimum: 5 - maximum: 343500) Hz-t mértek. | |||
Cinebench R15: CPU Multi 64Bit | CPU Single 64Bit
Blender: v2.79 BMW27 CPU
7-Zip 18.03: 7z b 4 -mmt1 | 7z b 4
Geekbench 5.5: Single-Core | Multi-Core
HWBOT x265 Benchmark v2.2: 4k Preset
LibreOffice : 20 Documents To PDF
R Benchmark 2.5: Overall mean
| Cinebench R20 / CPU (Multi Core) | |
| Eluktronics RP-15 | |
| Asus ROG Zephyrus Duo 15 GX550LXS | |
| Átlagos Intel Core i7-10875H (1986 - 4176, n=32) | |
| Dell Precision 5550 P91F | |
| Apple MacBook Pro 15 2019 i9 Vega 16 | |
| MSI GS66 Stealth 10SE-045 | |
| Razer Blade 15 Studio Edition 2020 | |
| Schenker Work 15 | |
| Dell XPS 15 9500 Core i5 | |
| Razer Blade 15 Studio Edition | |
| Cinebench R20 / CPU (Single Core) | |
| Asus ROG Zephyrus Duo 15 GX550LXS | |
| Dell Precision 5550 P91F | |
| Eluktronics RP-15 | |
| Átlagos Intel Core i7-10875H (430 - 524, n=32) | |
| Razer Blade 15 Studio Edition 2020 | |
| Apple MacBook Pro 15 2019 i9 Vega 16 | |
| MSI GS66 Stealth 10SE-045 | |
| Dell XPS 15 9500 Core i5 | |
| Razer Blade 15 Studio Edition | |
| Schenker Work 15 | |
| Cinebench R15 / CPU Multi 64Bit | |
| Eluktronics RP-15 | |
| Asus ROG Zephyrus Duo 15 GX550LXS | |
| Átlagos Intel Core i7-10875H (1003 - 1833, n=38) | |
| Dell Precision 5550 P91F | |
| Dell Precision 5540 | |
| Apple MacBook Pro 15 2019 i9 Vega 16 | |
| Lenovo ThinkPad P53-20QN000YGE | |
| MSI GS66 Stealth 10SE-045 | |
| Razer Blade 15 Studio Edition 2020 | |
| Razer Blade 15 Studio Edition | |
| Schenker Work 15 | |
| Dell XPS 15 9500 Core i5 | |
| Cinebench R15 / CPU Single 64Bit | |
| Asus ROG Zephyrus Duo 15 GX550LXS | |
| Átlagos Intel Core i7-10875H (190 - 220, n=37) | |
| Dell Precision 5550 P91F | |
| Lenovo ThinkPad P53-20QN000YGE | |
| Dell Precision 5540 | |
| Razer Blade 15 Studio Edition 2020 | |
| Eluktronics RP-15 | |
| MSI GS66 Stealth 10SE-045 | |
| Dell XPS 15 9500 Core i5 | |
| Apple MacBook Pro 15 2019 i9 Vega 16 | |
| Razer Blade 15 Studio Edition | |
| Schenker Work 15 | |
| Blender / v2.79 BMW27 CPU | |
| Dell XPS 15 9500 Core i5 | |
| Schenker Work 15 | |
| Schenker Work 15 | |
| Lenovo ThinkPad P53-20QN000YGE | |
| MSI GS66 Stealth 10SE-045 | |
| Razer Blade 15 Studio Edition 2020 | |
| Apple MacBook Pro 15 2019 i9 Vega 16 | |
| Dell Precision 5550 P91F | |
| Dell Precision 5540 | |
| Átlagos Intel Core i7-10875H (259 - 535, n=30) | |
| Asus ROG Zephyrus Duo 15 GX550LXS | |
| Eluktronics RP-15 | |
| 7-Zip 18.03 / 7z b 4 -mmt1 | |
| Dell Precision 5550 P91F | |
| Asus ROG Zephyrus Duo 15 GX550LXS | |
| Átlagos Intel Core i7-10875H (5071 - 5780, n=31) | |
| Razer Blade 15 Studio Edition 2020 | |
| Dell Precision 5540 | |
| Lenovo ThinkPad P53-20QN000YGE | |
| Dell XPS 15 9500 Core i5 | |
| MSI GS66 Stealth 10SE-045 | |
| Eluktronics RP-15 | |
| Schenker Work 15 | |
| Schenker Work 15 | |
| 7-Zip 18.03 / 7z b 4 | |
| Eluktronics RP-15 | |
| Asus ROG Zephyrus Duo 15 GX550LXS | |
| Átlagos Intel Core i7-10875H (29844 - 49562, n=31) | |
| Dell Precision 5550 P91F | |
| Dell Precision 5540 | |
| Razer Blade 15 Studio Edition 2020 | |
| MSI GS66 Stealth 10SE-045 | |
| Lenovo ThinkPad P53-20QN000YGE | |
| Schenker Work 15 | |
| Schenker Work 15 | |
| Dell XPS 15 9500 Core i5 | |
| Geekbench 5.5 / Single-Core | |
| Asus ROG Zephyrus Duo 15 GX550LXS | |
| Dell Precision 5550 P91F | |
| Átlagos Intel Core i7-10875H (1233 - 1371, n=29) | |
| Razer Blade 15 Studio Edition 2020 | |
| Eluktronics RP-15 | |
| MSI GS66 Stealth 10SE-045 | |
| Dell XPS 15 9500 Core i5 | |
| Geekbench 5.5 / Multi-Core | |
| Eluktronics RP-15 | |
| Asus ROG Zephyrus Duo 15 GX550LXS | |
| Dell Precision 5550 P91F | |
| Átlagos Intel Core i7-10875H (5715 - 8620, n=29) | |
| Razer Blade 15 Studio Edition 2020 | |
| MSI GS66 Stealth 10SE-045 | |
| Dell XPS 15 9500 Core i5 | |
| HWBOT x265 Benchmark v2.2 / 4k Preset | |
| Eluktronics RP-15 | |
| Asus ROG Zephyrus Duo 15 GX550LXS | |
| Átlagos Intel Core i7-10875H (7.27 - 14.1, n=27) | |
| Dell Precision 5540 | |
| Dell Precision 5550 P91F | |
| Razer Blade 15 Studio Edition 2020 | |
| MSI GS66 Stealth 10SE-045 | |
| Lenovo ThinkPad P53-20QN000YGE | |
| Schenker Work 15 | |
| Schenker Work 15 | |
| Dell XPS 15 9500 Core i5 | |
| LibreOffice / 20 Documents To PDF | |
| Dell XPS 15 9500 Core i5 | |
| Eluktronics RP-15 | |
| MSI GS66 Stealth 10SE-045 | |
| Asus ROG Zephyrus Duo 15 GX550LXS | |
| Átlagos Intel Core i7-10875H (30.2 - 84.3, n=30) | |
| Razer Blade 15 Studio Edition 2020 | |
| Dell Precision 5550 P91F | |
| R Benchmark 2.5 / Overall mean | |
| Dell XPS 15 9500 Core i5 | |
| MSI GS66 Stealth 10SE-045 | |
| Dell Precision 5550 P91F | |
| Razer Blade 15 Studio Edition 2020 | |
| Asus ROG Zephyrus Duo 15 GX550LXS | |
| Átlagos Intel Core i7-10875H (0.546 - 0.662, n=29) | |
| Eluktronics RP-15 | |
* ... a kisebb jobb
| PCMark 8 | |
| Home Score Accelerated v2 | |
| MSI WP65 | |
| Acer ConceptD 3 Pro CN315-71P-73W1 | |
| Dell Precision 5550 P91F | |
| Dell Precision 5540 | |
| Razer Blade 15 Studio Edition 2020 | |
| Work Score Accelerated v2 | |
| Acer ConceptD 3 Pro CN315-71P-73W1 | |
| MSI WP65 | |
| Razer Blade 15 Studio Edition 2020 | |
| Dell Precision 5540 | |
| Dell Precision 5550 P91F | |
| PCMark 8 Home Score Accelerated v2 | 3729 pontok | |
| PCMark 8 Work Score Accelerated v2 | 4515 pontok | |
| PCMark 10 Score | 5442 pontok | |
Segítség | ||
| DPC Latencies / LatencyMon - interrupt to process latency (max), Web, Youtube, Prime95 | |
| Dell XPS 15 9500 Core i7 4K UHD | |
| Asus ROG Zephyrus Duo 15 GX550LXS | |
| Dell XPS 15 9500 Core i5 | |
| Acer ConceptD 3 Pro CN315-71P-73W1 | |
| Razer Blade 15 Studio Edition 2020 | |
| Eluktronics RP-15 | |
| Dell Precision 5550 P91F | |
* ... a kisebb jobb
| Dell Precision 5550 P91F SK Hynix PC601A NVMe 1TB | Dell Precision 5540 SK hynix PC400 512 GB | Razer Blade 15 Studio Edition 2020 Samsung PM981a MZVLB1T0HBLR | Acer ConceptD 3 Pro CN315-71P-73W1 WDC PC SN720 SDAPNTW-512G | MSI WP65 Samsung SSD PM981 MZVLB512HAJQ | |
|---|---|---|---|---|---|
| AS SSD | -14% | 10% | 4% | 8% | |
| Seq Read (MB/s) | 2039 | 1743 -15% | 1982 -3% | 2973 46% | 1097 -46% |
| Seq Write (MB/s) | 1376 | 930 -32% | 2252 64% | 2429 77% | 1838 34% |
| 4K Read (MB/s) | 44.11 | 39.1 -11% | 47.13 7% | 24.7 -44% | 52.9 20% |
| 4K Write (MB/s) | 113.3 | 92.1 -19% | 88.2 -22% | 115.3 2% | 108.4 -4% |
| 4K-64 Read (MB/s) | 1094 | 956 -13% | 1481 35% | 1243 14% | 1509 38% |
| 4K-64 Write (MB/s) | 1630 | 863 -47% | 1842 13% | 835 -49% | 1695 4% |
| Access Time Read * (ms) | 0.059 | 0.074 -25% | 0.087 -47% | 0.067 -14% | |
| Access Time Write * (ms) | 0.99 | 0.053 95% | 0.04 96% | 0.034 97% | 0.103 90% |
| Score Read (Points) | 1342 | 1170 -13% | 1726 29% | 1565 17% | 1671 25% |
| Score Write (Points) | 1881 | 1048 -44% | 2155 15% | 1193 -37% | 1988 6% |
| Score Total (Points) | 3883 | 2781 -28% | 4781 23% | 3525 -9% | 4558 17% |
| Copy ISO MB/s (MB/s) | 2489 | 1982 -20% | 2136 -14% | 1800 -28% | |
| Copy Program MB/s (MB/s) | 682 | 501 -27% | 489.6 -28% | 569 -17% | |
| Copy Game MB/s (MB/s) | 1515 | 1140 -25% | 1163 -23% | 1409 -7% | |
| CrystalDiskMark 5.2 / 6 | -18% | 14% | -3% | 5% | |
| Write 4K (MB/s) | 122.6 | 98 -20% | 132.9 8% | 113.2 -8% | 126.9 4% |
| Read 4K (MB/s) | 42.4 | 41.25 -3% | 46.73 10% | 31.1 -27% | 44.91 6% |
| Write Seq (MB/s) | 2167 | 1295 -40% | 2214 2% | 2540 17% | 1944 -10% |
| Read Seq (MB/s) | 1747 | 1441 -18% | 2018 16% | 2005 15% | 1449 -17% |
| Write 4K Q32T1 (MB/s) | 388.8 | 429.2 10% | 478.9 23% | 331.4 -15% | 531 37% |
| Read 4K Q32T1 (MB/s) | 367.3 | 400.1 9% | 540 47% | 368.3 0% | 579 58% |
| Write Seq Q32T1 (MB/s) | 2629 | 1366 -48% | 2975 13% | 2535 -4% | 1970 -25% |
| Read Seq Q32T1 (MB/s) | 3460 | 2201 -36% | 3195 -8% | 3427 -1% | 2990 -14% |
| Teljes átlag (program / beállítások) | -16% /
-16% | 12% /
11% | 1% /
1% | 7% /
7% |
* ... a kisebb jobb

Disk Throttling: DiskSpd Read Loop, Queue Depth 8
| 3DMark | |
| 1280x720 Cloud Gate Standard Graphics | |
| Lenovo ThinkPad P53-20QN000YGE | |
| Razer Blade 15 Studio Edition 2020 | |
| Razer Blade 15 Studio Edition | |
| Eluktronics RP-15 | |
| Dell Precision 7540 | |
| Acer ConceptD 3 Pro CN315-71P-73W1 | |
| Apple MacBook Pro 15 2019 i9 Vega 16 | |
| Dell Precision 5540 | |
| Dell Precision 5550 P91F | |
| Dell XPS 15 9500 Core i7 4K UHD | |
| MSI WP65 | |
| Schenker Work 15 | |
| 1920x1080 Fire Strike Graphics | |
| Razer Blade 15 Studio Edition 2020 | |
| Razer Blade 15 Studio Edition | |
| Lenovo ThinkPad P53-20QN000YGE | |
| Eluktronics RP-15 | |
| Dell XPS 15 9500 Core i7 4K UHD | |
| Acer ConceptD 3 Pro CN315-71P-73W1 | |
| Dell Precision 5550 P91F | |
| Dell Precision 5540 | |
| Apple MacBook Pro 15 2019 i9 Vega 16 | |
| MSI WP65 | |
| Schenker Work 15 | |
| 2560x1440 Time Spy Graphics | |
| Razer Blade 15 Studio Edition 2020 | |
| Razer Blade 15 Studio Edition | |
| Lenovo ThinkPad P53-20QN000YGE | |
| Eluktronics RP-15 | |
| Dell Precision 7540 | |
| Dell XPS 15 9500 Core i7 4K UHD | |
| Acer ConceptD 3 Pro CN315-71P-73W1 | |
| Dell Precision 5550 P91F | |
| Dell Precision 5540 | |
| Apple MacBook Pro 15 2019 i9 Vega 16 | |
| MSI WP65 | |
| Schenker Work 15 | |
| 3DMark 11 | |
| 1280x720 Performance GPU | |
| Razer Blade 15 Studio Edition 2020 | |
| Razer Blade 15 Studio Edition | |
| Lenovo ThinkPad P53-20QN000YGE | |
| Eluktronics RP-15 | |
| Dell XPS 15 9500 Core i7 4K UHD | |
| Acer ConceptD 3 Pro CN315-71P-73W1 | |
| Dell Precision 5540 | |
| Dell Precision 5550 P91F | |
| Apple MacBook Pro 15 2019 i9 Vega 16 | |
| MSI WP65 | |
| Schenker Work 15 | |
| 1280x720 Performance Combined | |
| Eluktronics RP-15 | |
| Dell XPS 15 9500 Core i7 4K UHD | |
| Lenovo ThinkPad P53-20QN000YGE | |
| Razer Blade 15 Studio Edition 2020 | |
| Dell Precision 5550 P91F | |
| Razer Blade 15 Studio Edition | |
| Acer ConceptD 3 Pro CN315-71P-73W1 | |
| Dell Precision 5540 | |
| Apple MacBook Pro 15 2019 i9 Vega 16 | |
| MSI WP65 | |
| Schenker Work 15 | |
| 3DMark 11 Performance | 12119 pontok | |
| 3DMark Cloud Gate Standard Score | 21582 pontok | |
| 3DMark Fire Strike Score | 7767 pontok | |
| 3DMark Time Spy Score | 3348 pontok | |
Segítség | ||
| alacsony | közepes | magas | ultra | QHD | 4K | |
|---|---|---|---|---|---|---|
| The Witcher 3 (2015) | 181 | 107.6 | 62.5 | 33.4 | ||
| Dota 2 Reborn (2015) | 153 | 140 | 130 | 118 | 47.9 | |
| Final Fantasy XV Benchmark (2018) | 91 | 48.5 | 36.8 | 25.7 | 13.7 | |
| X-Plane 11.11 (2018) | 91.9 | 76 | 64.8 | 47.2 | ||
| Shadow of the Tomb Raider (2018) | 101 | 56 | 48 | 42 | ||
| Assassin´s Creed Odyssey (2018) | 71 | 53 | 45 | 25 | ||
| Apex Legends (2019) | 144 | 86.4 | 72.7 | 64.9 | ||
| Far Cry New Dawn (2019) | 83 | 58 | 55 | 50 | ||
| Metro Exodus (2019) | 91.5 | 41.74 | 31.2 | 24.6 | ||
| Dirt Rally 2.0 (2019) | 271 | 86.1 | 69.9 | 40.3 | ||
| Total War: Three Kingdoms (2019) | 148.4 | 60.3 | 36.3 | 24.4 | ||
| Control (2019) | 120.2 | 40.4 | 28.3 | |||
| Borderlands 3 (2019) | 123.4 | 56 | 35.8 | 27.3 | ||
| GRID 2019 (2019) | 179 | 94.7 | 77.7 | 51 | ||
| Star Wars Jedi Fallen Order (2019) | 64.2 | 53.1 | 47 | |||
| Hunt Showdown (2020) | 141.3 | 50.3 | 44.5 | |||
| Doom Eternal (2020) | 147.4 | 85.5 | 58.1 | |||
| Gears Tactics (2020) | 263.3 | 77.5 | 47.6 | 35.1 | ||
| F1 2020 (2020) | 182 | 96 | 78 | 55 |
| Dell Precision 5550 P91F Quadro T2000 Max-Q, i7-10875H, SK Hynix PC601A NVMe 1TB | Dell Precision 5540 Quadro T2000 Max-Q, i9-9980HK, SK hynix PC400 512 GB | Razer Blade 15 Studio Edition 2020 Quadro RTX 5000 Max-Q, i7-10875H, Samsung PM981a MZVLB1T0HBLR | Acer ConceptD 3 Pro CN315-71P-73W1 Quadro T1000 (Laptop), i7-9750H, WDC PC SN720 SDAPNTW-512G | Lenovo ThinkPad P53-20QN000YGE Quadro RTX 5000 Max-Q, i7-9850H, Samsung PM981a MZVLB1T0HBLR | MSI WP65 Quadro P620, i7-9750H, Samsung SSD PM981 MZVLB512HAJQ | |
|---|---|---|---|---|---|---|
| Noise | 2% | -11% | -7% | 3% | -15% | |
| off / környezet * (dB) | 26.2 | 28.6 -9% | 30.1 -15% | 31.2 -19% | 28.3 -8% | 28.7 -10% |
| Idle Minimum * (dB) | 26.2 | 28.6 -9% | 30.1 -15% | 31.2 -19% | 28.3 -8% | 33.4 -27% |
| Idle Average * (dB) | 26.2 | 28.6 -9% | 30.1 -15% | 31.2 -19% | 28.3 -8% | 33.5 -28% |
| Idle Maximum * (dB) | 26.2 | 28.6 -9% | 30.1 -15% | 31.5 -20% | 28.3 -8% | 33.5 -28% |
| Load Average * (dB) | 39.2 | 33.3 15% | 42.3 -8% | 38.4 2% | 29.8 24% | 37 6% |
| Witcher 3 ultra * (dB) | 39 | 34.7 11% | 48.2 -24% | 36.9 5% | 38.3 2% | 38.7 1% |
| Load Maximum * (dB) | 50.6 | 38 25% | 42.1 17% | 41.2 19% | 38.3 24% | 59.5 -18% |
* ... a kisebb jobb
Zajszint
| Üresjárat |
| 26.2 / 26.2 / 26.2 dB(A) |
| Terhelés |
| 39.2 / 50.6 dB(A) |
 | ||
30 dB csendes 40 dB(A) hallható 50 dB(A) hangos |
||
min: | ||
(-) A felső oldalon a maximális hőmérséklet 47 °C / 117 F, összehasonlítva a 38.2 °C / 101 F átlagával , 22.2 és 69.8 °C között a Workstation osztálynál.
(±) Az alsó maximum 44 °C / 111 F-ig melegszik fel, összehasonlítva a 41.1 °C / 106 F átlagával
(+) Üresjáratban a felső oldal átlagos hőmérséklete 27.1 °C / 81 F, összehasonlítva a 32 °C / ### eszközátlaggal class_avg_f### F.
(±) A The Witcher 3 játék során a felső oldal átlaghőmérséklete 35.4 °C / 96 F, összehasonlítva a 32 °C / ## eszközátlaggal #class_avg_f### F.
(+) A csuklótámasz és az érintőpad eléri a bőr maximális hőmérsékletét (32.2 °C / 90 F), ezért nem forrók.
(-) A hasonló eszközök csuklótámasz területének átlagos hőmérséklete 27.8 °C / 82 F volt (-4.4 °C / -8 F).
Dell Precision 5550 P91F hangelemzés
(+) | a hangszórók viszonylag hangosan tudnak játszani (85 dB)
Basszus 100 - 315 Hz
(±) | csökkentett basszus – átlagosan 5.7%-kal alacsonyabb, mint a medián
(±) | a basszus linearitása átlagos (7.7% delta az előző frekvenciához)
Közepes 400-2000 Hz
(+) | kiegyensúlyozott középpontok – csak 2.9% választja el a mediántól
(+) | a középpontok lineárisak (4.2% delta az előző frekvenciához)
Maximum 2-16 kHz
(+) | kiegyensúlyozott csúcsok – csak 2.3% választja el a mediántól
(+) | a csúcsok lineárisak (2.6% delta az előző frekvenciához képest)
Összességében 100 - 16.000 Hz
(+) | általános hangzás lineáris (6.7% eltérés a mediánhoz képest)
Ugyanazon osztályhoz képest
» 0%Ebben az osztályban az összes tesztelt eszköz %-a jobb volt, 1% hasonló, 99%-kal rosszabb
» A legjobb delta értéke 7%, az átlag 17%, a legrosszabb 35% volt
Az összes tesztelt eszközzel összehasonlítva
» 1% az összes tesztelt eszköz jobb volt, 0% hasonló, 99%-kal rosszabb
» A legjobb delta értéke 4%, az átlag 24%, a legrosszabb 134% volt
Apple MacBook 12 (Early 2016) 1.1 GHz hangelemzés
(+) | a hangszórók viszonylag hangosan tudnak játszani (83.6 dB)
Basszus 100 - 315 Hz
(±) | csökkentett basszus – átlagosan 11.3%-kal alacsonyabb, mint a medián
(±) | a basszus linearitása átlagos (14.2% delta az előző frekvenciához)
Közepes 400-2000 Hz
(+) | kiegyensúlyozott középpontok – csak 2.4% választja el a mediántól
(+) | a középpontok lineárisak (5.5% delta az előző frekvenciához)
Maximum 2-16 kHz
(+) | kiegyensúlyozott csúcsok – csak 2% választja el a mediántól
(+) | a csúcsok lineárisak (4.5% delta az előző frekvenciához képest)
Összességében 100 - 16.000 Hz
(+) | általános hangzás lineáris (10.2% eltérés a mediánhoz képest)
Ugyanazon osztályhoz képest
» 7%Ebben az osztályban az összes tesztelt eszköz %-a jobb volt, 2% hasonló, 91%-kal rosszabb
» A legjobb delta értéke 5%, az átlag 18%, a legrosszabb 53% volt
Az összes tesztelt eszközzel összehasonlítva
» 5% az összes tesztelt eszköz jobb volt, 1% hasonló, 94%-kal rosszabb
» A legjobb delta értéke 4%, az átlag 24%, a legrosszabb 134% volt
| Kikapcsolt állapot / Készenlét | |
| Üresjárat | |
| Terhelés |
|
Kulcs:
min: | |
| Dell Precision 5550 P91F i7-10875H, Quadro T2000 Max-Q, SK Hynix PC601A NVMe 1TB, IPS, 3840x2400, 15.6" | Dell Precision 5540 i9-9980HK, Quadro T2000 Max-Q, SK hynix PC400 512 GB, OLED, 3840x2160, 15.6" | Razer Blade 15 Studio Edition 2020 i7-10875H, Quadro RTX 5000 Max-Q, Samsung PM981a MZVLB1T0HBLR, OLED, 3840x2160, 15.6" | Acer ConceptD 3 Pro CN315-71P-73W1 i7-9750H, Quadro T1000 (Laptop), WDC PC SN720 SDAPNTW-512G, IPS, 1920x1080, 15.6" | Lenovo ThinkPad P53-20QN000YGE i7-9850H, Quadro RTX 5000 Max-Q, Samsung PM981a MZVLB1T0HBLR, IPS, 1920x1080, 15.6" | MSI WP65 i7-9750H, Quadro P620, Samsung SSD PM981 MZVLB512HAJQ, IPS, 1920x1080, 15.6" | |
|---|---|---|---|---|---|---|
| Power Consumption | -2% | -59% | 31% | -27% | -4% | |
| Idle Minimum * (Watt) | 5.6 | 7.4 -32% | 13.4 -139% | 2.9 48% | 7.9 -41% | 5.6 -0% |
| Idle Average * (Watt) | 11.2 | 12.1 -8% | 18 -61% | 5.5 51% | 11.8 -5% | 8.6 23% |
| Idle Maximum * (Watt) | 18.4 | 12.7 31% | 26.1 -42% | 10.6 42% | 14.9 19% | 30.7 -67% |
| Load Average * (Watt) | 114 | 98 14% | 115 -1% | 86 25% | 96 16% | 78 32% |
| Witcher 3 ultra * (Watt) | 76.7 | 89.9 -17% | 145 -89% | 83 -8% | 149 -94% | 63.5 17% |
| Load Maximum * (Watt) | 134.2 | 135.1 -1% | 165 -23% | 100.7 25% | 207.8 -55% | 170.2 -27% |
* ... a kisebb jobb
| Dell Precision 5550 P91F i7-10875H, Quadro T2000 Max-Q, 86 Wh | Dell Precision 5540 i9-9980HK, Quadro T2000 Max-Q, 97 Wh | Razer Blade 15 Studio Edition 2020 i7-10875H, Quadro RTX 5000 Max-Q, 80 Wh | Acer ConceptD 3 Pro CN315-71P-73W1 i7-9750H, Quadro T1000 (Laptop), 58.7 Wh | Lenovo ThinkPad P53-20QN000YGE i7-9850H, Quadro RTX 5000 Max-Q, 90 Wh | MSI WP65 i7-9750H, Quadro P620, 51 Wh | |
|---|---|---|---|---|---|---|
| Akkumulátor üzemidő | -9% | -18% | -10% | 33% | -48% | |
| Reader / Idle (h) | 22.6 | 15 -34% | 8.8 -61% | 10.1 -55% | ||
| WiFi v1.3 (h) | 9 | 7.7 -14% | 5.7 -37% | 8.1 -10% | 11.1 23% | 6 -33% |
| Load (h) | 1.4 | 1.7 21% | 2 43% | 2 43% | 0.6 -57% |
Pro
Kontra
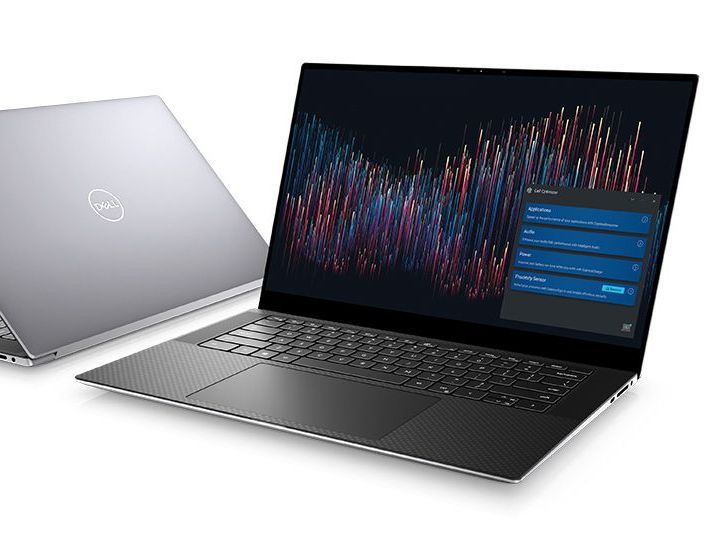
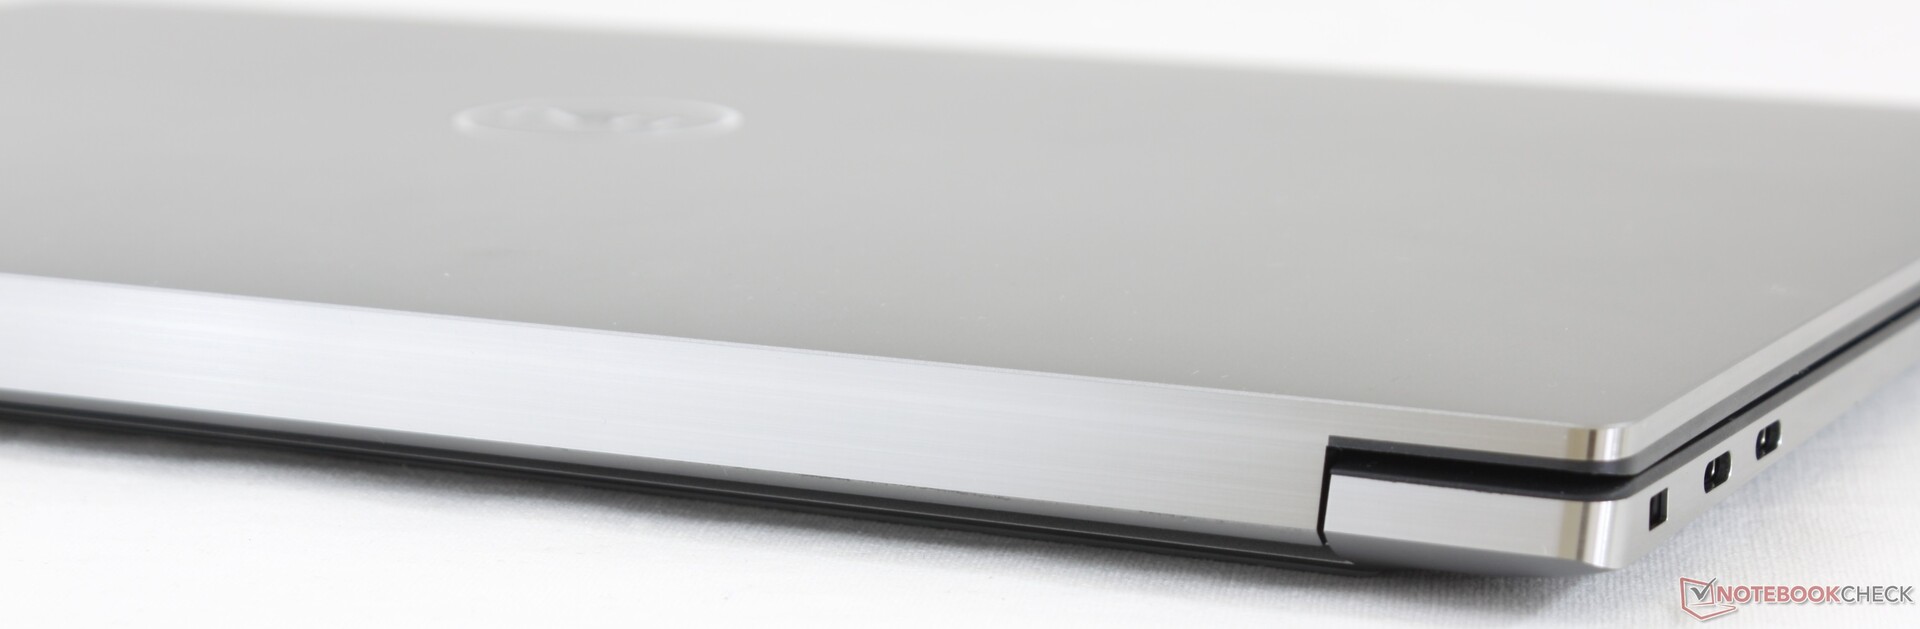
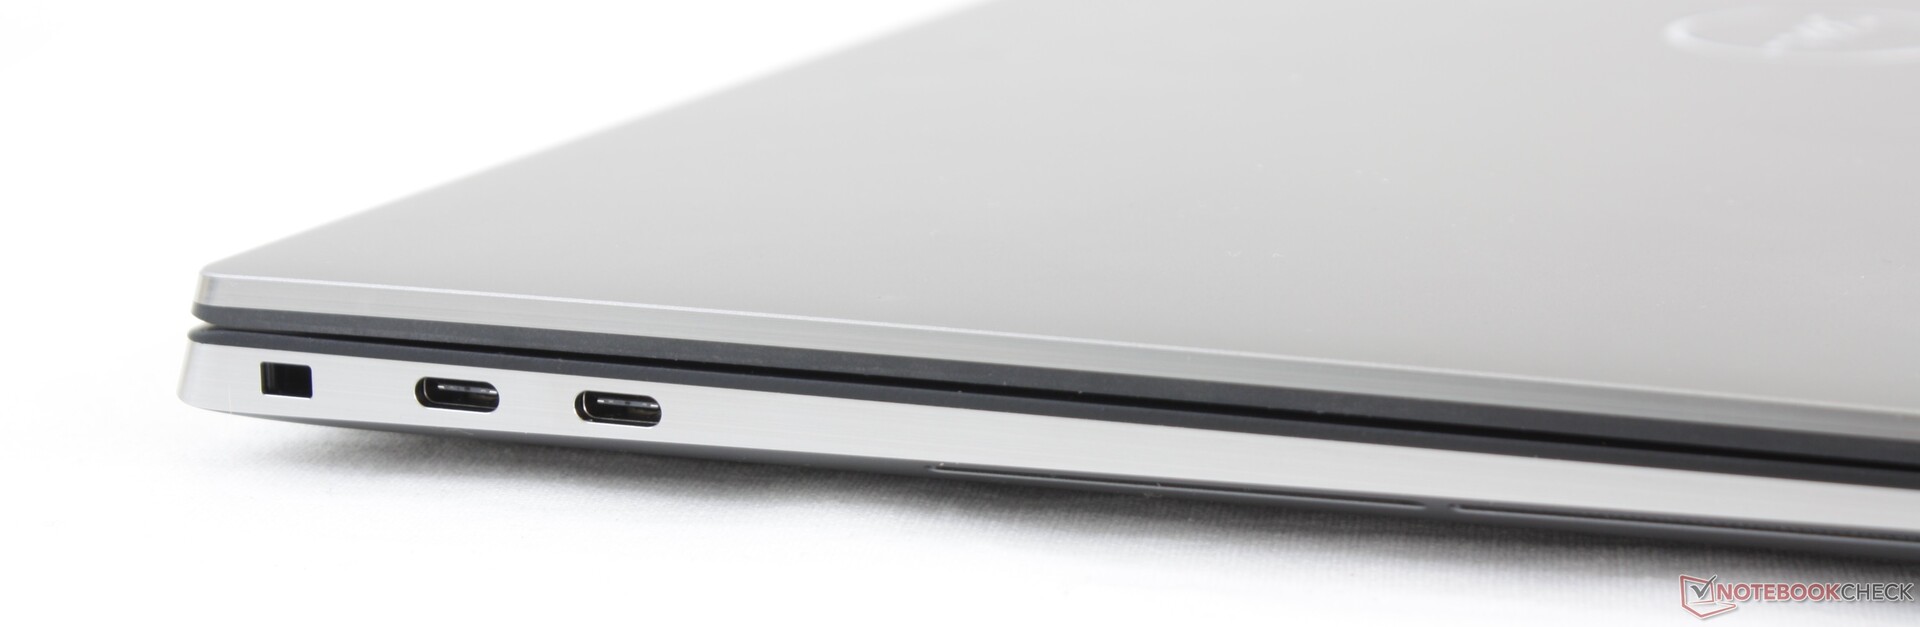
Az ultravékony és könnyű Studio laptopok többségéhez hasonlóan a Precision 5550 elsősorban a hordozhatóság, a karcsú dizájn és a megkapó, fényes érintőképernyő miatt értékelendő, és csak másodsorban a nyers teljesítmény és a portválaszték miatt. Ez nem azt jelenti, hogy gyenge rendszer, viszont elkerülhetetlenül fel kell áldoznunk néhány magasabb kategóriás grafikai opciót ezért a vonzó Ultrabook megjelenésért.
Aki nem tervez túl sok helyváltoztatást, vagy megengedheti magának a helyet, annak a nagyobb Precision 7550 lehet a jobbik választás, mivel jóval gyorsabb, és több teljesítmény-opciója van, mint a Precision 5550-nek. Ez a gép inkább utazóknak, valamint hibrid munkaállomás-Ultrabook célokra készült, nem pedig arra, hogy egy helyhez kötött megoldás legyen, amely órákig nagy terheléseknek van kitéve.
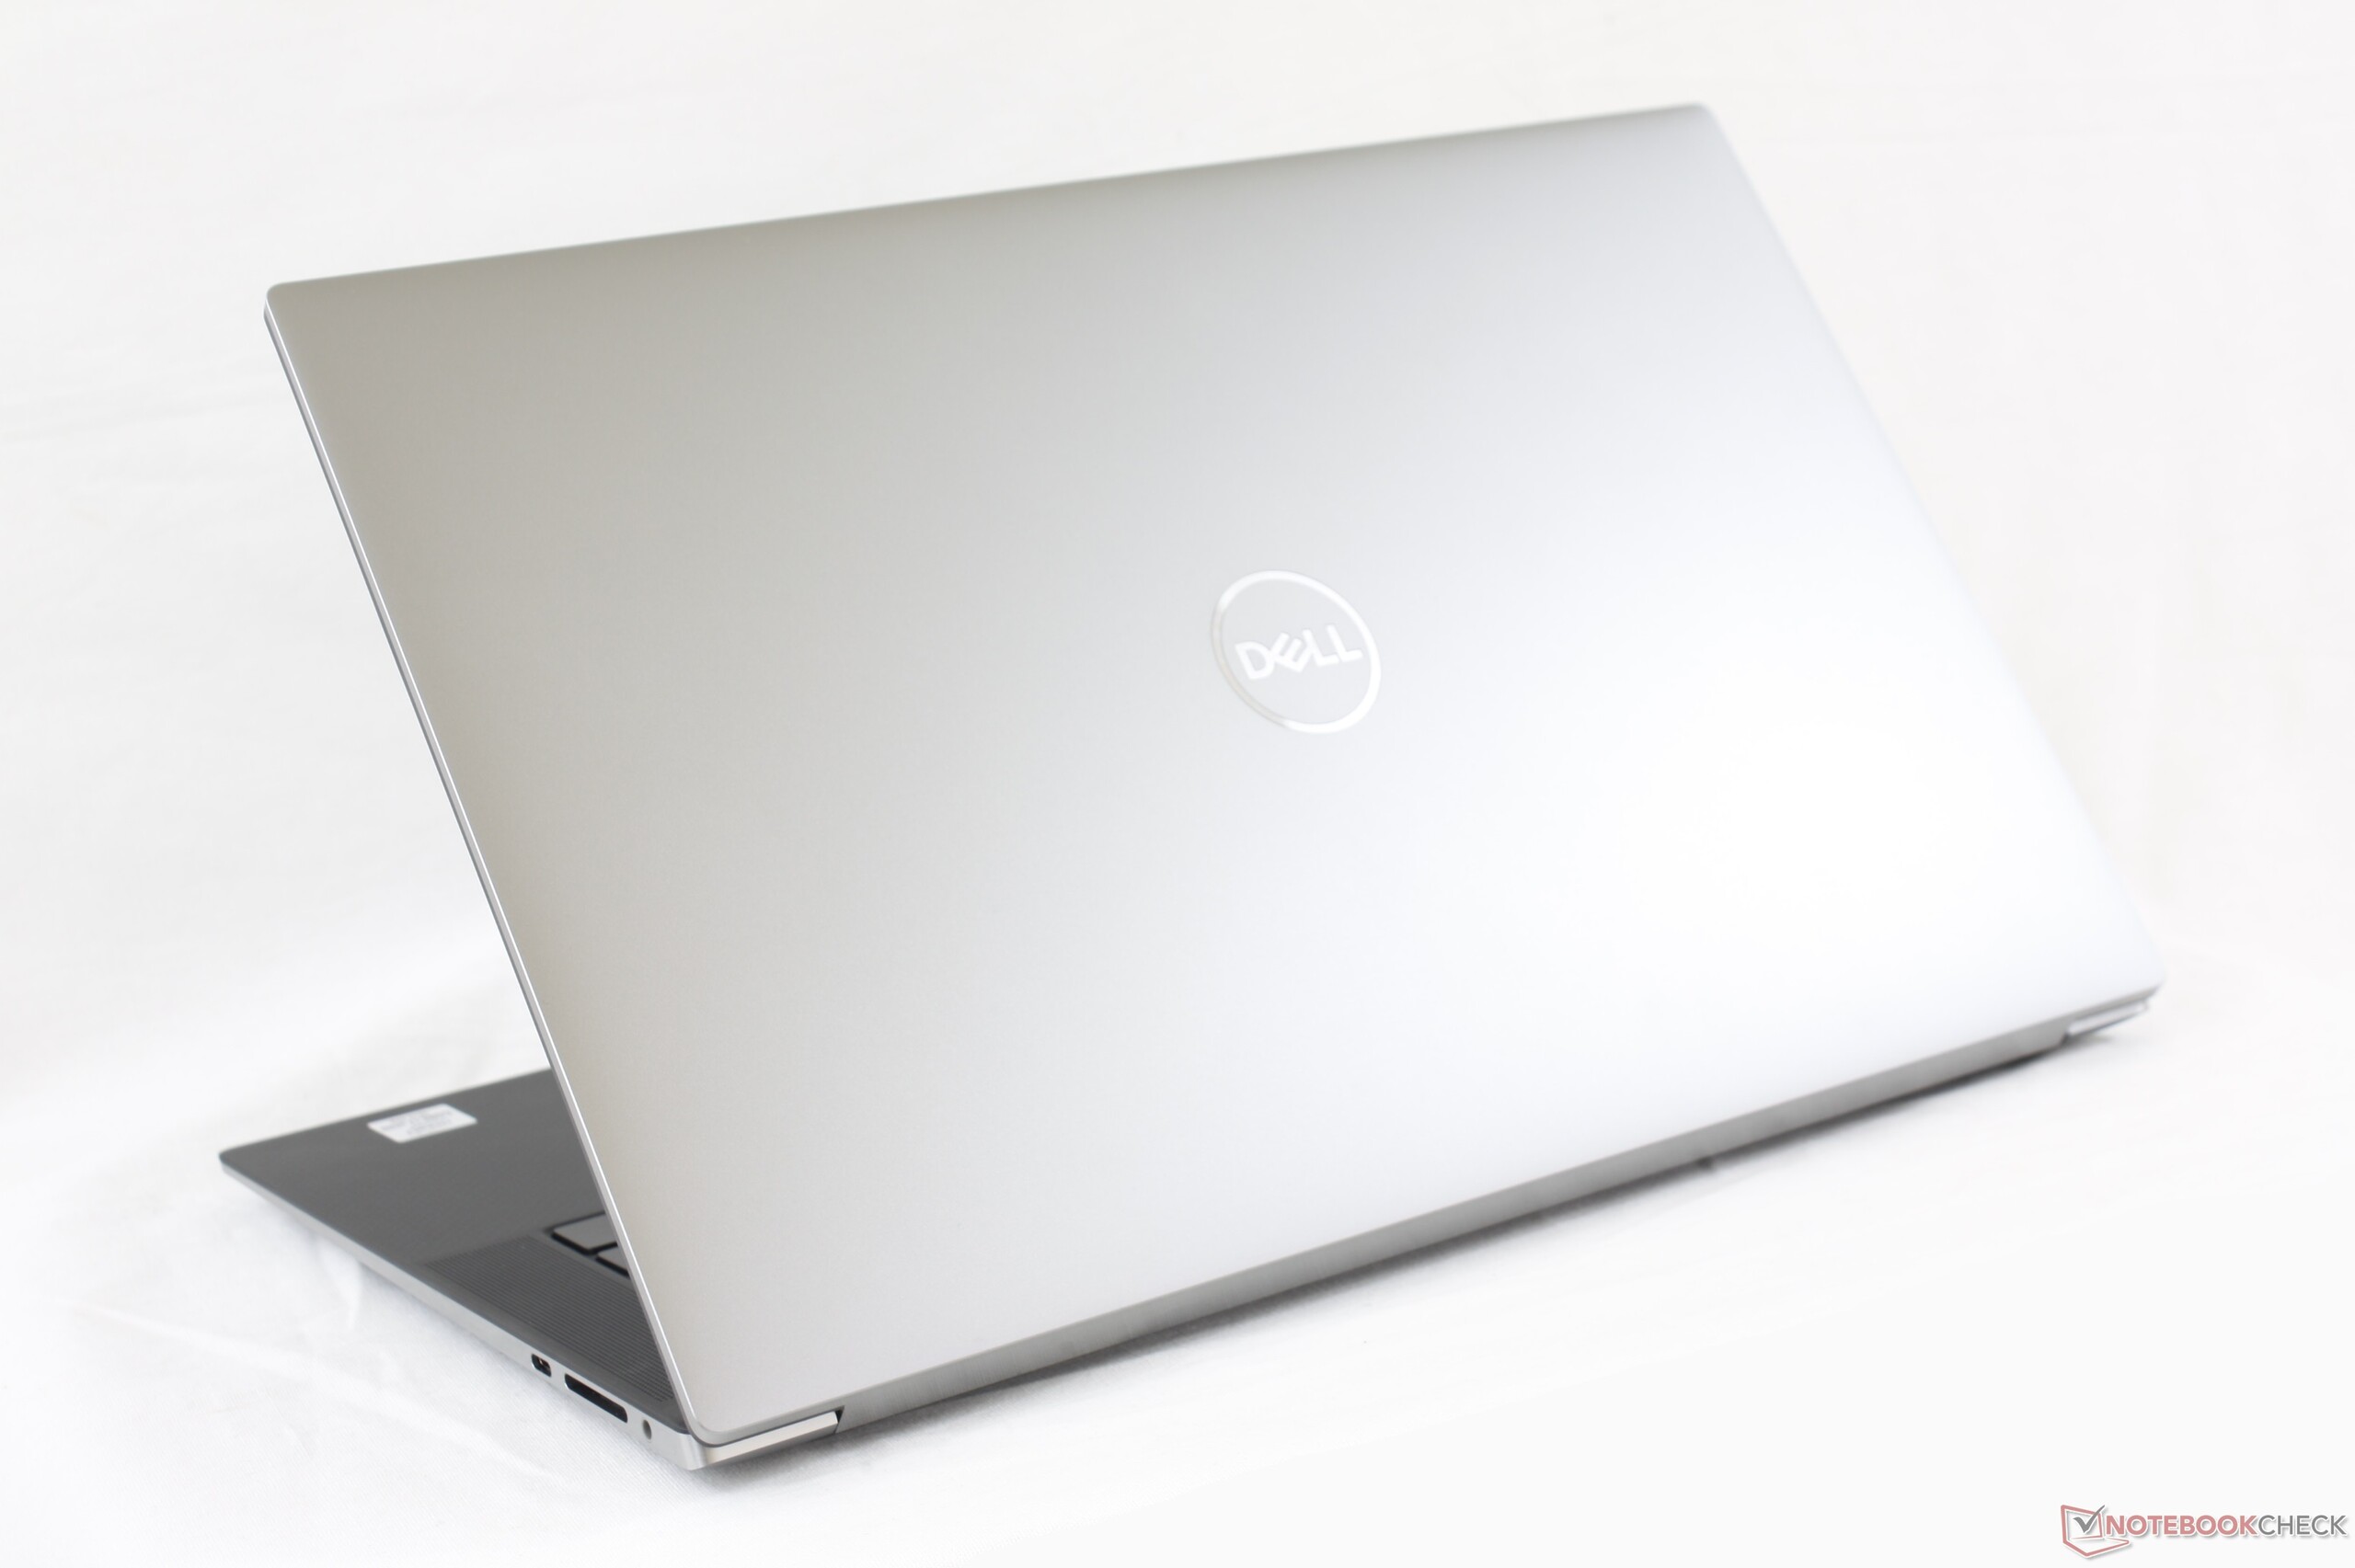
Kisebb, vékonyabb és könnyebb, mint a piacon levő munkaállomások többsége. A Dell Precision 5550 magasabb szintű grafikai opciókat és portválasztékot áldoz fel az utazásbarát tervezésért.
Dell Precision 5550 P91F
- 08/05/2020 v7 (old)
Allen Ngo
Price comparison

