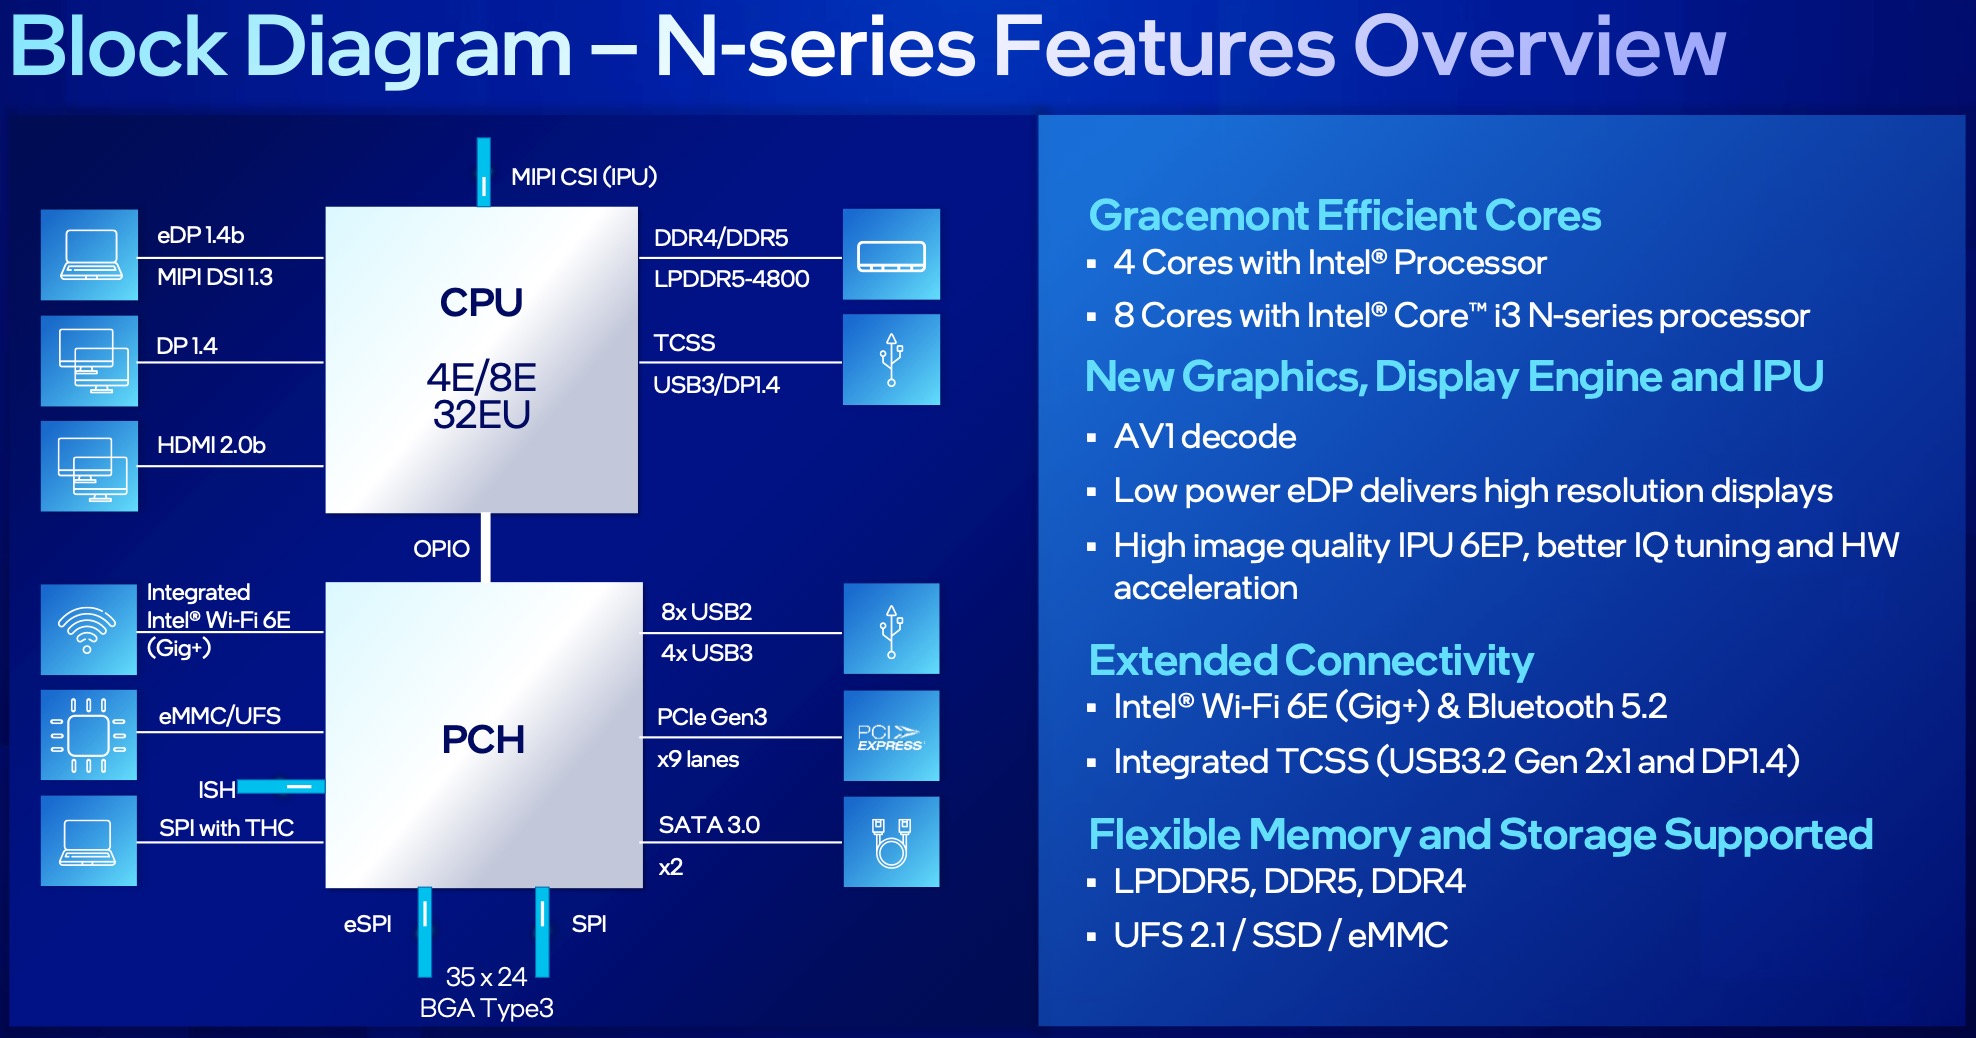
Az Intel N200 processzor az Alder Lake-N sorozatból származó, vékony és könnyű laptopokba szánt belépő szintű mobil CPU. A 2023 elején jelentették be, és a 8 hatékony magból (E-magok, Gracemont architektúra) 4 magot és teljesítménymagot nem kínál. A lapka nem támogatja a HyperThreadinget és legfeljebb 3,7 GHz-es órajelekkel működik. Az E-magok teljesítménye a régi Skylake magokhoz hasonlónak kell lennie (vö Core i7-6700HQ ). Minden mag akár 6 MB L3-cache-t is használhat.
Az Alder Lake-N lapkák csak egycsatornás memóriát támogatnak, legfeljebb DDR5-4800, DDR4-3200 vagy LPDDR5-4800 memóriával. A chip támogatja a Quick Sync és az AV1 dekódolást is (valószínűleg ugyanaz a motor, mint az Alder Lake-ben). Továbbá részben integrált Wi-Fi 6E és Bluetooth 5.2 (de nincs Thunderbolt). A külső chipek PCIe Gen3 x9-en keresztül csatlakoztathatók (a PCH-n keresztül).
Az integrált grafikus adapter az Xe-architektúrán alapul, és mind a 32 EU-t (Execution Unit) kínál, amelyek mindössze 450-750 MHz-en üzemelnek. Az egycsatornás memória, az alacsony órajelek és a shaderek alacsony száma miatt az iGPU játékteljesítménye nagyon korlátozott.
Az N200 alapteljesítményfogyasztása mindössze 6 W, ezért alkalmas ventilátor nélküli hűtésre. A CPU az Intelnél továbbfejlesztett 10 nm-es SuperFin eljárással készül (Intel 7 néven).
Kódnév Alder Lake-N Széria Intel Alder Lake-N Széria: Alder Lake-N Alder Lake-N Órajel 1000 - 3700 MHz Level 3 Cache 6 MB Magok / Szálak 4 / 4 Max. Áramfelvétel (TDP - Thermal Design Power) 6 Watt Gyártástechnológia 10 nm Max. Hőmérséklet 105 °C GPU Intel UHD Graphics Xe 750 32EUs (Rocket Lake) (450 - 750 MHz)64 bit 64 bites támogatás Architecture x86 Bejelentés dátuma 01/03/2023 Termék hivatkozás (külső) ark.intel.com
Performance Rating - CB R15 + R20 + 7-Zip + X265 + Blender + 3DM11 CPU
AMD E1-2100
...
Intel Core i5-L16G7
Intel Core i5-4258U
Intel Core i3-10100Y
Intel Core i5-8210Y
...
AMD Ryzen 9 9955HX
max:
Cinebench 2024 - Cinebench 2024 CPU Single Core
Qualcomm Snapdragon 7c+ Gen 3
AMD Ryzen 5 3500U
Intel Core i3-1005G1
...
Apple M5 Pro 18-Core
Cinebench 2024 - Cinebench 2024 CPU Multi Core
Qualcomm Snapdragon 7c+ Gen 3
Intel Core i3-1005G1
AMD Ryzen 5 3500U
...
Apple M5 Pro 18-Core
max:
Cinebench R23 - Cinebench R23 Multi Core
AMD E1-2100
...
Intel Core i3-5005U
Intel Pentium Silver N5000
Intel Core m3-7Y32
Intel Pentium Gold 6500Y
Intel Core i3-10100Y
Intel Core i5-5200U
Intel Core i5-4258U
Intel Core i5-5250U
Intel Pentium Silver J5005
Intel Core i3-6157U
Qualcomm Snapdragon 7c+ Gen 3
...
AMD Ryzen 9 9955HX3D
max:
Cinebench R23 - Cinebench R23 Single Core
AMD A10-5745M
...
Intel Core i5-5200U
Intel Core i5-8260U
Intel Core m3-7Y32
Intel Core i3-6157U
Intel Core i5-5250U
Intel Core i7-2860QM
Intel Core i5-4300M
Intel Core i5-L16G7
Intel Pentium Gold 6500Y
Intel Core i3-10100Y
AMD Ryzen Embedded V1605B
...
Apple M5 10-Core
Cinebench R20 - Cinebench R20 CPU (Single Core)
AMD E1-2100
...
AMD Ryzen Embedded R1505G
Intel Core i5-4258U
Intel Core i3-6157U
Intel Core i7-10510Y
Intel Core i5-5250U
Intel Core i7-2860QM
Intel Pentium Gold 6500Y
Intel Core i5-L16G7
AMD Ryzen 7 3780U
Intel Core i3-8145U
AMD Ryzen 3 3200U
Intel Core i3-10100Y
...
max:
Intel Core Ultra 7 270K Plus
Cinebench R20 - Cinebench R20 CPU (Multi Core)
AMD E1-2100
...
Intel Celeron N4120
Intel Pentium Silver N5000
Intel Pentium Gold 4417U
Intel Core i3-5005U
Intel Core i3-5010U
Intel Core i3-10100Y
Intel Pentium Silver J5005
Intel Core i5-5250U
Intel Core i3-1000NG4
Intel Core i7-8500Y
Intel Pentium Gold 6500Y
AMD Ryzen Embedded R1505G
Intel Core i5-8210Y
Intel Core i5-4258U
...
AMD Ryzen 9 9955HX3D
max:
Cinebench R15 - Cinebench R15 CPU Multi 64 Bit
AMD A4-1250
...
Intel Core i3-5005U
Intel Core i3-3110M
AMD A10-9600P
Intel Core i5-3337U
Intel Core i3-5015U
Intel Core m5-6Y54
Intel Core i3-5010U
Intel Core i3-10100Y
Intel Celeron J4125
AMD FX-7600P
Intel Core i5-3437U
AMD PRO A12-9800B
Intel Pentium Silver N5030
Intel Core i5-4200U
...
AMD Ryzen 9 9955HX3D
max:
0 5 10 15 20 25 30 35 40 45 50 55 60 65 70 75 80 85 90 95 100 105 110 115 120 125 130 135 140 145 150 155 160 165 170 175 180 185 190 195 200 205 210 215 Tooltip Asus ExpertCenter PN42-BBN200MV: Ø210 (198.23-215.98)
Cinebench R15 - Cinebench R15 CPU Single 64 Bit
AMD A4-1200
...
Intel Core i5-4310U
Intel Core i7-4610Y
Intel Core i3-6100H
Intel Core i5-4258U
Intel Core i3-7130U
Intel Core i7-5650U
Intel Core i7-3632QM
Intel Core i5-5300U
Intel Core i5-7Y54
Intel Core i5-5350U
AMD Ryzen 3 2200U
Intel Core i5-6260U
...
max:
Intel Core Ultra 9 285K
Cinebench R11.5 - Cinebench R11.5 CPU Multi 64 Bit
Intel Atom N450
...
Intel Core i7-3537U
AMD A12-9720P
AMD A10-9620P
Intel Core i5-3437U
Intel Celeron N4120
Intel Core i7-4650U
Intel Core i7-4500U
Intel Core i3-1000NG4
Intel Core i7-3517U
Intel Core i5-2450M
Intel Celeron J4125
Intel Core i3-6100U
Intel Core i5-5200U
Intel Core i7-4550U
Intel Core i5-5250U
...
AMD Ryzen 9 9955HX3D
max:
Intel Core Ultra 7 270K Plus
Cinebench R11.5 - Cinebench R11.5 CPU Single 64 Bit
AMD C-60
...
Intel Core i5-3320M
Intel Core i5-6260U
Intel Core i7-4550U
Intel Core i7-3615QM
Intel Core i5-6198DU
Intel Core i5-5300U
Intel Core i7-4600U
Intel Core i7-2640M
Intel Core i7-5500U
Qualcomm Snapdragon 8cx Gen 3
Intel Core i7-3635QM
Intel Core i5-3360M
Intel Core i5-4210M
Intel Core i5-4300M
Intel Core i5-5257U
...
max:
Intel Core Ultra 9 285K
Cinebench R10 - Cinebench R10 Rend. Single (32bit)
AMD Geode LX 800
...
Intel Core i5-2430M
Intel Core m5-6Y54
Intel Core i5-4210U
Intel Core 2 Extreme X9100
Intel Core m5-6Y57
Intel Core i3-7100U
Intel Core i7-2670QM
Intel Core i5-2450M
Intel Core i7-3612QM
Intel Core i5-2520M
Intel Core i5-4260U
Intel Core i5-3437U
AMD Ryzen 3 2200U
...
max:
Cinebench R10 - Cinebench R10 Rend. Multi (32bit)
Intel Atom 230
...
AMD A12-9720P
AMD A10-9620P
Intel Core i5-4200U
Intel Core i5-2415M
Intel Core i5-3427U
Intel Core i5-3337U
Intel Core i5-560M
Intel Core i7-620M
Intel Core i5-4210U
Intel Core i5-4250U
Intel Core i5-580M
Intel Pentium Silver N5030
AMD Ryzen 3 2200U
Intel Core i5-7Y54
...
max:
Cinebench R10 - Cinebench R10 Rend. Multi (64bit)
AMD C-50
...
Intel Core i5-5200U
Intel Core i7-3517U
Intel Core i5-2540M
Intel Core i5-3230M
Intel Core i5-3210M
Intel Core i7-4600U
Intel Core i7-740QM
Intel Celeron N4100
Intel Core i7-4500U
Intel Core i7-3667U
Intel Core i3-5157U
Intel Core i7-2620M
Intel Core i5-5250U
Intel Core i7-4550U
Intel Core i7-4650U
Intel Core i5-4310U
Intel Core i7-840QM
...
max:
Intel Core Ultra 7 270K Plus
Cinebench R10 - Cinebench R10 Rend. Single (64bit)
AMD C-50
...
Intel Core i5-4210M
Intel Core i7-3630QM
Intel Core i7-4550U
Intel Core i7-10510U
Intel Core i5-5300U
Intel Core i7-3635QM
Intel Core i5-3360M
Intel Core i7-4600U
Intel Core i7-4702HQ
Intel Core i7-3920XM
Intel Core i7-3720QM
Intel Core i7-4702MQ
Intel Core i7-3520M
Intel Core i7-2960XM
Intel Core i7-4650U
...
max:
Intel Core Ultra 7 270K Plus
wPrime 2.10 - wPrime 2.0 1024m *
...
AMD A6-9225
Intel Celeron N2930
Intel Core i3-330M
AMD A4-7210
AMD Phenom II X2 N620
Intel Celeron N2940
AMD Phenom II X3 P840
Intel Pentium N3520
Intel Core i5-L16G7
Intel Core i5-2467M
Intel Core m5-6Y57
Intel Core 2 Duo T9600
AMD A8-5550M
AMD A8-7410
AMD A10-5757M
Intel Core i5-450M
...
VIA C3-M C3-M-1200
wPrime 2.10 - wPrime 2.0 32m *
...
Intel Core i5-2537M
Intel Core 2 Duo T9900
Intel Core i7-940XM
Intel Pentium 3825U
Intel Atom Z3775
AMD A9-9425
Intel Atom Z3770
Intel Core M-5Y51
Intel Core i3-2310M
Intel Core m5-6Y54
AMD A6-5200
AMD A10-4600M
AMD A6-3400M
AMD A8-5550M
AMD A6-9225
Intel Core i7-620LM
...
Transmeta Crusoe TM-5800
WinRAR - WinRAR 4.0
AMD Athlon Neo MV-40
...
Intel Core i3-2328M
Intel Core i3-3227U
Intel Core i5-4258U
AMD A10-5750M
Intel Core i3-5015U
Intel Core M-5Y51
Intel Core i5-7Y57
Intel Core m5-6Y54
Intel Core i3-5010U
Intel Core i3-2350M
Intel Core i5-4250U
Intel Core i7-4610Y
Intel Core i5-4310U
Intel Core i3-8130U
Intel Core i5-2540M
Intel Core i5-2430M
...
max:
7-Zip 18.03 - 7-Zip 18.03 Multi Thread 4 runs
AMD E1-2100
...
AMD A8-5550M
Intel Celeron N4100
Intel Celeron N4120
AMD A10-4600M
AMD Ryzen Embedded R1505G
Intel Core i5-5250U
Intel Core i3-6157U
Intel Pentium Silver N5030
Intel Celeron J4125
Intel Pentium Silver N5000
Qualcomm Snapdragon 7c
Intel Core i5-L16G7
AMD A10-5750M
...
AMD Ryzen 9 9955HX3D
max:
7-Zip 18.03 - 7-Zip 18.03 Single Thread 4 runs
AMD E1-2100
...
AMD A10-5750M
Intel Core i5-5250U
Intel Core i5-L16G7
Intel Core i5-4258U
AMD Ryzen 3 3300U
AMD Ryzen 3 3200U
AMD Ryzen Embedded V1605B
Intel Core i7-6560U
...
max:
AMD Ryzen 7 9850X3D
X264 HD Benchmark 4.0 - x264 Pass 2
AMD Athlon Neo MV-40
...
Intel Core i7-4550U
Intel Core i3-6100U
Intel Core i5-5200U
Intel Core i7-3520M
Intel Core i7-4500U
AMD A10-9620P
AMD A10-9600P
Intel Core i5-3210M
Intel Core i5-5250U
AMD PRO A12-9800B
Intel Core i5-5300U
Intel Core i7-4650U
...
X264 HD Benchmark 4.0 - x264 Pass 1
Intel Atom N2600
...
AMD A10-9620P
AMD PRO A12-9800B
AMD A10-5750M
Intel Core i5-4250U
Intel Core i5-2450M
Qualcomm Snapdragon 7c+ Gen 3
Intel Core i3-4000M
Intel Core i5-4210U
Intel Core i5-4300U
Intel Core i5-3437U
Intel Core i5-3427U
Intel Pentium Gold 4417U
AMD FX-7600P
Intel Core i7-3517U
Intel Core i7-8500Y
Intel Core i3-6100U
...
HWBOT x265 Benchmark v2.2 - HWBOT x265 4k Preset
AMD E1-2100
...
AMD A10-4600M
Intel Celeron N4120
Intel Pentium Silver N5000
Intel Celeron J4125
Intel Core i5-L16G7
Intel Pentium Silver J5005
AMD FX-7600P
AMD A10-5750M
Intel Core i7-6770HQ
Intel Core i3-5005U
...
AMD Ryzen 9 9955HX3D
max:
0 0.2 0.4 0.6 0.8 1 1.2 1.4 1.6 1.8 1.9 2.1 2.3 2.5 2.7 2.9 3.1 3.3 3.5 3.7 Tooltip Asus ExpertCenter PN42-BBN200MV: Ø1.66 (0.21-3.89)
TrueCrypt - TrueCrypt Serpent
Intel Pentium Gold 4415Y
...
Intel Core i7-8665U
AMD FX-8800P
Intel Core i7-3612QM
Intel Core i7-2760QM
AMD Ryzen 3 3300U
Intel Core i7-3632QM
Intel Core i7-2920XM
Intel Core i7-2860QM
Intel Core i7-4702MQ
Intel Core i7-3610QM
Intel Core i7-4750HQ
Intel Core i7-4712HQ
Intel Core i7-3615QM
...
AMD Ryzen 9 9955HX3D
max:
TrueCrypt - TrueCrypt Twofish
Intel Pentium Gold 4415Y
...
Intel Core i7-3610QM
AMD A4-1200
Intel Core i7-3615QM
Intel Core i7-3630QM
Intel Core i7-3720QM
Intel Core i7-4750HQ
Intel Core i7-4700MQ
Intel Core i7-4810MQ
Intel Core i7-4700HQ
Intel Core i7-3740QM
Intel Core i7-3920XM
AMD Ryzen 5 PRO 2500U
Intel Core i5-8300H
AMD Ryzen 5 3580U
...
max:
TrueCrypt - TrueCrypt AES
Intel Atom N2800
...
Intel Core i7-3615QM
Intel Core i7-2760QM
Intel Core i7-3610QM
Intel Core i7-3635QM
Intel Core i7-3630QM
Intel Core i7-3720QM
Intel Core i7-4702MQ
Intel Core i7-4712HQ
AMD Ryzen 5 PRO 2500U
Intel Core i5-8250U
Intel Core i7-3740QM
AMD Ryzen 5 3580U
Intel Core i7-3820QM
...
max:
Blender - Blender 3.3 Classroom CPU *
AMD Ryzen 9 9955HX3D
...
Intel Core i3-6157U
Intel Core i5-5250U
Intel Core i3-5010U
AMD FX-7600P
Intel Pentium Silver J5005
Intel Celeron J4125
Blender - Blender 2.79 BMW27 CPU *
Intel Core i5-1038NG7
...
Intel Core i3-1000NG4
Intel Core i3-10100Y
Intel Core i7-8500Y
Intel Core i5-L16G7
Intel Core i3-5005U
Qualcomm Snapdragon 7c+ Gen 3
Intel Pentium Silver J5005
Intel Celeron N4120
...
AMD E1-2100
R Benchmark 2.5 - R Benchmark 2.5 *
AMD Ryzen 9 9955HX3D
...
Intel Core i7-2860QM
Intel Core i5-4258U
Qualcomm Snapdragon 8cx Gen 3
Intel Core i5-5250U
AMD Ryzen Embedded R1505G
Intel Core i3-6157U
Intel Core i5-8260U
Intel Core i3-5010U
...
AMD E1-2100
3DMark 06 - CPU - 3DMark 06 - CPU
VIA C7-M C7-M-1200
...
Intel Core i7-920XM
Intel Core i3-7130U
Intel Core i3-6100H
Intel Core i5-4258U
Qualcomm Snapdragon 8cx Gen 3
Intel Core i5-6260U
Intel Pentium Silver N5030
Intel Core i7-5600U
Intel Core i7-2640M
Intel Core i7-5650U
Intel Core i5-3360M
Intel Core i5-4210M
Intel Core i7-940XM
...
max:
Super Pi mod 1.5 XS 1M - Super Pi mod 1.5 XS 1M *
...
AMD A9-9420
Intel Core i3-2310M
AMD PRO A12-9800B
AMD A10-9600P
Intel Core i3-4158U
Intel Pentium B950
Intel Pentium 2020M
Intel Core i5-3339Y
Intel Core 2 Extreme X7900
Intel Core 2 Duo T7800
AMD FX-8800P
Intel Core i5-4202Y
...
VIA C3-M C3-M-1200
Super Pi mod 1.5 XS 2M - Super Pi mod 1.5 XS 2M *
...
Intel Core i3-4158U
Intel Core i3-2310M
Intel Core i3-380M
Intel Core i3-5015U
Intel Core i3-370M
Intel Core i5-4202Y
Intel Pentium B950
Intel Core 2 Duo SP9600
Intel Core 2 Duo T9400
Intel Core 2 Duo P9500
Intel Core 2 Duo T9300
Intel Core i3-5005U
Intel Core 2 Duo T9500
AMD PRO A8-9600B
...
Intel Celeron Dual-Core T1400
Super Pi Mod 1.5 XS 32M - Super Pi mod 1.5 XS 32M *
...
Intel Core i5-4210Y
Intel Core M-5Y31
AMD PRO A8-9600B
Intel Pentium 3825U
Intel Celeron B810
AMD Pro A8-8600B
Intel Core 2 Duo T9800
Intel Core i3-5010U
Intel Core 2 Duo P9700
Intel Pentium 2127U
Intel Core 2 Duo P8800
Intel Core 2 Duo T9600
Intel Core i3-3120M
Intel Core i3-350M
...
VIA C3-M C3-M-1200
3DMark Vantage - 3DM Vant. Perf. CPU no Physx
Intel Atom N450
...
Intel Core i7-3667U
Intel Core i5-2520M
Intel Core i7-4600U
Intel Core i5-5200U
Intel Core i5-2450M
Intel Core i5-3210M
Intel Core i5-4310U
Intel Core i5-2430M
Intel Core i5-5250U
Intel Core i5-5300U
Intel Core i5-2540M
Intel Core i5-3230M
AMD Ryzen 3 2200U
Intel Core i7-3537U
AMD FX-8800P
Intel Core i5-3320M
...
max:
Intel Core Ultra 7 270K Plus
3DMark 11 - 3DM11 Performance Physics
AMD E-240
...
Intel Core i3-4158U
Intel Core i5-480M
Intel Core m5-6Y57
Intel Core m3-7Y32
AMD A12-9720P
AMD FX-8800P
Intel Core i3-5005U
Intel Core i3-2330M
Intel Core i5-3317U
Intel Core i5-2537M
Intel Core i7-4610Y
Intel Core i3-2350M
Intel Core i3-3110M
Intel Pentium Silver J5005
...
AMD Ryzen 9 9955HX3D
max:
AMD Ryzen 9 9950X3D
3DMark - 3DMark Ice Storm Physics
Intel Atom x7-Z8700
...
Intel Core i5-7Y54
Intel Core i3-5015U
Intel Core i5-3320M
Intel Core i5-430M
Intel Core i5-1038NG7
Intel Core i5-4310U
Intel Core i5-3437U
Intel Core i7-2637M
Intel Core i5-3210M
Intel Core i3-4000M
Intel Core i7-4650U
Intel Pentium Gold 4417U
Intel Core i7-4600U
Intel Core i7-2630QM
...
max:
3DMark - 3DMark Ice Storm Extreme Physics
AMD A6-9220e
...
AMD FX-7600P
Intel Core i5-4200U
Intel Core i5-1038NG7
Intel Core i5-3337U
Intel Pentium Gold 4417U
Qualcomm Snapdragon 7c+ Gen 3
Intel Core i5-4260U
Intel Core i3-5010U
AMD Ryzen Embedded R1505G
Intel Core i7-11390H
Intel Core i7-8500Y
Intel Core i5-5200U
...
max:
3DMark - 3DMark Ice Storm Unlimited Physics
AMD A6-9220e
...
Intel Pentium Silver N5000
Intel Core i5-7Y54
Intel Core i5-L16G7
Intel Core i7-4500U
Intel Core i5-6198DU
Intel Core M-5Y70
AMD 3015Ce
Intel Core i5-5200U
Intel Core i3-7130U
Intel Core i5-4258U
AMD Ryzen 5 3500U
Intel Core i5-1230U
...
max:
Intel Core Ultra 5 250K Plus
3DMark - 3DMark Cloud Gate Physics
Intel Atom x7-Z8700
...
Intel Core i5-2540M
AMD FX-8800P
Intel Core i5-3320M
Intel Core i7-3517U
Intel Core i7-8500Y
Intel Core i5-3210M
Intel Core i5-L16G7
AMD Ryzen Embedded R1505G
Intel Core i5-5200U
Intel Core i7-2640M
Intel Core i5-5250U
Intel Core i5-4258U
...
max:
Intel Core Ultra 7 270K Plus
3DMark - 3DMark Fire Strike Standard Physics
AMD A6-9220e
...
Intel Core i5-3210M
Intel Core i7-8500Y
Intel Core i5-3320M
AMD Ryzen Embedded R1505G
Intel Core i5-4258U
Intel Core i5-5200U
AMD FX-8800P
Intel Core i5-5250U
Intel Core i5-7Y57
Intel Core i7-4600U
Intel Core i5-6198DU
Intel Core i5-L16G7
...
max:
Intel Core Ultra 7 270K Plus
3DMark - 3DMark Time Spy CPU
AMD PRO A12-9800B
...
Intel Pentium Silver J5005
Intel Core i5-L16G7
Intel Core i5-5250U
Intel Core i3-5010U
Intel Core i5-8210Y
Intel Core i5-7Y54
AMD FX-7600P
Intel Core i7-8500Y
AMD Ryzen 3 2200U
Intel Pentium Gold 4417U
...
max:
Intel Core Ultra 7 270K Plus
Geekbench 6.7 - Geekbench 6.7.1 Single-Core
Intel Celeron N4120
...
Intel Core i5-L16G7
Intel Pentium Gold 6500Y
Qualcomm Snapdragon 7c+ Gen 3
AMD Athlon PRO 300U
Intel Core m3-7Y32
AMD Ryzen 3 2200U
AMD Ryzen 3 PRO 2200U
Qualcomm Snapdragon 8cx
AMD Ryzen 7 3700U
...
Apple M5 Pro 15-Core
Geekbench 6.7 - Geekbench 6.7.1 Multi-Core
AMD A4-9120C
...
Intel Celeron N5095A
Intel Celeron 7305
Intel Pentium Gold 6500Y
Intel Core m3-7Y32
AMD Athlon PRO 300U
AMD Ryzen 3 3200U
AMD Ryzen 3 2200U
AMD Ryzen 3 PRO 2200U
...
Apple M5 Max
Geekbench 6.0 - Geekbench 6.0 Single-Core
Intel Celeron N2820
Intel Atom x7-Z8750
Intel Celeron N4100
Intel Pentium Gold 4425Y
Intel Core i3-5010U
Intel Core i7-8850H
Intel Core i7-6567U
Intel Core i5-8400H
...
max:
Intel Core Ultra 7 270K Plus
Geekbench 6.0 - Geekbench 6.0 Multi-Core
Intel Celeron N2820
Intel Atom x7-Z8750
Intel Pentium Gold 4425Y
Intel Celeron N4100
Intel Core i3-5010U
Intel Core i7-6567U
Intel Core i7-8850H
...
max:
Geekbench 5.5 - Geekbench 5.1 - 5.5 64 Bit Single-Core
AMD E1-2100
...
Intel Core i3-8109U
AMD Ryzen 5 3550H
Intel Core i5-7287U
AMD Ryzen 5 3580U
Intel Core i5-8200Y
Intel Core i5-8250U
Intel Core i5-7260U
Intel Core i5-12450HX
AMD Ryzen 7 3780U
Intel Core i5-8257U
Intel Xeon E3-1575M v5
Intel Core i5-8259U
Intel Core i7-6567U
...
Apple M5 10-Core
Geekbench 5.5 - Geekbench 5.1 - 5.5 64 Bit Multi-Core
AMD E1-2100
...
Intel Core i5-5250U
AMD FX-7600P
Intel Core i3-6157U
Intel Celeron N4120
Intel Core m3-7Y32
Intel Pentium Silver N5000
Intel Core i5-4258U
Intel Pentium Gold 6500Y
Intel Core i3-10110Y
Intel Core i5-L16G7
Intel Pentium Silver J5005
...
max:
Geekbench 5.0 - Geekbench 5.0 64 Bit Single-Core
AMD E1-2100
...
AMD Ryzen 3 3300U
AMD Ryzen Embedded V1605B
Intel Core i7-8500Y
AMD Ryzen 5 3500U
AMD Ryzen 5 3550H
AMD Ryzen 7 3780U
AMD Ryzen 7 3750H
Intel Core i7-5750HQ
Intel Core i5-8250U
Intel Core i5-8259U
Intel Core i5-8257U
...
AMD Ryzen 9 9955HX3D
max:
AMD Ryzen 7 9850X3D
Geekbench 5.0 - Geekbench 5.0 64 Bit Multi-Core
AMD E1-2100
...
AMD Ryzen Embedded R1505G
Intel Celeron J4125
Intel Core i5-8210Y
Intel Core i5-8260U
Intel Celeron N4120
Intel Core i7-8500Y
Intel Core i3-6157U
AMD Ryzen 3 3200U
...
AMD Ryzen 9 9955HX3D
max:
AMD Ryzen Threadripper PRO 3995WX
Geekbench 4.4 - Geekbench 4.1 - 4.4 64 Bit Single-Core
AMD E1-2100
...
Intel Core i7-8709G
AMD Ryzen 5 PRO 4650U
Intel Core i5-7287U
Intel Core i3-8109U
Intel Core i5-8200Y
Intel Core i5-8257U
Intel Core i7-10710U
Intel Core i5-10210U
...
AMD Ryzen 9 9955HX3D
max:
Samsung Exynos 2600
Geekbench 4.4 - Geekbench 4.1 - 4.4 64 Bit Multi-Core
AMD E1-2100
...
Intel Core i3-1000NG4
Intel Core i3-1005G1
Intel Core i7-7660U
AMD Ryzen 5 PRO 2500U
Intel Core i7-2675QM
Intel Core i3-1115G4
AMD Ryzen 7 3700U
AMD Ryzen 5 PRO 3500U
AMD Ryzen 3 3300U
...
AMD Ryzen 9 9955HX3D
max:
Intel Core Ultra 7 270K Plus
Mozilla Kraken 1.1 - Kraken 1.1 Total Score *
Apple M5 Pro 18-Core
...
Microsoft SQ1
AMD 3015Ce
Intel Core i3-8130U
Qualcomm Snapdragon 8cx
AMD Ryzen 5 PRO 2500U
Intel Core i7-8500Y
Intel Core i3-7100U
Intel Core i5-4210M
AMD Ryzen Embedded R1505G
...
AMD A4-1250
max:
Apple S7
WebXPRT 3 - WebXPRT 3 Score
AMD E1-2100
...
AMD Ryzen 5 3550H
Intel Core i3-1000NG4
Intel Core i5-8250U
Intel Core i5-8259U
Intel Core i5-1035G4
Intel Core i3-1005G1
Intel Core i5-1038NG7
Intel Core i5-1035G1
...
Apple M5 Pro 18-Core
CrossMark - CrossMark Overall
Intel Pentium B970
...
Intel Core i3-6157U
AMD Ryzen Embedded R1606G
Intel Core i5-4300M
Qualcomm Snapdragon 8cx Gen 3
...
Apple M5 Max
Power Consumption - Prime95 Power Consumption - external Monitor *
Qualcomm Snapdragon 7c Gen 2
...
Intel Celeron N4100
Intel Celeron N4020
Intel Celeron J4125
Intel Atom x7-E3950
Intel Celeron N4120
AMD E1-2100
AMD Ryzen 3 3200U
...
AMD Ryzen 9 9955HX3D
max:
AMD Ryzen Threadripper PRO 3975WX
0 5 10 15 20 25 30 Tooltip Asus ExpertCenter PN42-BBN200MV: Ø14.1 (12.1-30.2)
Power Consumption - Cinebench R15 Multi Power Consumption - external Monitor *
...
Intel Atom x7-E3950
Intel Celeron N4020
Intel Celeron J4125
AMD E1-2100
Intel Core i3-5005U
Intel Core i3-5010U
AMD Ryzen 3 3200U
...
AMD Ryzen 9 9955HX3D
max:
0 5 10 15 20 25 Tooltip Asus ExpertCenter PN42-BBN200MV: Ø13.6 (11.7-28.8)
Power Consumption - Idle Power Consumption - external Monitor *
...
Intel Core Ultra 5 115U
Intel Core i5-8260U
AMD Ryzen 5 PRO 5675U
...
max:
0 1 2 3 4 5 6 7 8 9 Tooltip Asus ExpertCenter PN42-BBN200MV: Ø6.07 (5.03-9.79)
Power Consumption - Power Efficiency - Cinebench R15 Multi external Monitor
16.1 Points per Watt (12%)
AMD E1-2100
...
Intel Core i5-1035G4
Intel Core i7-10510U
...
- A keresett grafikus kártyához tartozó benchmark értékek skálája
- A keresett grafikus kártyához tartozó átlagos benchmark értékek
* A kisebb számok nagyobb teljesítményt jelentenek.
log 03. 01:00:12
#0 ran 0s before starting gpusingle class +0s ... 0s
#1 no ids found in url (should be separated by "_") +0s ... 0s
#2 not redirecting to Ajax server +0s ... 0s
#3 did not recreate cache, as it is less than 5 days old! Created at Wed, 01 Jul 2026 05:28:54 +0200 +0.006s ... 0.006s
#4 no comparison url found in template nbc.compare_page_2 needed +0.024s ... 0.03s
#5 no comparison url found in template nbc.compare_page_2 needed +0s ... 0.03s
#6 no comparison url found in template nbc.compare_page_2 needed +0s ... 0.031s
#7 no comparison url found in template nbc.compare_page_2 needed +0s ... 0.031s
#8 no comparison url found in template nbc.compare_page_2 needed +0s ... 0.031s
#9 no comparison url found in template nbc.compare_page_2 needed +0s ... 0.032s
#10 composed specs +0.001s ... 0.032s
#11 did output specs +0s ... 0.032s
#12 getting avg benchmarks for device 14930 +0.029s ... 0.061s
#13 got single benchmarks 14930 +0.01s ... 0.071s
#14 got avg benchmarks for devices +0s ... 0.071s
#15 min, max, avg, median took s +3.229s ... 3.3s
#16 no comparison url found in template nbc.compare_page_2 needed +0.539s ... 3.839s
#17 return log +0s ... 3.839s