Tesztek a következőre Intel Core m3-6Y30 processzor
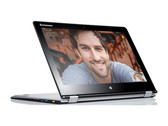
Lenovo Yoga 700-11ISK Convertible rövid értékelés
Gyenge hűtés. A kis Lenovo Yoga 700 egy hordozható és nagyon sokoldalú társ, hála 11.6 inches kijelzőjének, és több működési módjának. Ugyanakkor a beviteli eszközökkel és a passzív hűtési megoldással is vannak gondok, mivel a processzor nem képes teljes potenciálját hasznosítani.
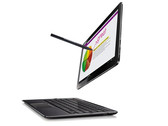
Intel Core m3-6Y30, HD Graphics 515, 11.6", 1.1 kgAsus Transformer Book T302CA-FL010T Convertible rövid értékelés
Akadályverseny. Az Asus ellátta a 12.5 inches Transformer Bookját Intel Skylake generációjával, és egy második akkumulátort is beépített a billentyűzet dokkolójába. Ez kitartóbbá teszi az új Transformer Bookot. Ennek ellenére az újonnan szerzett erő sajnos nem kihasználható.
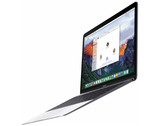
Intel Core m3-6Y30, HD Graphics 515, 12.5", 1.5 kgApple MacBook 12 (kora 2016) 1.1 GHz rövid értékelés
Úttörő. Az Apple termék skálájának egyik legvitatottabb tagja frissítést kapott a gyártótól; a MacBook 12 mellőz minden nélkülözhető funkciót és minden erejével a hordozhatóságra koncentrál. Ventilátor, portok garmadája, mechanikus érintőpárna hosszú billentyű út: „ezekre nincs szükséged”.
Intel Core m3-6Y30, HD Graphics 515, 12", 927 gAlldocube KBook: Intel HD Graphics 515, 13.50", 1.5 kg
Külsős Teszt » Alldocube KBook
Chuwi AeroBook 13 inch 2019: Intel HD Graphics 515, 13.30", 1.2 kg
Külsős Teszt » Chuwi AeroBook 13 inch 2019
Asus Chromebook Flip C302CA-GU010: Intel HD Graphics 515, 12.50", 1.2 kg
Külsős Teszt » Asus Chromebook Flip C302CA-GU010
HP Spectre x2 12-a001na: Intel HD Graphics 515, 12.10", 1.2 kg
Külsős Teszt » HP Spectre x2 12-a001na
Asus Chromebook C302CA-GU001: Intel HD Graphics 515, 12.50", 1.2 kg
Külsős Teszt » Asus Chromebook C302CA-GU001
Asus Chromebook Flip C302CA-GU009: Intel HD Graphics 515, 12.50", 1.2 kg
Külsős Teszt » Asus Chromebook Flip C302CA-GU009
HP Chromebook 13 G1, Core m3: Intel HD Graphics 515, 13.30", 1.2 kg
Külsős Teszt » HP Chromebook 13 G1, Core m3
Kogan Atlas UltraSlim Pro-KALAP13SPZA: Intel HD Graphics 515, 13.30", 1.4 kg
Külsős Teszt » Kogan Atlas UltraSlim Pro-KALAP13SPZA
Asus ZenBook Flip UX360CA-DBM2T: Intel HD Graphics 515, 13.30", 1.4 kg
Külsős Teszt » Asus ZenBook Flip UX360CA-DBM2T
Samsung Chromebook Pro XE510C24-K01US: Intel HD Graphics 515, 12.30", 1.1 kg
Külsős Teszt » Samsung Chromebook Pro XE510C24-K01US
HP Pavilion x2 12-b101ns: Intel HD Graphics 515, 12.00", 1.5 kg
Külsős Teszt » HP Pavilion x2 12-b101ns
Asus Chromebook Flip C302CA-DHM4: Intel HD Graphics 515, 12.50", 1.2 kg
Külsős Teszt » Asus Chromebook Flip C302CA-DHM4
Asus Zenbook Flip UX360CA-C4072T: Intel HD Graphics 515, 13.30", 1.3 kg
Külsős Teszt » Asus Zenbook Flip UX360CA-C4072T
Asus UX360CA-C4089T: Intel HD Graphics 515, 13.30", 1.3 kg
Külsős Teszt » Asus UX360CA-C4089T
Cube i9: Intel HD Graphics 515, 12.20", 1 kg
Külsős Teszt » Cube i9
Samsung Galaxy Tab PRO S W708N LTE 128GB: Intel HD Graphics 515, 12.10", 0.7 kg
Külsős Teszt » Samsung Galaxy Tab PRO S W708N LTE 128GB
Asus Zenbook UX360CA-C4044T: Intel HD Graphics 515, 13.30", 1.3 kg
Külsős Teszt » Asus Zenbook UX360CA-C4044T
Asus ZenBook UX360CA-C4017T: Intel HD Graphics 515, 13.30", 1.3 kg
Külsős Teszt » Asus ZenBook UX360CA-C4017T
Samsung Galaxy Tab Pro S W703: Intel HD Graphics 515, 12.10", 0.7 kg
Külsős Teszt » Samsung Galaxy Tab Pro S W703
HP Pavilion x2 12-b030ng: Intel HD Graphics 515, 12.00", 1.5 kg
Külsős Teszt » HP Pavilion x2 12-b030ng
Xiaomi Mi Notebook Air 12.5 2016: Intel HD Graphics 515, 12.50", 1.1 kg
Külsős Teszt » Xiaomi Mi Air 12 inch 2016
Lenovo Yoga 710-11-80TX000CUS: Intel HD Graphics 515, 11.60", 1 kg
Külsős Teszt » Lenovo Yoga 710-11-80TX000CUS
HP Elite x2 1012 G1-L5H17EA: Intel HD Graphics 515, 12.00", 0.8 kg
Külsős Teszt » HP Elite x2 1012 G1-L5H17EA
Acer Aspire Switch 12S SW7-272-M3A0: Intel HD Graphics 515, 12.50", 1.4 kg
Külsős Teszt » Acer Aspire Switch 12S SW7-272-M3A0
Dell Inspiron 11-3169: Intel HD Graphics 515, 11.60", 1.3 kg
Külsős Teszt » Dell Inspiron 11-3169
Asus UX305CA-DQ150T: Intel HD Graphics 515, 13.30", 1.2 kg
Külsős Teszt » Asus UX305CA-DQ150T
Asus UX360CA-C4019T: Intel HD Graphics 515, 13.30", 1.3 kg
Külsős Teszt » Asus UX360CA-C4019T
Asus UX305CA-FC022T: Intel HD Graphics 515, 13.30", 1.2 kg
Külsős Teszt » Asus UX305CA-FC022T
Apple MacBook 12 (Early 2016) 1.1 GHz: Intel HD Graphics 515, 12.00", 0.9 kg
Külsős Teszt » Apple MacBook 12 (Early 2016) 1.1 GHz
Huawei MateBook: Intel HD Graphics 515, 12.00", 0.6 kg
Külsős Teszt » Huawei MateBook
HP Spectre x2 12-a005nd: Intel HD Graphics 515, 12.00", 1.2 kg
Külsős Teszt » HP Spectre x2 12-a005nd
HP Spectre X2 12-a000nf: Intel HD Graphics 515, 12.00", 1.2 kg
Külsős Teszt » HP Spectre X2 12-a000nf
Samsung Galaxy Tab Pro S W700N: Intel HD Graphics 515, 12.10", 0.7 kg
Külsős Teszt » Samsung Galaxy Tab Pro S W700N
Lenovo Yoga 700-11ISK: Intel HD Graphics 515, 11.60", 1.1 kg
Külsős Teszt » Lenovo Yoga 700-11ISK
Asus UX305CA-FC037T: Intel HD Graphics 515, 13.30", 1.2 kg
Külsős Teszt » Asus UX305CA-FC037T
Microsoft Surface Pro 4, Core m3: Intel HD Graphics 515, 12.30", 1.1 kg
Külsős Teszt » Microsoft Surface Pro 4, Core m3