Tesztek a következőre Intel Core i9-14900HX processzor
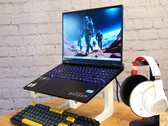
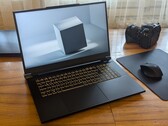
Acer Predator Helios 16 (PH16-72) játék laptop felülvizsgálata: Egy ragadozó éles fogakkal és csendes mancsokkal
A csúcskategóriás hardver, a ragyogó mini LED kijelző és a hatékony hűtés teszi az Acer Predator Helios 16-ot egy igazi játék álommá. A valóságban a predátor a játék laptopok között valójában csendes. Mindazonáltal felülvizsgálatunkból kiderül, hogy a laptop számos előnye némi kompromisszummal jár együtt.
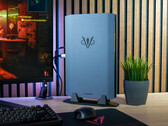
Intel Core i9-14900HX, NVIDIA GeForce RTX 4080 Laptop GPU, 16", 2.7 kgMinisforum AtomMan G7 Ti felülvizsgálat: Képernyő nélküli játéklaptop az asztali PC helytakarékos alternatívájaként
A Minisforum AtomMan G7 Ti asztali teljesítményt ígér kompakt formátumban. A nagy teljesítményű Intel Core i9-14900HX processzorral és az Nvidia GeForce RTX 4070 laptop GPU-val felszerelt laptop a játékosokat, kreatív alkotókat és szakembereket célozza meg, akiknek minimális helyen maximális teljesítményre van szükségük. Ebben a tesztben alaposan megvizsgáljuk a mini PC-t, és ellenőrizzük, hogy megfelel-e a magas elvárásoknak.
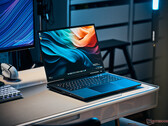
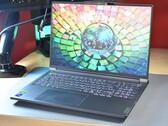
Intel Core i9-14900HX, NVIDIA GeForce RTX 4070 Laptop GPU, 2.6 kgXMG Neo 17 E24 felülvizsgálat - Gyors játék laptop opcionális vízhűtéssel
Az XMG Neo 17-gyel egy telivér gamer gépet kapsz, amelyet a piac leggyorsabb komponenseivel szerelhetsz fel. Opcióként mechanikus Cherry billentyűzet és külső vízhűtés is elérhető, ami nemcsak a hőmérsékletet, hanem a háttérzajt is csökkenti.
Intel Core i9-14900HX, NVIDIA GeForce RTX 4080 Laptop GPU, 17", 2.9 kgSCHENKER Key 17 Pro (M24) felülvizsgálat - ultragyors kettős Thunderbolt 5 csatlakozó és i9-14900HX teljesítmény
A Schenker KEY 17 Pro az első olyan csúcskategóriás, asztali számítógépet helyettesítő mobil munkaállomások közé tartozik, amelyek kettős Thunderbolt 5 porttal rendelkeznek. Csúcskategóriás komponenseket integrál, köztük egy frissített Intel i9-14900HX processzort, amelyet az Nvidia RTX 4090 egészít ki, valamint a leggyorsabb Wi-Fi 7 csatlakozási lehetőséget.
Intel Core i9-14900HX, NVIDIA GeForce RTX 4090 Laptop GPU, 17.3", 3.4 kgLenovo ThinkBook 16p Gen 5 laptop felülvizsgálat: A rejtett Lenovo Legion az alkotók számára
A Lenovo ThinkBook 16p Gen 5 IRX a ThinkBook SMB laptop sorozat legerősebb modellje. Széles színskálájú kijelzővel, a laptopok legerősebb i9-esével és az Nvidia GeForce RTX 4060 processzorral a kreatív és multimédiás piacot célozza meg. De nem csak az alkotók találhatják vonzónak - a ThinkBook játékra is alkalmas.
Intel Core i9-14900HX, NVIDIA GeForce RTX 4060 Laptop GPU, 16", 2.2 kgMSI Raider 18 HX A14V: NVIDIA GeForce RTX 4080 Laptop GPU, 18.00", 3.6 kg
Teszt » MSI Raider 18 HX A14V felülvizsgálat: Titan teljesítmény Titan ár nélkül
Nubia RedMagic Titan 16 Pro: NVIDIA GeForce RTX 4060 Laptop GPU, 16.00", 2.4 kg
Teszt » RedMagic Titan 16 Pro felülvizsgálat: Egy okostelefon-gyártó által készített játék laptop
HP ZBook Fury 16 G11: NVIDIA RTX 3500 Ada Generation Laptop, 16.00", 2.6 kg
Teszt » Nvidia RTX 3500 Ada teljesítmény debütálása: HP ZBook Fury 16 G11 munkaállomás felülvizsgálata
Schenker XMG Pro 16 Studio (Mid 24): NVIDIA GeForce RTX 4070 Laptop GPU, 16.00", 2.3 kg
Teszt » XMG Pro 16 Studio (Mid 24) felülvizsgálat: Core i9 és RTX 4070 játékosoknak és alkotóknak
Lenovo Legion 9 16IRX9, RTX 4090: NVIDIA GeForce RTX 4090 Laptop GPU, 16.00", 2.5 kg
Teszt » Lenovo Legion 9 16IRX9 (Legion 9i) felülvizsgálat: Mennyire csúcskategóriás az RTX 4090 gamer?
Schenker XMG Neo 16 (Early 24): NVIDIA GeForce RTX 4090 Laptop GPU, 16.00", 2.5 kg
Teszt » XMG Neo 16 (Early 24) felülvizsgálat: Teljes RTX 4090 teljesítmény egy kompakt játék laptopban
Razer Blade 18 2024 RZ09-0509: NVIDIA GeForce RTX 4090 Laptop GPU, 18.00", 3.1 kg
Teszt » Razer Blade 18 2024 felülvizsgálat: Az első laptop a piacon mini-LED és Thunderbolt 5 technológiával is
Schenker XMG Fusion 15 (Early 24): NVIDIA GeForce RTX 4070 Laptop GPU, 15.30", 2.1 kg
Teszt » XMG Fusion 15 (Early 24) felülvizsgálat: Kompakt RTX 4070 laptop játékosoknak és alkotóknak
HP Omen 16-am0000ng: NVIDIA GeForce RTX 5060 Laptop, 16.00", 2.4 kg
Külsős Teszt » HP Omen 16-am0000ng
MSI Katana 15 HX B14WGK: NVIDIA GeForce RTX 5070 Laptop, 15.60", 2.4 kg
Külsős Teszt » MSI Katana 15 HX B14WGK
Lenovo Legion 5 15IRX10: NVIDIA GeForce RTX 5070 Laptop, 15.10", 1.9 kg
Külsős Teszt » Lenovo Legion 5 15IRX10
Acer Predator Helios 16 PH16-72, RTX 4070: NVIDIA GeForce RTX 4070, 16.00", 2.7 kg
Külsős Teszt » Acer Predator Helios 16 PH16-72, RTX 4070
Origin PC EON17-X 2024: NVIDIA GeForce RTX 4090 Laptop GPU, 17.30", 3.4 kg
Külsős Teszt » Origin PC EON17-X 2024
Asus ROG Strix G18 G814JZR: NVIDIA GeForce RTX 4080 Laptop GPU, 18.00", 3 kg
Külsős Teszt » Asus ROG Strix G18 G814JZR
Lenovo Legion 5 16IRX9, i9-14900HX: NVIDIA GeForce RTX 4060 Laptop GPU, 16.00", 2.3 kg
Külsős Teszt » Lenovo Legion 5 16IRX9, i9-14900HX
MSI Raider GE78 HX 14VIG: NVIDIA GeForce RTX 4090 Laptop GPU, 17.00", 3.1 kg
Külsős Teszt » MSI Raider GE78 HX 14VIG
Origin PC Eon16-X: NVIDIA GeForce RTX 4090 Laptop GPU, 16.00", 2.5 kg
Külsős Teszt » Origin PC Eon16-X
HP ZBook Fury 16 G11: NVIDIA RTX 3500 Ada Generation Laptop, 16.00", 2.6 kg
Külsős Teszt » HP ZBook Fury 16 G11
Lenovo ThinkBook 16p G5 IRX 21N50011GE: NVIDIA GeForce RTX 4060 Laptop GPU, 16.00", 2.2 kg
Külsős Teszt » Lenovo ThinkBook 16p G5 IRX 21N50011GE
HP Omen 16-wf1: NVIDIA GeForce RTX 4060 Laptop GPU, 16.10", 2.4 kg
Külsős Teszt » HP Omen 16-wf1
Aorus 17X AXG: NVIDIA GeForce RTX 4080 Laptop GPU, 17.30", 2.8 kg
Külsős Teszt » Aorus 17X AXG
Nubia RedMagic Titan 16 Pro: NVIDIA GeForce RTX 4060 Laptop GPU, 16.00", 2.4 kg
Külsős Teszt » Nubia RedMagic Titan 16 Pro
MSI Creator M16 HX C14VGG: NVIDIA GeForce RTX 4070 Laptop GPU, 16.00", 2.4 kg
Külsős Teszt » MSI Creator M16 HX C14VGG
MSI Raider 18 HX A14V: NVIDIA GeForce RTX 4080 Laptop GPU, 18.00", 3.6 kg
Külsős Teszt » MSI Raider 18 HX A14V
Lenovo Legion Pro 7 16IRX9H, RTX 4090: NVIDIA GeForce RTX 4090 Laptop GPU, 16.00", 2.6 kg
Külsős Teszt » Lenovo Legion Pro 7 16IRX9H, RTX 4090
Schenker XMG Neo 16 (Early 24): NVIDIA GeForce RTX 4090 Laptop GPU, 16.00", 2.5 kg
Külsős Teszt » SCHENKER XMG Neo 16 (Early 24)
Schenker XMG Fusion 15 (Early 24): NVIDIA GeForce RTX 4070 Laptop GPU, 15.30", 2.1 kg
Külsős Teszt » SCHENKER XMG Fusion 15 (Early 24)
Medion Erazer Beast X40 2024, RTX 4070: NVIDIA GeForce RTX 4070 Laptop GPU, 17.00", 2.9 kg
Külsős Teszt » Medion Erazer Beast X40 2024, RTX 4070
Acer Predator Helios 18 PH18-72: NVIDIA GeForce RTX 4080 Laptop GPU, 18.00", 3.3 kg
Külsős Teszt » Acer Predator Helios 18 PH18-72
Lenovo Legion Pro 5 16IRX9, i9-14900HX RTX 4060: NVIDIA GeForce RTX 4060 Laptop GPU, 16.00", 2.5 kg
Külsős Teszt » Lenovo Legion Pro 5 16IRX9, i9-14900HX RTX 4060
MSI Vector 16 HX A14V: NVIDIA GeForce RTX 4080 Laptop GPU, 16.00", 2.7 kg
Külsős Teszt » MSI Vector 16 HX A14V
MSI Sword 16 HX B14VFKG, i9-14900HX: NVIDIA GeForce RTX 4060 Laptop GPU, 16.00", 2.3 kg
Külsős Teszt » MSI Sword 16 HX B14VFKG, i9-14900HX
Asus ROG Strix G16 G614JZR: NVIDIA GeForce RTX 4070 Laptop GPU, 16.00", 2.8 kg
Külsős Teszt » Asus ROG Strix G16 G614JZR
Asus ROG Strix G18 G814JIR: NVIDIA GeForce RTX 4070 Laptop GPU, 18.00", 3 kg
Külsős Teszt » Asus ROG Strix G18 G814JIR
Acer Predator Helios Neo 16 PHN16-72, RTX 4060: NVIDIA GeForce RTX 4060 Laptop GPU, 16.00", 2.5 kg
Külsős Teszt » Acer Predator Helios Neo 16 PHN16-72, RTX 4060
Asus ROG Strix G16 G614JIR: NVIDIA GeForce RTX 4070 Laptop GPU, 16.00", 2.8 kg
Külsős Teszt » Asus ROG Strix G16 G614JIR
Acer Predator Helios 16 PH16-72: NVIDIA GeForce RTX 4080 Laptop GPU, 16.00", 2.7 kg
Külsős Teszt » Acer Predator Helios 16 PH16-72
Lenovo Legion 7 16IRX9, i9-14900HX: NVIDIA GeForce RTX 4070 Laptop GPU, 16.00", 2.2 kg
Külsős Teszt » Lenovo Legion 7 16IRX9, i9-14900HX
MSI Raider GE78 HX 14VHG: NVIDIA GeForce RTX 4080 Laptop GPU, 17.30", 3.1 kg
Külsős Teszt » MSI Raider GE78 HX 14VHG
Razer Blade 18 2024 RZ09-0509: NVIDIA GeForce RTX 4090 Laptop GPU, 18.00", 3.1 kg
Külsős Teszt » Razer Blade 18 2024 RZ09-0509
MSI Raider GE68 HX 14VHG: NVIDIA GeForce RTX 4080 Laptop GPU, 17.30", 3.1 kg
Külsős Teszt » MSI Raider GE68 HX 14VHG
Aorus 17X AZG: NVIDIA GeForce RTX 4090 Laptop GPU, 17.30", 2.8 kg
Külsős Teszt » Aorus 17X AZG
MSI Raider GE68 HX 14VIG: NVIDIA GeForce RTX 4090 Laptop GPU, 16.00", 2.8 kg
Külsős Teszt » MSI Raider GE68 HX 14VIG
Asus ROG Strix Scar 16 G634JYR, RTX 4080: NVIDIA GeForce RTX 4080 Laptop GPU, 16.00", 2.7 kg
Külsős Teszt » Asus ROG Strix Scar 16 G634JYR, RTX 4080
HP Omen 16 (2024): NVIDIA GeForce RTX 4080 Laptop GPU, 16.10", 2.4 kg
Külsős Teszt » HP Omen 16 (2024)
Lenovo Legion 9 16IRX9: NVIDIA GeForce RTX 4090 Laptop GPU, 16.00", 2.6 kg
Külsős Teszt » Lenovo Legion 9 16IRX9
HP Omen Transcend 16-u1095ng: NVIDIA GeForce RTX 4070 Laptop GPU, 16.00", 2.3 kg
Külsős Teszt » HP Omen Transcend 16-u1095ng
MSI Vector 17 HX A14VGG: NVIDIA GeForce RTX 4070 Laptop GPU, 17.30", 3 kg
Külsős Teszt » MSI Vector 17 HX A14VGG
Xiaomi Redmi G Pro 2024: NVIDIA GeForce RTX 4060 Laptop GPU, 16.00", 2.7 kg
Külsős Teszt » Xiaomi Redmi G Pro 2024
Lenovo Legion Pro 7 16IRX9H: NVIDIA GeForce RTX 4080 Laptop GPU, 16.00", 2.7 kg
Külsős Teszt » Lenovo Legion Pro 7 16IRX9H
Aorus 16X 2024: NVIDIA GeForce RTX 4070 Laptop GPU, 16.00", 2.3 kg
Külsős Teszt » Aorus 16X 2024
Lenovo Legion Pro 5 16IRX9: NVIDIA GeForce RTX 4070 Laptop GPU, 16.00", 2.5 kg
Külsős Teszt » Lenovo Legion Pro 5 16IRX9
Alienware m18 R2: NVIDIA GeForce RTX 4090 Laptop GPU, 18.00", 4 kg
Külsős Teszt » Alienware m18 R2
Acer Predator Helios Neo 16 PHN16-72, i9-14900HX: NVIDIA GeForce RTX 4070, 18.00", 3.4 kg
Külsős Teszt » Acer Predator Helios Neo 16 PHN16-72, i9-14900HX
Asus ROG Strix Scar 16 G634JYR: NVIDIA GeForce RTX 4090 Laptop GPU, 16.00", 2.7 kg
Külsős Teszt » Asus ROG Strix Scar 16 G634JYR
Razer Blade 16 2024, RTX 4090: NVIDIA GeForce RTX 4090 Laptop GPU, 16.00", 2.5 kg
Külsős Teszt » Razer Blade 16 2024, RTX 4090
Acer Predator Helios Neo 18 PHN18-71: NVIDIA GeForce RTX 4070 Laptop GPU, 18.00", 3.4 kg
Külsős Teszt » Acer Predator Helios Neo 18 PHN18-71
Asus ROG Strix Scar 18 G834JYR (2024): NVIDIA GeForce RTX 4090 Laptop GPU, 18.00", 3.1 kg
Külsős Teszt » Asus ROG Strix Scar 18 G834JYR (2024)
MSI Titan 18 HX A14VIG: NVIDIA GeForce RTX 4090 Laptop GPU, 18.00", 3.6 kg
Külsős Teszt » MSI Titan 18 HX A14VIG
Acer Predator Helios 18 PH18-72-98MW: NVIDIA GeForce RTX 4090 Laptop GPU, 18.00", 3.3 kg
Külsős Teszt » Acer Predator Helios 18 PH18-72-98MW
Medion Erazer Beast X40 2024: NVIDIA GeForce RTX 4090 Laptop GPU, 17.00", 2.9 kg
Külsős Teszt » Medion Erazer Beast X40 2024