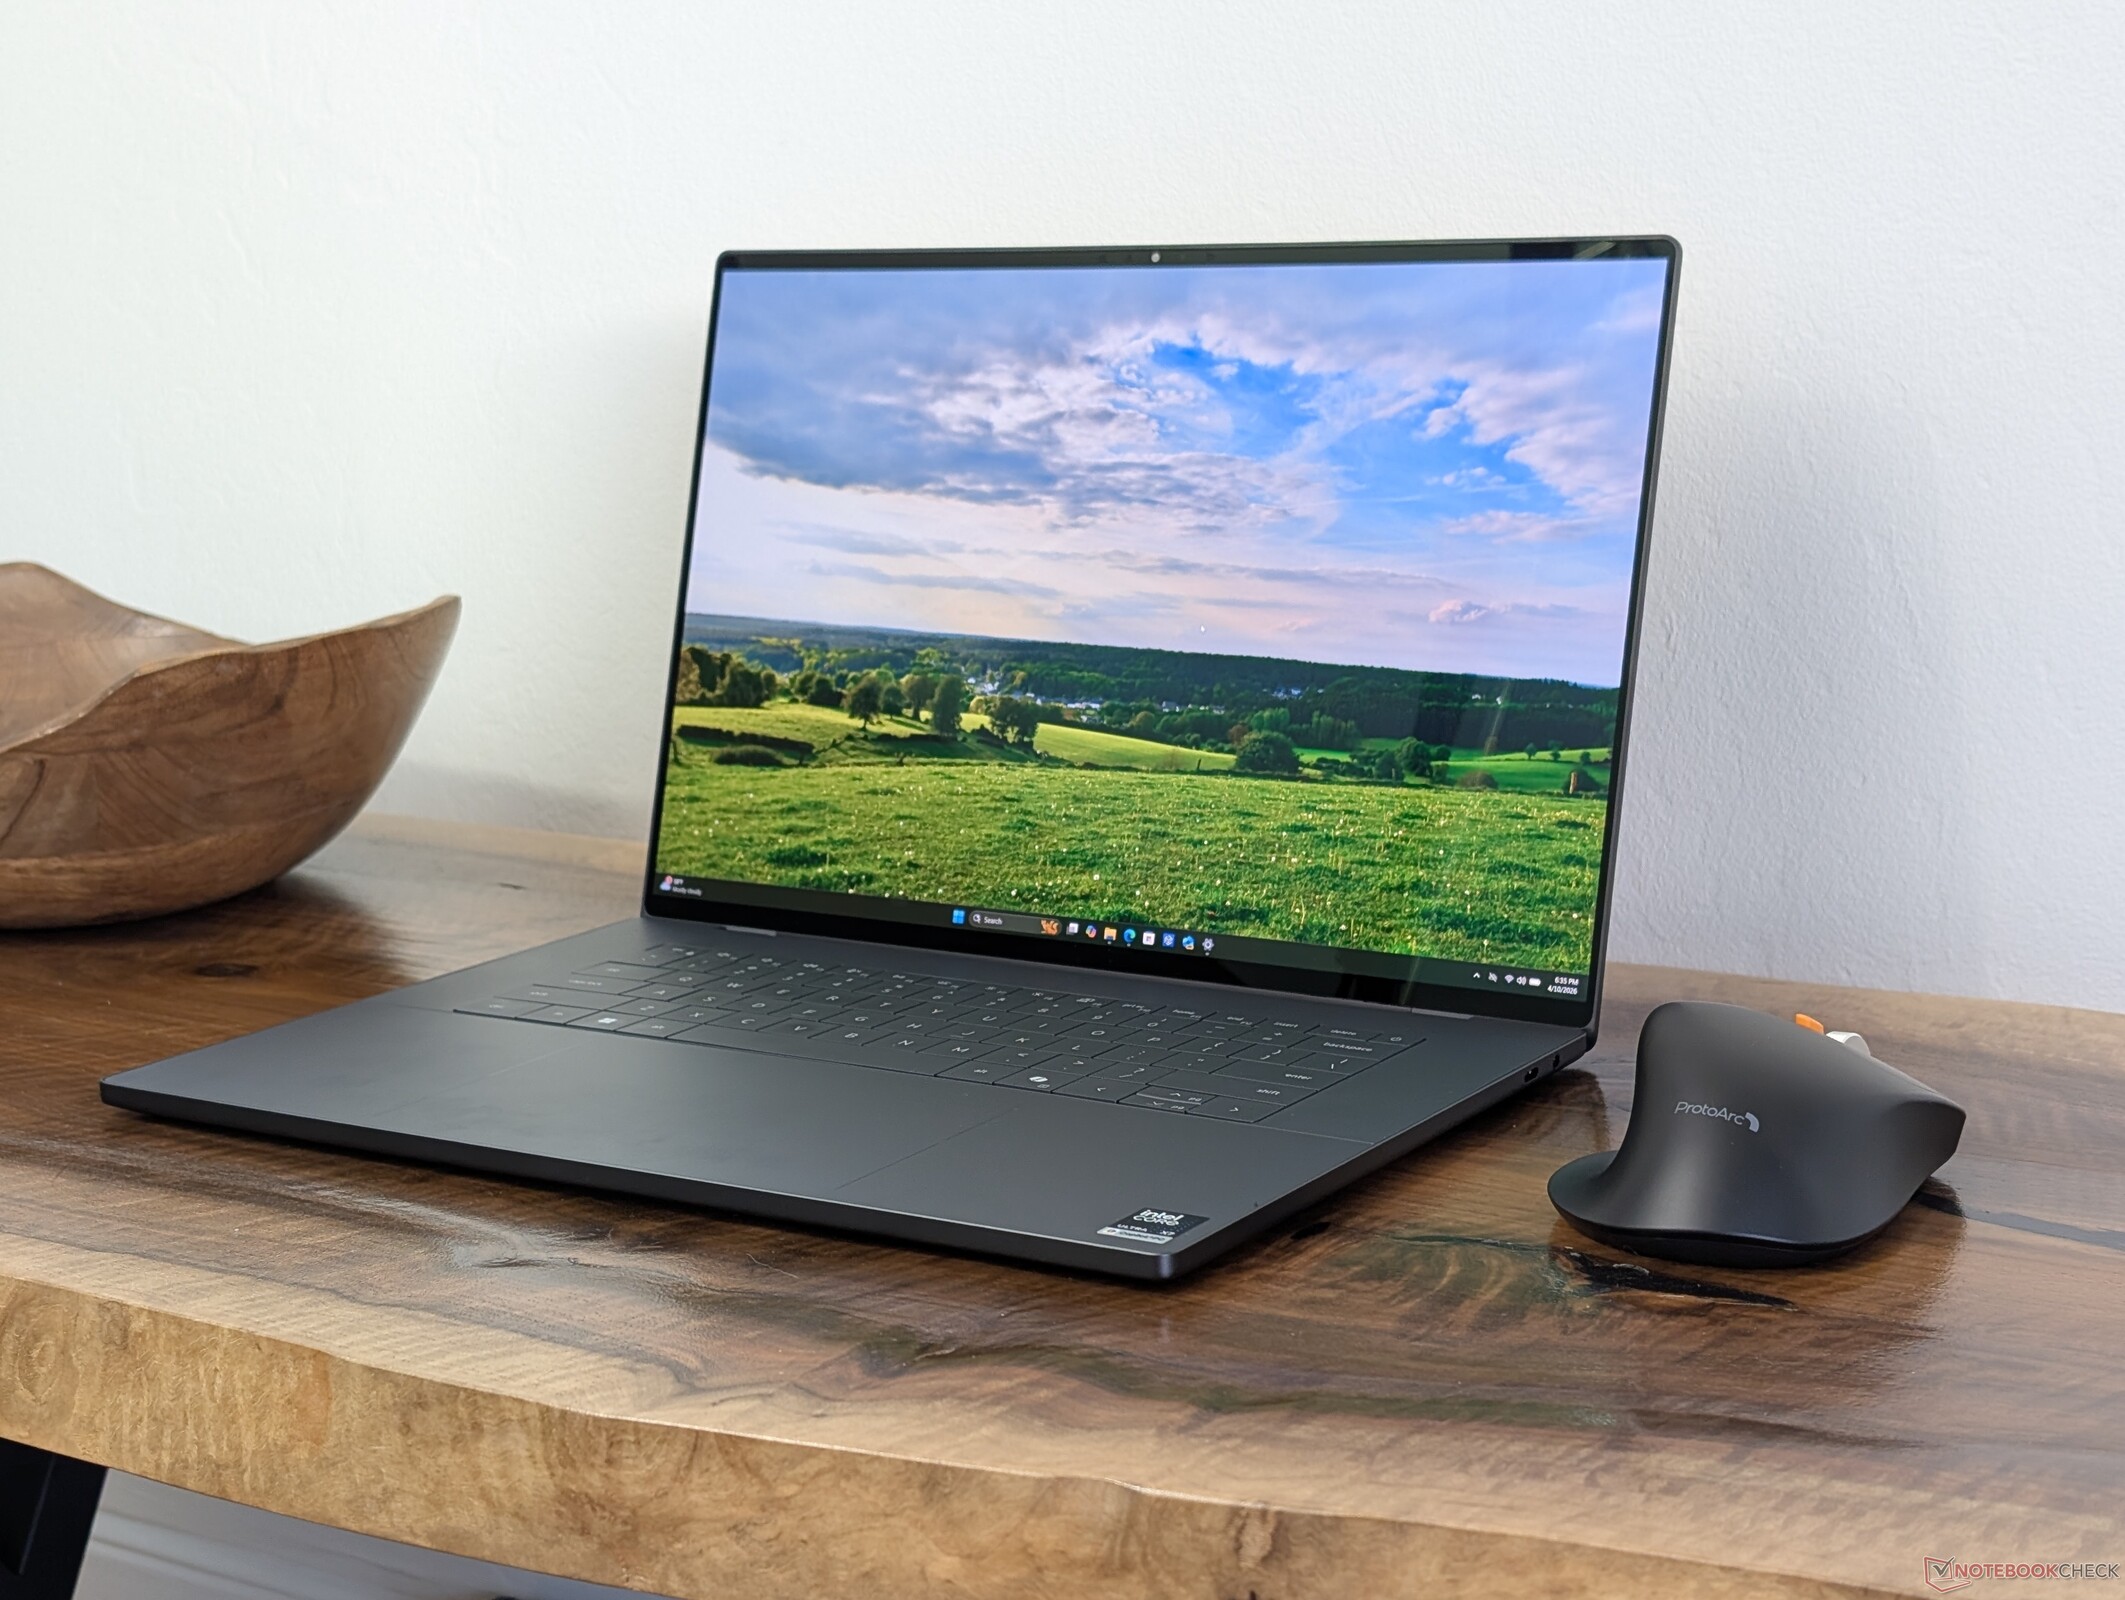
Ítélet - zöldebb és karcsúbb, mint valaha
A Core Ultra X7 CPU és az Arc B390 GPU akár 70 százalékkal, illetve 150 százalékkal gyorsabb, mint a bevallottan csalódást okozó Core Ultra 5, illetve Ultra 7 opciók, anélkül, hogy melegebbet kellene futtatni. Ez a magasabb szintű konfiguráció a cikk írásakor 400 dollárral kerülhet többe, de mind a RAM (16 GB-ról 32 GB-ra), mind a tárolókapacitás (512 GB-ról 1 TB-ra) megduplázódik, így különösen a grafikus szerkesztők vagy tartalomkészítők számára érdemes megfontolni.
Ha még több teljesítményre, de alacsonyabb hatékonyságra vágynak, a felhasználóknak érdemes megfontolniuk a tavalyi Arrow Lake meghajtású Dell 16 Premium amely 20 százalékkal gyorsabb többszálú teljesítményt és 60 százalékkal gyorsabb grafikus teljesítményt kínál, mint még a csúcsmodell 2026 XPS 16 konfiguráció is. Csak ne feledje, hogy a régebbi Dell 16 Premium kivitel vastagabb és nehezebb felépítéssel jár az Nvidia GPU elhelyezése érdekében.
A megfigyelt throttling viselkedés arra utal, hogy a CPU-nak valószínűleg jót tett volna egy erősebb hűtési megoldás. A mag hőmérséklete stressz esetén elérte a 100 C-ot, mielőtt visszatekerte volna az órajeleket, hogy kordában tartsa a hőmérsékletet. A konkurens Asus ExpertBook Ultra képes magasabb órajeleket fenntartani ugyanazzal a Panther Lake X7 processzorral, így gyorsabb teljesítményt nyújt, mint a Dell.
Eközben a luxus OLED panel további 150 dollár a fent említett 400 dolláron felül. A kijelzőfrissítés kevésbé ajánlott a Core Ultra X7 CPU frissítéssel szemben, mivel az alap IPS panel már elég erős a színek, a kontrasztarány és a frissítési frekvencia tekintetében. A CPU és a GPU által megcélzott szerkesztési és multimédia szinthez az IPS panel elegendő lehet a legtöbb szűkebb költségvetésű felhasználó számára.
Pro
Kontra
Ár és elérhetőség
A Core Ultra X7-gyel és 3,2K OLED érintőképernyővel ellátott, áttekintett konfiguráció 2350 dollárért kapható közvetlenül a Dell-től.
Miután nemrégiben teszteltük a core Ultra 5 325 IPS alapkonfigurációt a legújabb XPS 16-ost, most készen állunk arra, hogy a Core Ultra X7 358H OLED konfigurációval foglalkozzunk, hogy megnézzük, milyen fejlesztéseket és előnyöket kínál a drágább opció. Megéri a magasabb kategóriájú SKU az 500-600 dolláros többletköltséget?
Az új 2026-os XPS 16 dizájn fizikai jellemzőivel kapcsolatos összes megjegyzésünk megtalálható itt. Ez az oldal inkább azokra a különbségekre összpontosít, amelyekre a felhasználók számíthatnak, ha a modell Core Ultra 5 vagy Core Ultra X7 konfigurációi között választanak.
További Dell értékelések:
Műszaki adatok
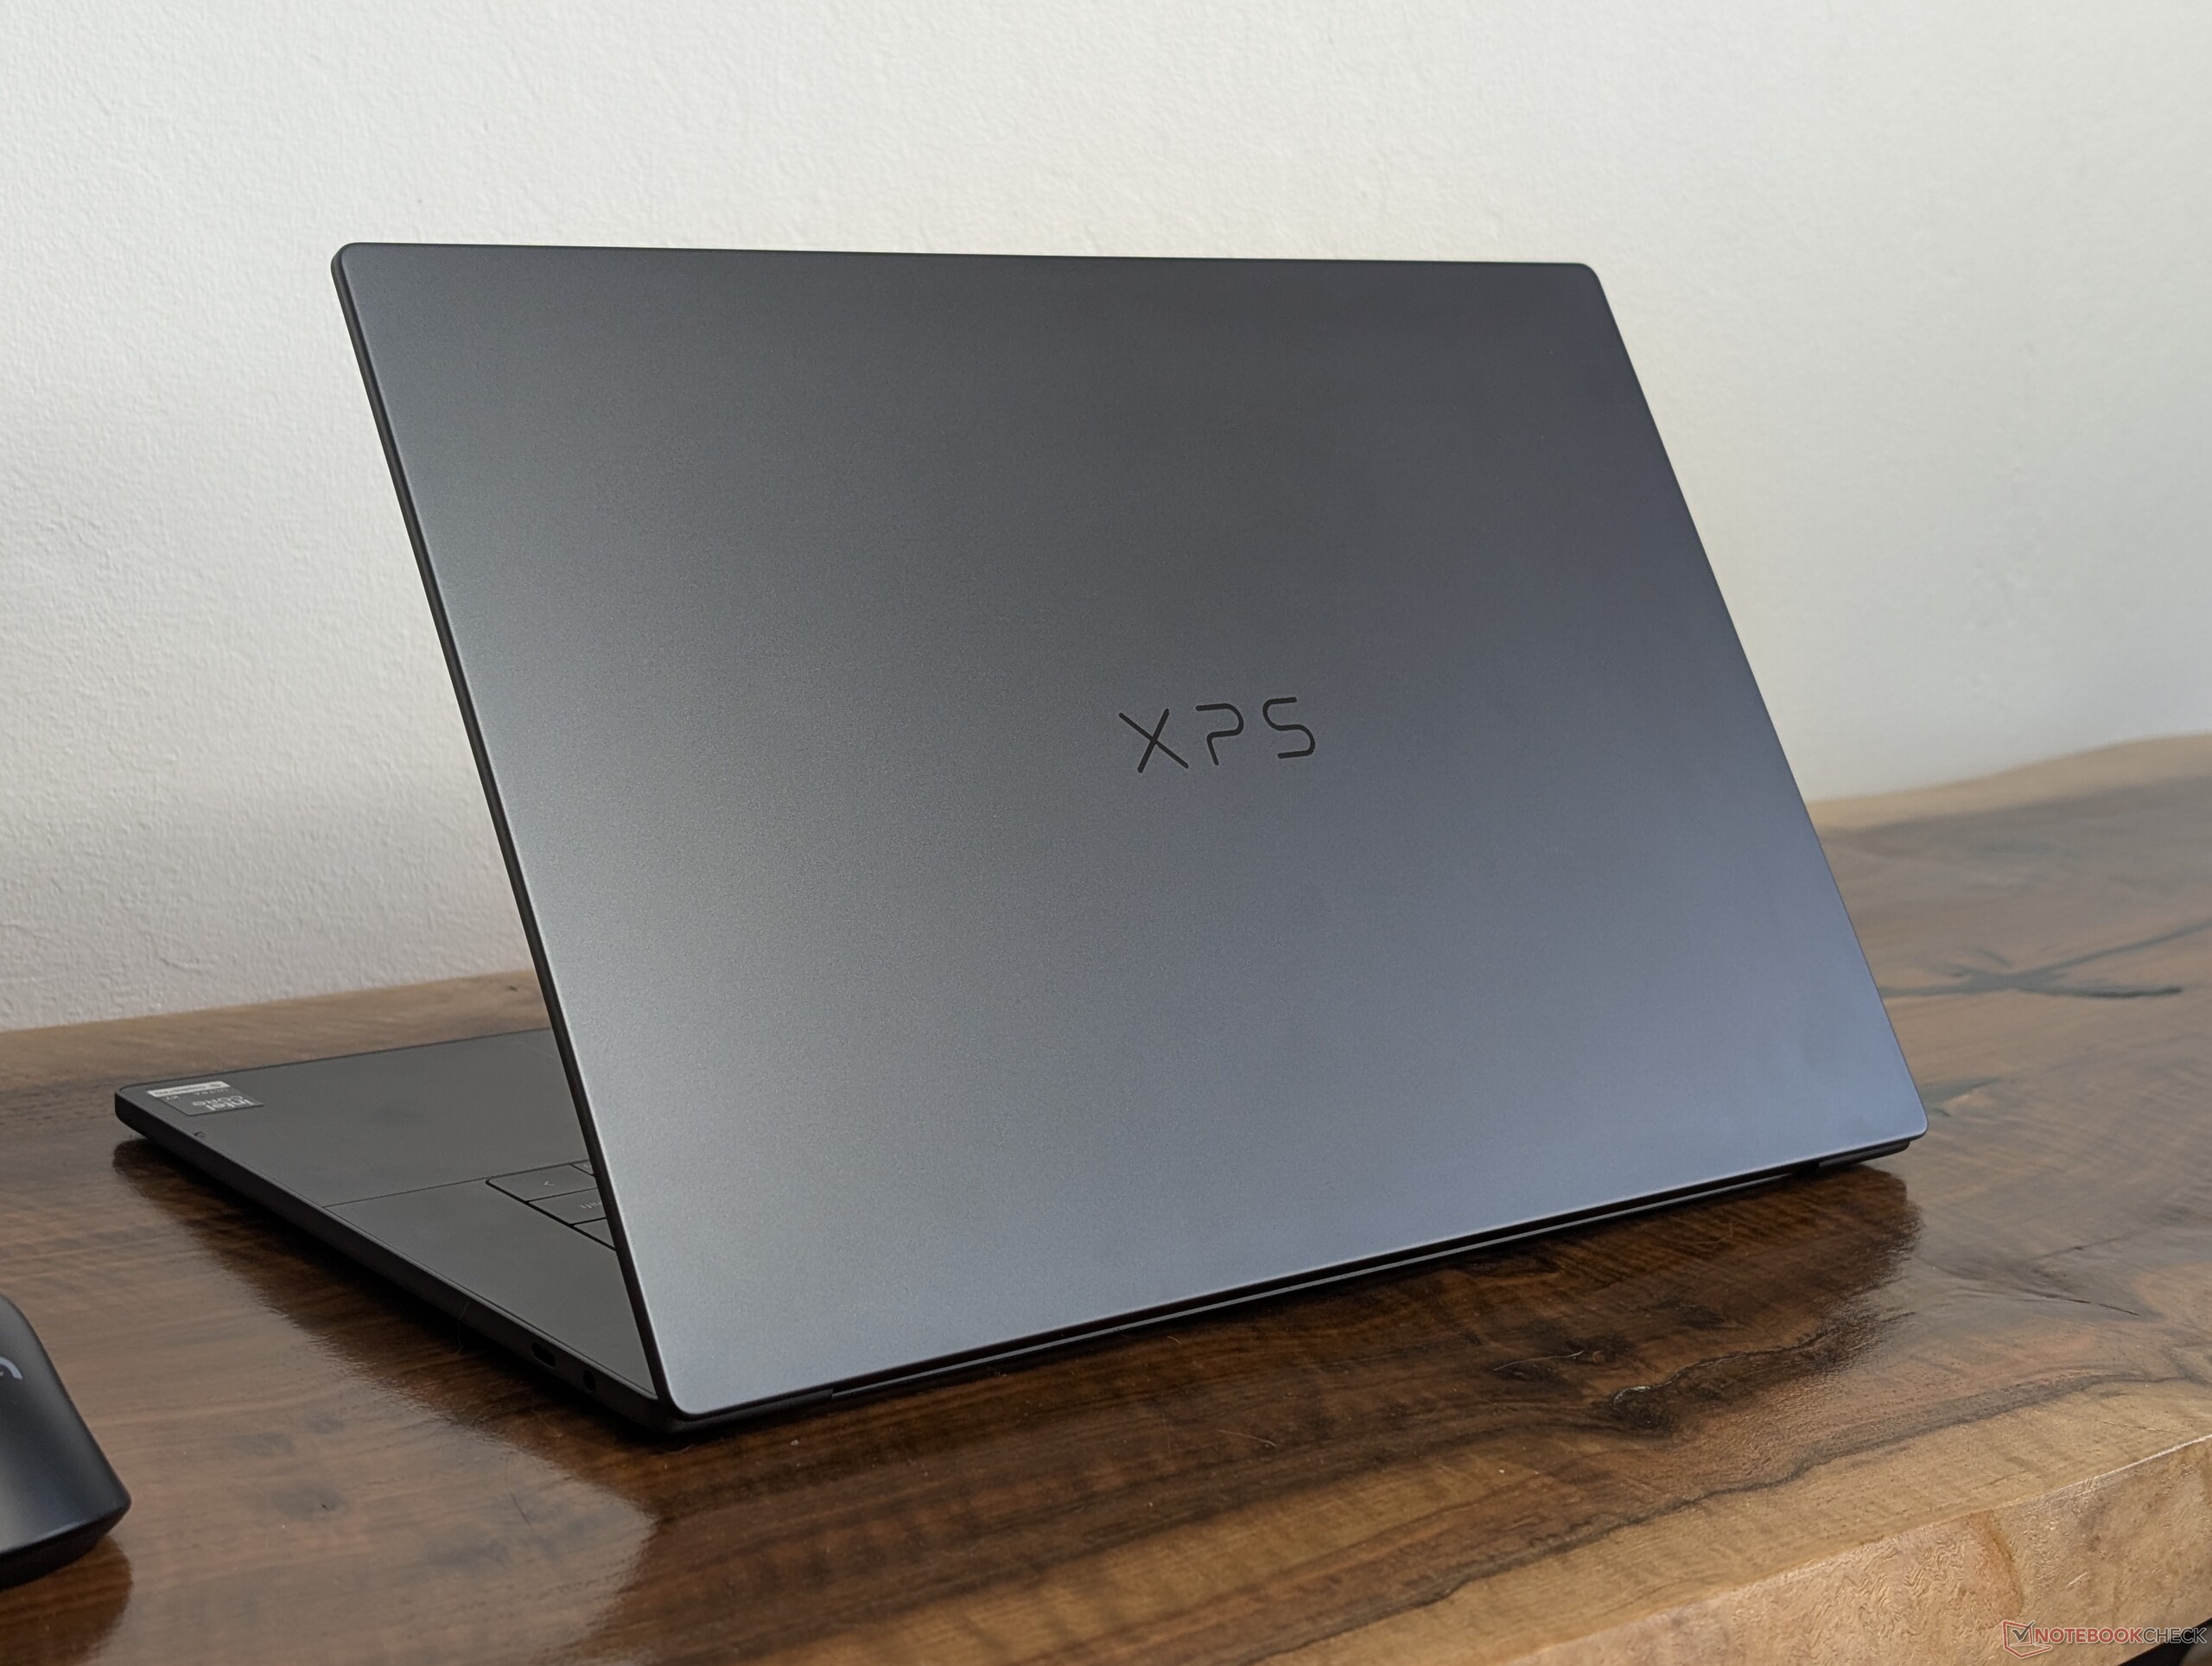
Ügy
Az OLED-konfiguráció valamivel vékonyabb és könnyebb az IPS-konfigurációnál, közel 1 mm-rel, illetve 100 g-mal. A két opció egyébként megegyezik.
Csatlakozás


Kommunikáció
Webkamera


Karbantartás

Fenntarthatóság
Az új XPS 16 több újrahasznosított anyagot használ, mint a Dell jelenlegi portfóliójának legtöbb más modellje. A váz 25-75 százalékban újrahasznosított alumíniumból áll, emellett 10 százalékban újrahasznosított üvegből készül az OLED-érintőképernyő, 50 százalékban kobaltból az akkumulátor, 90 százalékban újrahasznosított acélból a billentyűkártyák, és 100 százalékban újrahasznosított anyagokból a csomagolás.
Megjelenítés
Két megjelenítési lehetőség áll rendelkezésre:
- 1920 x 1200, 100% sRGB, IPS, nem érintésérzékeny, 1 - 120 Hz, matt
- 3200 x 2000, 100% DCI-P3, OLED, érintőképernyő, 20 - 120 Hz, DisplayHDR 500, fényes
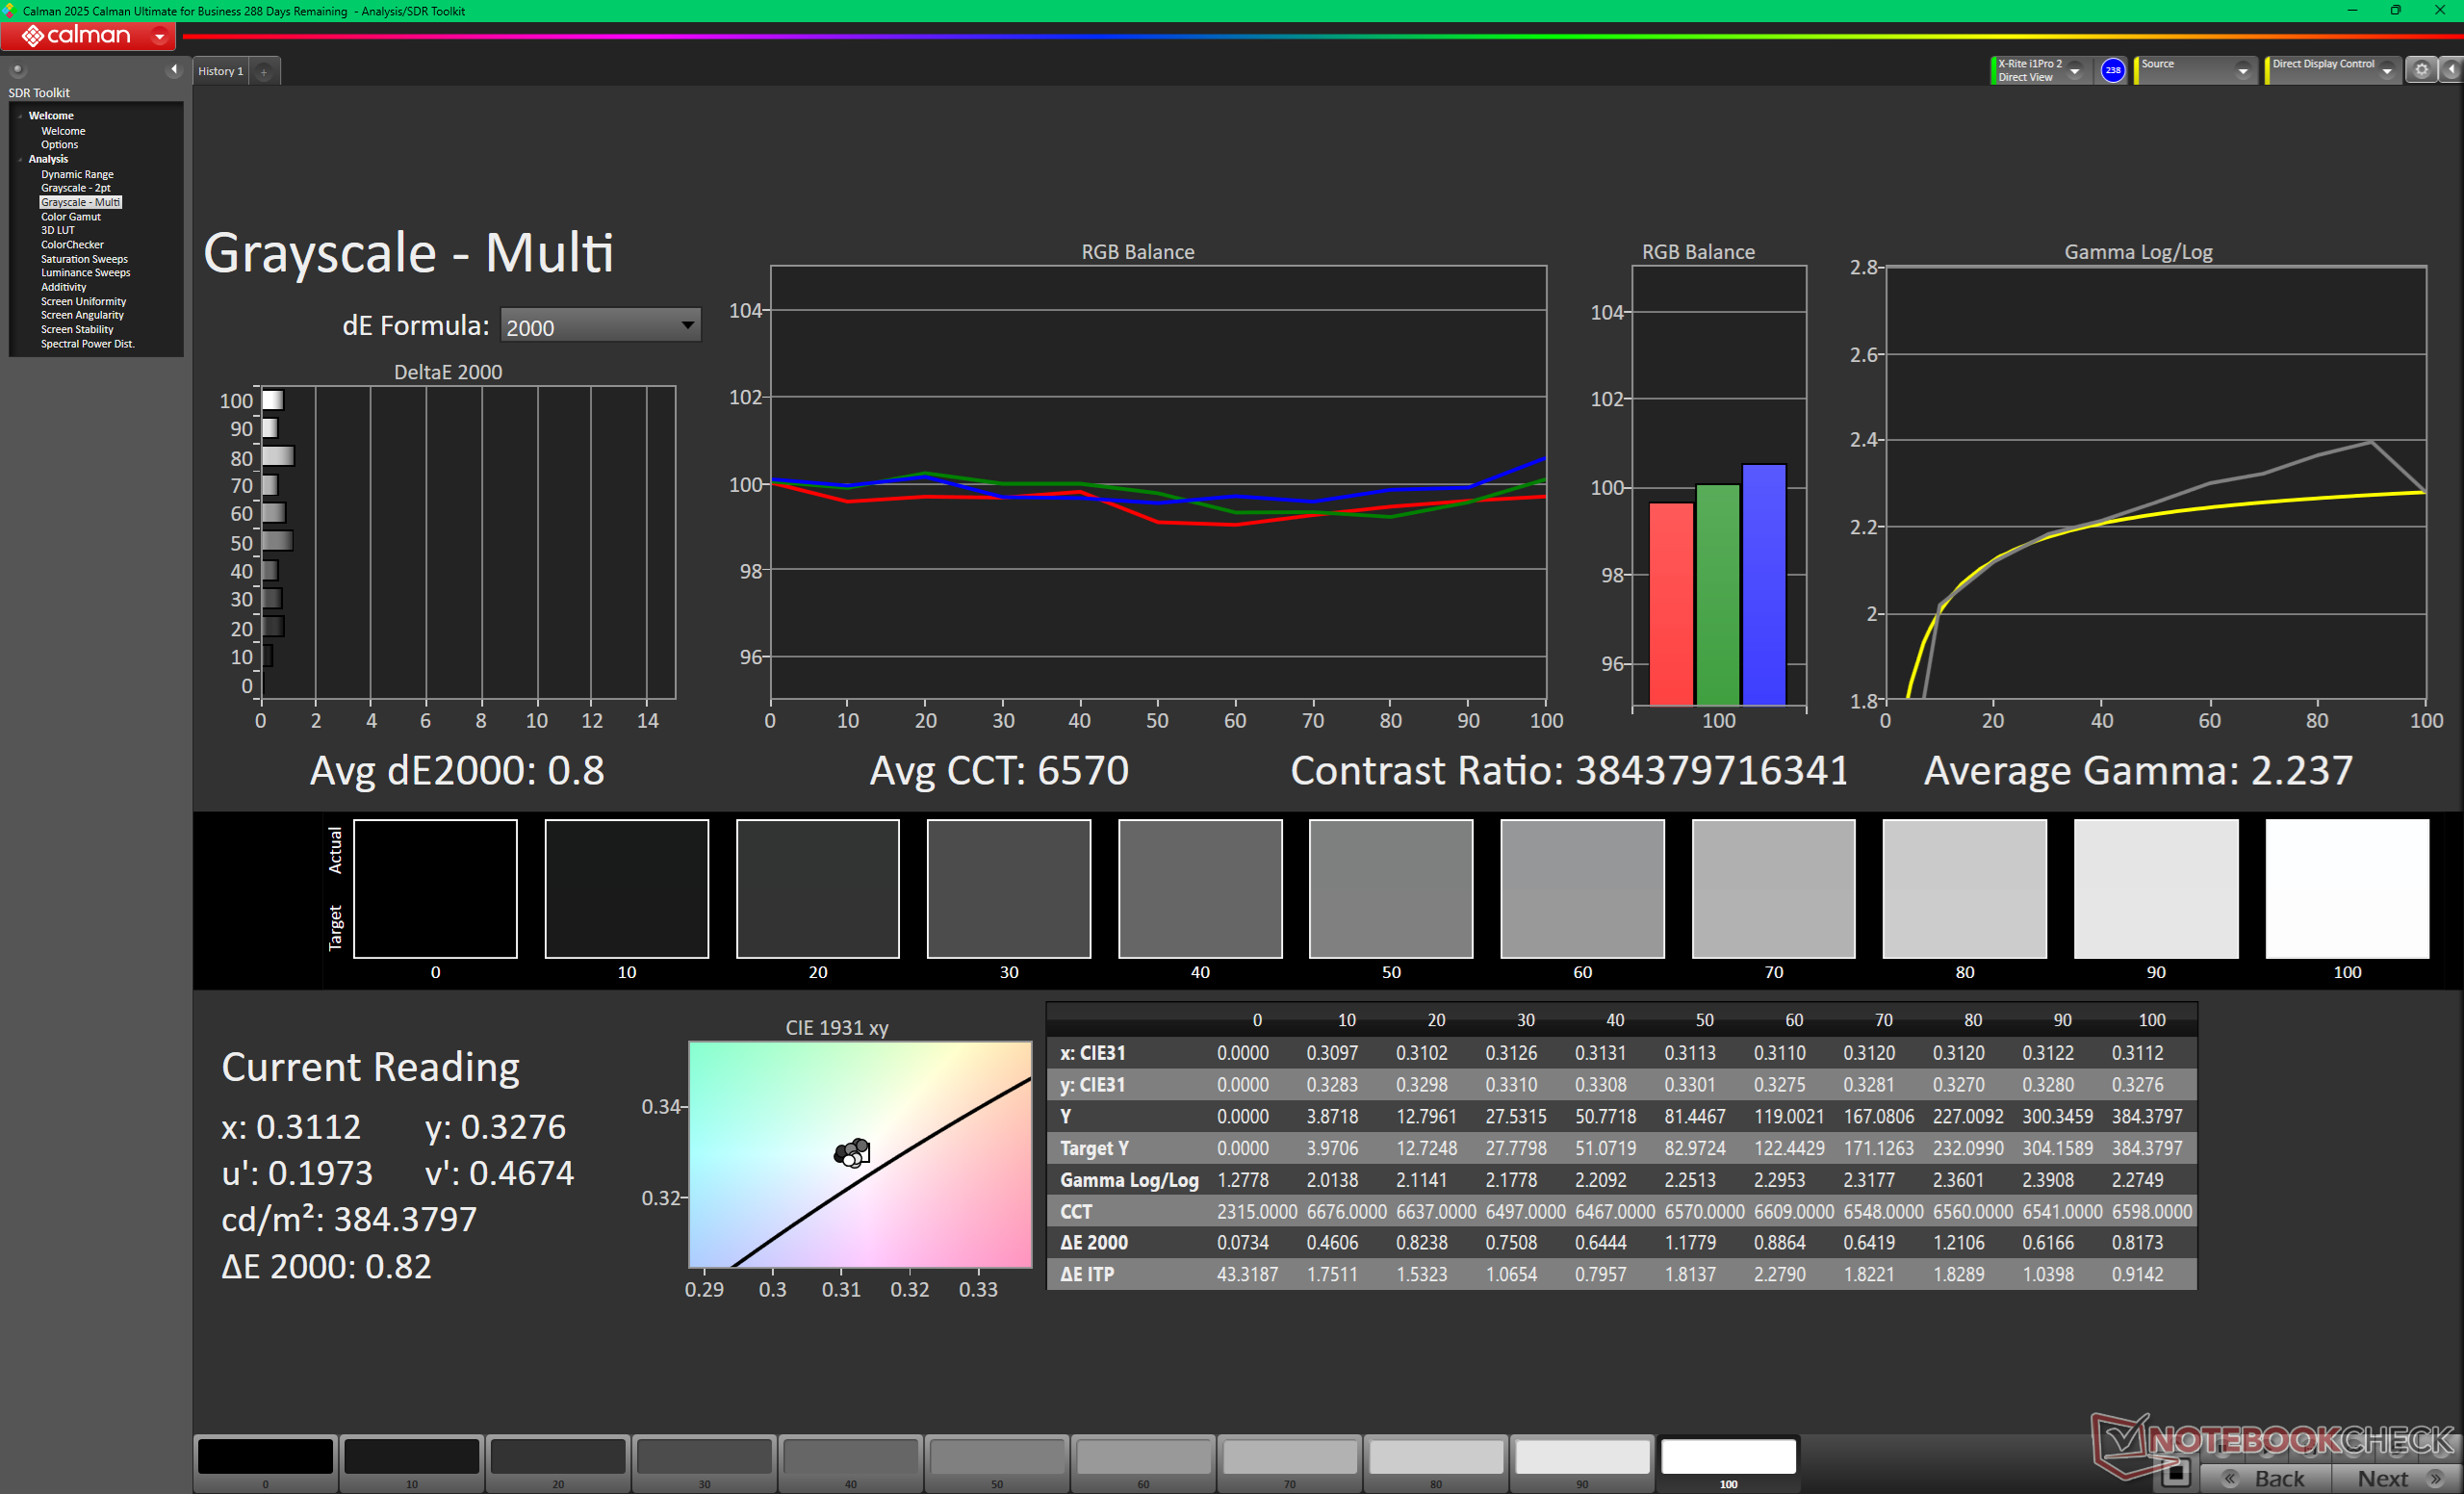
Az OLED opció az alap IPS panelhez képest számos fejlesztést kínál, többek között nagyobb natív felbontást, mélyebb P3 színeket, érintőképernyő-funkciót, HDR500 támogatást és koromfekete kontrasztszintet. Emellett natívan kezeli az alap IPS-panel viszonylag lassú fekete-fehér válaszidejét is, így tisztább felhasználói élményt nyújt.
Az OLED választása mindazonáltal néhány kisebb hátránnyal jár, mint például a magasabb energiafogyasztás, az impulzusszélesség-moduláció és a tükröződéstől nehezített fényes képernyő. A natív 3,2K felbontás is jelentősen alacsonyabb, mint a 4K OLED panel a xPS 16 régebbi kivitelén (3200 x 2000 vs. 3840 x 2400).
Az OLED-panel maximális fényereje SDR módban legfeljebb 400 nits, illetve HDR módban 500 nits, saját házon belüli méréseink szerint. Így az olcsóbb IPS-konfiguráció SDR-tartalmak megjelenítésekor valójában valamivel fényesebb, mint az OLED-konfiguráció. A kültéri megjelenítés ezért nem feltétlenül jobb a fényesebb OLED-változatnál.
| |||||||||||||||||||||||||
Fényerő megoszlás: 95 %
Centrumban: 395.4 cd/m²
Kontraszt: ∞:1 (Fekete: 0 cd/m²)
ΔE ColorChecker Calman: 3.69 | ∀{0.5-29.43 Ø4.72}
calibrated: 0.68
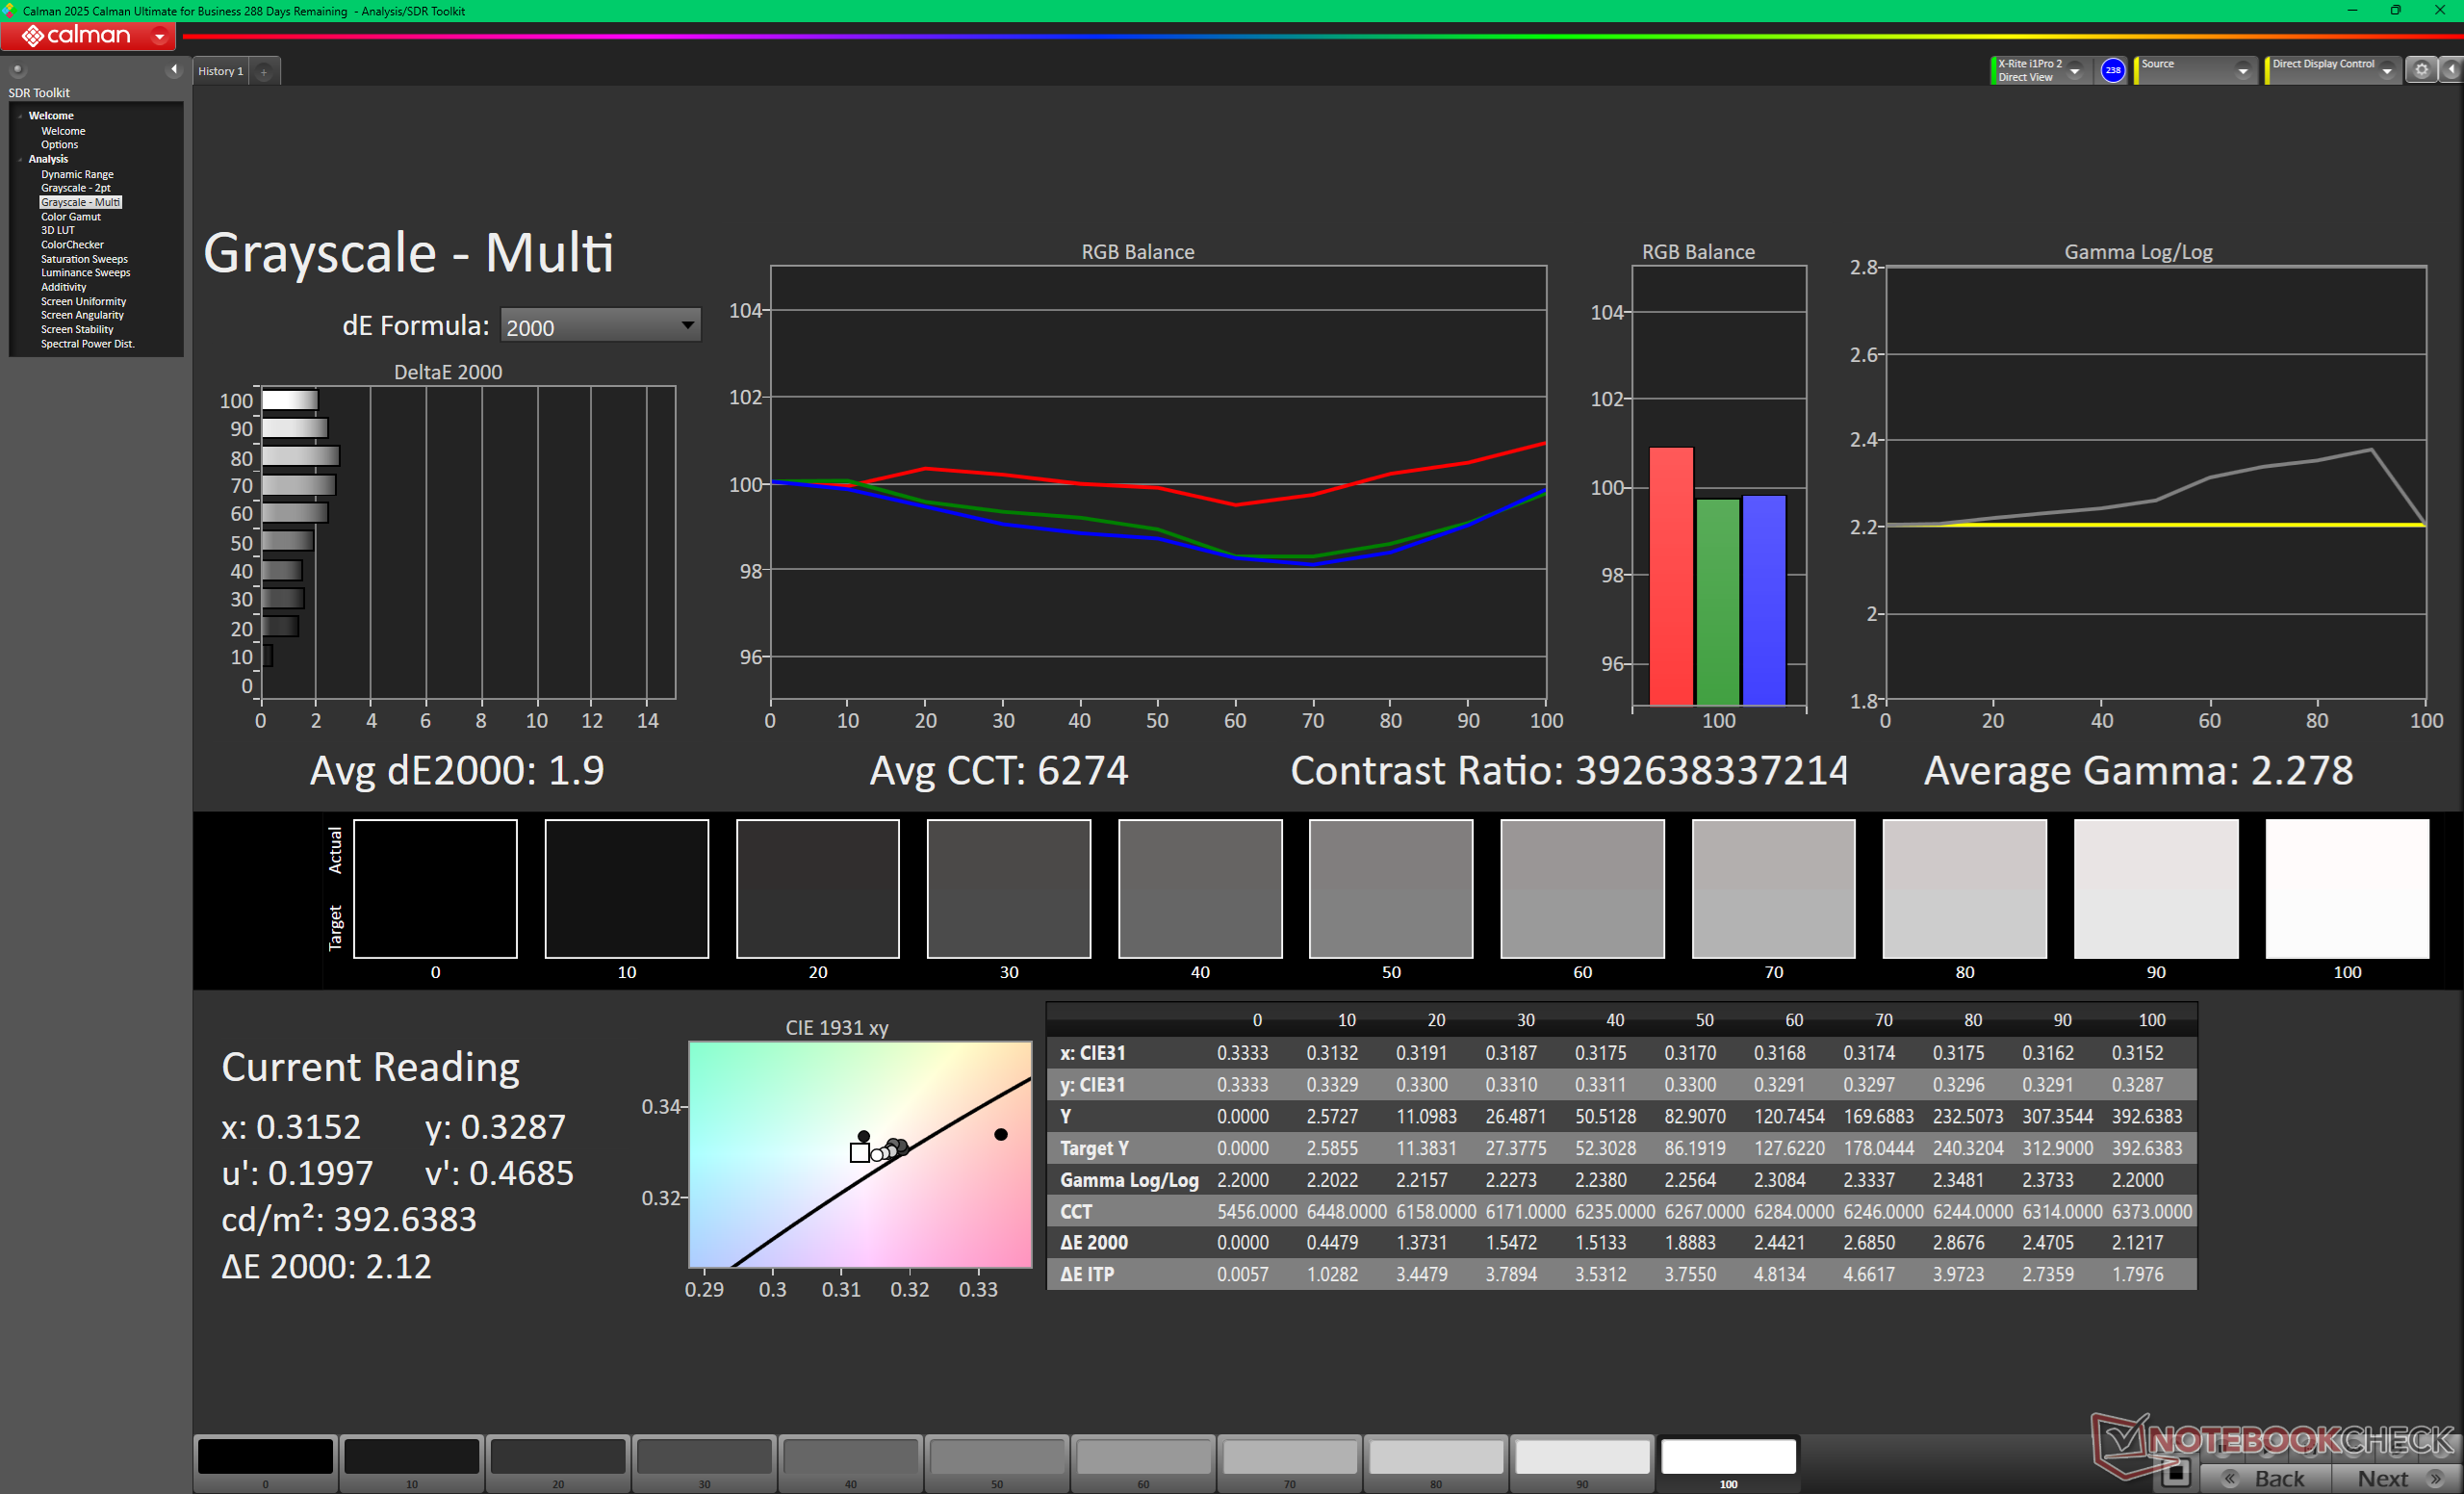
ΔE Greyscale Calman: 1.9 | ∀{0.09-98 Ø4.97}
96.5% AdobeRGB 1998 (Argyll 3D)
100% sRGB (Argyll 3D)
99.5% Display P3 (Argyll 3D)
Gamma: 2.28
CCT: 6274 K
| Dell XPS 16 Core Ultra X7 358H LG Philips 160WV1, OLED, 3200x2000, 16", 120 Hz | Dell XPS 16 Core Ultra 5 325 LG Philips 160WUX, IPS, 1920x1200, 16", 120 Hz | Dell XPS 16 9640 SDC4196, OLED, 3840x2400, 16.3", 90 Hz | Samsung Galaxy Book6 Pro ATNA60HR05-0, OLED, 2880x1800, 16", 120 Hz | Lenovo Yoga Pro 9 16IAH10 RTX 5050 ATNA60HR04-0, OLED, 2880x1800, 16", 120 Hz | HP Omnibook 5 16-af1037nr BOE0C46, IPS, 1920x1200, 16", 60 Hz | |
|---|---|---|---|---|---|---|
| Display | -22% | -3% | -4% | -54% | ||
| Display P3 Coverage (%) | 99.5 | 66.2 -33% | 98.3 -1% | 98.3 -1% | 39.2 -61% | |
| sRGB Coverage (%) | 100 | 97.4 -3% | 100 0% | 99.9 0% | 57.7 -42% | |
| AdobeRGB 1998 Coverage (%) | 96.5 | 67.7 -30% | 87.8 -9% | 85.9 -11% | 40.5 -58% | |
| Response Times | -4418% | -12% | -49% | -19% | -3791% | |
| Response Time Grey 50% / Grey 80% * (ms) | 0.65 ? | 39.3 ? -5946% | 0.82 ? -26% | 0.51 ? 22% | 32.5 ? -4900% | |
| Response Time Black / White * (ms) | 0.87 ? | 26 ? -2889% | 0.85 ? 2% | 0.41 ? 53% | 24.2 ? -2682% | |
| PWM Frequency (Hz) | 240.2 ? | 360 ? | 240 ? | 1200 | ||
| PWM Amplitude * (%) | 31 | 100 -223% | 37 -19% | |||
| Screen | 1% | 6% | 34% | 5% | -91% | |
| Brightness middle (cd/m²) | 395.4 | 534.6 35% | 366 -7% | 502 27% | 471.7 19% | 349.2 -12% |
| Brightness (cd/m²) | 392 | 515 31% | 367 -6% | 507 29% | 474 21% | 326 -17% |
| Brightness Distribution (%) | 95 | 92 -3% | 96 1% | 97 2% | 98 3% | 86 -9% |
| Black Level * (cd/m²) | 0.26 | 0.33 | ||||
| Colorchecker dE 2000 * | 3.69 | 2.53 31% | 1.3 65% | 1 73% | 3.53 4% | 5.87 -59% |
| Colorchecker dE 2000 max. * | 7.94 | 4.57 42% | 3.6 55% | 2.4 70% | 6.31 21% | 20.58 -159% |
| Colorchecker dE 2000 calibrated * | 0.68 | 1.26 -85% | 1 -47% | 3.04 -347% | ||
| Greyscale dE 2000 * | 1.9 | 2.7 -42% | 2.2 -16% | 1.8 5% | 2.6 -37% | 2.6 -37% |
| Gamma | 2.28 96% | 2.32 95% | 2.14 103% | 2.24 98% | 2.24 98% | 2.14 103% |
| CCT | 6274 104% | 6860 95% | 6680 97% | 6435 101% | 6292 103% | 6411 101% |
| Contrast (:1) | 2056 | 1058 | ||||
| Teljes átlag (program / beállítások) | -1480% /
-741% | -3% /
1% | -6% /
4% | -7% /
2% | -1312% /
-699% |
* ... a kisebb jobb


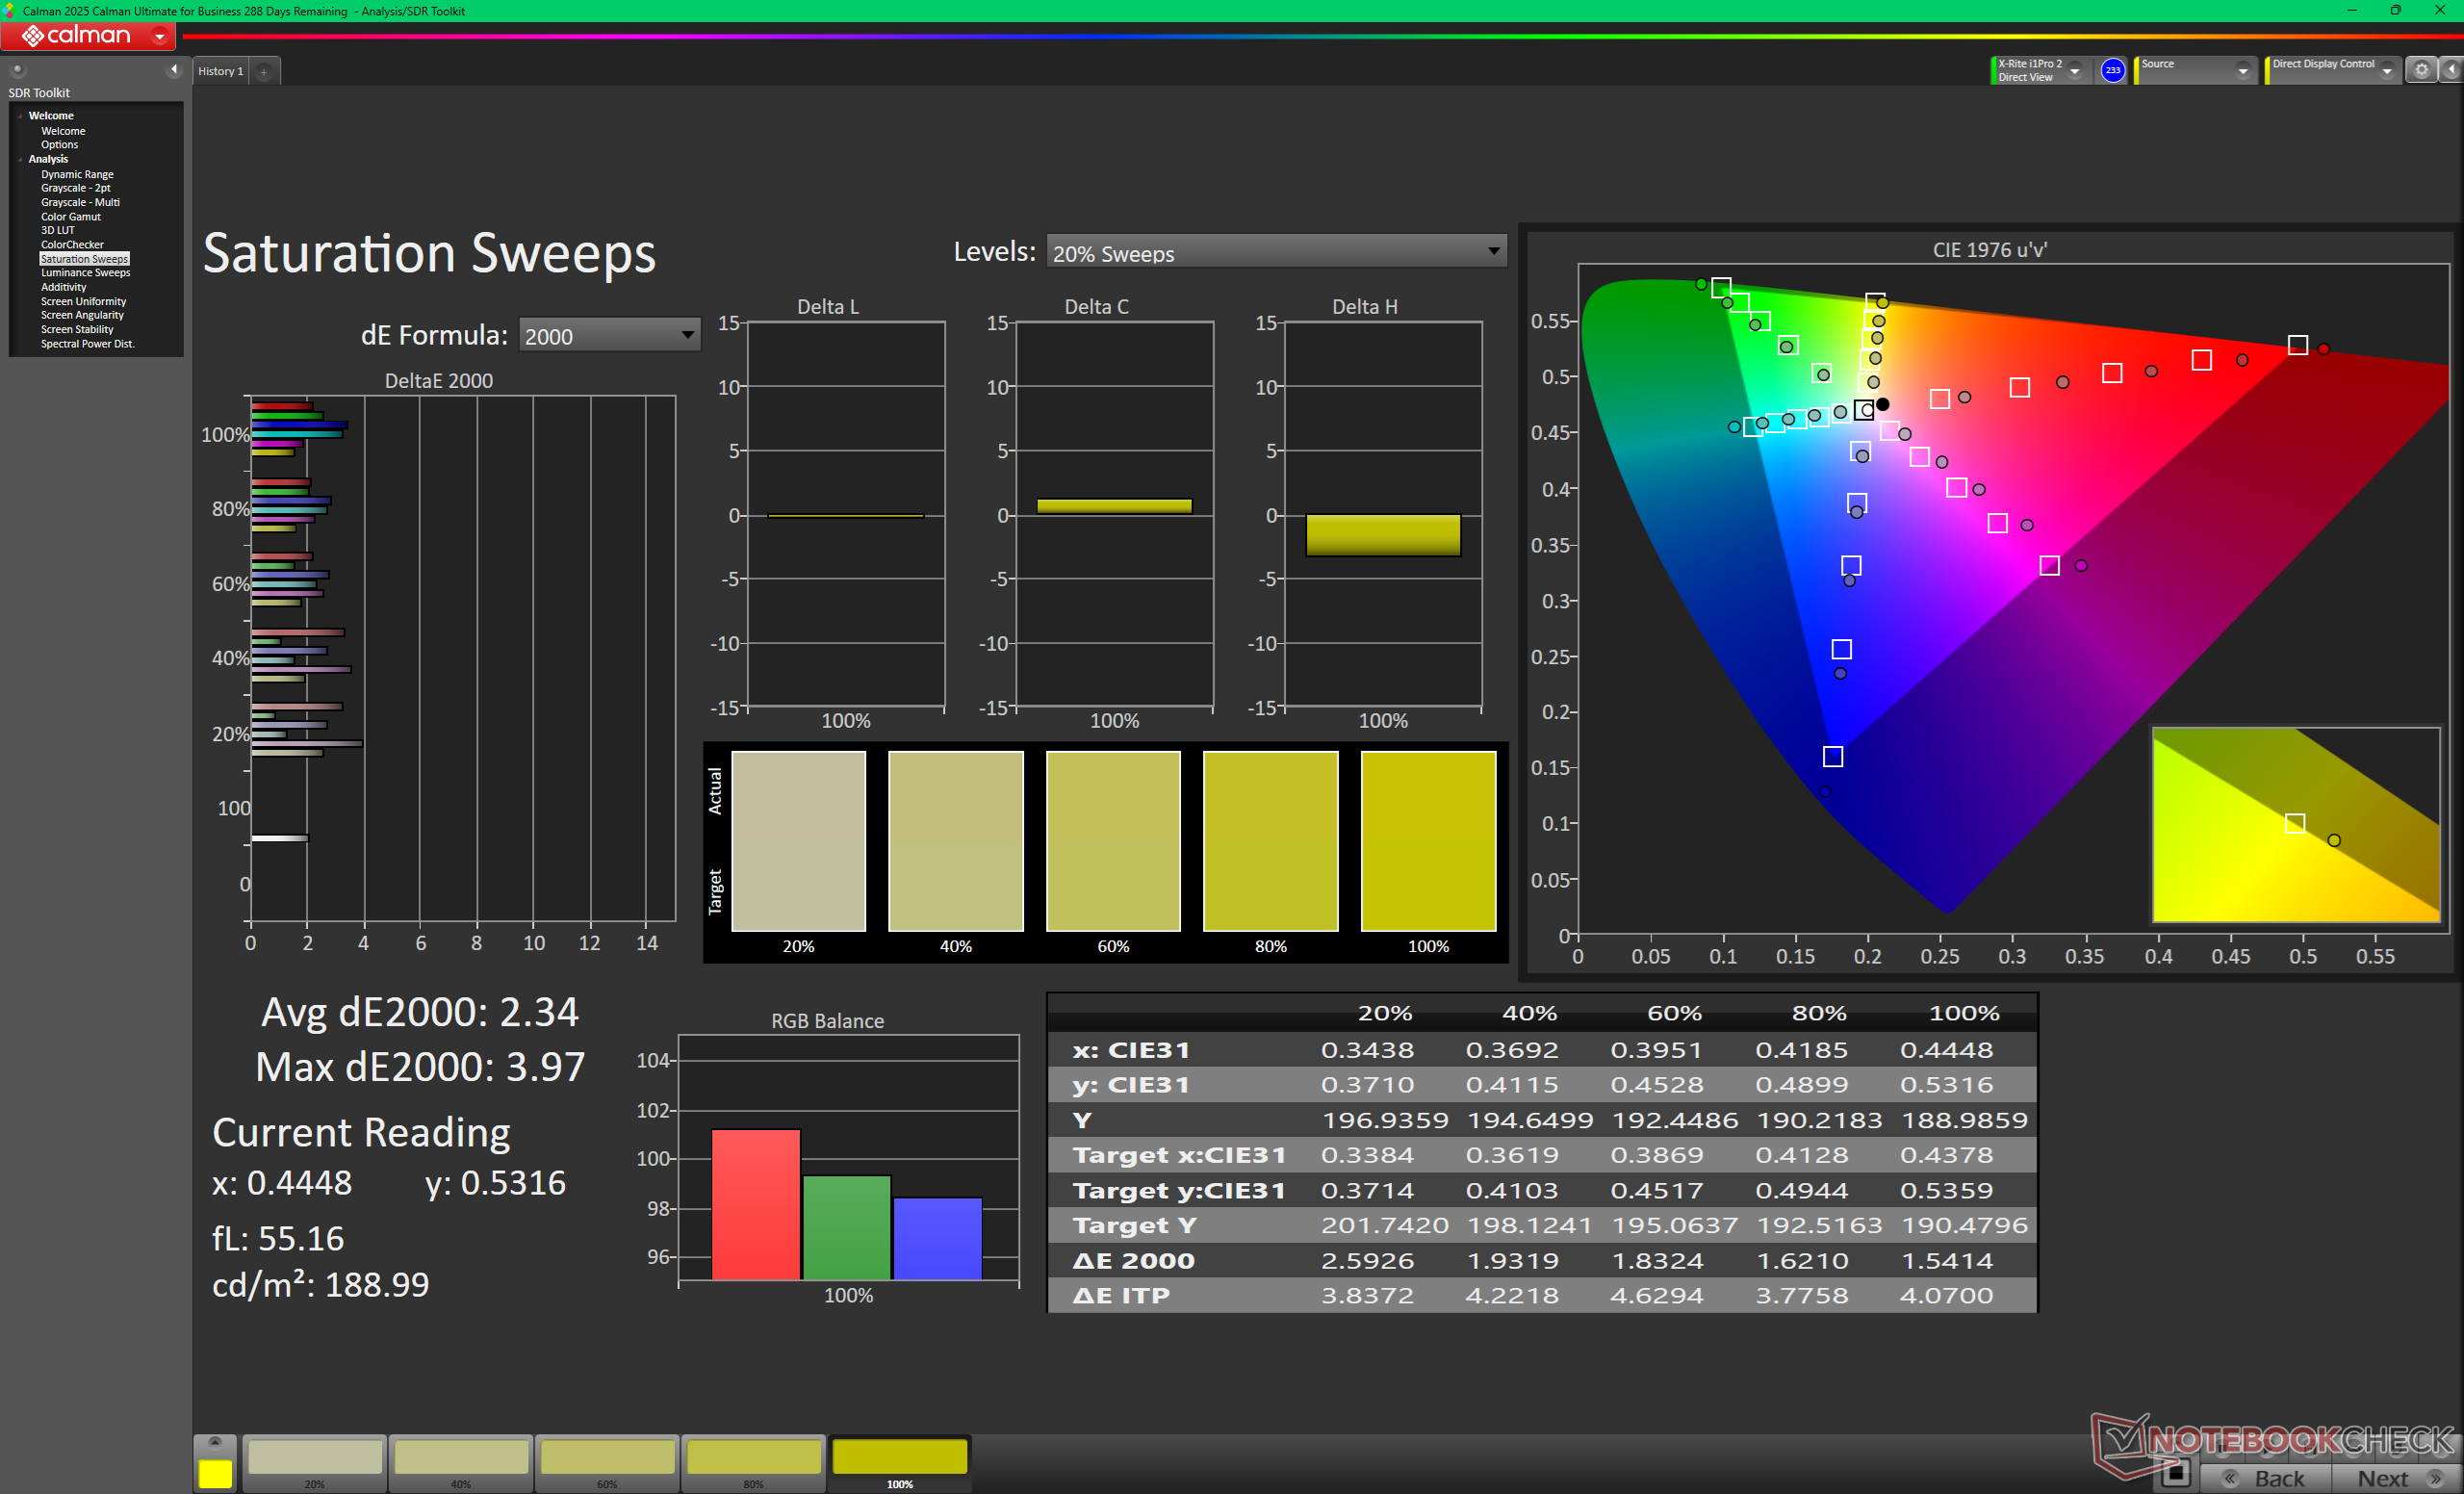
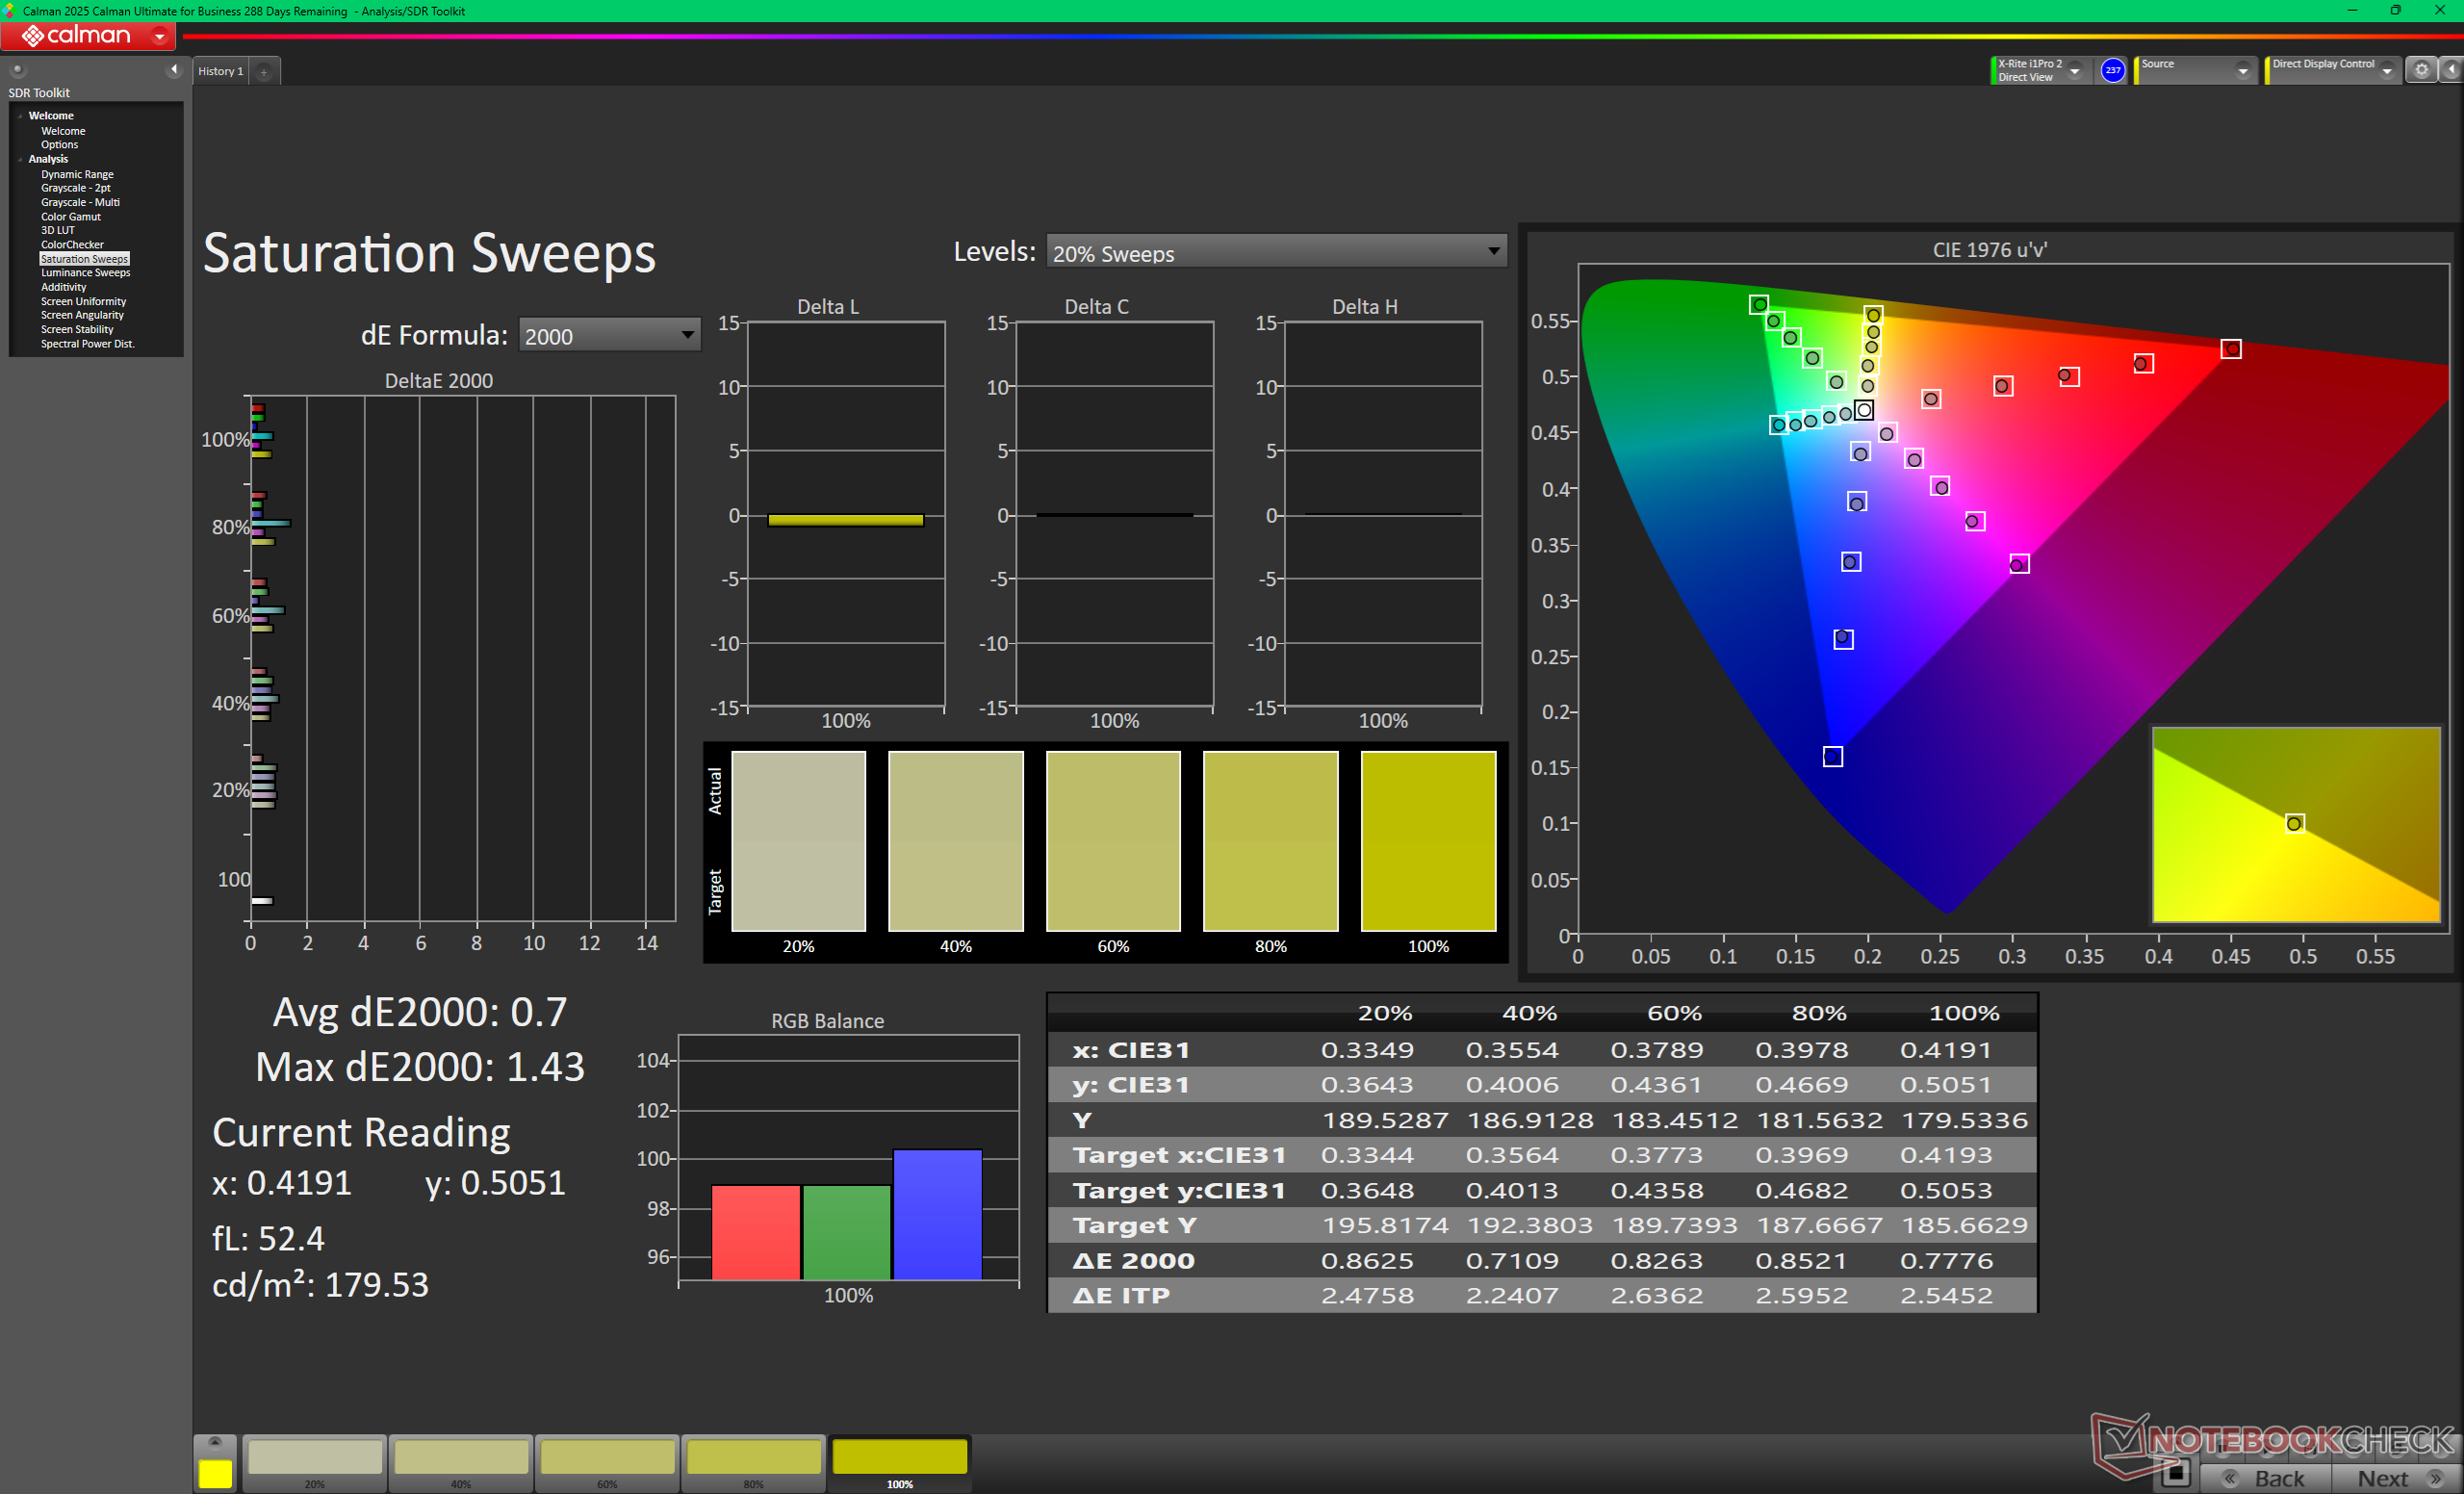
A panel a P3 szabványhoz képest tisztességesen kalibrált, az átlagos szürkeárnyalatos és színes DeltaE értékek 1,9, illetve 3,69 értéket érnek el. A legtöbb végfelhasználó számára ezért nincs szükség további kalibrálásra.


Megjelenítési válaszidők
| ↔ Válaszidő Fekete-fehér | ||
|---|---|---|
| 0.87 ms ... emelkedés és süllyedés ↘ kombinálva | ↗ 0.43 ms emelkedés | 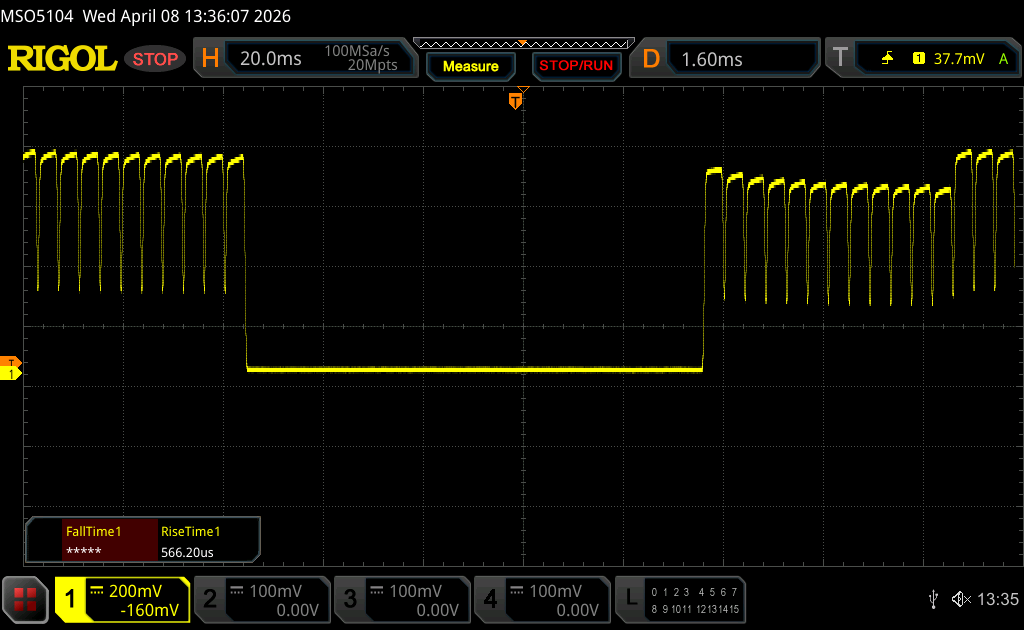 |
| ↘ 0.44 ms ősz | ||
| A képernyő tesztjeinkben nagyon gyors reakciósebességet mutatott, és nagyon jól használható gyors tempójú játékokhoz. Összehasonlításképpen, az összes tesztelt eszköz 0.1 (minimum) és 240 (maximum) ms között mozog. » 3 % of all devices are better. Ez azt jelenti, hogy a mért válaszidő jobb, mint az összes vizsgált eszköz átlaga (19.8 ms). | ||
| ↔ Válaszidő 50% szürke és 80% szürke között | ||
| 0.65 ms ... emelkedés és süllyedés ↘ kombinálva | ↗ 0.36 ms emelkedés | 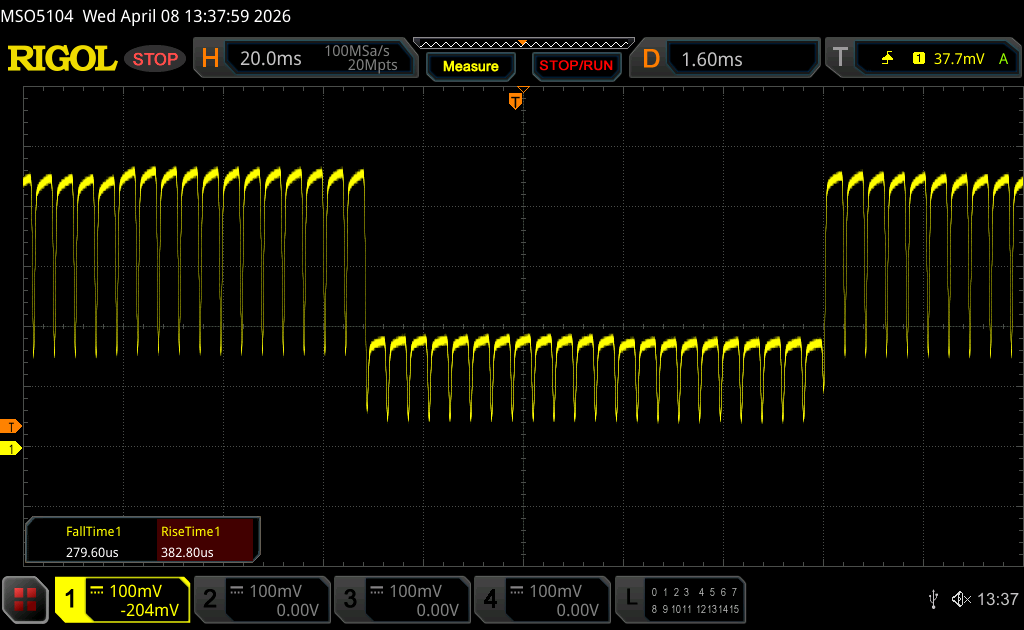 |
| ↘ 0.29 ms ősz | ||
| A képernyő tesztjeinkben nagyon gyors reakciósebességet mutatott, és nagyon jól használható gyors tempójú játékokhoz. Összehasonlításképpen, az összes tesztelt eszköz 0.165 (minimum) és 636 (maximum) ms között mozog. » 2 % of all devices are better. Ez azt jelenti, hogy a mért válaszidő jobb, mint az összes vizsgált eszköz átlaga (31 ms). | ||
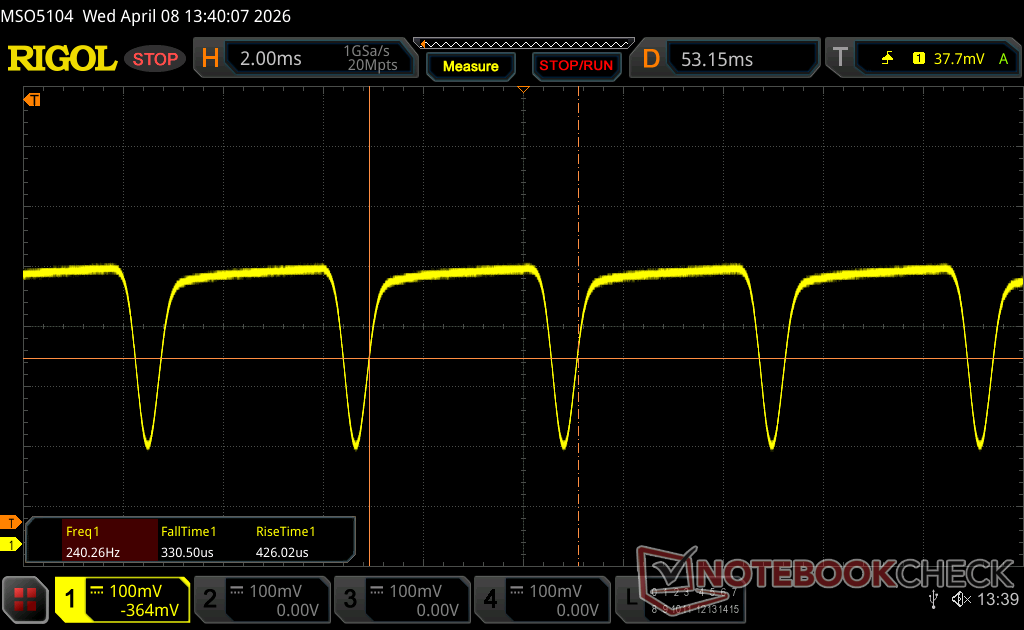
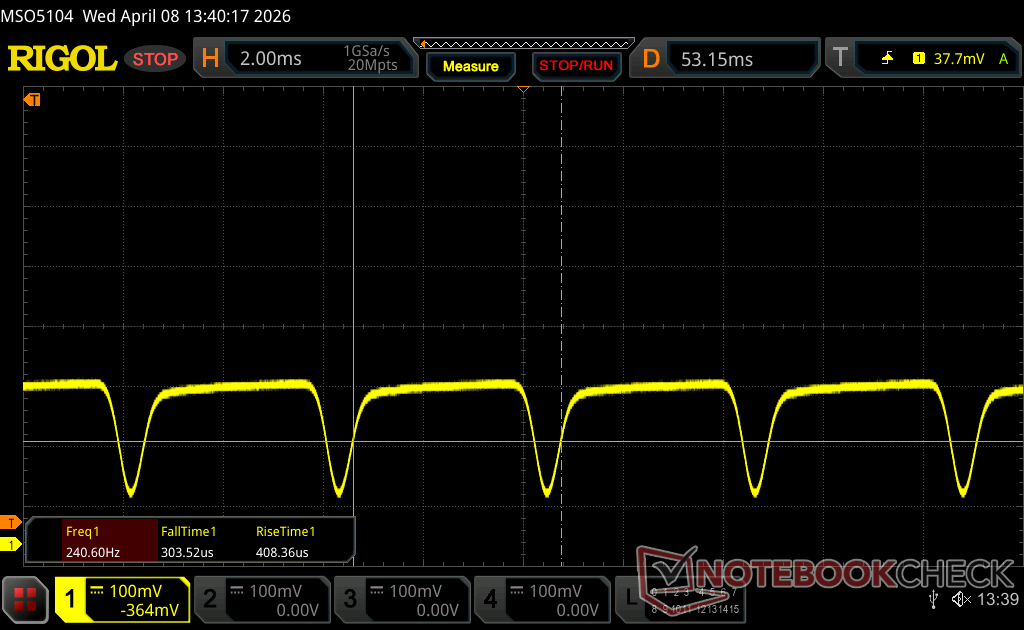
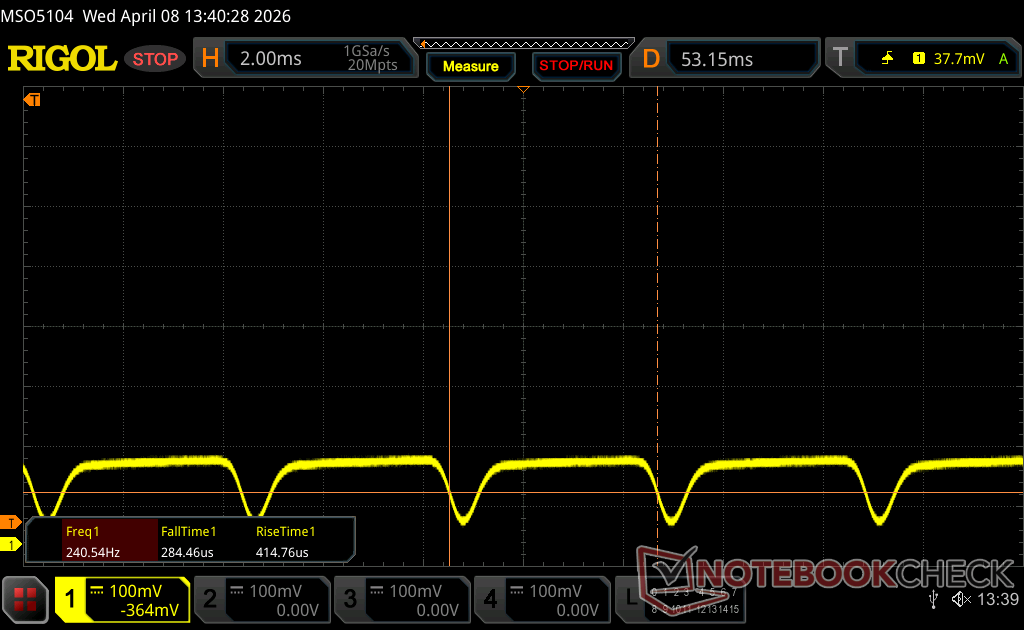
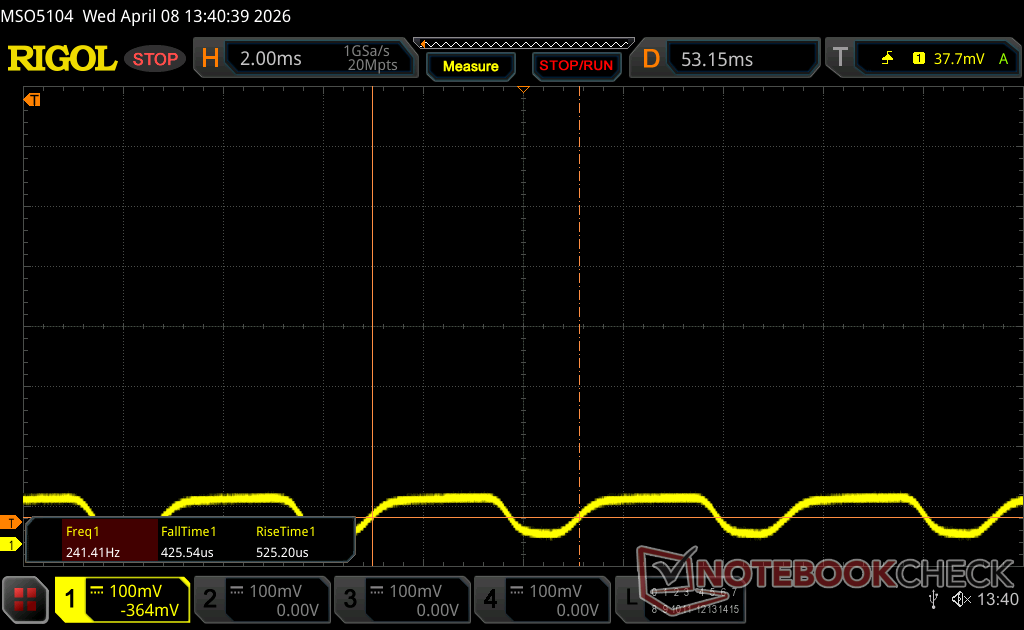
Képernyő villogása / PWM (impulzusszélesség-moduláció)
| Képernyő villogása / PWM észlelve | 240.2 Hz Amplitude: 31 % | ≤ 100 % fényerő beállítása | 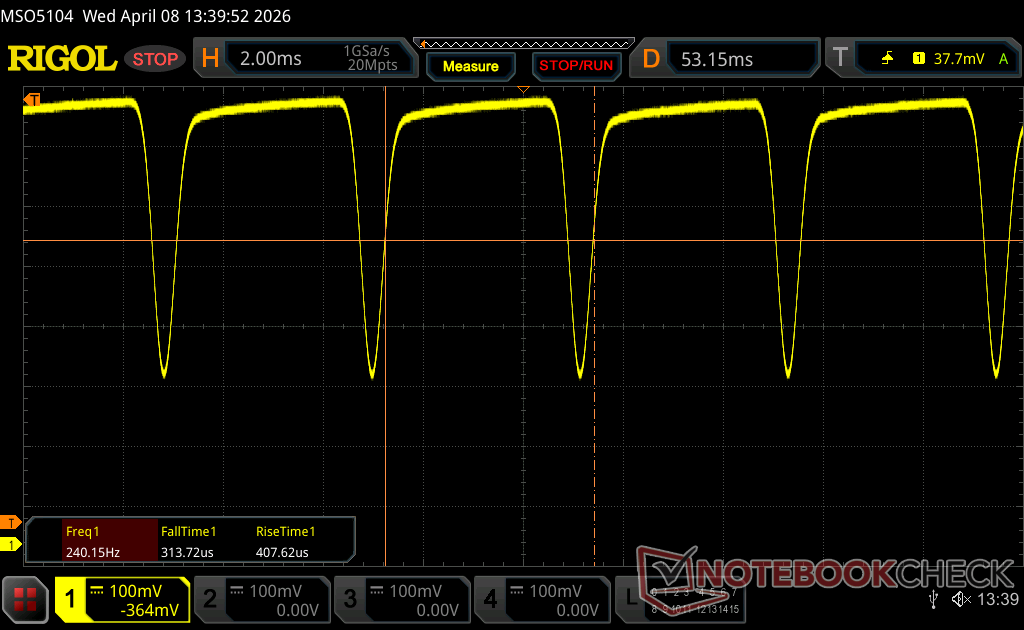 |
A kijelző háttérvilágítása 240.2 Hz-en villog (a legrosszabb esetben, pl. PWM használatával) Villódzás észlelve a 100 % vagy annál kisebb fényerő-beállításnál. E fényerő-beállítás felett nem lehet villogás vagy PWM. A 240.2 Hz frekvenciája viszonylag alacsony, így az érzékeny felhasználók valószínűleg villogást észlelnek, és megerőltetik a szemüket a megadott és az alatti fényerő-beállítás mellett. Összehasonlításképpen: az összes tesztelt eszköz 52 %-a nem használja a PWM-et a kijelző elsötétítésére. Ha PWM-et észleltek, akkor átlagosan 7763 (minimum: 5 - maximum: 343500) Hz-t mértek. | |||


Teljesítmény
Vizsgálati feltételek
Az alábbi összehasonlító tesztek futtatása előtt a Windowst és a Dell Optimizer-t teljesítmény üzemmódba állítottuk.
Processzor
A Core Ultra X7 358H 60-70 százalékos többszálú teljesítménynövekedést kínál az alap processzorhoz képest Core Ultra 5 325 vagy a Core Ultra 7 355 konfigurációkhoz képest. Sajnos a Turbo Boost fenntarthatósága nem tökéletes, amint azt az alábbi CineBench R15 xT stresszgrafikonunk is mutatja, ahol a teljesítmény az első néhány ciklus után körülbelül 15 százalékkal csökken. A konkurens Asus ExpertBook Ultra ugyanezzel a Core Ultra X7 CPU-val összehasonlítva gyorsabb órajeleket és teljesítményt képes fenntartani.
A Core Ultra 7 255H a régebbi Dell 16 Premiumban található Core Ultra X7 358H az újabb XPS 16-ban található Core Ultra X7 358H-nál jelentősen gyorsabb, ha többszálú terhelésről van szó.
Cinebench R15 Multi Loop
Cinebench R23: Multi Core | Single Core
Cinebench R20: CPU (Multi Core) | CPU (Single Core)
Cinebench R15: CPU Multi 64Bit | CPU Single 64Bit
Blender: v2.79 BMW27 CPU
7-Zip 18.03: 7z b 4 | 7z b 4 -mmt1
Geekbench 6.7: Multi-Core | Single-Core
Geekbench 5.5: Multi-Core | Single-Core
HWBOT x265 Benchmark v2.2: 4k Preset
LibreOffice : 20 Documents To PDF
R Benchmark 2.5: Overall mean
* ... a kisebb jobb
AIDA64: FP32 Ray-Trace | FPU Julia | CPU SHA3 | CPU Queen | FPU SinJulia | FPU Mandel | CPU AES | CPU ZLib | FP64 Ray-Trace | CPU PhotoWorxx | CPU CheckMate
| Performance rating | |
| Lenovo Yoga Pro 9 16IAH10 RTX 5050 -1! | |
| Dell XPS 16 9640 -1! | |
| Samsung Galaxy Book6 Pro -1! | |
| Dell XPS 16 Core Ultra X7 358H -1! | |
| Átlagos Intel Core Ultra X7 358H | |
| Dell XPS 16 Core Ultra 5 325 -1! | |
| HP Omnibook 5 16-af1037nr -1! | |
| AIDA64 / FP32 Ray-Trace | |
| Lenovo Yoga Pro 9 16IAH10 RTX 5050 (v6.92.6600) | |
| Dell XPS 16 9640 (v6.92.6600) | |
| Samsung Galaxy Book6 Pro (v8.20.8100) | |
| Dell XPS 16 Core Ultra X7 358H (v8.20.8100) | |
| Átlagos Intel Core Ultra X7 358H (12221 - 17932, n=8) | |
| Dell XPS 16 Core Ultra 5 325 (v8.20.8100) | |
| HP Omnibook 5 16-af1037nr (v6.92.6600) | |
| AIDA64 / FPU Julia | |
| Lenovo Yoga Pro 9 16IAH10 RTX 5050 (v6.92.6600) | |
| Dell XPS 16 9640 (v6.92.6600) | |
| Dell XPS 16 Core Ultra X7 358H (v8.20.8100) | |
| Samsung Galaxy Book6 Pro (v8.20.8100) | |
| Átlagos Intel Core Ultra X7 358H (29930 - 95525, n=8) | |
| Dell XPS 16 Core Ultra 5 325 (v8.20.8100) | |
| HP Omnibook 5 16-af1037nr (v6.92.6600) | |
| AIDA64 / CPU SHA3 | |
| Lenovo Yoga Pro 9 16IAH10 RTX 5050 (v6.92.6600) | |
| Átlagos Intel Core Ultra X7 358H (3910 - 4911, n=8) | |
| Dell XPS 16 Core Ultra X7 358H (v8.20.8100) | |
| Samsung Galaxy Book6 Pro (v8.20.8100) | |
| Dell XPS 16 9640 (v6.92.6600) | |
| Dell XPS 16 Core Ultra 5 325 (v8.20.8100) | |
| HP Omnibook 5 16-af1037nr (v6.92.6600) | |
| AIDA64 / CPU Queen | |
| Dell XPS 16 9640 (v6.92.6600) | |
| Lenovo Yoga Pro 9 16IAH10 RTX 5050 (v6.92.6600) | |
| Átlagos Intel Core Ultra X7 358H (63425 - 63827, n=2) | |
| HP Omnibook 5 16-af1037nr (v6.92.6600) | |
| AIDA64 / FPU SinJulia | |
| Dell XPS 16 9640 (v6.92.6600) | |
| Lenovo Yoga Pro 9 16IAH10 RTX 5050 (v6.92.6600) | |
| Samsung Galaxy Book6 Pro (v8.20.8100) | |
| Dell XPS 16 Core Ultra X7 358H (v8.20.8100) | |
| Átlagos Intel Core Ultra X7 358H (4735 - 7038, n=8) | |
| Dell XPS 16 Core Ultra 5 325 (v8.20.8100) | |
| HP Omnibook 5 16-af1037nr (v6.92.6600) | |
| AIDA64 / FPU Mandel | |
| Lenovo Yoga Pro 9 16IAH10 RTX 5050 (v6.92.6600) | |
| Dell XPS 16 Core Ultra X7 358H (v8.20.8100) | |
| Samsung Galaxy Book6 Pro (v8.20.8100) | |
| Dell XPS 16 9640 (v6.92.6600) | |
| Átlagos Intel Core Ultra X7 358H (14716 - 50734, n=8) | |
| Dell XPS 16 Core Ultra 5 325 (v8.20.8100) | |
| HP Omnibook 5 16-af1037nr (v6.92.6600) | |
| AIDA64 / CPU AES | |
| Dell XPS 16 9640 (v6.92.6600) | |
| Lenovo Yoga Pro 9 16IAH10 RTX 5050 (v6.92.6600) | |
| Samsung Galaxy Book6 Pro (v8.20.8100) | |
| Dell XPS 16 Core Ultra X7 358H (v8.20.8100) | |
| Átlagos Intel Core Ultra X7 358H (5127 - 67510, n=8) | |
| Dell XPS 16 Core Ultra 5 325 (v8.20.8100) | |
| HP Omnibook 5 16-af1037nr (v6.92.6600) | |
| AIDA64 / CPU ZLib | |
| Lenovo Yoga Pro 9 16IAH10 RTX 5050 (v6.92.6600) | |
| Dell XPS 16 9640 (v6.92.6600) | |
| Samsung Galaxy Book6 Pro (v8.20.8100) | |
| Átlagos Intel Core Ultra X7 358H (932 - 1179, n=8) | |
| Dell XPS 16 Core Ultra X7 358H (v8.20.8100) | |
| Dell XPS 16 Core Ultra 5 325 (v8.20.8100) | |
| HP Omnibook 5 16-af1037nr (v6.92.6600) | |
| AIDA64 / FP64 Ray-Trace | |
| Lenovo Yoga Pro 9 16IAH10 RTX 5050 (v6.92.6600) | |
| Dell XPS 16 9640 (v6.92.6600) | |
| Dell XPS 16 Core Ultra X7 358H (v8.20.8100) | |
| Samsung Galaxy Book6 Pro (v8.20.8100) | |
| Átlagos Intel Core Ultra X7 358H (6506 - 9447, n=8) | |
| Dell XPS 16 Core Ultra 5 325 (v8.20.8100) | |
| HP Omnibook 5 16-af1037nr (v6.92.6600) | |
| AIDA64 / CPU PhotoWorxx | |
| Dell XPS 16 Core Ultra X7 358H (v8.20.8100) | |
| Samsung Galaxy Book6 Pro (v8.20.8100) | |
| Átlagos Intel Core Ultra X7 358H (30538 - 88154, n=8) | |
| Lenovo Yoga Pro 9 16IAH10 RTX 5050 (v6.92.6600) | |
| Dell XPS 16 Core Ultra 5 325 (v8.20.8100) | |
| Dell XPS 16 9640 (v6.92.6600) | |
| HP Omnibook 5 16-af1037nr (v6.92.6600) | |
| AIDA64 / CPU CheckMate | |
| Átlagos Intel Core Ultra X7 358H (4187 - 4475, n=7) | |
| Dell XPS 16 Core Ultra X7 358H (v8.20.8100) | |
| Samsung Galaxy Book6 Pro (v8.20.8100) | |
| Dell XPS 16 Core Ultra 5 325 (v8.20.8100) | |
Rendszer teljesítménye
A PCMark eredmények jelentősen magasabbak, mint az alap Core Ultra 5 konfigurációé, különösen a GPU-hangsúlyos Digital Content Creation alteszt esetében, ami a Core Ultra X7 konfiguráció sokkal gyorsabb integrált grafikájának köszönhető. A RAM-teljesítmény is 25-40 százalékkal gyorsabb, ha 16 GB helyett 32 GB-os konfigurációt használunk az AIDA64 szerint.

PCMark 10: Score | Essentials | Productivity | Digital Content Creation
CrossMark: Overall | Productivity | Creativity | Responsiveness
WebXPRT 3: Overall
WebXPRT 4: Overall
Mozilla Kraken 1.1: Total
| Performance rating | |
| Dell XPS 16 Core Ultra X7 358H | |
| Lenovo Yoga Pro 9 16IAH10 RTX 5050 | |
| Átlagos Intel Core Ultra X7 358H, Intel Arc B390 12 Xe3 Panther Lake iGPU | |
| Samsung Galaxy Book6 Pro | |
| Dell XPS 16 9640 -1! | |
| Dell XPS 16 Core Ultra 5 325 | |
| HP Omnibook 5 16-af1037nr | |
| PCMark 10 / Score | |
| Dell XPS 16 Core Ultra X7 358H | |
| Lenovo Yoga Pro 9 16IAH10 RTX 5050 | |
| Átlagos Intel Core Ultra X7 358H, Intel Arc B390 12 Xe3 Panther Lake iGPU (8834 - 9880, n=8) | |
| Samsung Galaxy Book6 Pro | |
| Dell XPS 16 Core Ultra 5 325 | |
| HP Omnibook 5 16-af1037nr | |
| Dell XPS 16 9640 | |
| PCMark 10 / Essentials | |
| Dell XPS 16 Core Ultra X7 358H | |
| Átlagos Intel Core Ultra X7 358H, Intel Arc B390 12 Xe3 Panther Lake iGPU (10282 - 11263, n=7) | |
| Lenovo Yoga Pro 9 16IAH10 RTX 5050 | |
| Dell XPS 16 9640 | |
| Samsung Galaxy Book6 Pro | |
| Dell XPS 16 Core Ultra 5 325 | |
| HP Omnibook 5 16-af1037nr | |
| PCMark 10 / Productivity | |
| Lenovo Yoga Pro 9 16IAH10 RTX 5050 | |
| Dell XPS 16 Core Ultra X7 358H | |
| Samsung Galaxy Book6 Pro | |
| Átlagos Intel Core Ultra X7 358H, Intel Arc B390 12 Xe3 Panther Lake iGPU (13908 - 16780, n=7) | |
| HP Omnibook 5 16-af1037nr | |
| Dell XPS 16 Core Ultra 5 325 | |
| Dell XPS 16 9640 | |
| PCMark 10 / Digital Content Creation | |
| Dell XPS 16 Core Ultra X7 358H | |
| Átlagos Intel Core Ultra X7 358H, Intel Arc B390 12 Xe3 Panther Lake iGPU (13082 - 13893, n=7) | |
| Lenovo Yoga Pro 9 16IAH10 RTX 5050 | |
| Samsung Galaxy Book6 Pro | |
| Dell XPS 16 9640 | |
| Dell XPS 16 Core Ultra 5 325 | |
| HP Omnibook 5 16-af1037nr | |
| CrossMark / Overall | |
| Dell XPS 16 Core Ultra X7 358H | |
| Átlagos Intel Core Ultra X7 358H, Intel Arc B390 12 Xe3 Panther Lake iGPU (1884 - 2119, n=8) | |
| Lenovo Yoga Pro 9 16IAH10 RTX 5050 | |
| Samsung Galaxy Book6 Pro | |
| Dell XPS 16 9640 | |
| Dell XPS 16 Core Ultra 5 325 | |
| HP Omnibook 5 16-af1037nr | |
| CrossMark / Productivity | |
| Dell XPS 16 Core Ultra X7 358H | |
| Lenovo Yoga Pro 9 16IAH10 RTX 5050 | |
| Átlagos Intel Core Ultra X7 358H, Intel Arc B390 12 Xe3 Panther Lake iGPU (1678 - 1928, n=8) | |
| Samsung Galaxy Book6 Pro | |
| Dell XPS 16 9640 | |
| Dell XPS 16 Core Ultra 5 325 | |
| HP Omnibook 5 16-af1037nr | |
| CrossMark / Creativity | |
| Dell XPS 16 Core Ultra X7 358H | |
| Átlagos Intel Core Ultra X7 358H, Intel Arc B390 12 Xe3 Panther Lake iGPU (2241 - 2529, n=8) | |
| Samsung Galaxy Book6 Pro | |
| Lenovo Yoga Pro 9 16IAH10 RTX 5050 | |
| Dell XPS 16 9640 | |
| Dell XPS 16 Core Ultra 5 325 | |
| HP Omnibook 5 16-af1037nr | |
| CrossMark / Responsiveness | |
| Dell XPS 16 Core Ultra X7 358H | |
| Dell XPS 16 9640 | |
| Átlagos Intel Core Ultra X7 358H, Intel Arc B390 12 Xe3 Panther Lake iGPU (1560 - 1837, n=8) | |
| Lenovo Yoga Pro 9 16IAH10 RTX 5050 | |
| Samsung Galaxy Book6 Pro | |
| Dell XPS 16 Core Ultra 5 325 | |
| HP Omnibook 5 16-af1037nr | |
| WebXPRT 3 / Overall | |
| Lenovo Yoga Pro 9 16IAH10 RTX 5050 | |
| Átlagos Intel Core Ultra X7 358H, Intel Arc B390 12 Xe3 Panther Lake iGPU (293 - 338, n=8) | |
| Dell XPS 16 Core Ultra X7 358H | |
| HP Omnibook 5 16-af1037nr | |
| Samsung Galaxy Book6 Pro | |
| Dell XPS 16 9640 | |
| Dell XPS 16 Core Ultra 5 325 | |
| WebXPRT 4 / Overall | |
| Lenovo Yoga Pro 9 16IAH10 RTX 5050 | |
| Dell XPS 16 Core Ultra X7 358H | |
| Átlagos Intel Core Ultra X7 358H, Intel Arc B390 12 Xe3 Panther Lake iGPU (278 - 305, n=7) | |
| HP Omnibook 5 16-af1037nr | |
| Samsung Galaxy Book6 Pro | |
| Dell XPS 16 Core Ultra 5 325 | |
| Dell XPS 16 9640 | |
| Mozilla Kraken 1.1 / Total | |
| HP Omnibook 5 16-af1037nr | |
| Dell XPS 16 Core Ultra 5 325 | |
| Samsung Galaxy Book6 Pro | |
| Átlagos Intel Core Ultra X7 358H, Intel Arc B390 12 Xe3 Panther Lake iGPU (445 - 460, n=8) | |
| Dell XPS 16 Core Ultra X7 358H | |
| Lenovo Yoga Pro 9 16IAH10 RTX 5050 | |
* ... a kisebb jobb
| PCMark 10 Score | 9717 pontok | |
Segítség | ||
| AIDA64 / Memory Copy | |
| Dell XPS 16 Core Ultra X7 358H | |
| Samsung Galaxy Book6 Pro | |
| Átlagos Intel Core Ultra X7 358H (102745 - 132135, n=7) | |
| Dell XPS 16 Core Ultra 5 325 | |
| Lenovo Yoga Pro 9 16IAH10 RTX 5050 | |
| Dell XPS 16 9640 | |
| HP Omnibook 5 16-af1037nr | |
| AIDA64 / Memory Read | |
| Dell XPS 16 Core Ultra X7 358H | |
| Samsung Galaxy Book6 Pro | |
| Átlagos Intel Core Ultra X7 358H (97755 - 118888, n=8) | |
| Lenovo Yoga Pro 9 16IAH10 RTX 5050 | |
| Dell XPS 16 Core Ultra 5 325 | |
| Dell XPS 16 9640 | |
| HP Omnibook 5 16-af1037nr | |
| AIDA64 / Memory Write | |
| Dell XPS 16 Core Ultra X7 358H | |
| Átlagos Intel Core Ultra X7 358H (105984 - 134998, n=8) | |
| Samsung Galaxy Book6 Pro | |
| Dell XPS 16 Core Ultra 5 325 | |
| Lenovo Yoga Pro 9 16IAH10 RTX 5050 | |
| Dell XPS 16 9640 | |
| HP Omnibook 5 16-af1037nr | |
| AIDA64 / Memory Latency | |
| HP Omnibook 5 16-af1037nr | |
| Dell XPS 16 9640 | |
| Lenovo Yoga Pro 9 16IAH10 RTX 5050 | |
| Dell XPS 16 Core Ultra 5 325 | |
| Samsung Galaxy Book6 Pro | |
| Dell XPS 16 Core Ultra X7 358H | |
| Átlagos Intel Core Ultra X7 358H (84.6 - 101.9, n=8) | |
* ... a kisebb jobb
DPC késleltetés


| DPC Latencies / LatencyMon - interrupt to process latency (max), Web, Youtube, Prime95 | |
| Lenovo Yoga Pro 9 16IAH10 RTX 5050 | |
| Dell XPS 16 Core Ultra 5 325 | |
| HP Omnibook 5 16-af1037nr | |
| Dell XPS 16 9640 | |
| Dell XPS 16 Core Ultra X7 358H | |
| Samsung Galaxy Book6 Pro | |
* ... a kisebb jobb
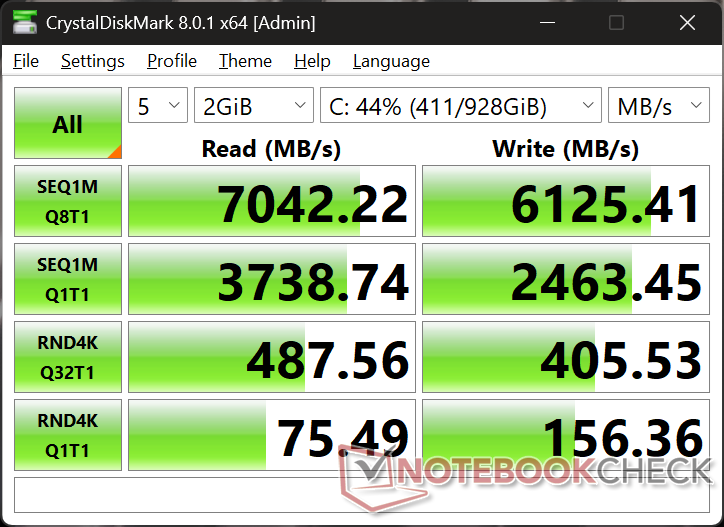
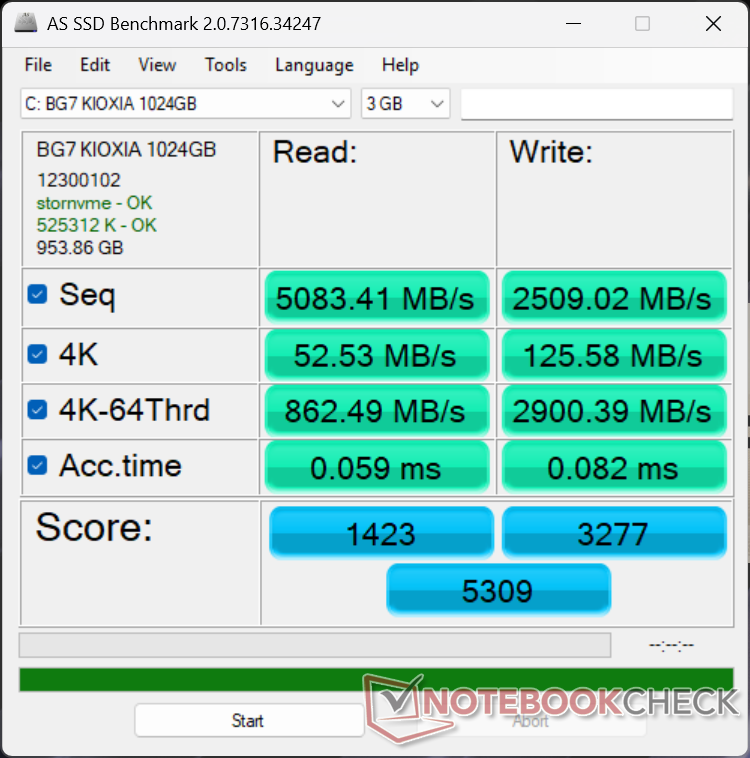
Tárolóeszközök
A tesztegységünkhöz egy Kioxia BG7 a Core Ultra 5 konfigurációnkban található BG8 vagy BG6 helyett, vagy 2025 Dell 16 Premium, illetve. A teljesítmény egyébként közel azonos a kettő között, a maximális fenntartható átviteli sebesség 7000 MB/s körül van.


| Drive Performance rating - Percent | |
| Dell XPS 16 9640 | |
| Lenovo Yoga Pro 9 16IAH10 RTX 5050 | |
| Dell XPS 16 Core Ultra X7 358H | |
| Samsung Galaxy Book6 Pro | |
| Dell XPS 16 Core Ultra 5 325 | |
| HP Omnibook 5 16-af1037nr | |
* ... a kisebb jobb
Lemezduguláscsökkentés: DiskSpd Read Loop, Queue Depth 8
GPU teljesítmény
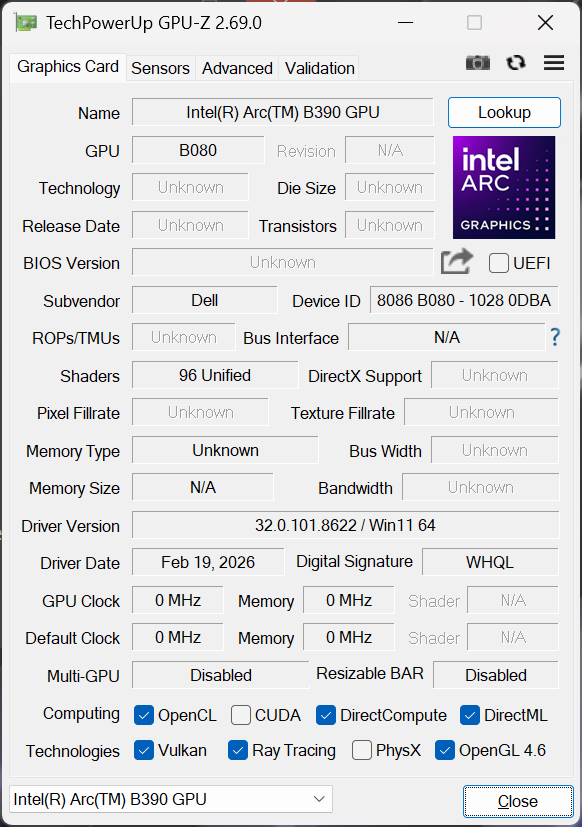
Az integrált Arc B390 jelentősen gyorsabb, mint az alap Grafikus 4 Xe3 opció a Core Ultra 5 konfigurációban. Ez a leggyorsabb GPU a 2026 XPS 16-hoz, mivel a diszkrét Nvidia opciók már nem konfigurálhatók. A felhasználók 2,5-szeres nyers teljesítménynövekedésre számíthatnak a Graphics 4 Xe3-hoz képest, vagy 30 százalékos nyers teljesítménycsökkenésre a régebbi XPS 16-hoz képest, a következővel együtt RTX 4070 grafikával. Ennek ellenére elég erős ahhoz, hogy a legtöbb modern címet 1080p-n, közepes beállítások mellett futtassa, beleértve a Black Myth: Wukongot is.
A Teljesítmény üzemmód helyett Kiegyensúlyozott módban való futtatás nem befolyásolja jelentősen a teljesítményt. Eközben az akkumulátoros üzemmódban való futtatás csak kismértékben, akár 10 százalékkal csökkenti a teljesítményt, amint azt az alábbi Fire Strike eredménytáblázatunk is mutatja.
| Teljesítményprofil | Grafikai pontszám | Fizikai pontszám | Kombinált pontszám |
| Teljesítmény mód | 17018 | 22086 | 4859 |
| Kiegyensúlyozott mód | 16785 (-1%) | 22887 (+4%) | 4467 (-8%) |
| Akkumulátor teljesítmény | 15685 (-8%) | 20760 (-6%) | 4269 (-12%) |
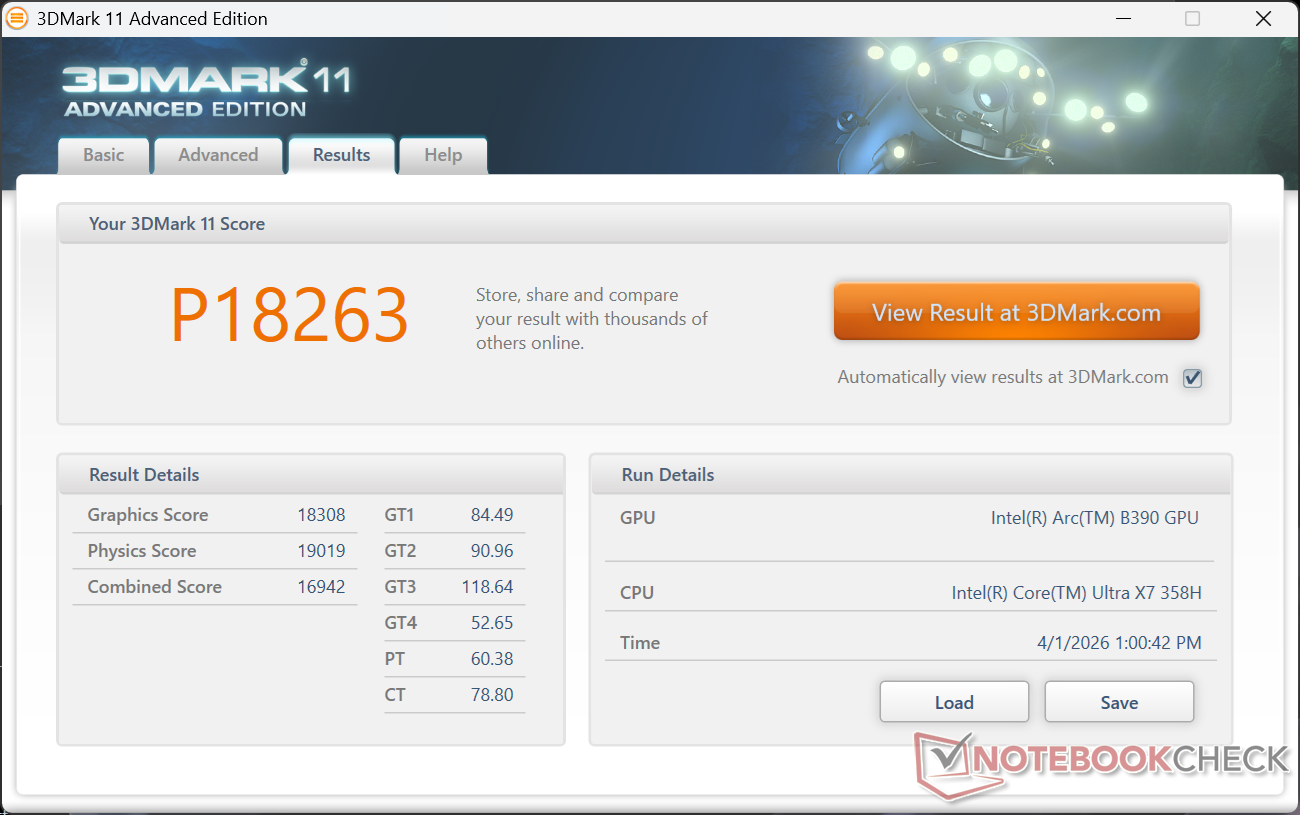


| 3DMark 11 Performance | 18263 pontok | |
| 3DMark Cloud Gate Standard Score | 39015 pontok | |
| 3DMark Fire Strike Score | 13997 pontok | |
| 3DMark Time Spy Score | 7436 pontok | |
Segítség | ||
* ... a kisebb jobb
| Performance rating - Percent | |
| Lenovo Yoga Pro 9 16IAH10 RTX 5050 | |
| Dell XPS 16 9640 | |
| Dell XPS 16 Core Ultra X7 358H | |
| Samsung Galaxy Book6 Pro | |
| Dell XPS 16 Core Ultra 5 325 | |
| HP Omnibook 5 16-af1037nr | |
| Cyberpunk 2077 - 1920x1080 Ultra Preset (FSR off) | |
| Lenovo Yoga Pro 9 16IAH10 RTX 5050 | |
| Dell XPS 16 9640 | |
| Dell XPS 16 Core Ultra X7 358H | |
| Samsung Galaxy Book6 Pro | |
| Dell XPS 16 Core Ultra 5 325 | |
| HP Omnibook 5 16-af1037nr | |
| Baldur's Gate 3 - 1920x1080 Ultra Preset AA:T | |
| Lenovo Yoga Pro 9 16IAH10 RTX 5050 | |
| Dell XPS 16 9640 | |
| Dell XPS 16 Core Ultra X7 358H | |
| Samsung Galaxy Book6 Pro | |
| Dell XPS 16 Core Ultra 5 325 | |
| HP Omnibook 5 16-af1037nr | |
| GTA V - 1920x1080 Highest AA:4xMSAA + FX AF:16x | |
| Lenovo Yoga Pro 9 16IAH10 RTX 5050 | |
| Dell XPS 16 9640 | |
| Dell XPS 16 Core Ultra X7 358H | |
| Samsung Galaxy Book6 Pro | |
| Dell XPS 16 Core Ultra 5 325 | |
| HP Omnibook 5 16-af1037nr | |
| Final Fantasy XV Benchmark - 1920x1080 High Quality | |
| Lenovo Yoga Pro 9 16IAH10 RTX 5050 | |
| Dell XPS 16 9640 | |
| Dell XPS 16 Core Ultra X7 358H | |
| Samsung Galaxy Book6 Pro | |
| Dell XPS 16 Core Ultra 5 325 | |
| HP Omnibook 5 16-af1037nr | |
| Strange Brigade - 1920x1080 ultra AA:ultra AF:16 | |
| Lenovo Yoga Pro 9 16IAH10 RTX 5050 | |
| Dell XPS 16 9640 | |
| Dell XPS 16 Core Ultra X7 358H | |
| Samsung Galaxy Book6 Pro | |
| Dell XPS 16 Core Ultra 5 325 | |
| HP Omnibook 5 16-af1037nr | |
| Dota 2 Reborn - 1920x1080 ultra (3/3) best looking | |
| Lenovo Yoga Pro 9 16IAH10 RTX 5050 | |
| Dell XPS 16 Core Ultra X7 358H | |
| Dell XPS 16 9640 | |
| Samsung Galaxy Book6 Pro | |
| Dell XPS 16 Core Ultra 5 325 | |
| HP Omnibook 5 16-af1037nr | |
| X-Plane 11.11 - 1920x1080 high (fps_test=3) | |
| Lenovo Yoga Pro 9 16IAH10 RTX 5050 | |
| Dell XPS 16 9640 | |
| Dell XPS 16 9640 | |
| Dell XPS 16 Core Ultra X7 358H | |
| Samsung Galaxy Book6 Pro | |
| HP Omnibook 5 16-af1037nr | |
| Dell XPS 16 Core Ultra 5 325 | |
Cyberpunk 2077 ultra FPS Diagram
| alacsony | közepes | magas | ultra | |
|---|---|---|---|---|
| GTA V (2015) | 182 | 176.1 | 103.3 | 45.2 |
| Dota 2 Reborn (2015) | 112.9 | 91.6 | 100.2 | 96.9 |
| Final Fantasy XV Benchmark (2018) | 131.1 | 79.7 | 56.2 | |
| X-Plane 11.11 (2018) | 55.9 | 47.6 | 38.8 | |
| Strange Brigade (2018) | 359 | 130.5 | 104 | 90.6 |
| Baldur's Gate 3 (2023) | 72.3 | 62.3 | 55.6 | 54.3 |
| Cyberpunk 2077 (2023) | 80.4 | 65.4 | 56 | 48.7 |
| F1 24 (2024) | 142.7 | 135.3 | 103.4 | 36.8 |
| Black Myth: Wukong (2024) | 47 | 37 | 29 | 16 |
Kibocsátás
Rendszerzaj
A ventilátor fordulatszáma az alap Core Ultra 5 konfigurációhoz képest könnyebben nő, ami összhangban van a Core Ultra X7 rendszer általánosan magasabb energiafogyasztásával. A 3DMark 06 futtatásakor például a ventilátor zaja 38 dB(A) volt, szemben a Core Ultra 5 SKU 34 dB(A) értékével.
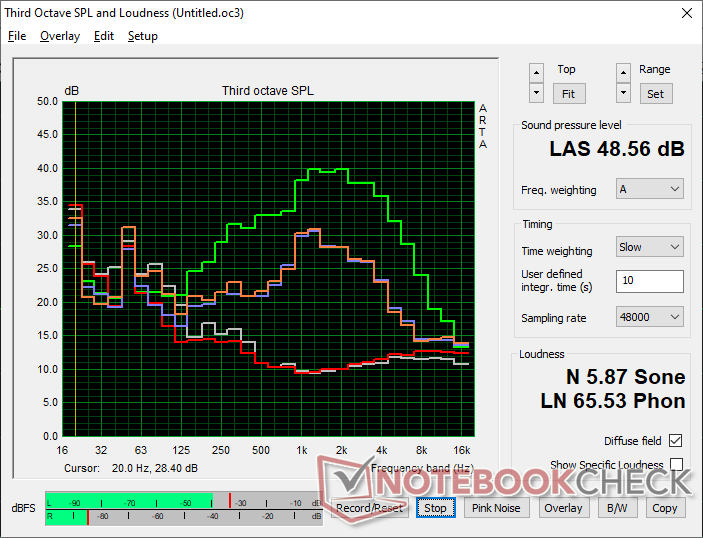
Zajszint
| Üresjárat |
| 23.4 / 23.4 / 25.8 dB(A) |
| Terhelés |
| 38 / 48.6 dB(A) |
 | ||
30 dB csendes 40 dB(A) hallható 50 dB(A) hangos |
||
min: | ||
| Dell XPS 16 Core Ultra X7 358H Ultra X7 358H, Arc B390 Panther Lake iGPU | Dell XPS 16 Core Ultra 5 325 Ultra 5 325, Intel Graphics 4 Xe3 PTL | Dell XPS 16 9640 Ultra 7 155H, GeForce RTX 4070 Laptop GPU | Samsung Galaxy Book6 Pro Ultra 7 356H, Intel Graphics 4 Xe3 PTL | Lenovo Yoga Pro 9 16IAH10 RTX 5050 Ultra 9 285H, GeForce RTX 5050 Laptop | HP Omnibook 5 16-af1037nr Ultra 7 255U, Graphics 4-Core iGPU (Arrow Lake) | |
|---|---|---|---|---|---|---|
| Noise | 5% | -5% | 2% | -7% | 13% | |
| off / környezet * (dB) | 23.3 | 22.8 2% | 24.5 -5% | 25.3 -9% | 24.6 -6% | 23.3 -0% |
| Idle Minimum * (dB) | 23.4 | 22.9 2% | 24.5 -5% | 25.3 -8% | 24.6 -5% | 23.5 -0% |
| Idle Average * (dB) | 23.4 | 22.9 2% | 24.5 -5% | 25.3 -8% | 24.6 -5% | 23.5 -0% |
| Idle Maximum * (dB) | 25.8 | 23.9 7% | 27.5 -7% | 25.3 2% | 26.8 -4% | 24.4 5% |
| Load Average * (dB) | 38 | 34.8 8% | 39.6 -4% | 31.8 16% | 32.8 14% | 25.8 32% |
| Cyberpunk 2077 ultra * (dB) | 38.1 | 38 -0% | 38.4 -1% | 51.8 -36% | 26.2 31% | |
| Load Maximum * (dB) | 48.6 | 43.3 11% | 49.7 -2% | 38.4 21% | 51.8 -7% | 39 20% |
| Witcher 3 ultra * (dB) | 49.7 |
* ... a kisebb jobb
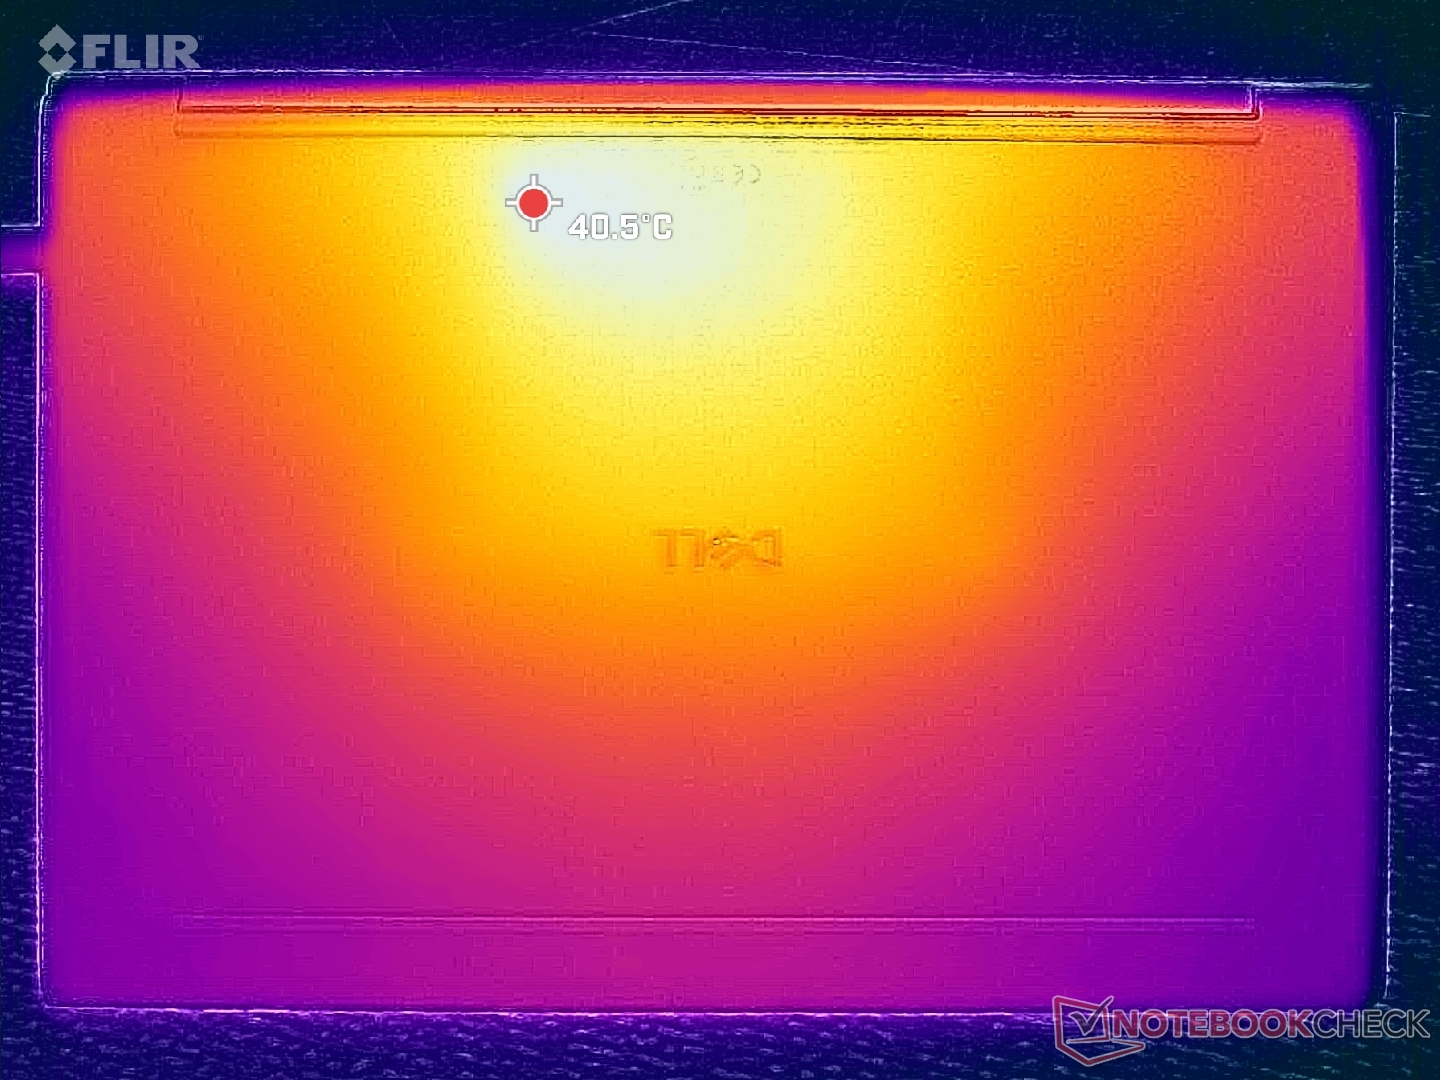
Hőmérséklet
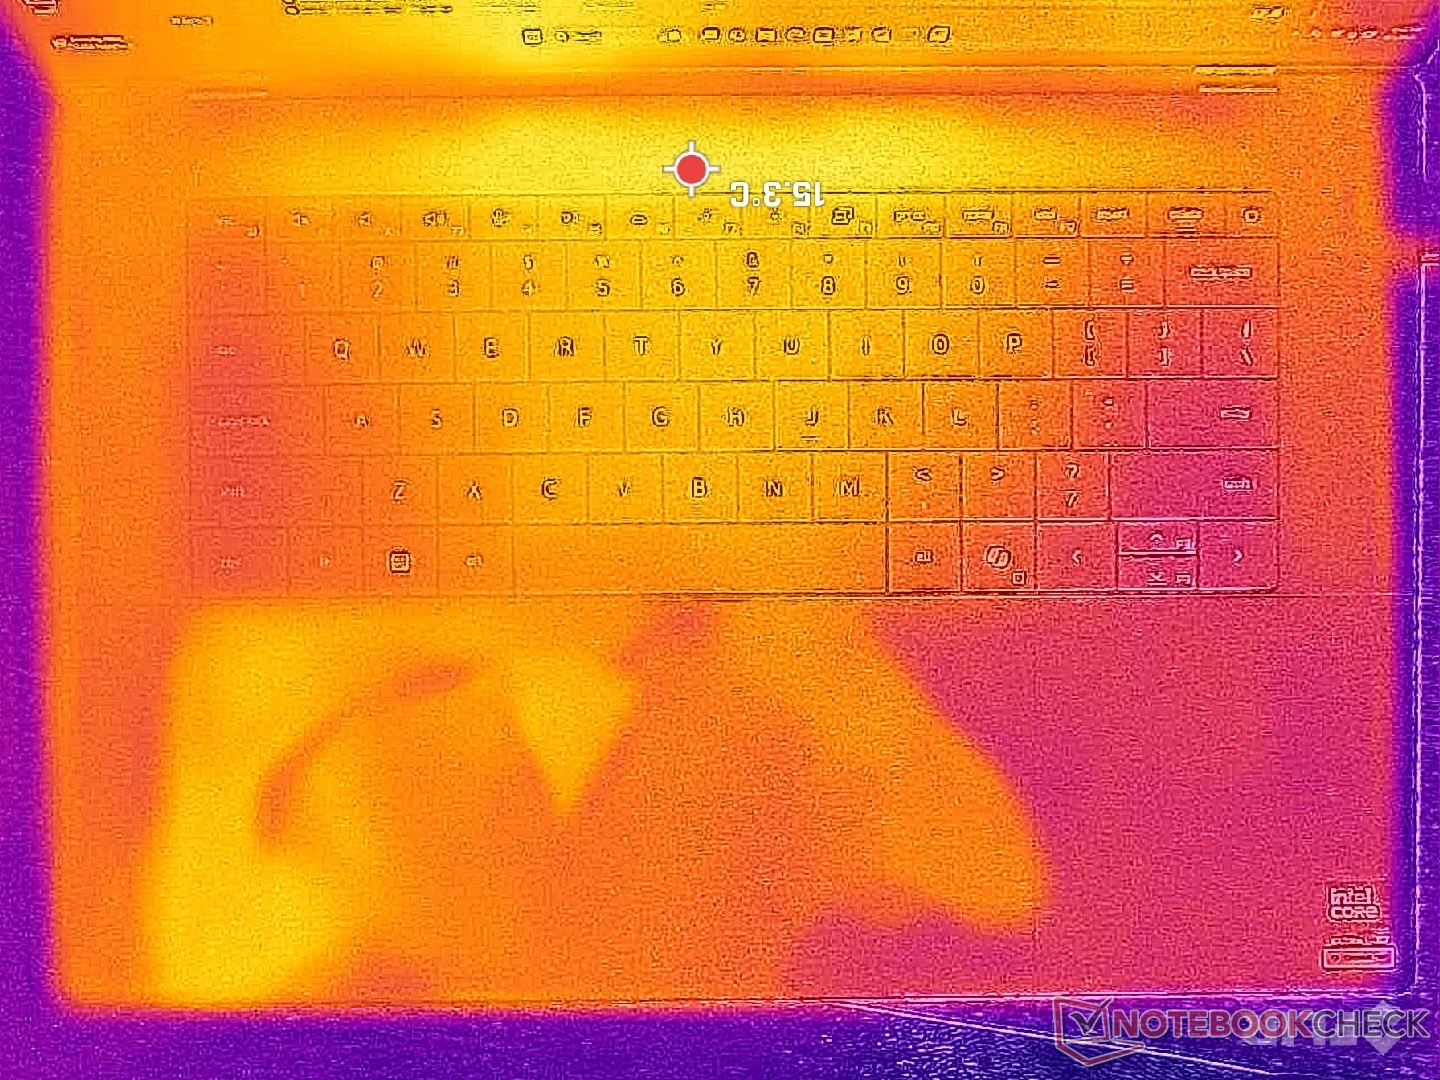
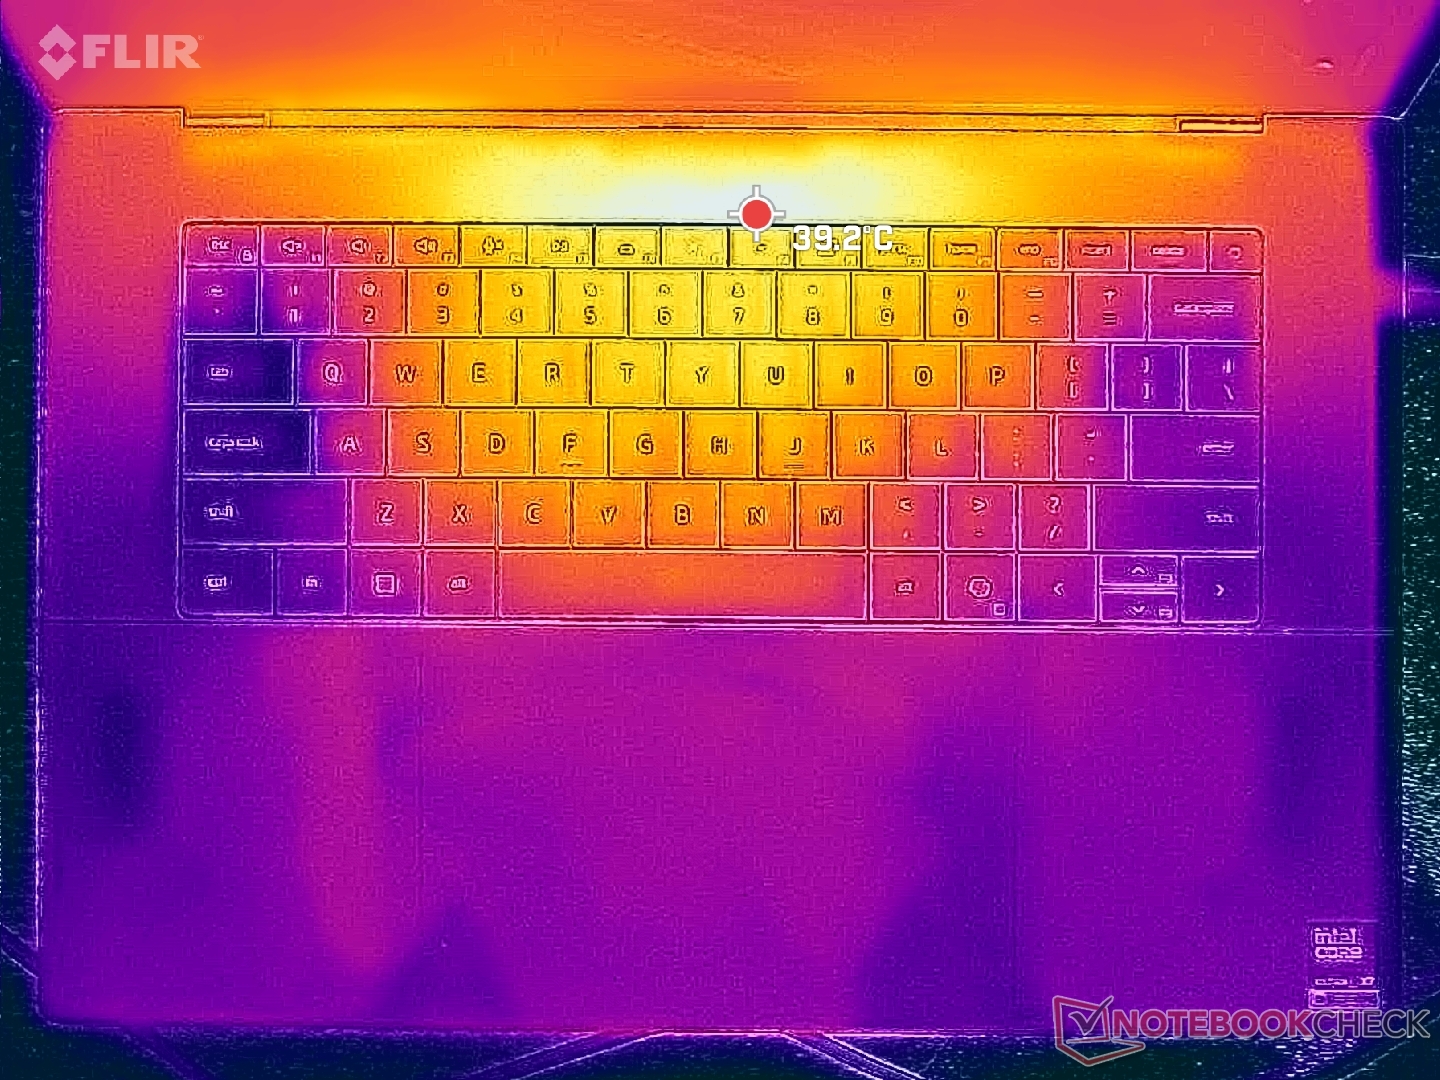
A felületi hőmérséklet átlagosan hűvösebb a régebbi, de vastagabb XPS 16 9640-hez képest, amely gyorsabb RTX 4070 grafikával rendelkezik. A forró pontok ennek ellenére a billentyűzet közepének közelében a hasonló 40 C-os tartományban tetőznek.
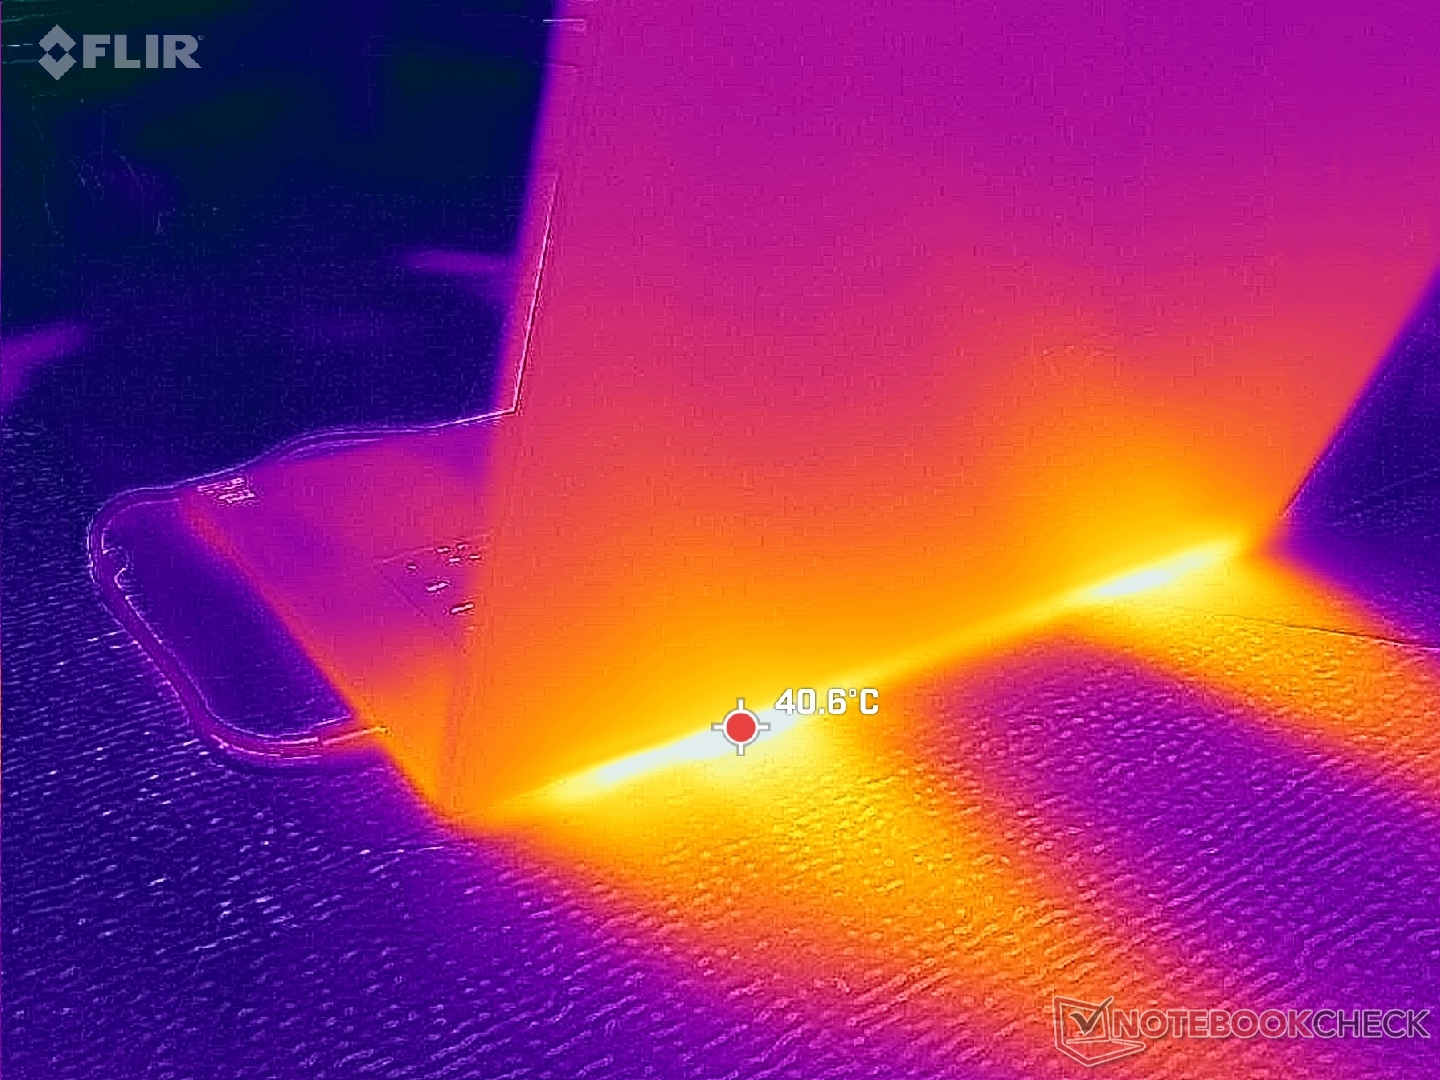
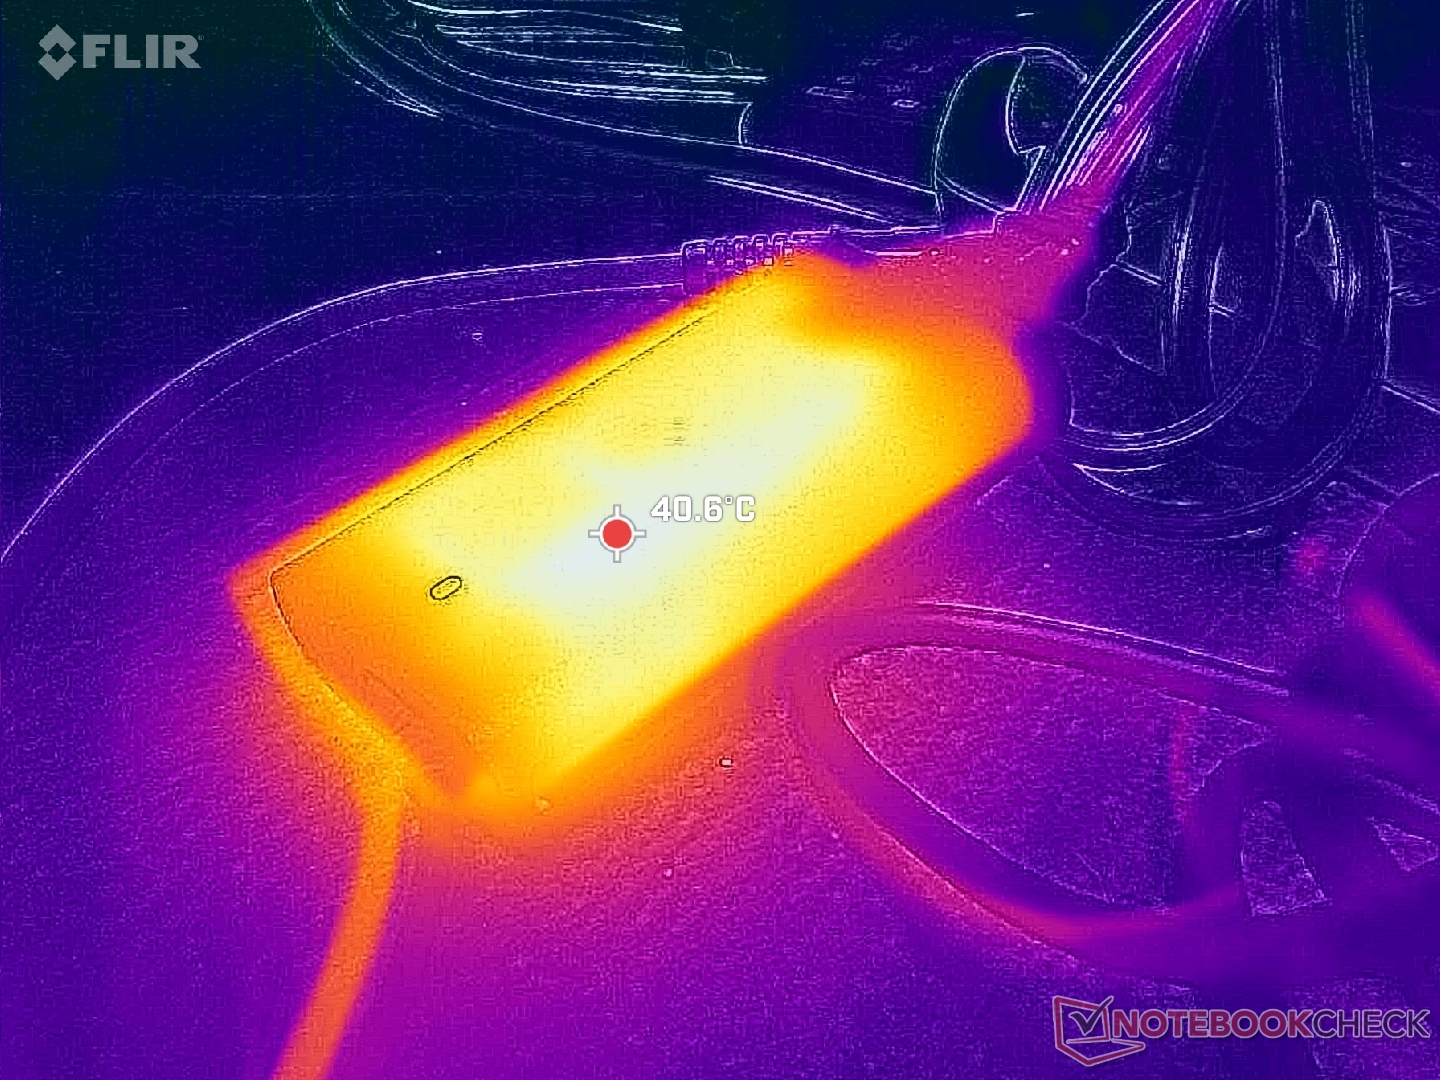
(±) A felső oldalon a maximális hőmérséklet 40.6 °C / 105 F, összehasonlítva a 36.8 °C / 98 F átlagával , 21 és 71 °C között a Multimedia osztálynál.
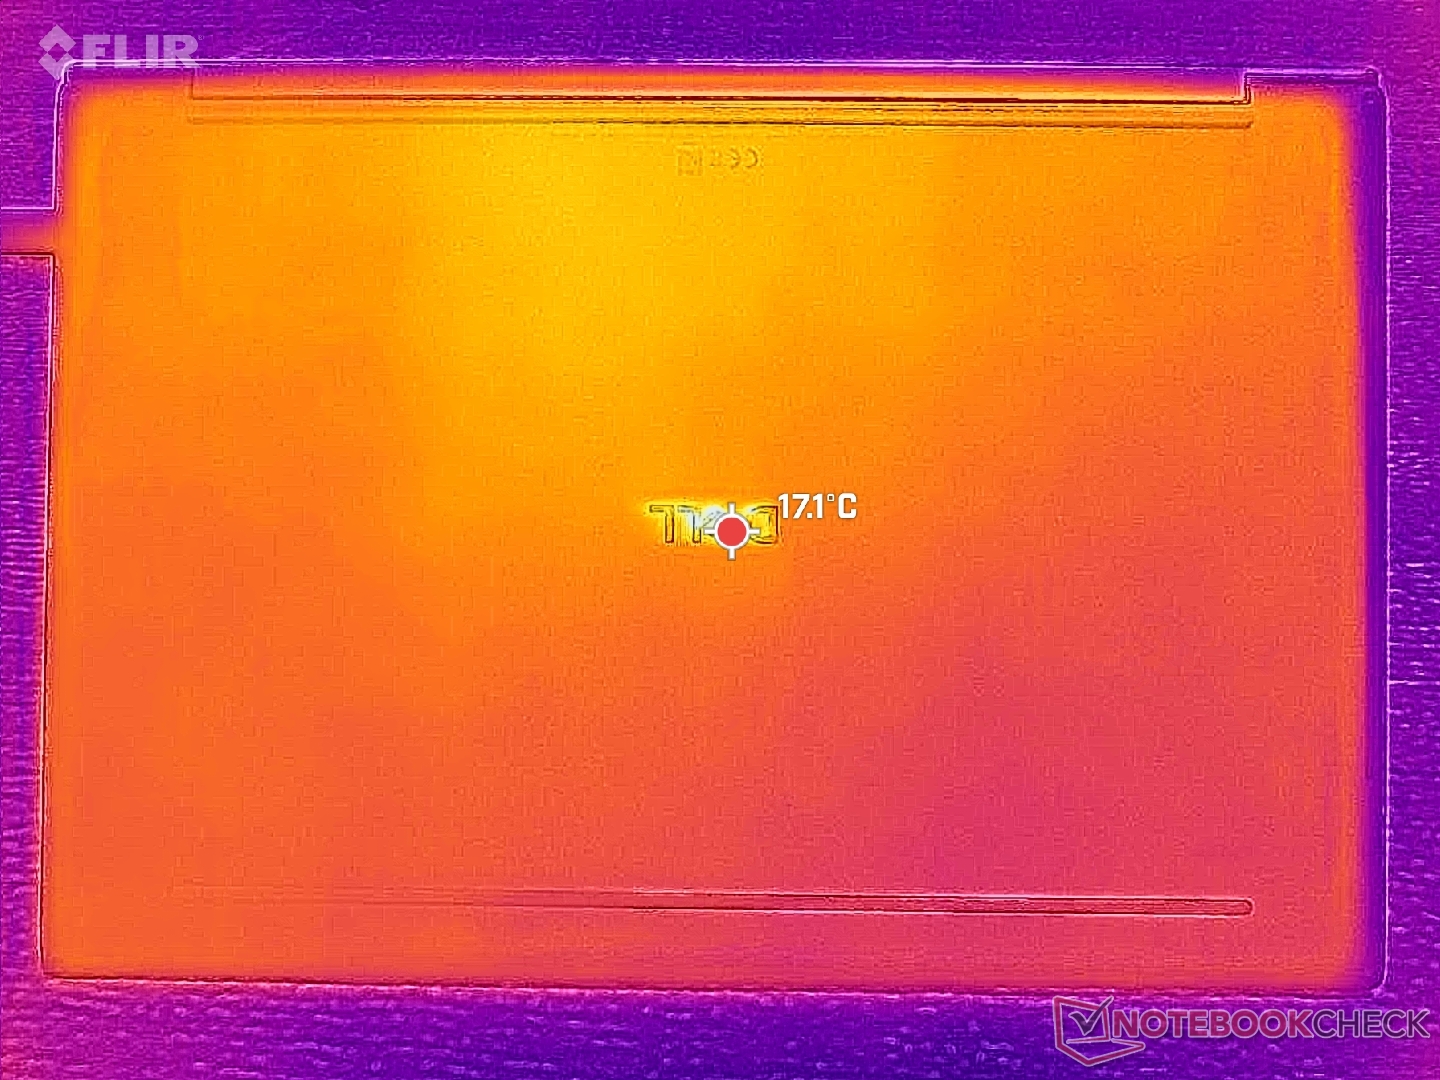
(+) Az alsó maximum 39.8 °C / 104 F-ig melegszik fel, összehasonlítva a 39.1 °C / 102 F átlagával
(+) Üresjáratban a felső oldal átlagos hőmérséklete 22.3 °C / 72 F, összehasonlítva a 31.3 °C / ### eszközátlaggal class_avg_f### F.
(+) A csuklótámasz és az érintőpad hűvösebb, mint a bőr hőmérséklete, maximum 25.6 °C / 78.1 F, ezért hűvös tapintású.
(+) A hasonló eszközök csuklótámasz területének átlagos hőmérséklete 28.7 °C / 83.7 F volt (+3.1 °C / 5.6 F).
| Dell XPS 16 Core Ultra X7 358H Ultra X7 358H, Arc B390 Panther Lake iGPU | Dell XPS 16 Core Ultra 5 325 Ultra 5 325, Intel Graphics 4 Xe3 PTL | Dell XPS 16 9640 Ultra 7 155H, GeForce RTX 4070 Laptop GPU | Samsung Galaxy Book6 Pro Ultra 7 356H, Intel Graphics 4 Xe3 PTL | Lenovo Yoga Pro 9 16IAH10 RTX 5050 Ultra 9 285H, GeForce RTX 5050 Laptop | HP Omnibook 5 16-af1037nr Ultra 7 255U, Graphics 4-Core iGPU (Arrow Lake) | |
|---|---|---|---|---|---|---|
| Heat | -3% | -7% | 3% | -12% | 6% | |
| Maximum Upper Side * (°C) | 40.6 | 43.8 -8% | 39.4 3% | 37.8 7% | 34.4 15% | 28 31% |
| Maximum Bottom * (°C) | 39.8 | 42 -6% | 36.9 7% | 40.1 -1% | 41.4 -4% | 33.2 17% |
| Idle Upper Side * (°C) | 23.2 | 23.2 -0% | 28.2 -22% | 22.6 3% | 28.6 -23% | 24.6 -6% |
| Idle Bottom * (°C) | 23.8 | 23.6 1% | 27.4 -15% | 22.8 4% | 31.8 -34% | 27.8 -17% |
* ... a kisebb jobb
Stressz teszt
A CPU a Prime95 stressz futtatásakor 2,9 GHz-re, 69 W-ra és 100 C-ra gyorsul, majd néhány másodperccel később 2,2 GHz-re, 40 W-ra és 78 C-ra esik vissza, ami a korlátozott Turbo Boost fenntarthatóságot jelképezi. A fojtás kiegészíti a fenti CineBench R15 xT cikluseredményeinket és az alábbi energiafogyasztási viselkedést.
Talán még feltűnőbb, hogy a mag hőmérséklete terhelés alatt hűvösebb, mint az XPS 16 lassabb Core Ultra 5 konfigurációjánál. A CPU a Prime95 és a Cyberpunk 2077 futtatása során 78 C-on és 68 C-on stabilizálódna, szemben a Core Ultra 5 XPS 16 86 C és 89 C-os értékével.


| CPU órajel (GHz) | GPU órajel (MHz) | CPU átlaghőmérséklet (°C) | |
| Rendszer üresjáratban | -- | -- | 44 |
| Prime95 Stressz | 2,1 | 900 | 78 |
| Prime95 + FurMark Stressz | 1,7 | 1350 | 71 |
| Cyberpunk 2077 Stressz | 0,87 | 2150 | 68 |
Hangszórók
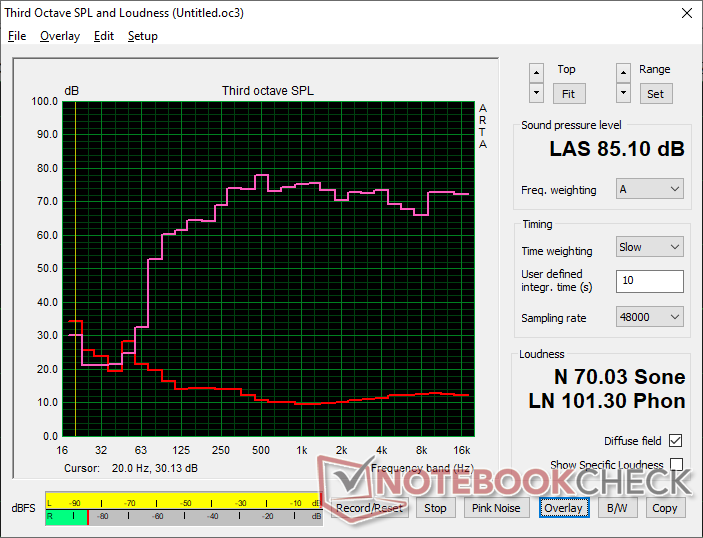
Dell XPS 16 Core Ultra X7 358H hangelemzés
(+) | a hangszórók viszonylag hangosan tudnak játszani (85.1 dB)
Basszus 100 - 315 Hz
(±) | csökkentett basszus – átlagosan 7.6%-kal alacsonyabb, mint a medián
(+) | a basszus lineáris (6.1% delta az előző frekvenciához)
Közepes 400-2000 Hz
(+) | kiegyensúlyozott középpontok – csak 2.1% választja el a mediántól
(+) | a középpontok lineárisak (3.4% delta az előző frekvenciához)
Maximum 2-16 kHz
(+) | kiegyensúlyozott csúcsok – csak 2.3% választja el a mediántól
(+) | a csúcsok lineárisak (4.1% delta az előző frekvenciához képest)
Összességében 100 - 16.000 Hz
(+) | általános hangzás lineáris (6.2% eltérés a mediánhoz képest)
Ugyanazon osztályhoz képest
» 3%Ebben az osztályban az összes tesztelt eszköz %-a jobb volt, 0% hasonló, 96%-kal rosszabb
» A legjobb delta értéke 5%, az átlag 17%, a legrosszabb 45% volt
Az összes tesztelt eszközzel összehasonlítva
» 0% az összes tesztelt eszköz jobb volt, 0% hasonló, 99%-kal rosszabb
» A legjobb delta értéke 4%, az átlag 23%, a legrosszabb 134% volt
Apple MacBook Pro 16 2021 M1 Pro hangelemzés
(+) | a hangszórók viszonylag hangosan tudnak játszani (84.7 dB)
Basszus 100 - 315 Hz
(+) | jó basszus – csak 3.8% választja el a mediántól
(+) | a basszus lineáris (5.2% delta az előző frekvenciához)
Közepes 400-2000 Hz
(+) | kiegyensúlyozott középpontok – csak 1.3% választja el a mediántól
(+) | a középpontok lineárisak (2.1% delta az előző frekvenciához)
Maximum 2-16 kHz
(+) | kiegyensúlyozott csúcsok – csak 1.9% választja el a mediántól
(+) | a csúcsok lineárisak (2.7% delta az előző frekvenciához képest)
Összességében 100 - 16.000 Hz
(+) | általános hangzás lineáris (4.6% eltérés a mediánhoz képest)
Ugyanazon osztályhoz képest
» 0%Ebben az osztályban az összes tesztelt eszköz %-a jobb volt, 0% hasonló, 100%-kal rosszabb
» A legjobb delta értéke 5%, az átlag 17%, a legrosszabb 45% volt
Az összes tesztelt eszközzel összehasonlítva
» 0% az összes tesztelt eszköz jobb volt, 0% hasonló, 100%-kal rosszabb
» A legjobb delta értéke 4%, az átlag 23%, a legrosszabb 134% volt
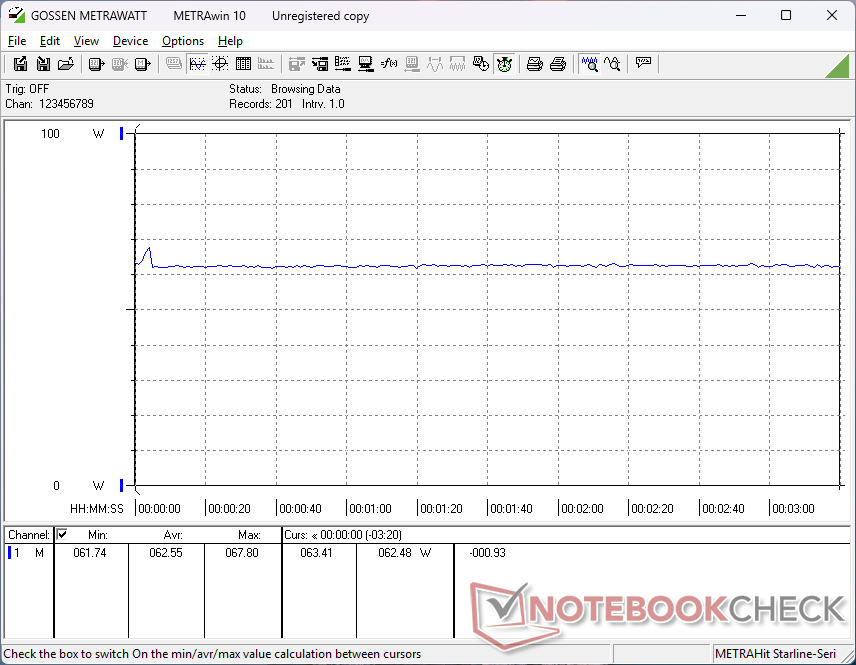
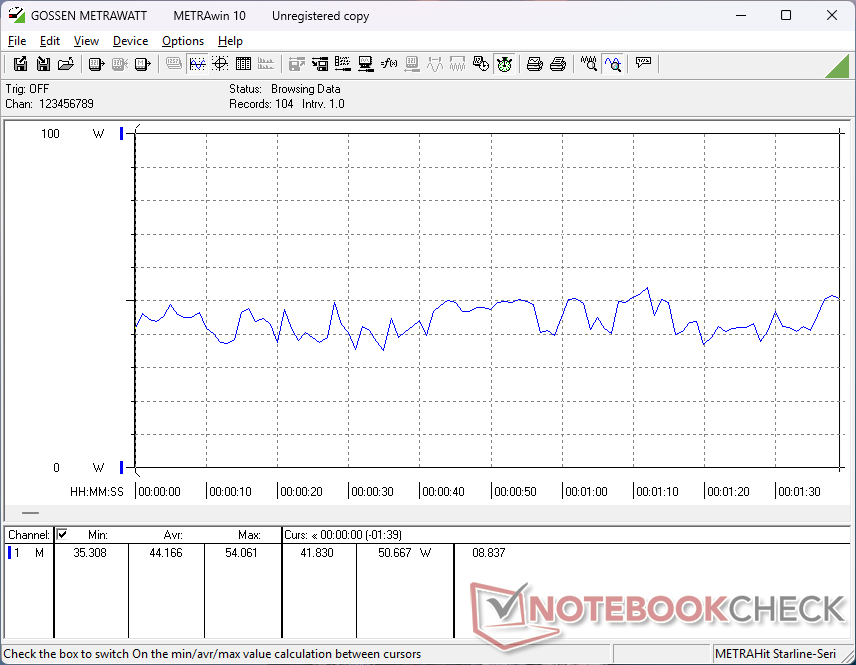
Energiagazdálkodás
Energiafogyasztás
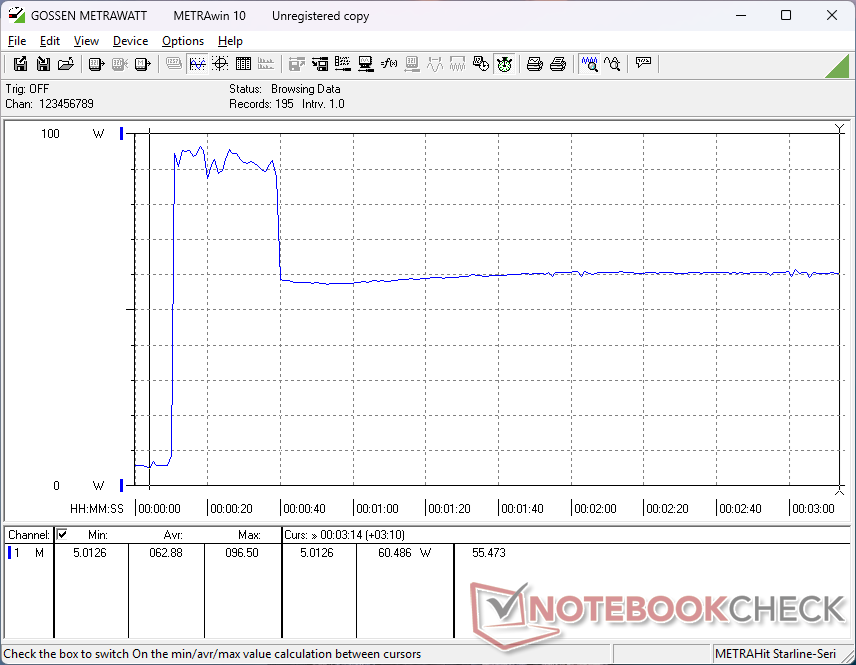
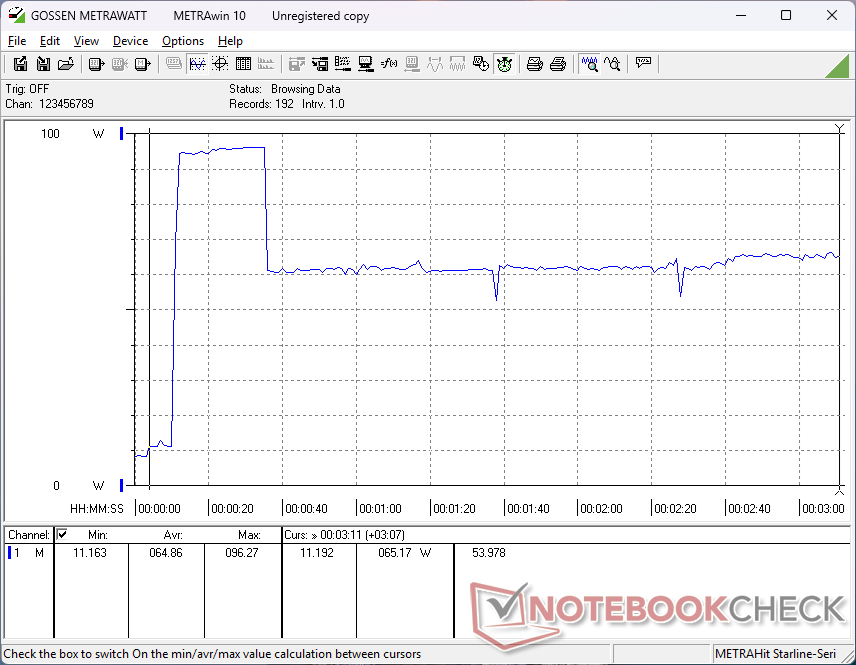
A Core Ultra X7 OLED konfiguráció az OLED panel miatt általában még üresjáratban is nagyobb igénybevételt jelent, mint az alap Core Ultra 5 IPS konfiguráció. A Cyberpunk 2077 és a Prime95 futtatása körülbelül 38 százalékkal, illetve 35 százalékkal több energiát fogyaszt. A teljesítménynövekedés azonban messze felülmúlja a nagyobb energiaigényt, így a teljesítmény/watt még mindig magasabb a Core Ultra X7 opcióval.
| Kikapcsolt állapot / Készenlét | |
| Üresjárat | |
| Terhelés |
|
Kulcs:
min: | |
| Dell XPS 16 Core Ultra X7 358H Ultra X7 358H, Arc B390 Panther Lake iGPU, , OLED, 3200x2000, 16" | Dell XPS 16 Core Ultra 5 325 Ultra 5 325, Intel Graphics 4 Xe3 PTL, SK hynix PVC10 HFS512GEM4X182N, IPS, 1920x1200, 16" | Dell XPS 16 9640 Ultra 7 155H, GeForce RTX 4070 Laptop GPU, Kioxia XG8 KXG80ZNV1T02, OLED, 3840x2400, 16.3" | Samsung Galaxy Book6 Pro Ultra 7 356H, Intel Graphics 4 Xe3 PTL, Samsung PM9C1b MZVL8512HFLU-00BLL, OLED, 2880x1800, 16" | Lenovo Yoga Pro 9 16IAH10 RTX 5050 Ultra 9 285H, GeForce RTX 5050 Laptop, WD PC SN7100S SDFPMSL-1T00-1101, OLED, 2880x1800, 16" | HP Omnibook 5 16-af1037nr Ultra 7 255U, Graphics 4-Core iGPU (Arrow Lake), , IPS, 1920x1200, 16" | |
|---|---|---|---|---|---|---|
| Power Consumption | 28% | -70% | 25% | -142% | -2% | |
| Idle Minimum * (Watt) | 4 | 1.3 67% | 7.7 -93% | 2.5 37% | 6.8 -70% | 4.8 -20% |
| Idle Average * (Watt) | 4.4 | 4.5 -2% | 10.3 -134% | 4.2 5% | 20.1 -357% | 9.4 -114% |
| Idle Maximum * (Watt) | 10.2 | 4.6 55% | 10.6 -4% | 4.6 55% | 21.6 -112% | 9.7 5% |
| Load Average * (Watt) | 44.2 | 36.5 17% | 76.5 -73% | 42.2 5% | 87.6 -98% | 41.8 5% |
| Cyberpunk 2077 ultra * (Watt) | 62.6 | 47.9 23% | 52.7 16% | 148.2 -137% | 39.5 37% | |
| Cyberpunk 2077 ultra external monitor * (Watt) | 62.4 | 45.4 27% | 40.6 35% | 147.9 -137% | 35.9 42% | |
| Load Maximum * (Watt) | 94.6 | 82.8 12% | 138.5 -46% | 70.8 25% | 173.5 -83% | 66.1 30% |
| Witcher 3 ultra * (Watt) | 126.4 |
* ... a kisebb jobb
Energiafogyasztás Cyberpunk / Stressz teszt
Energiafogyasztás külső monitor
Az akkumulátor élettartama
A Core Ultra X7 3.2K OLED SKU-val szemben a Core Ultra 5 FHD IPS SKU-val szemben a futási idő jelentősen, több mint felével rövidebb, még a Windows VRR engedélyezése mellett is. Bár a 10+ óra még mindig bőven elég a legtöbbeknek, a különbség figyelemre méltó.
| Dell XPS 16 Core Ultra X7 358H Ultra X7 358H, Arc B390 Panther Lake iGPU, 70 Wh | Dell XPS 16 Core Ultra 5 325 Ultra 5 325, Intel Graphics 4 Xe3 PTL, 70 Wh | Dell XPS 16 9640 Ultra 7 155H, GeForce RTX 4070 Laptop GPU, 99.5 Wh | Samsung Galaxy Book6 Pro Ultra 7 356H, Intel Graphics 4 Xe3 PTL, 78 Wh | Lenovo Yoga Pro 9 16IAH10 RTX 5050 Ultra 9 285H, GeForce RTX 5050 Laptop, 84 Wh | HP Omnibook 5 16-af1037nr Ultra 7 255U, Graphics 4-Core iGPU (Arrow Lake), 59 Wh | |
|---|---|---|---|---|---|---|
| Akkumulátor üzemidő | 158% | 2% | 58% | 4% | -8% | |
| WiFi v1.3 (h) | 10.3 | 26.6 158% | 10.5 2% | 16.3 58% | 10.7 4% | 9.5 -8% |
| H.264 (h) | 16.5 | |||||
| Load (h) | 1.5 |
Notebookcheck Értékelés
A Core Ultra X7 XPS 16 konfiguráció lényegesen meggyőzőbb, mint a gyengébb Core Ultra 5 vagy Ultra 7 opciók. A modell a tavalyi Dell 16 Premiumhoz képest lemond a teljesítményről a sokkal vékonyabb, karcsúbb és hatékonyabb megjelenésért.
Dell XPS 16 Core Ultra X7 358H
- 04/11/2026 v8
Allen Ngo
 Total Sustainability Score:
 Potenciális versenytársak összehasonlításban
Kép | Modell / Review | Legjobb ár | Súly | Magasság | Kijelző |
|---|---|---|---|---|---|
1. 87.2%  | Dell XPS 16 Core Ultra X7 358H Intel Core Ultra X7 358H ⎘ Intel Arc B390 12 Xe3 Panther Lake iGPU ⎘ 32 GB Memória | Amazon: 1. $2,199.00 Dell Premium 16 (XPS 16 2025... 2. $2,599.00 Dell Premium 16 (XPS 16 2025... 3. $1,977.99 Dell Premium 16 (Previously ... List Price: 2350 USD | 1.7 kg | 14.62 mm | 16.00" 3200x2000 236 PPI OLED |
2. 84.2%  | Dell XPS 16 Core Ultra 5 325 Intel Core Ultra 5 325 ⎘ Intel Graphics 4 Xe3 Panther Lake iGPU ⎘ 16 GB Memória, 512 GB SSD | Amazon: 1. $2,599.00 Dell Premium 16 (XPS 16 2025... 2. $2,199.00 Dell Premium 16 (XPS 16 2025... 3. $1,977.99 Dell Premium 16 (Previously ... List Price: 1600 USD | 1.7 kg | 15.4 mm | 16.00" 1920x1200 142 PPI IPS |
3. 88.6% v7 (old)  | Dell XPS 16 9640 Intel Core Ultra 7 155H ⎘ NVIDIA GeForce RTX 4070 Laptop GPU ⎘ 32 GB Memória, 1024 GB SSD | Amazon: 1. $2,199.00 New XPS 16 9640 Business Lap... 2. $2,499.00 Dell XPS 16 9640 16.3" Touch... 3. $2,799.99 Dell XPS 16 9640 Laptop | In... | 2.3 kg | 18.7 mm | 16.30" 3840x2400 139 PPI OLED |
4. 86.3%  | Samsung Galaxy Book6 Pro Intel Core Ultra 7 356H ⎘ Intel Graphics 4 Xe3 Panther Lake iGPU ⎘ 32 GB Memória, 512 GB SSD | Amazon: List Price: 2199€ | 1.6 kg | 11.9 mm | 16.00" 2880x1800 212 PPI OLED |
5. 88.8%  | Lenovo Yoga Pro 9 16IAH10 RTX 5050 Intel Core Ultra 9 285H ⎘ NVIDIA GeForce RTX 5050 Laptop ⎘ 32 GB Memória, 1024 GB SSD | Amazon: List Price: 1800 USD | 2 kg | 17.9 mm | 16.00" 2880x1800 212 PPI OLED |
6. 77.8%  | HP Omnibook 5 16-af1037nr Intel Core Ultra 7 255U ⎘ Intel Graphics 4-Core iGPU (Meteor / Arrow Lake) ⎘ 16 GB Memória | Amazon: List Price: 660 USD | 1.7 kg | 18.6 mm | 16.00" 1920x1200 142 PPI IPS |
Átláthatóság
A felülvizsgálandó készülékek kiválasztását szerkesztőségünk végzi. A tesztmintát a gyártó vagy a kiskereskedő kölcsönként bocsátotta a szerző rendelkezésére a felülvizsgálat céljából. A hitelezőnek nem volt befolyása erre a felülvizsgálatra, és a gyártó sem kapott másolatot erről a felülvizsgálatról a közzététel előtt. Nem volt kötelesség ezt az ismertetőt közzétenni. Független médiavállalatként a Notebookcheck nincs alávetve a gyártók, kiskereskedők vagy kiadók felhatalmazásának.
Így tesztel a Notebookcheck
A Notebookcheck minden évben független, laptopok és okostelefonok százait vizsgálja meg szabványosított eljárások alkalmazásával annak érdekében, hogy minden eredmény összehasonlítható legyen. Körülbelül 20 éve folyamatosan fejlesztjük vizsgálati módszereinket, és ennek során iparági szabványokat állítottunk fel. Tesztlaboratóriumainkban kiváló minőségű mérőberendezéseket használnak tapasztalt technikusok és szerkesztők. Ezek a tesztek többlépcsős validációs folyamatot foglalnak magukban. Komplex minősítési rendszerünk több száz megalapozott mérésen és benchmarkon alapul, ami megőrzi az objektivitást.
