Ítélet - Egy 18 hüvelykes Gaming Laptop teljesítménye 16 hüvelykes képernyőméretben
A Raider 16 Max HX kisebb lehet, mint a masszív Raider 18 vagy a Titan 18, de még mindig a teljesítményt helyezi előtérbe. Az Arrow Lake-HX CPU és a 175 W-os GPU a laptop méretétől függetlenül a leggyorsabb lehetőségek közé tartozik, így a Raider 16 Max HX az egyik leggyorsabb játékmegoldás a piacon. A fényes OLED-kijelző ugyanolyan lenyűgöző, ha az elkerülhetetlen tükröződést mérsékelni tudja, míg az alpanel egy olyan praktikus funkció, amelyet szívesen látnánk minden MSI gaming laptopon a jövőben.
Az extrém teljesítménynek ára van. Leginkább a Raider 16 Max HX vaskosabb és nehezebb, mint sok más 16 hüvelykes gamer laptop, beleértve az amúgy is nagyméretű Alienware 16X Aurora. A műanyag váz nem tűnik olyan fényűzőnek, mint a Alienware 16 Area-51 annak ellenére, hogy körülbelül ugyanannyiba kerülnek, míg a G-Sync és az Advanced Optimus hiánya nehezen megbocsátható ebben az árkategóriában. Azok a felhasználók, akik szeretnek utazni és útközben játszani, nagyobb értéket találhatnak a könnyebb és hordozhatóbb 16 hüvelykes megoldásokban, mint például az MSI Stealth 16 vagy a Razer Blade 16 amelyek hasonló RTX 5090 grafikával rendelkeznek, de valamivel lassabb teljesítményszinten futnak.
Pro
Kontra
Ár és elérhetőség
Az MSI Raider 16 Max HX most az Amazonon akár 4300 dollárért is szállítható, ha a GeForce RTX 5090 GPU-val van konfigurálva.
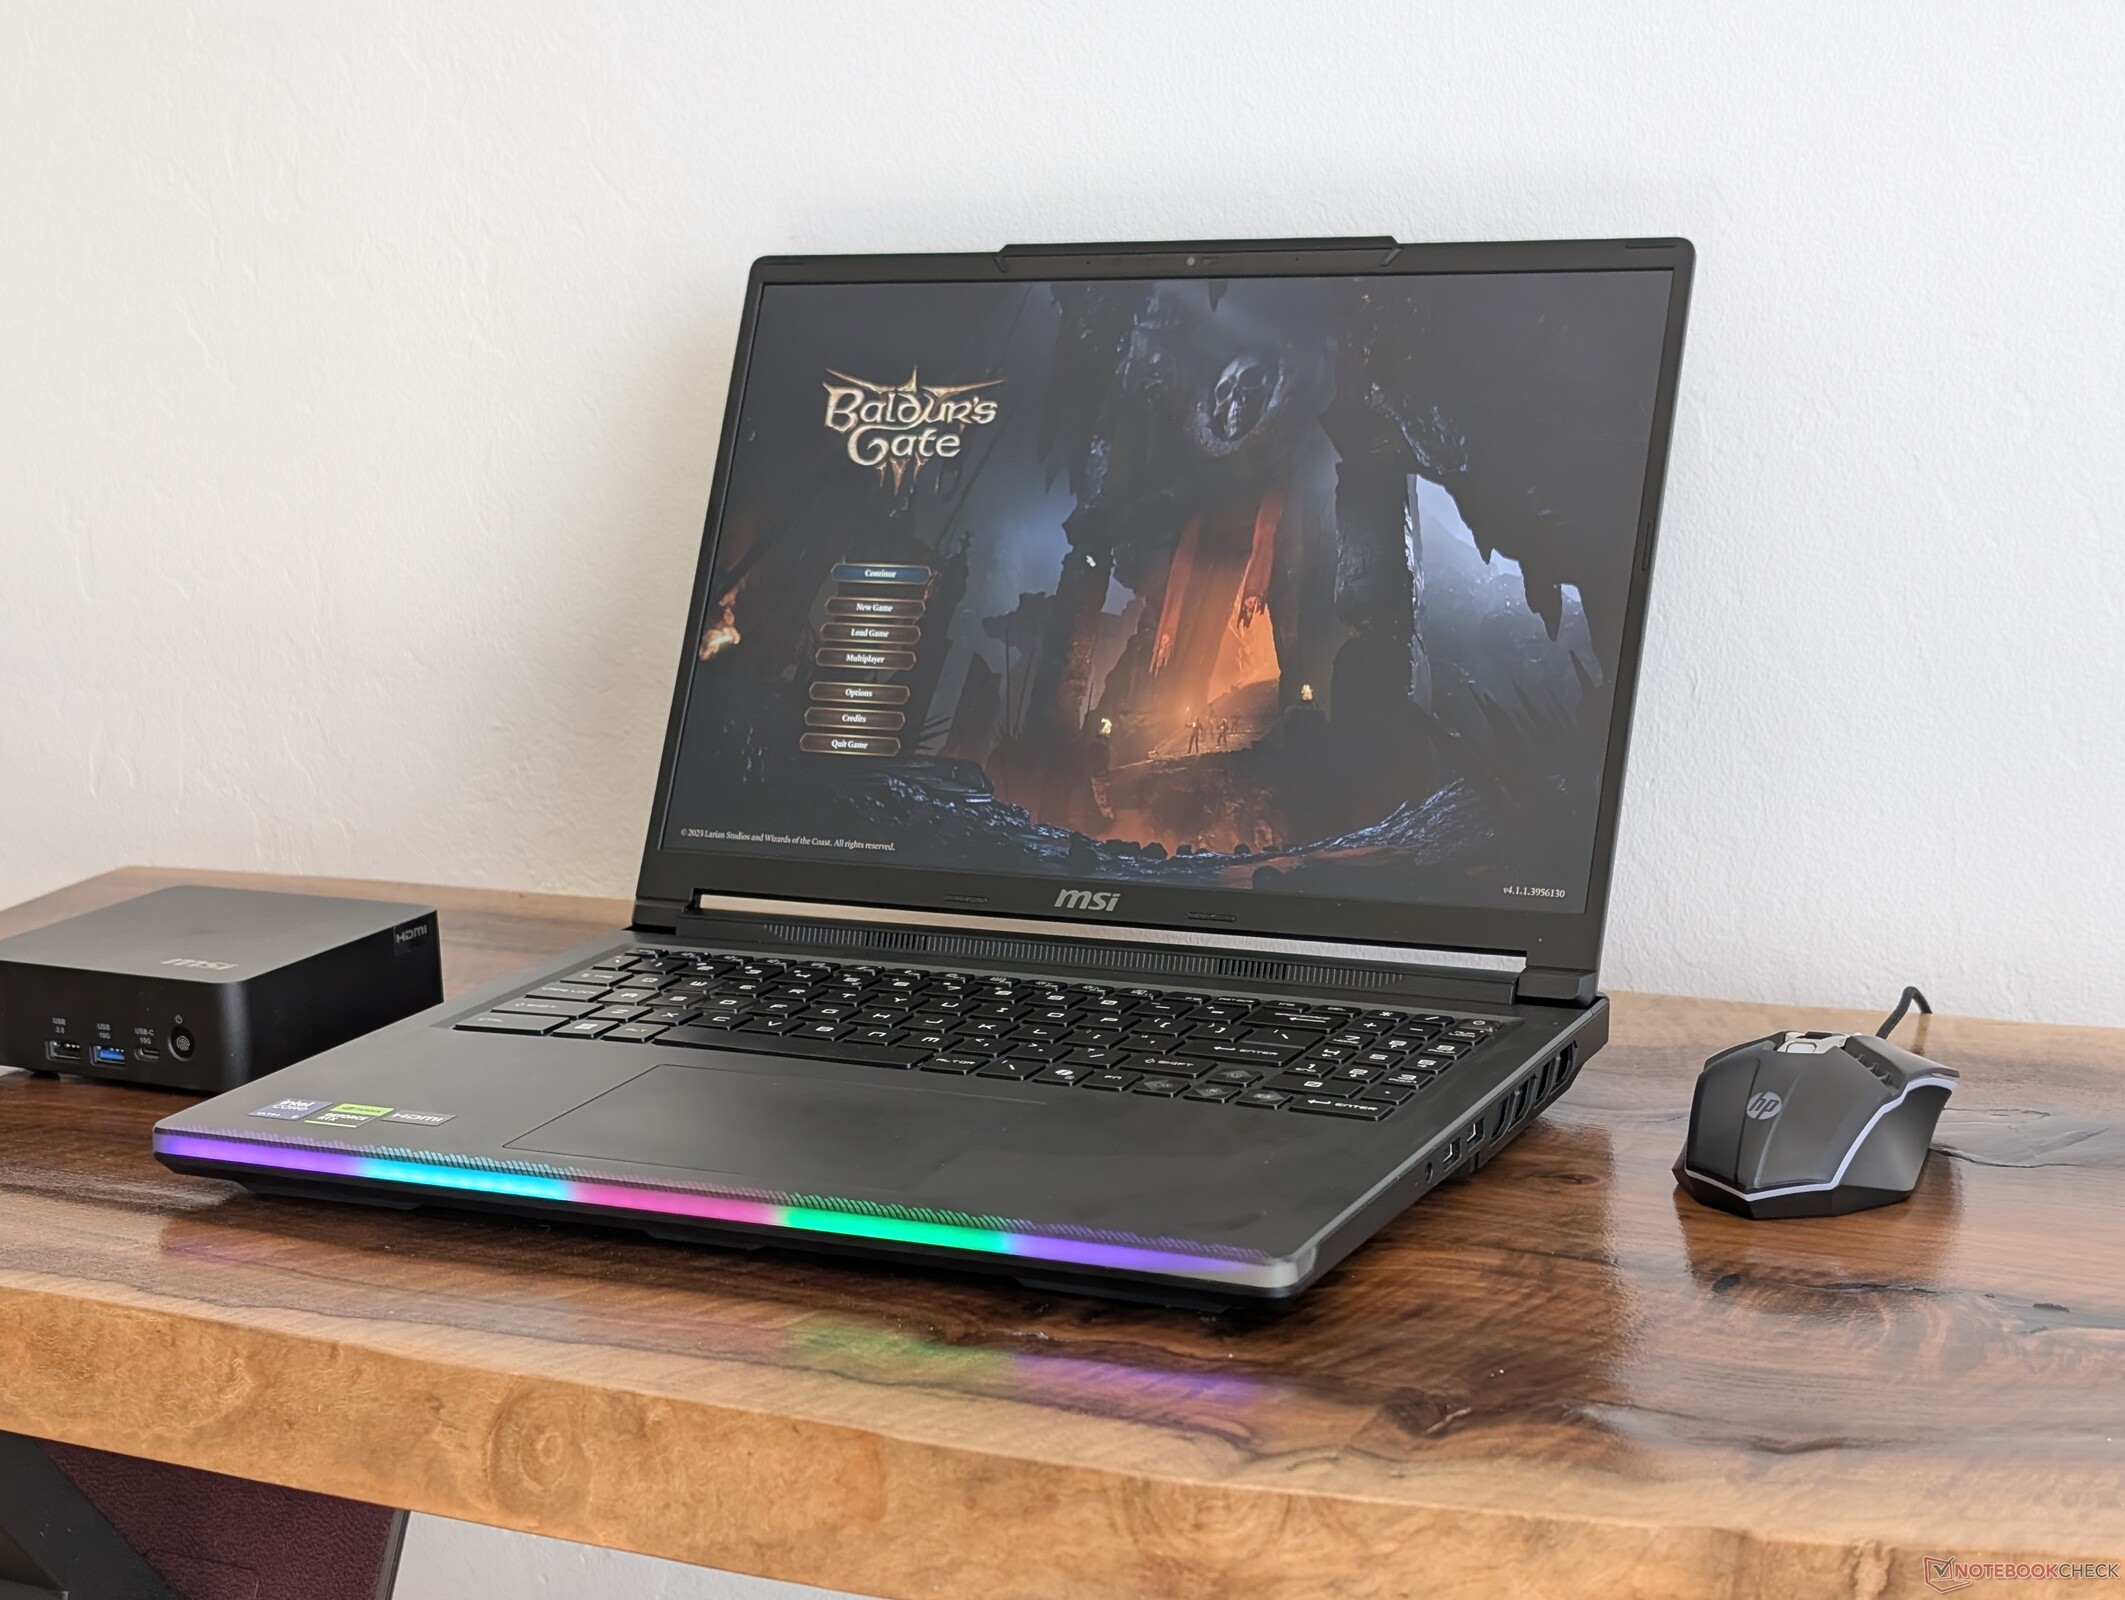
Az MSI Raider 16 Max HX volt a CES 2026-on mutatták be mint a Raider sorozat első 16 hüvelykes laptopja. Történetesen ez az egyik első olyan MSI gamer laptop, amely a szokásos IPS vagy Mini-LED helyett OLED kijelzővel rendelkezik. A Raider 18 sorozathoz hasonlóan a Raider 16 Max HX is az MSI egyik leggyorsabb laptopját képviseli.
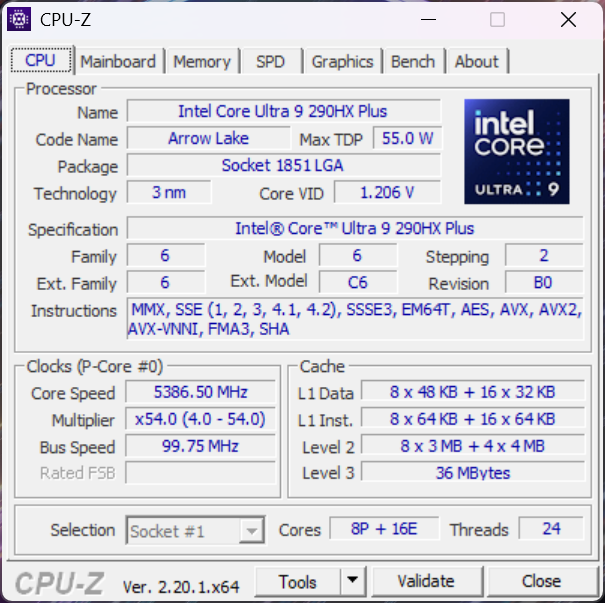
Tesztkészülékünk a legmagasabb szintű konfiguráció az Arrow Lake Core Ultra 9 290HX Plus CPU-val és 175 W-os GeForce RTX 5090 GPU-val, körülbelül 4400 USD-ért. Jelenleg minden SKU-t ugyanazzal a CPU-val és QHD+ 240 Hz-es OLED fényes kijelzővel szállítanak, de lehet, hogy a GeForce RTX 5070 Ti helyett a RTX 5070 Ti-vel indul.
A versenytársak közé tartoznak más csúcskategóriás vagy zászlóshajó 16 hüvelykes gamer laptopok, mint például a Dell Alienware 16 Area-51, Asus Zephyrus Duo, vagy Razer Blade 16.
További MSI vélemények:
Műszaki adatok
Ügy
A külső fedél sima matt fém, míg az alap nagyrészt műanyag. Bár semmiképpen sem szörnyű, a felületek hajlékonyak és nem érződnek olyan merevnek, mint a konkurens modellek, például az Alienware 16 Area-51 vagy a Razer Blade 16. A magas kért árat figyelembe véve erősebb vagy prémiumabb vázkialakításra számítottunk.
Csatlakozás
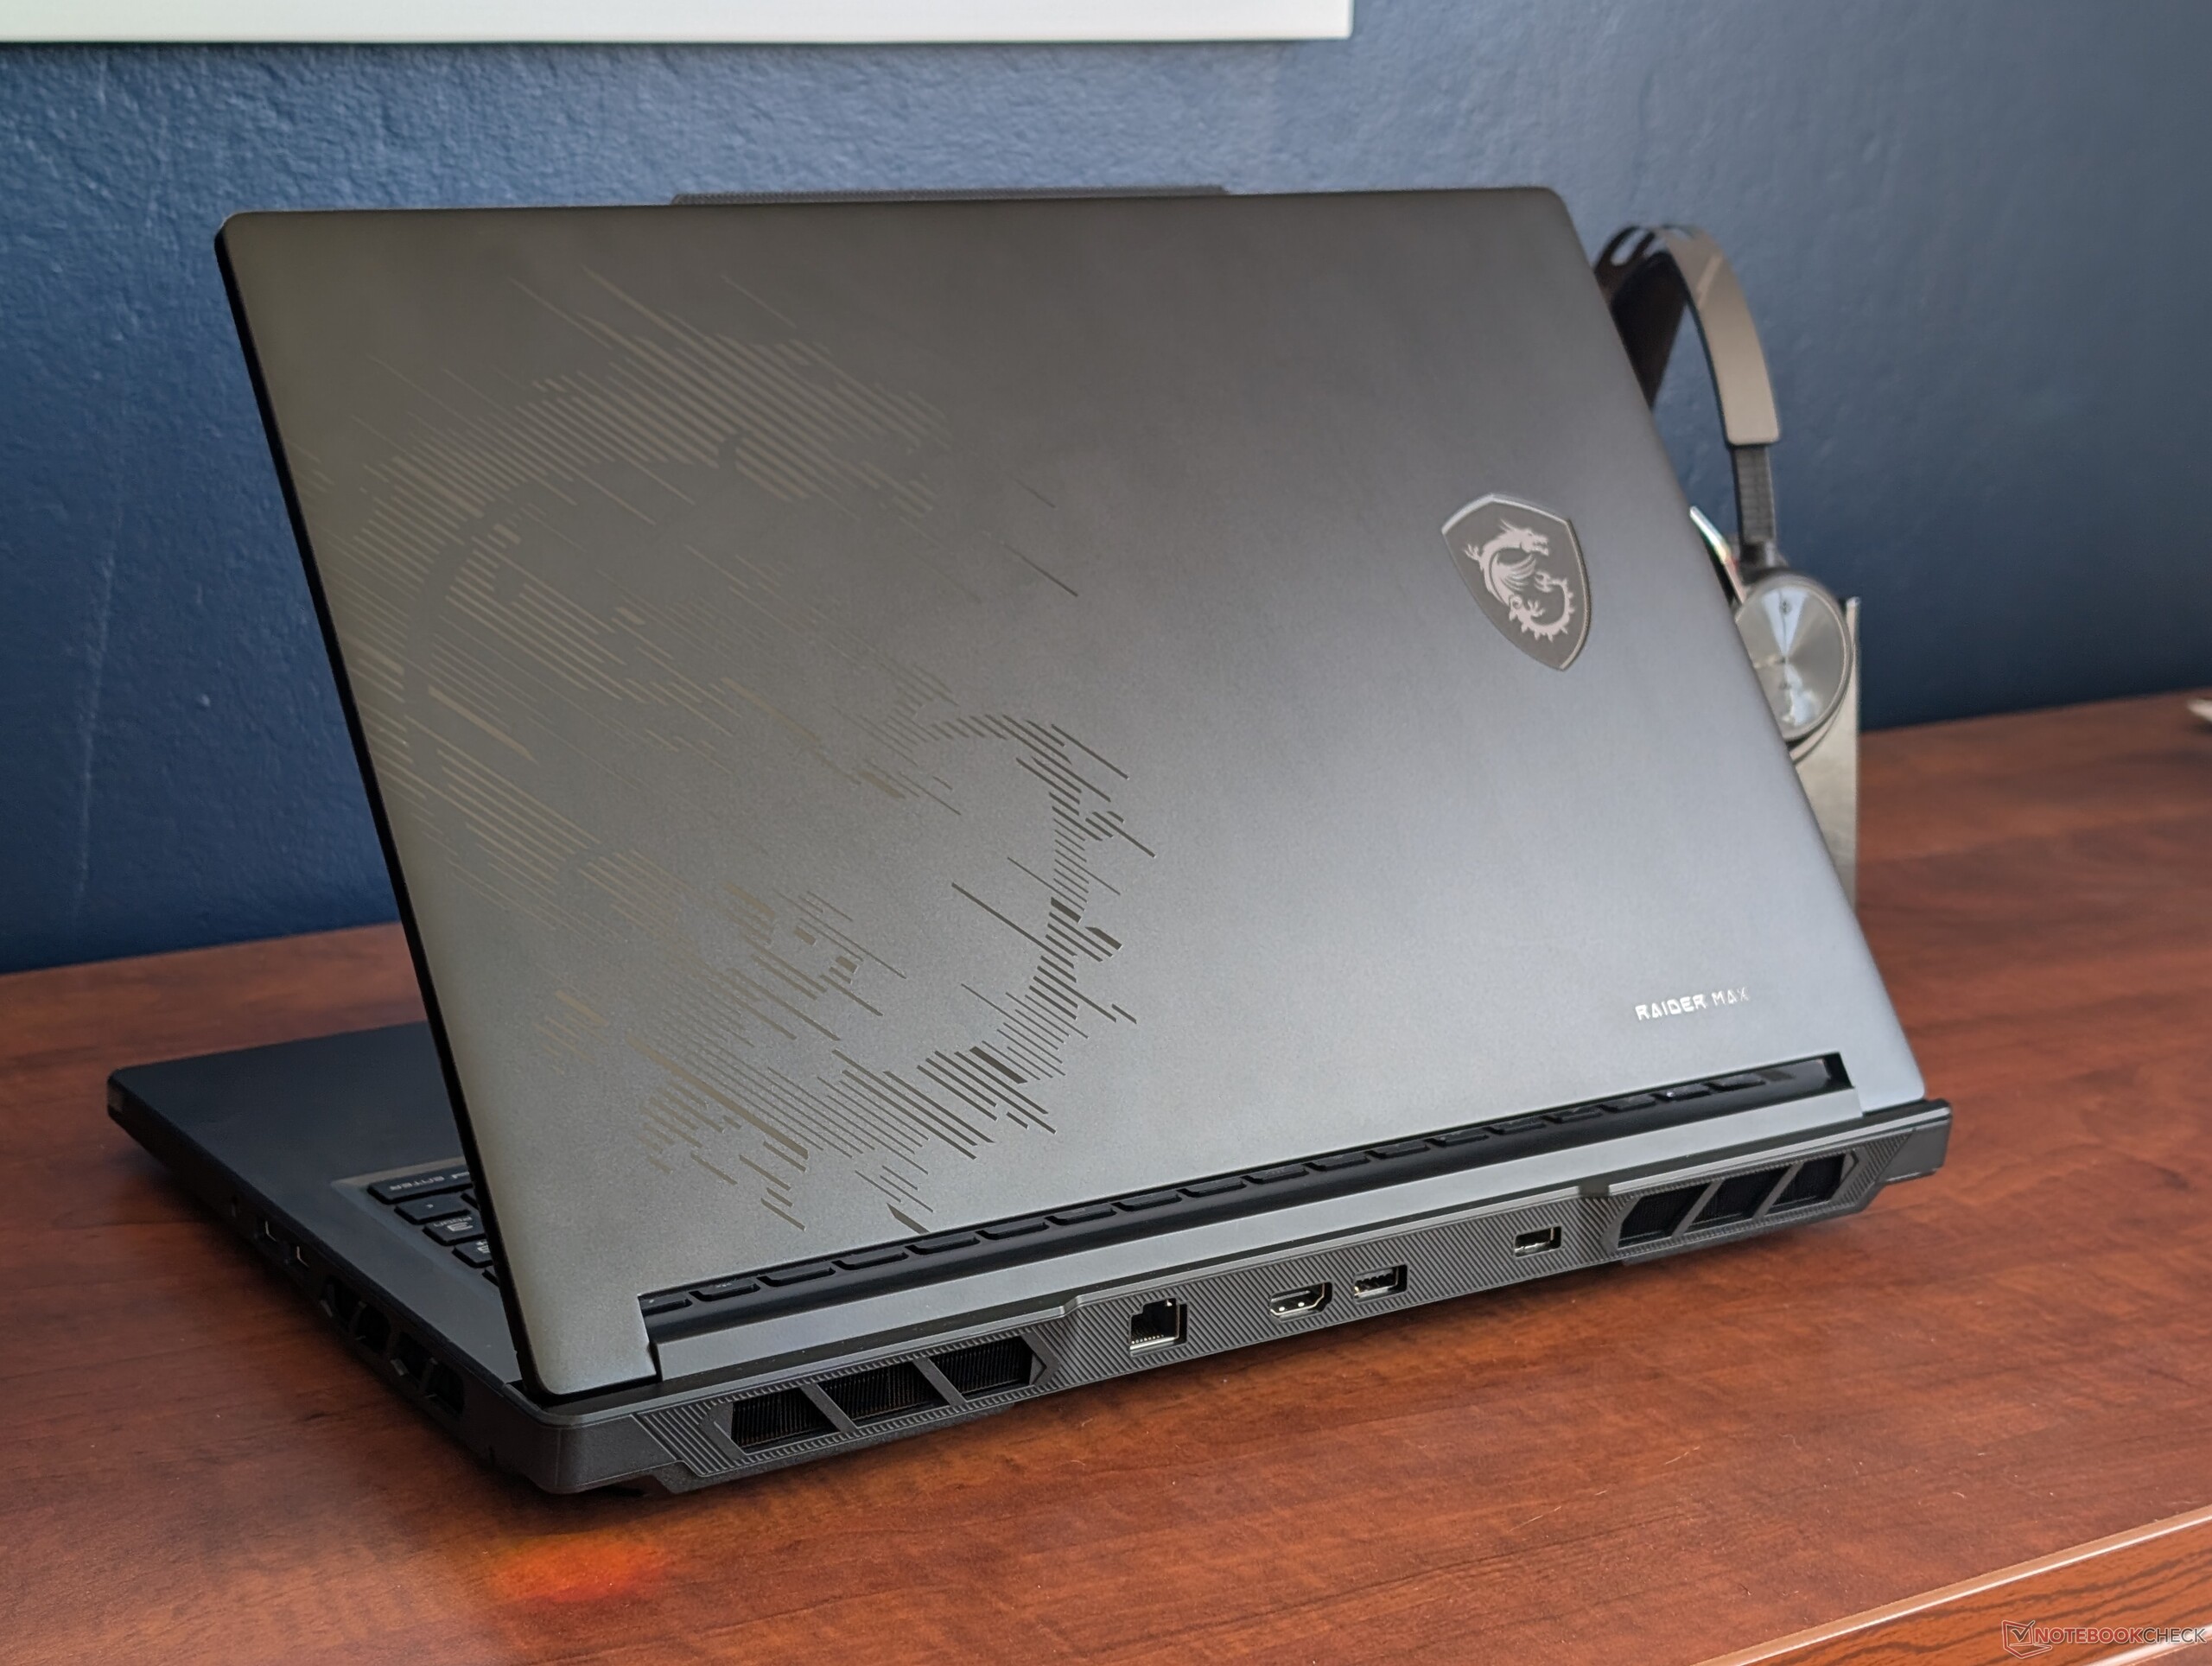
A kikötési lehetőségek megegyeznek a Raider 18 HX-ével, bár átrendezve.


SD kártyaolvasó
| SD Card Reader | |
| average JPG Copy Test (av. of 3 runs) | |
| MSI Raider 16 Max HX B2WJ (Toshiba Exceria Pro SDXC 64 GB UHS-II) | |
| Razer Blade 16 Core Ultra 9 386H (Toshiba Exceria Pro SDXC 64 GB UHS-II) | |
| Lenovo Legion 7 16IAX10 (Toshiba Exceria Pro SDXC 64 GB UHS-II) | |
| maximum AS SSD Seq Read Test (1GB) | |
| Lenovo Legion 7 16IAX10 (Toshiba Exceria Pro SDXC 64 GB UHS-II) | |
| Razer Blade 16 Core Ultra 9 386H (Toshiba Exceria Pro SDXC 64 GB UHS-II) | |
| MSI Raider 16 Max HX B2WJ (Toshiba Exceria Pro SDXC 64 GB UHS-II) | |
Kommunikáció
Webkamera
a 2 MP-es webkamera IR-rel és fizikai zárral alapfelszereltség.


Karbantartás
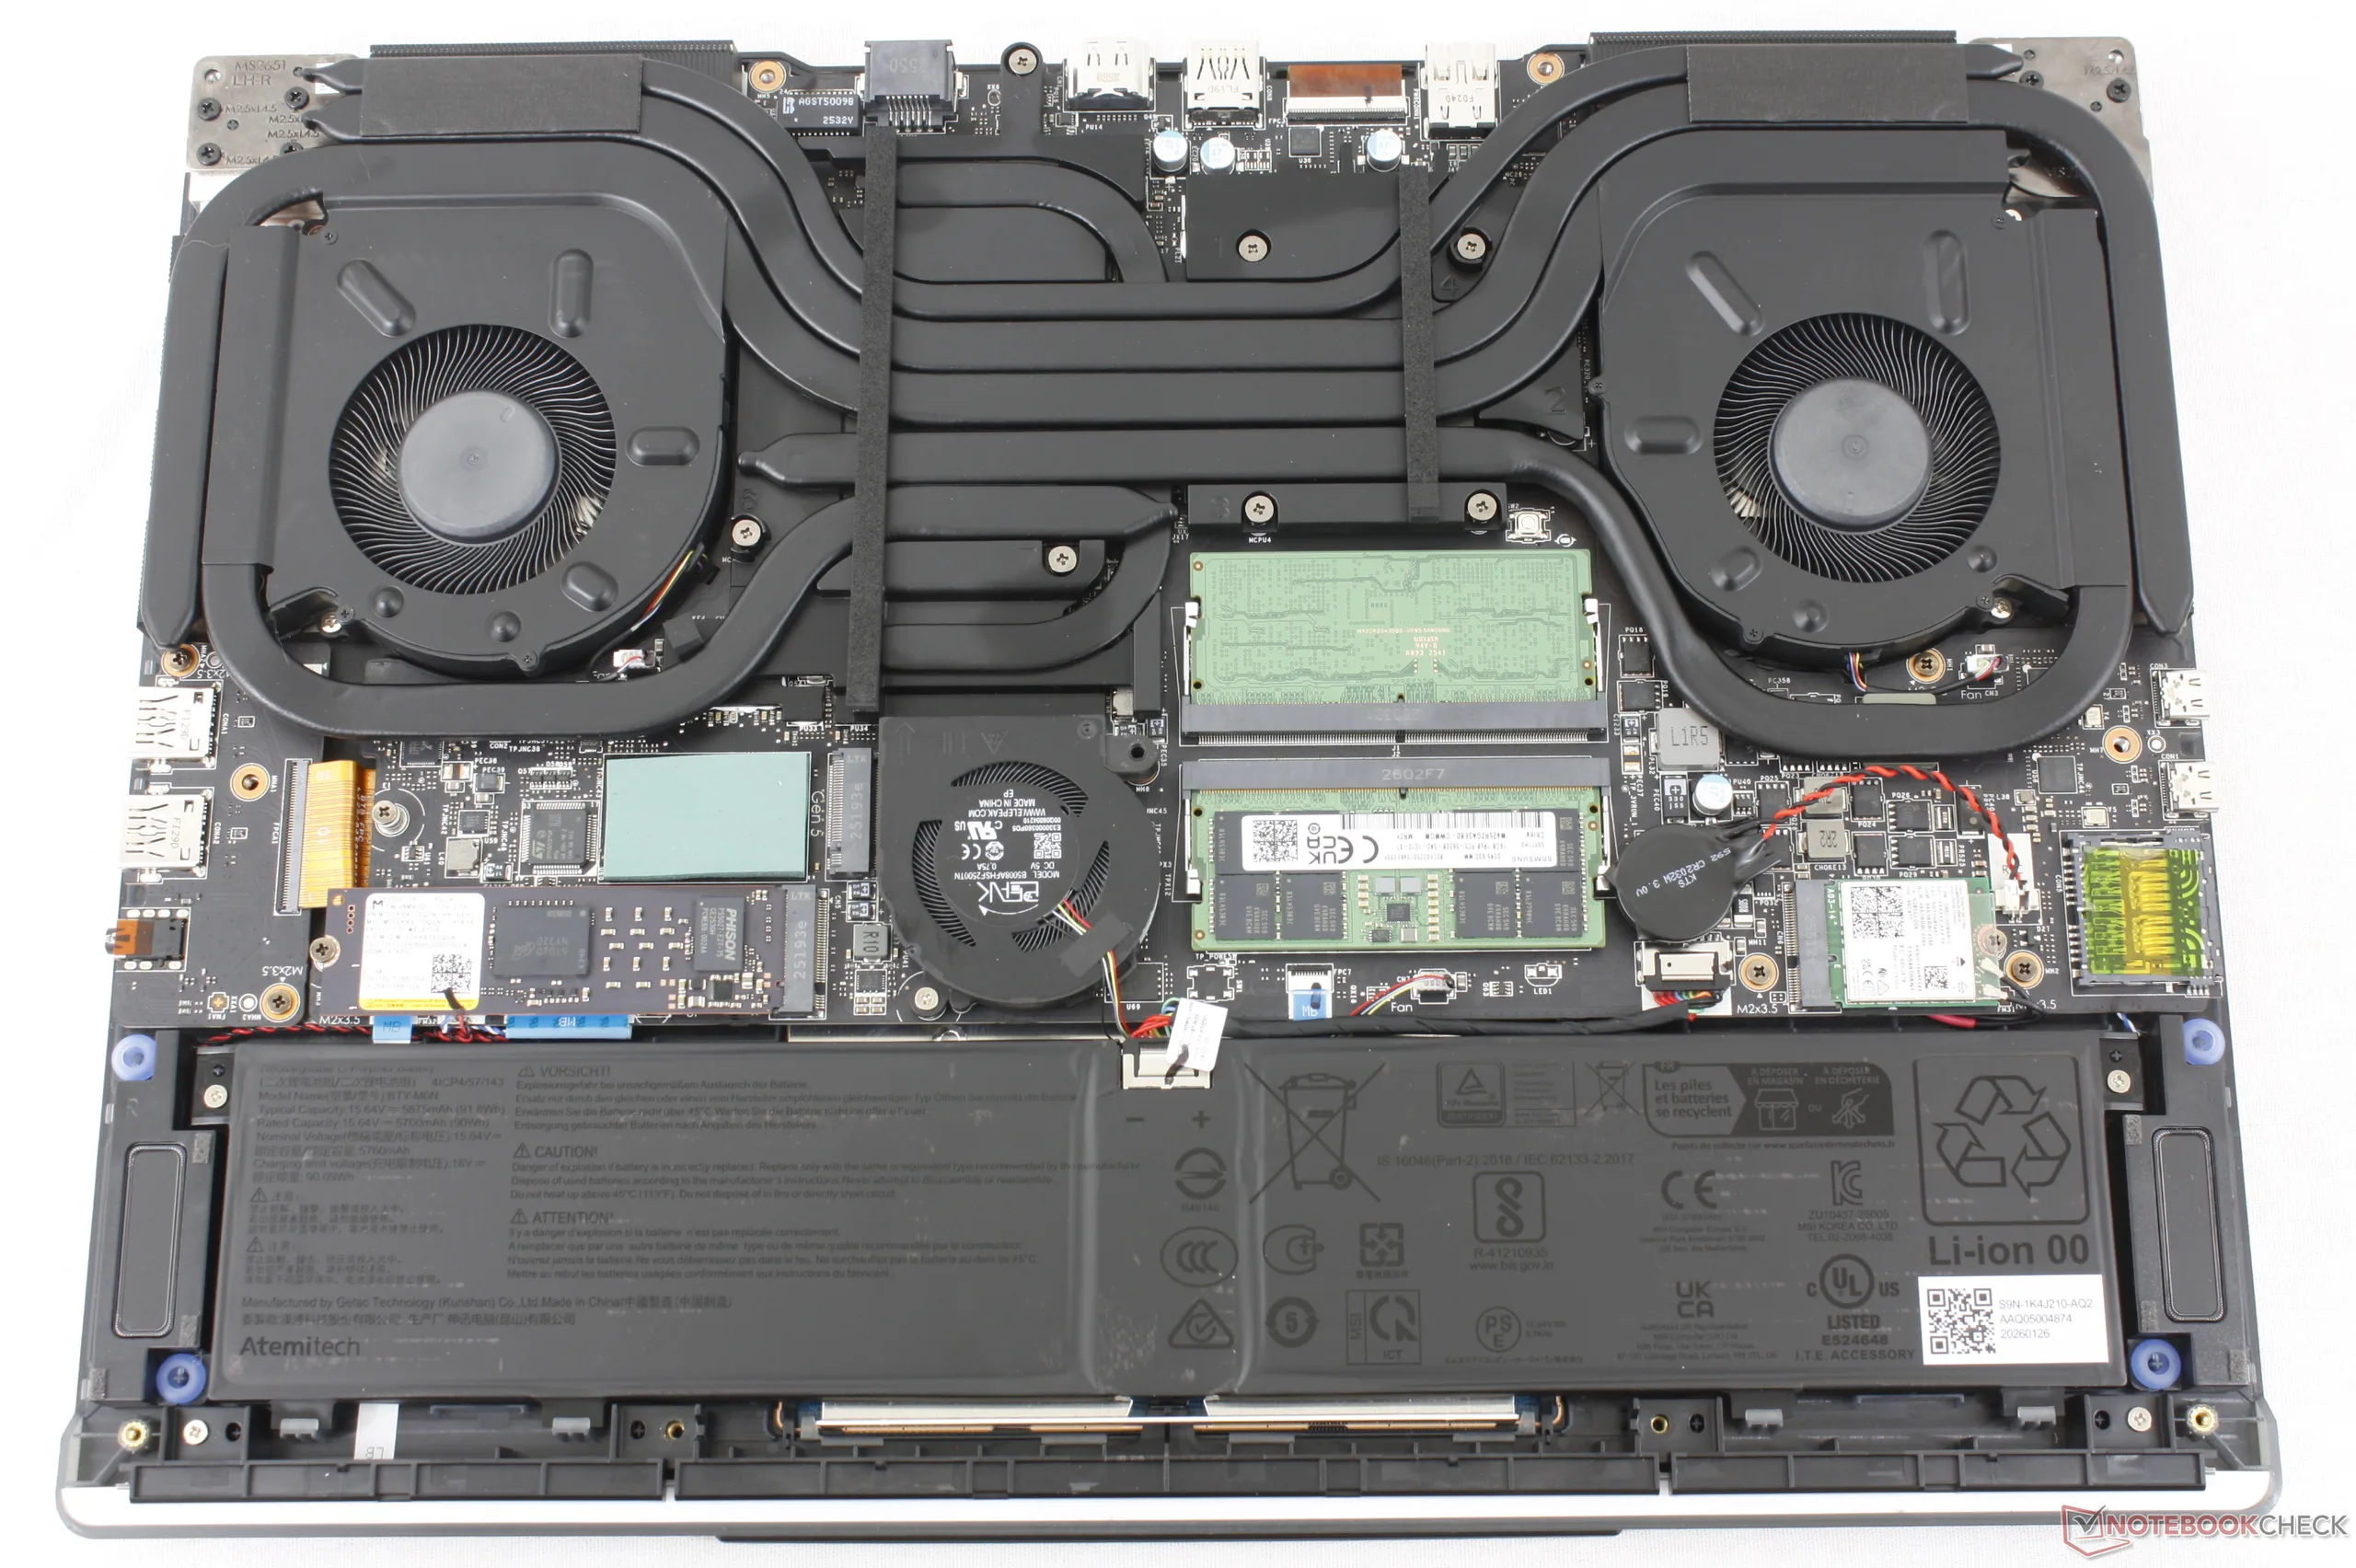
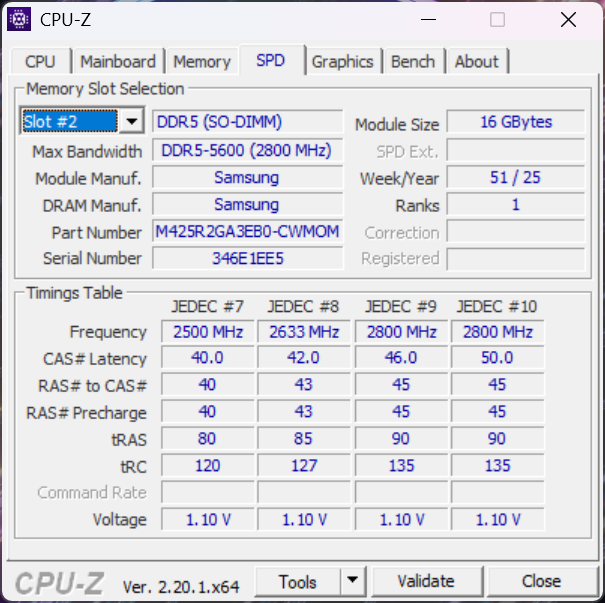
Az alsó panel tartalmaz egy alpanelt, amely megkönnyíti a két M.2 2280 SSD-hely (egy PCIe5 és egy PCIe4) és két DDR5 SODIMM-hely elérését. Egyébként a teljes alsó panel még mindig viszonylag könnyen eltávolítható egy hagyományos Phillips csavarhúzóval.
Fenntarthatóság
Az MSI nem tesz említést a Raider 16 Max HX gyártása során felhasznált újrahasznosított anyagokról. A csomagolás műanyagmentes.
Tartozékok és garancia
A dobozban a hálózati adapteren és a papírmunkán kívül nincs más extra. Az USA-ban történő vásárlás esetén a szokásos egyéves korlátozott gyártói garancia érvényes.
Bemeneti eszközök
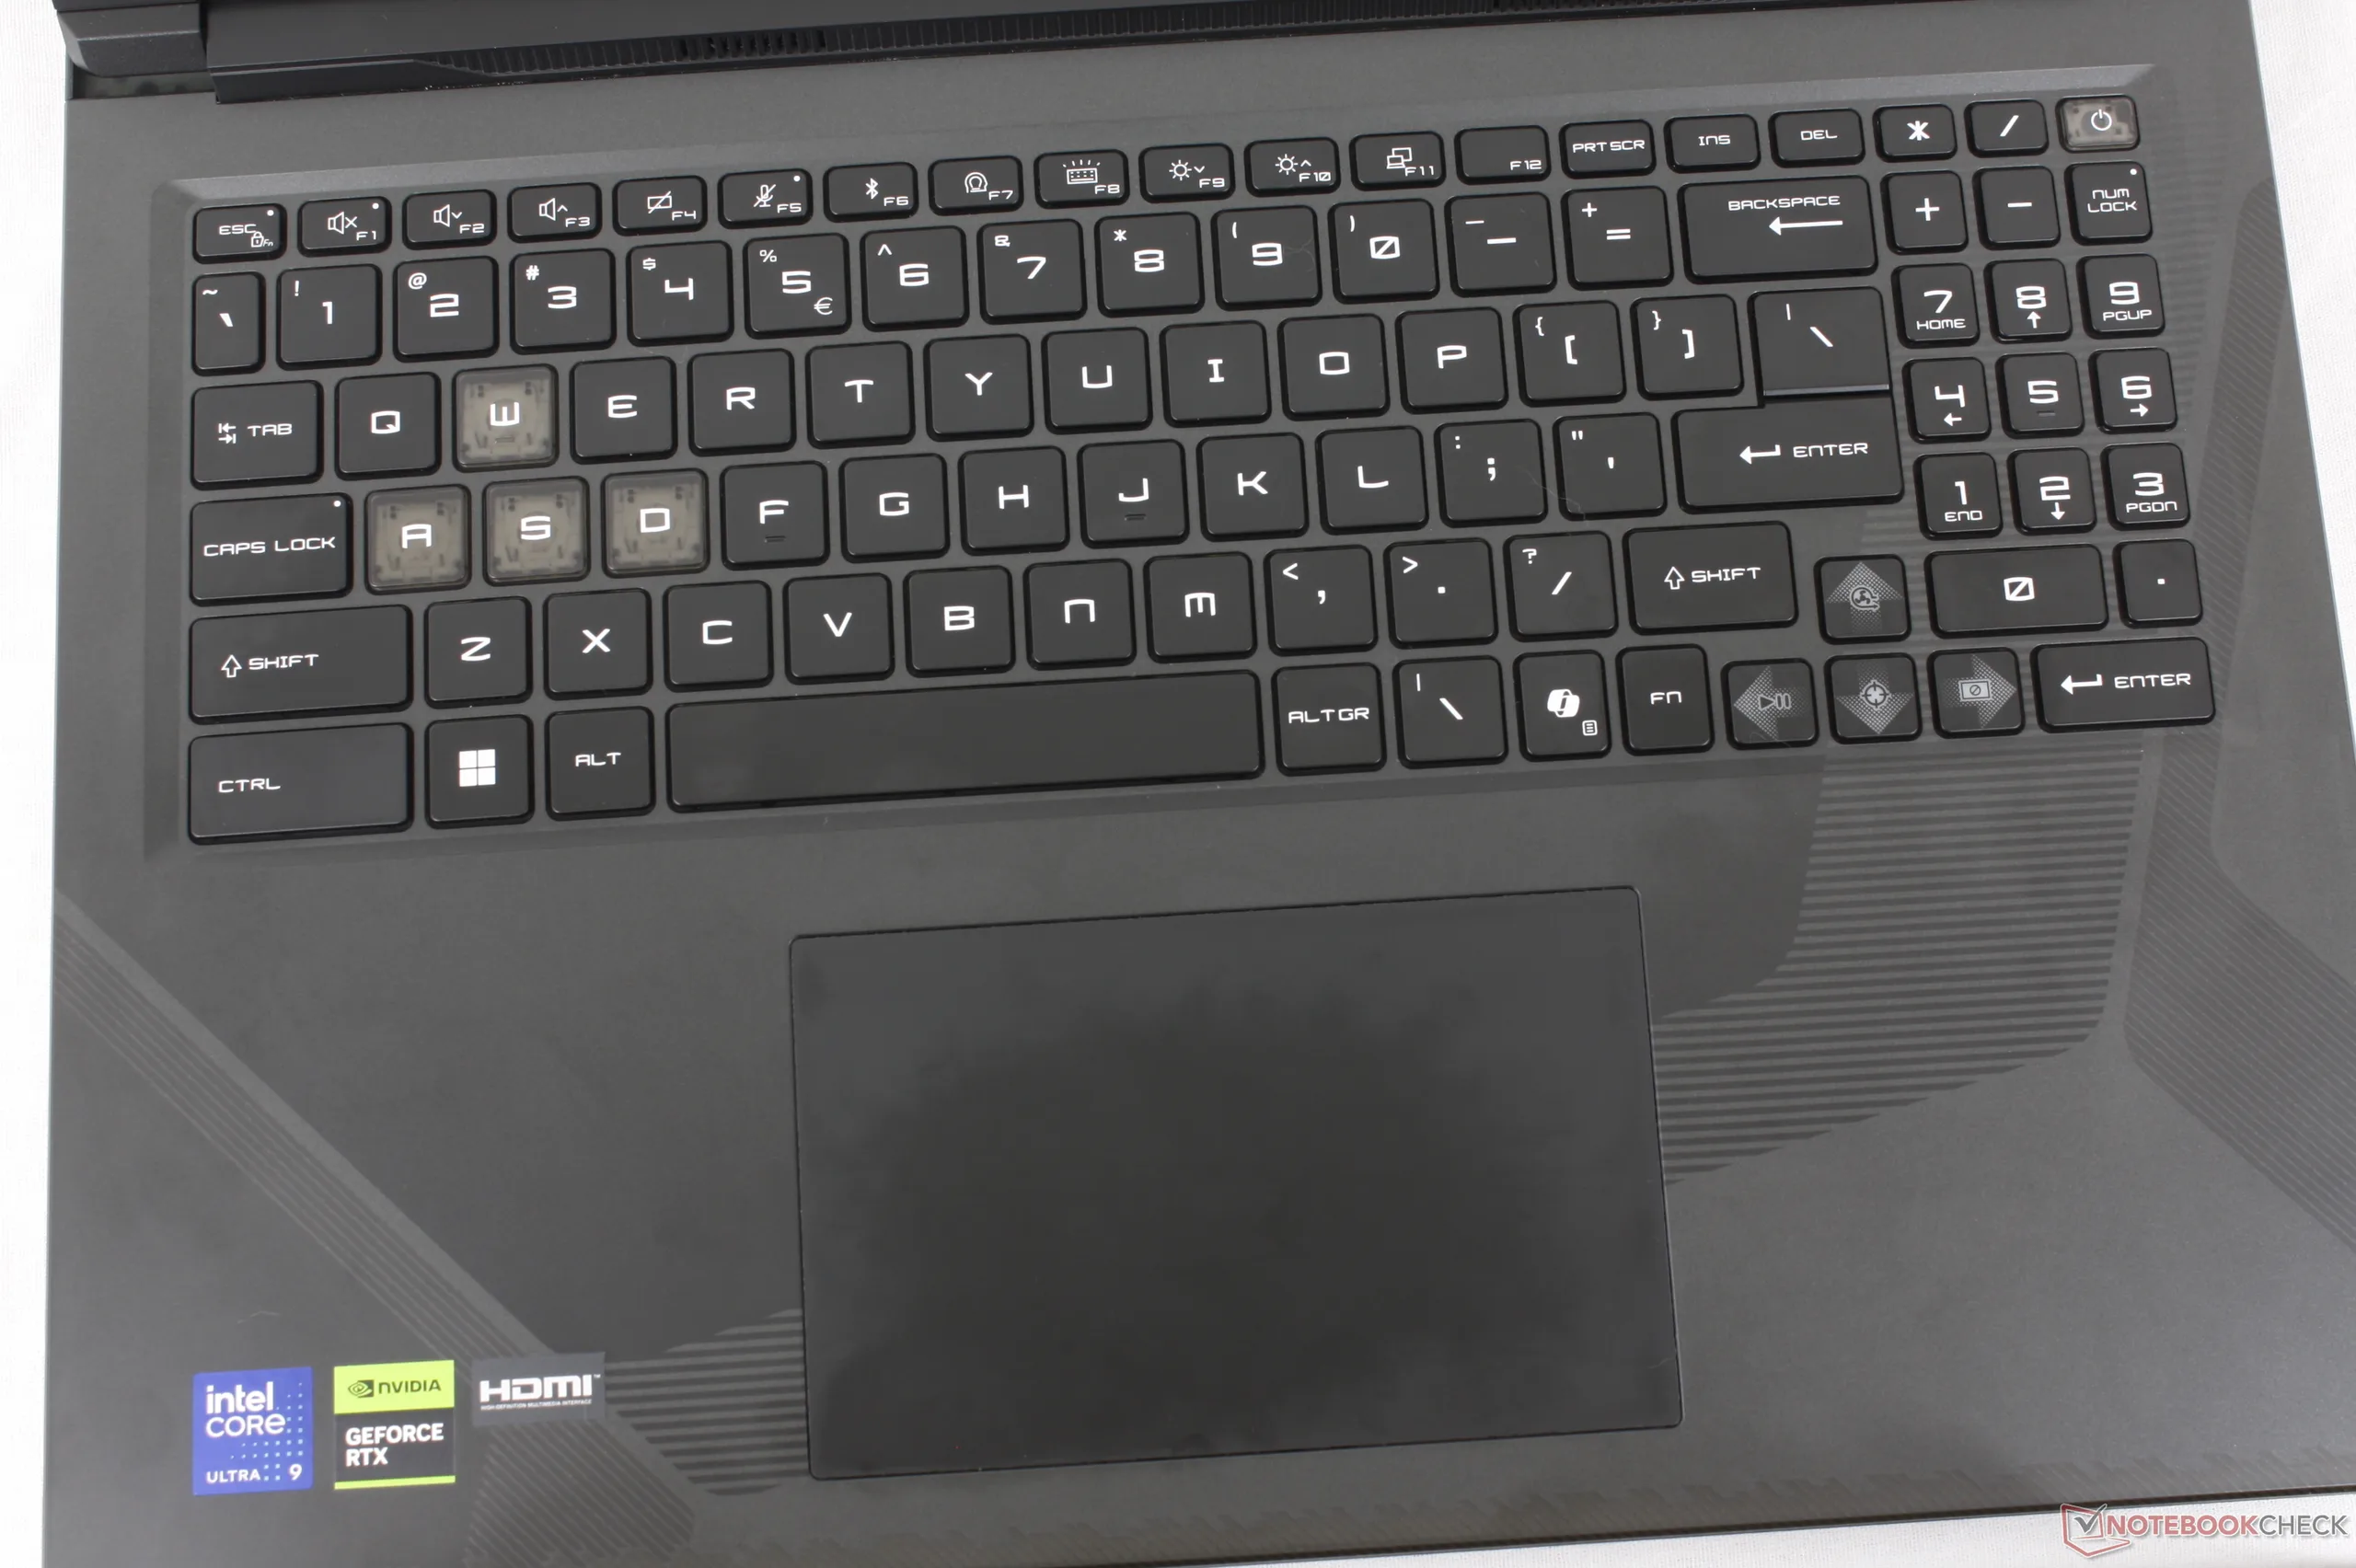
A Raider 16 Max HX billentyűzete és clickpadje megegyezik a Crosshair 16 HX-en elérhetővel, még akkor is, ha ez utóbbi az MSI alacsonyabb kategóriás játékmodellje. A Raider esetében azonban a billentyűk billentyűkönként RGB-világítással rendelkeznek a nagyobb felhasználói testreszabhatóság érdekében, míg a Crosshair korlátozott RGB-zónákkal rendelkezik.
Megjelenítés

Az MSI kezd egyre inkább az OLED felé fordulni az IPS vagy Mini-LED helyett számos játékra szánt laptopja esetében. A Raider 16 Max HX esetében a 240 Hz-es QHD+ OLED panel éles, tökéletes fekete szintekkel, pontos P3 színekkel, DisplayHDR1000 támogatással és a konkurens mini-LED opcióknál gyakran előforduló "halo" effektus nélkül.
A kijelző két legjelentősebb hátránya a nagyon fényes felülete és a G-Sync támogatás hiánya, ellentétben a legtöbb régebbi MSI játékos laptopokkal, ahol a matt panelek alapfelszereltségnek számítottak. Készülj fel arra, hogy fényes beltéri körülmények között való játék közben a tükröződéssel kell megküzdened.
| |||||||||||||||||||||||||
Fényerő megoszlás: 98 %
Centrumban: 478.6 cd/m²
Kontraszt: ∞:1 (Fekete: 0 cd/m²)
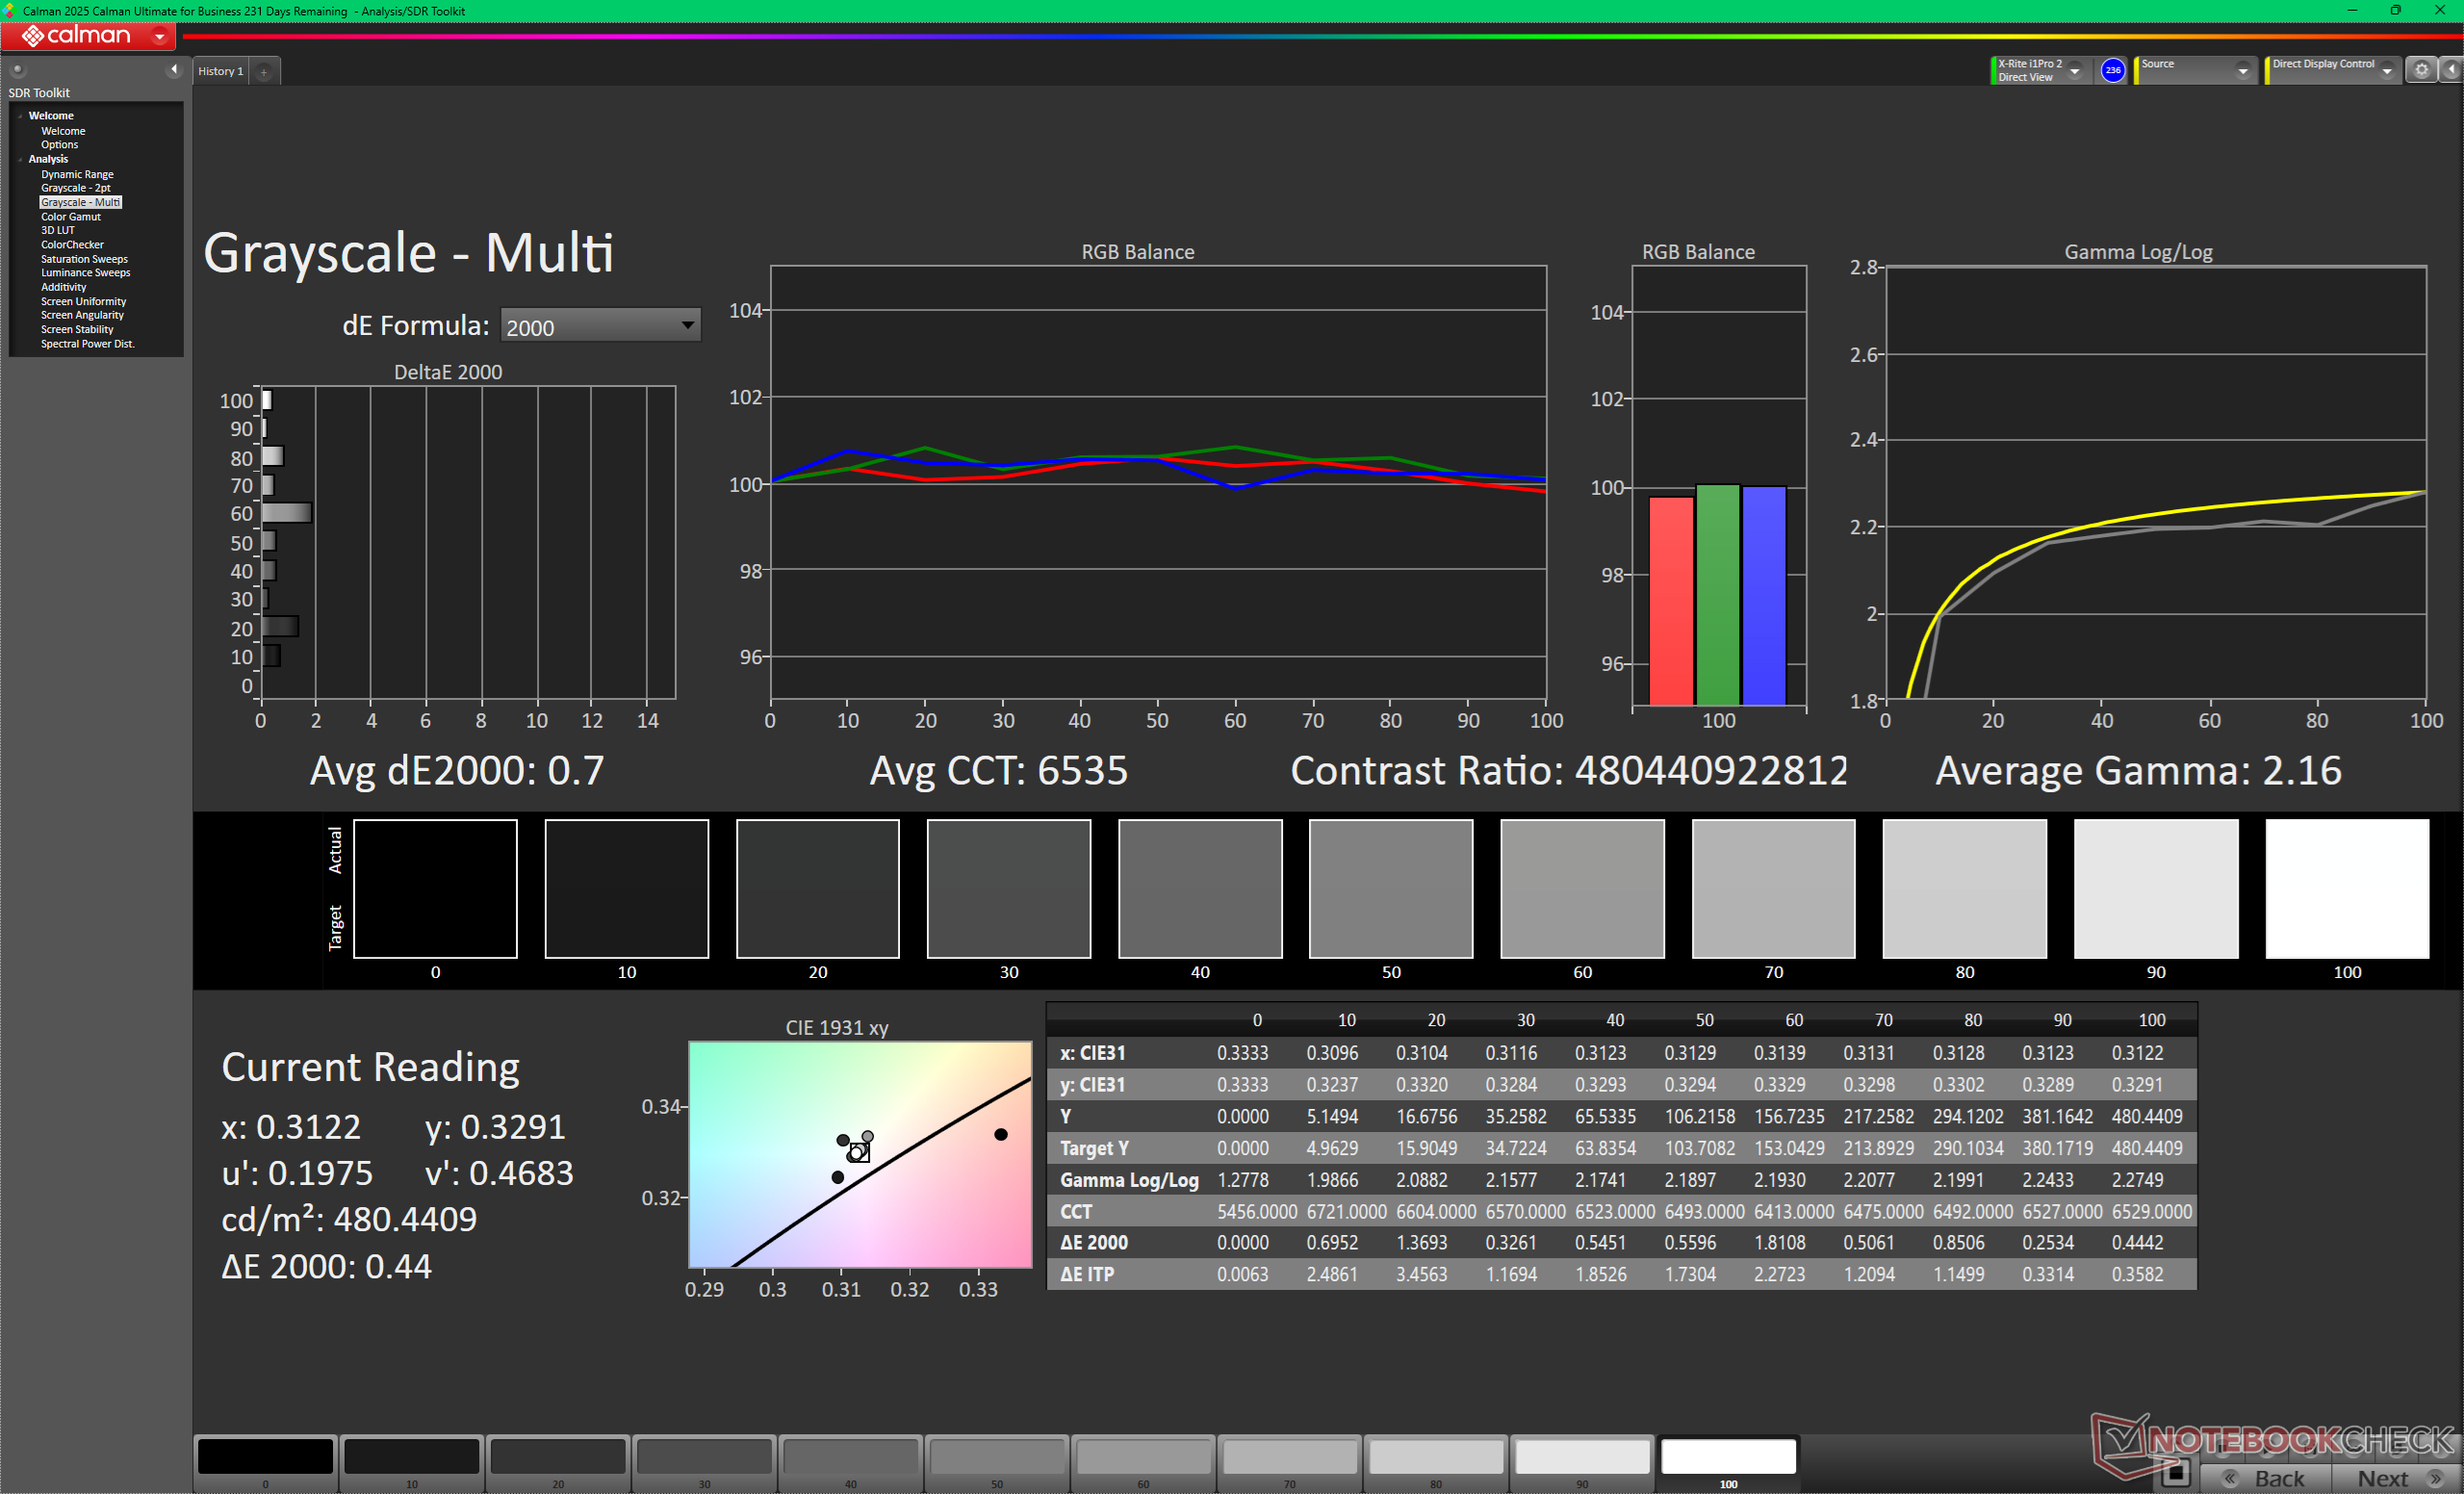
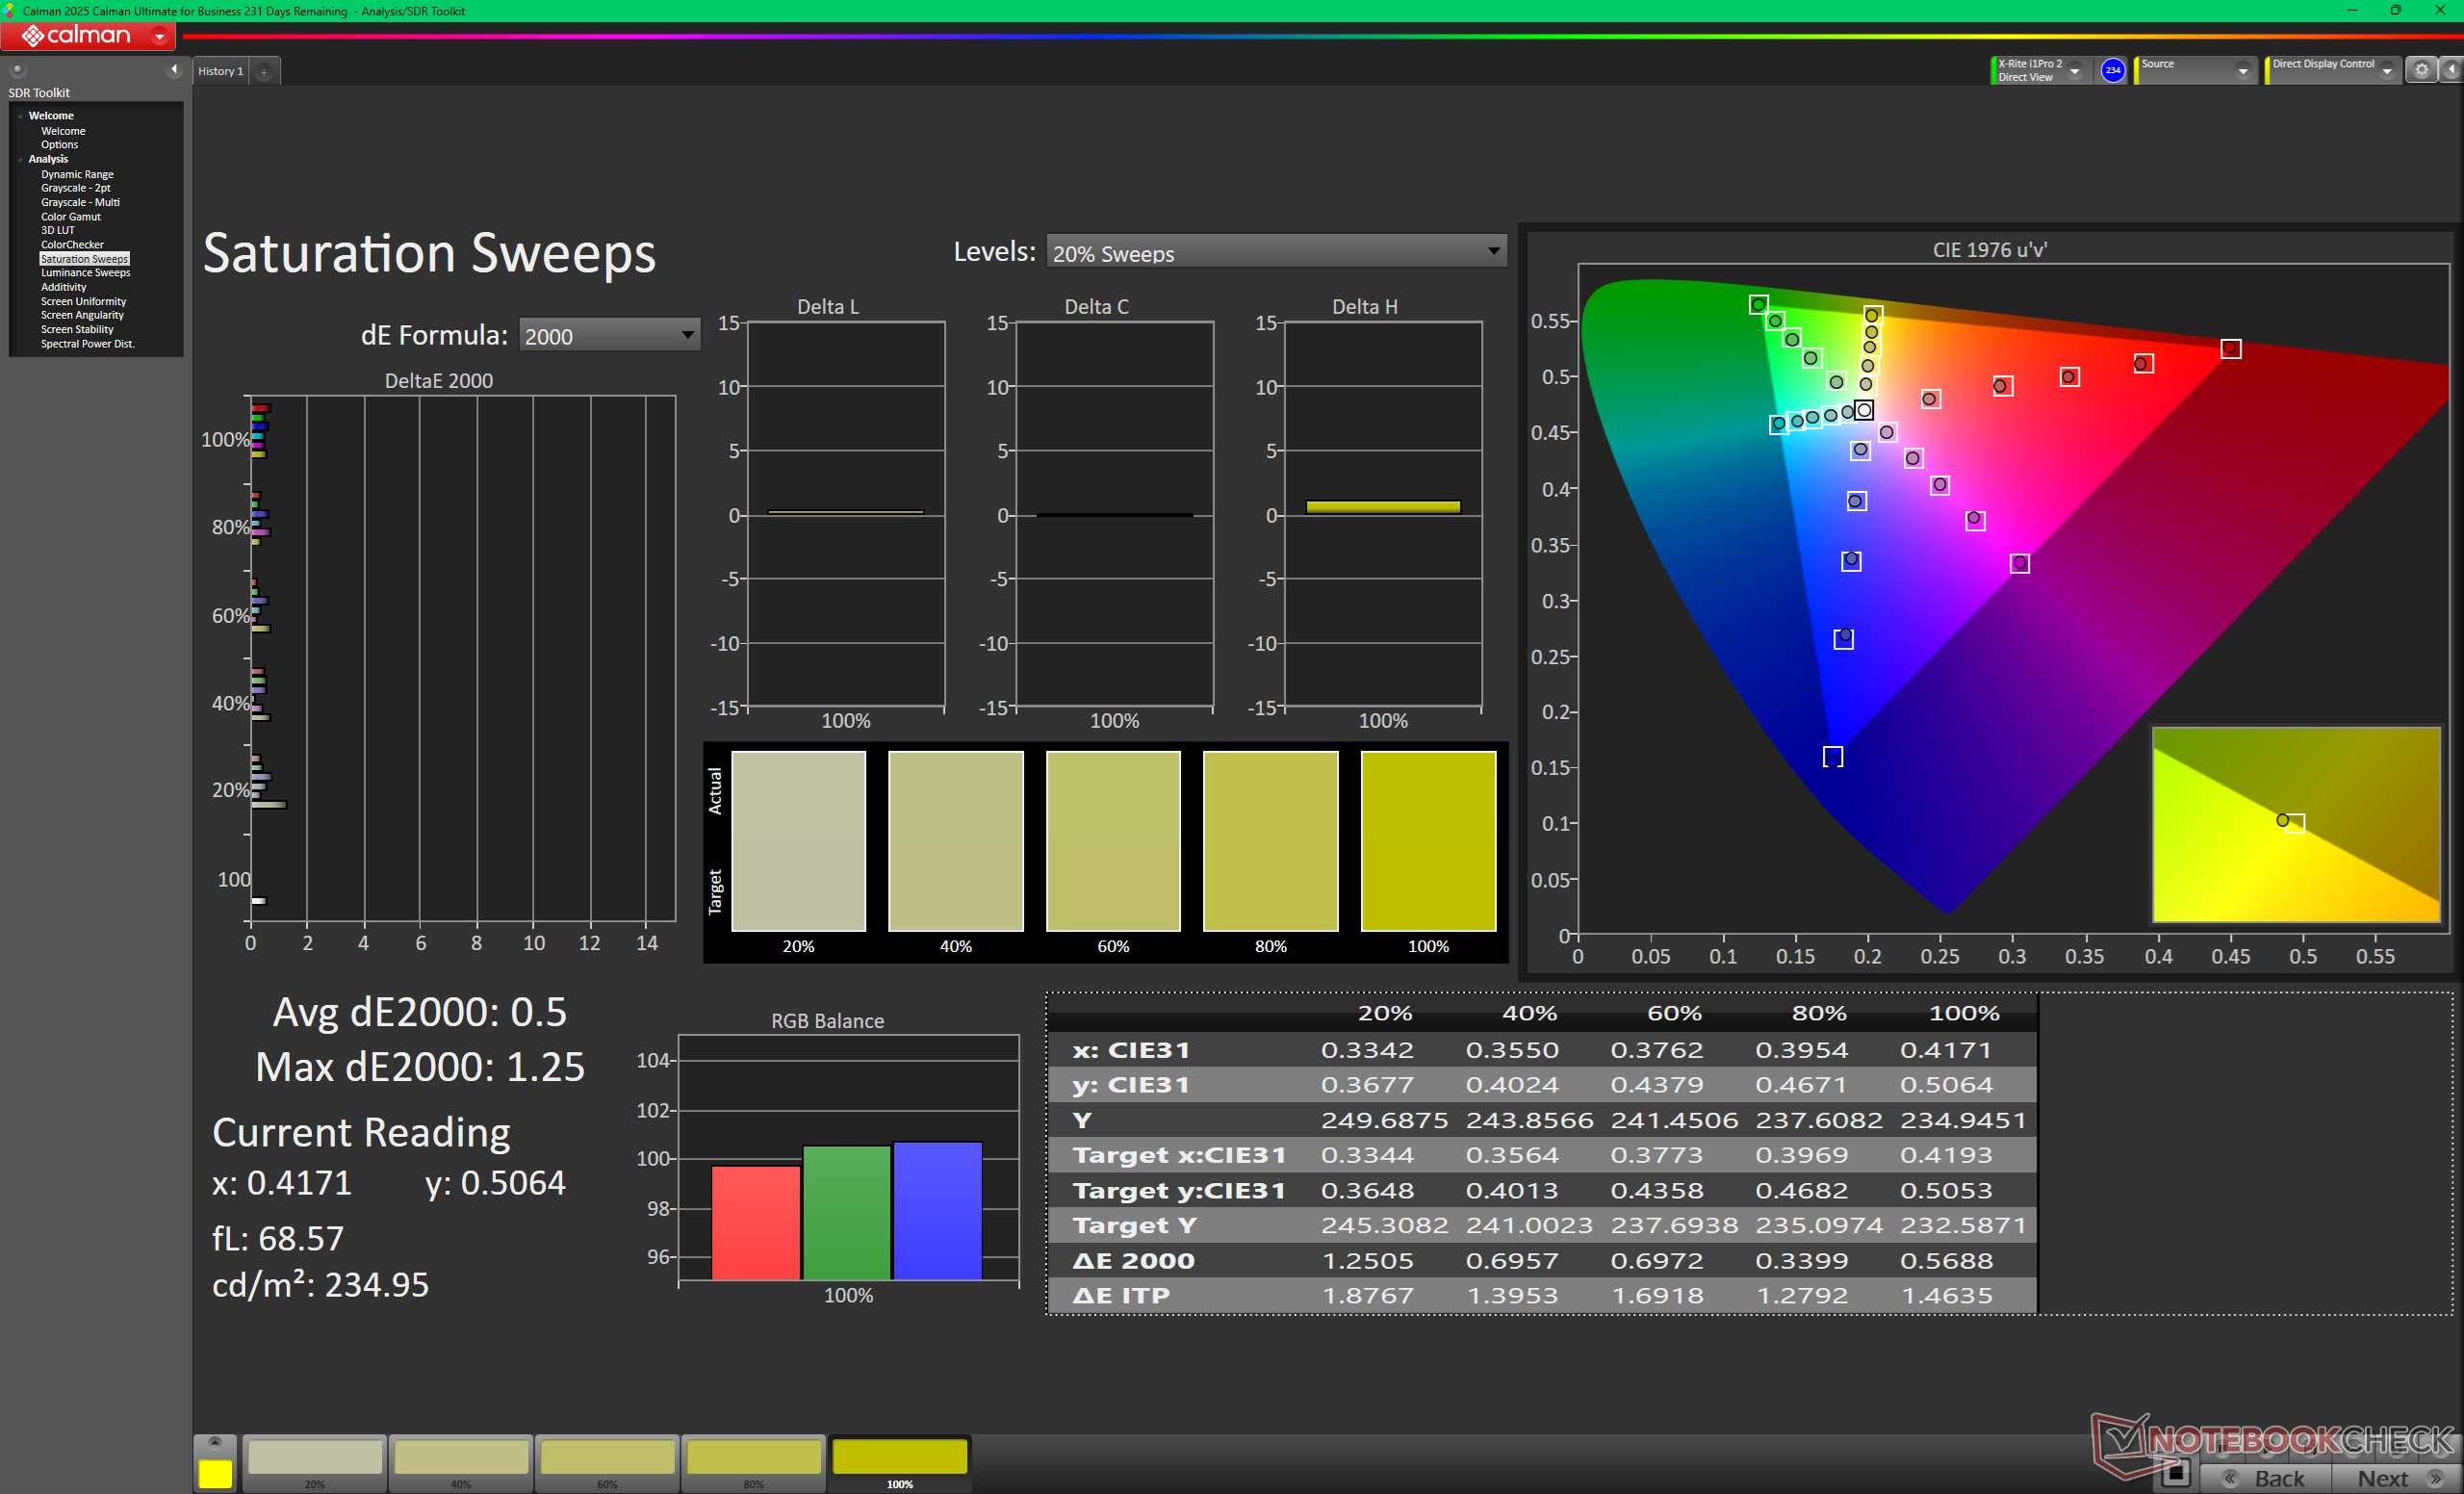
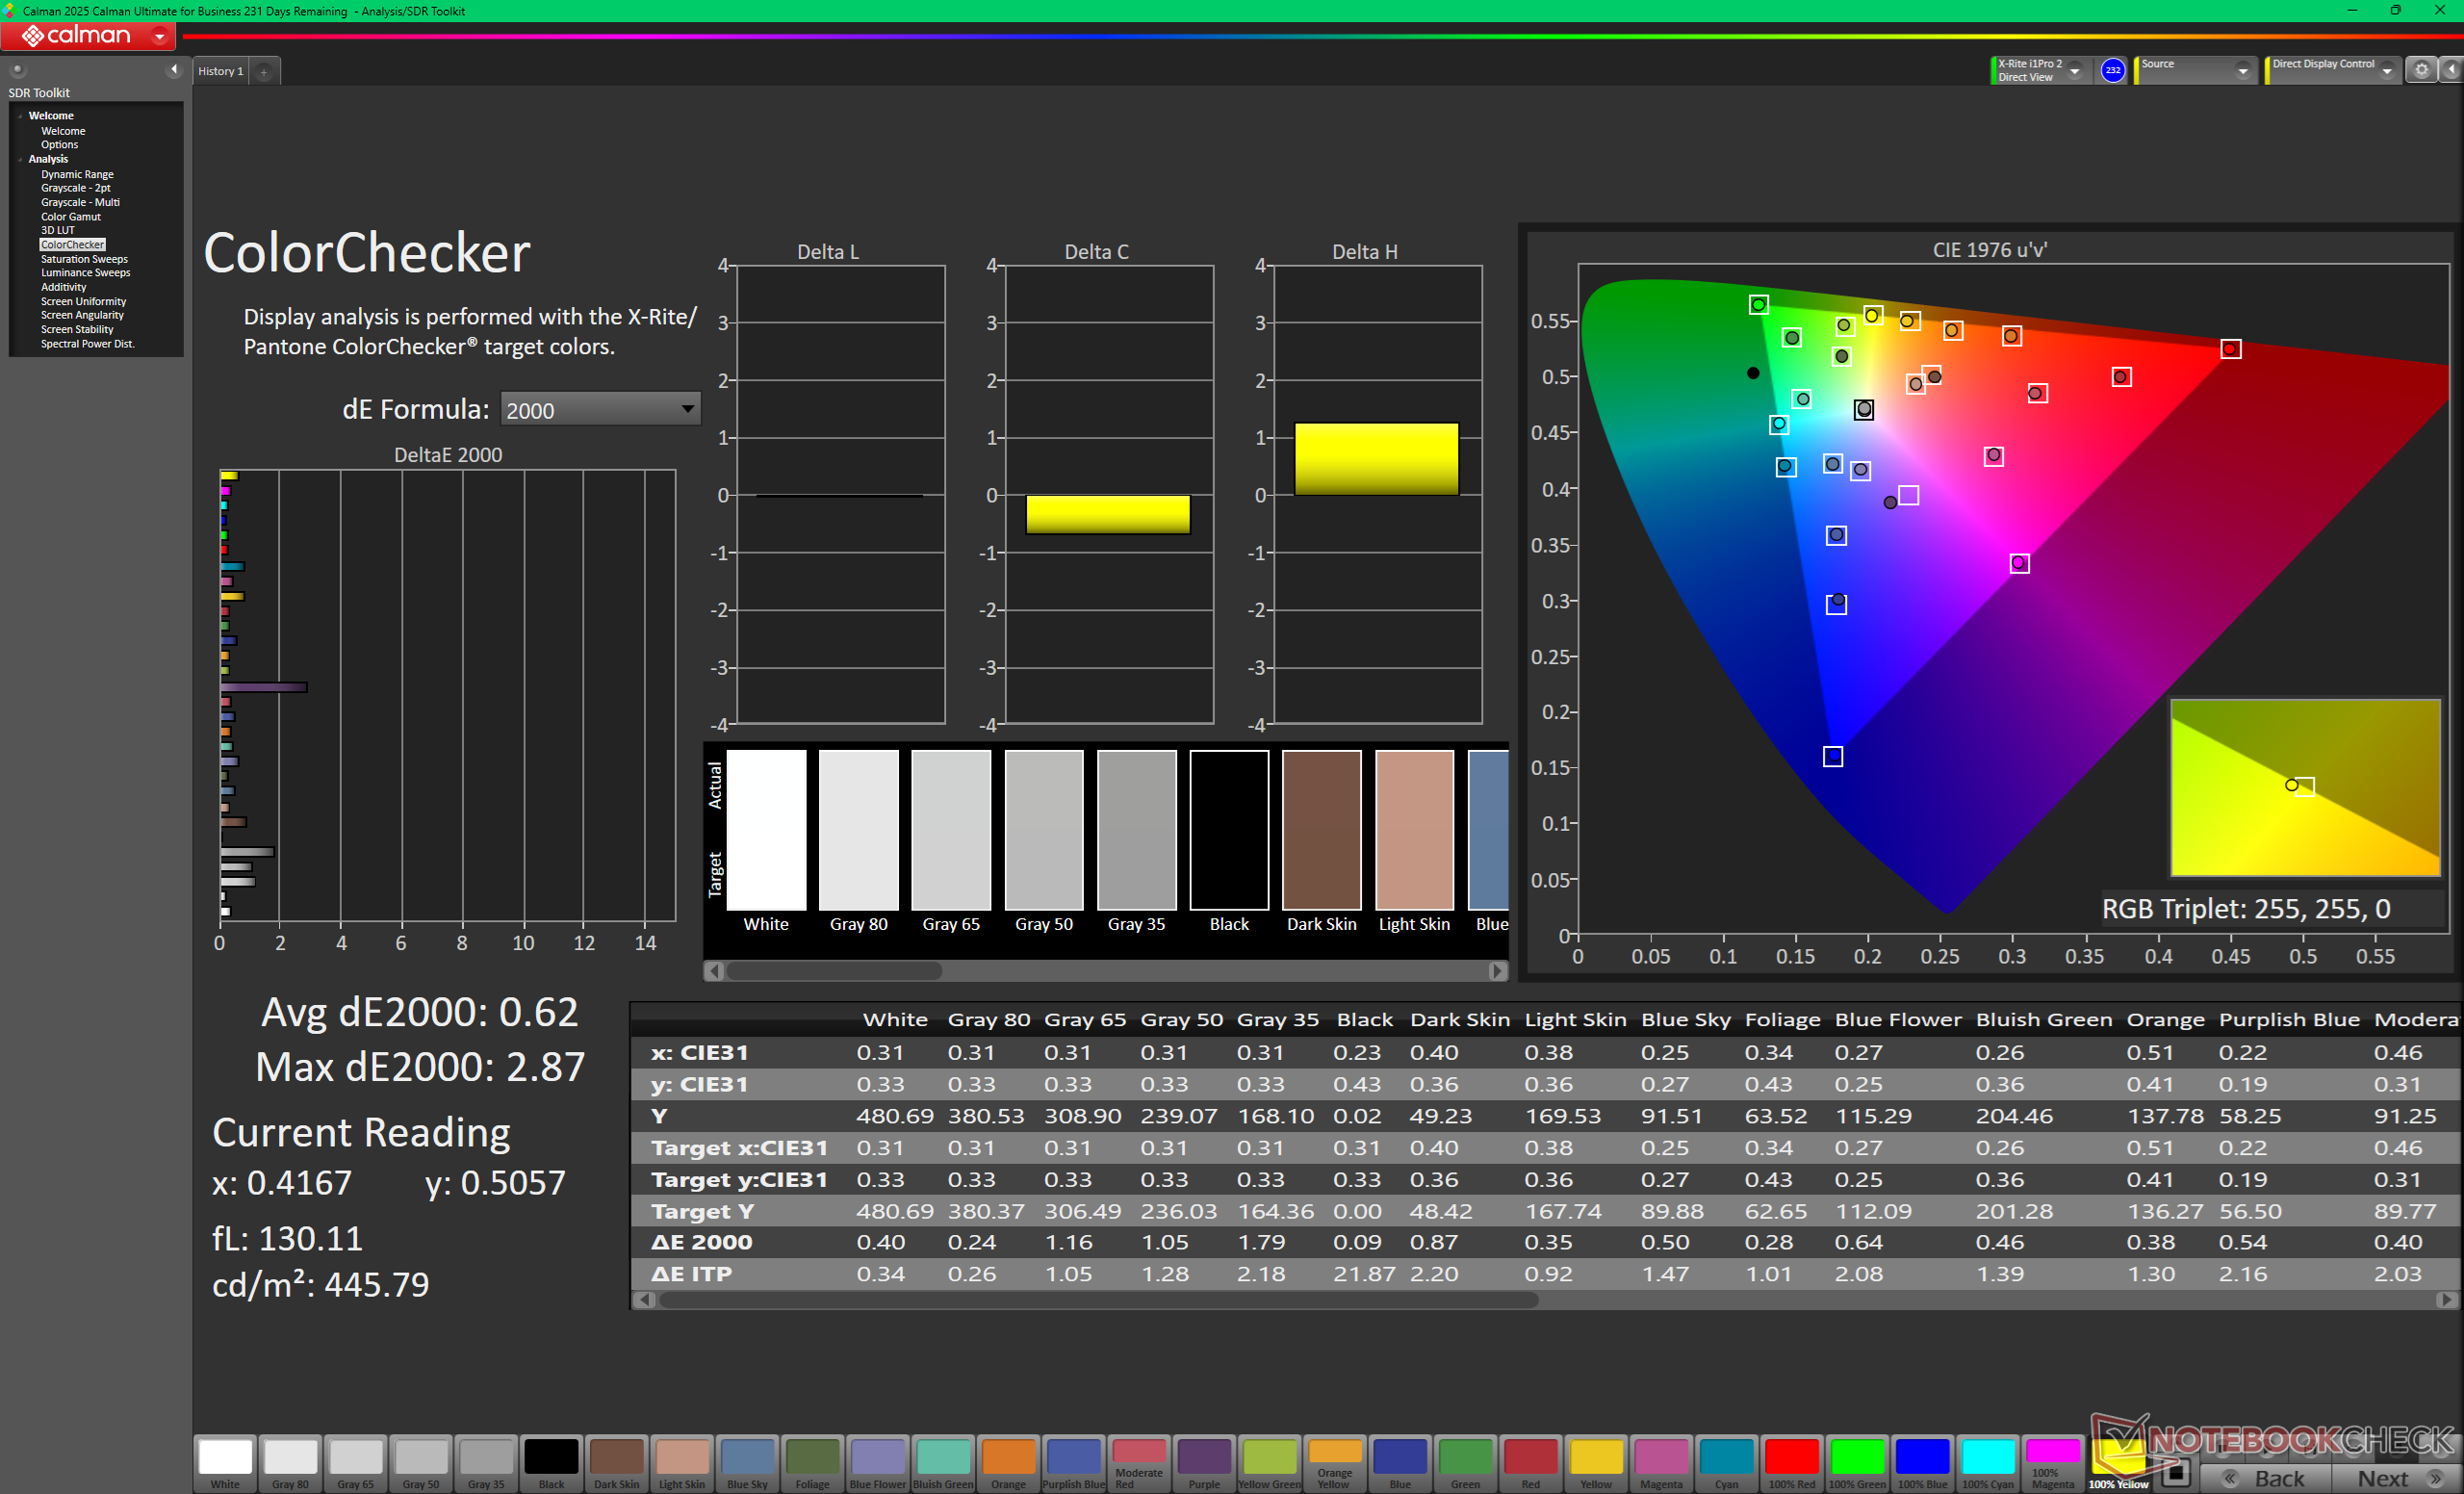
ΔE ColorChecker Calman: 0.62 | ∀{0.5-29.43 Ø4.71}
ΔE Greyscale Calman: 0.7 | ∀{0.09-98 Ø4.96}
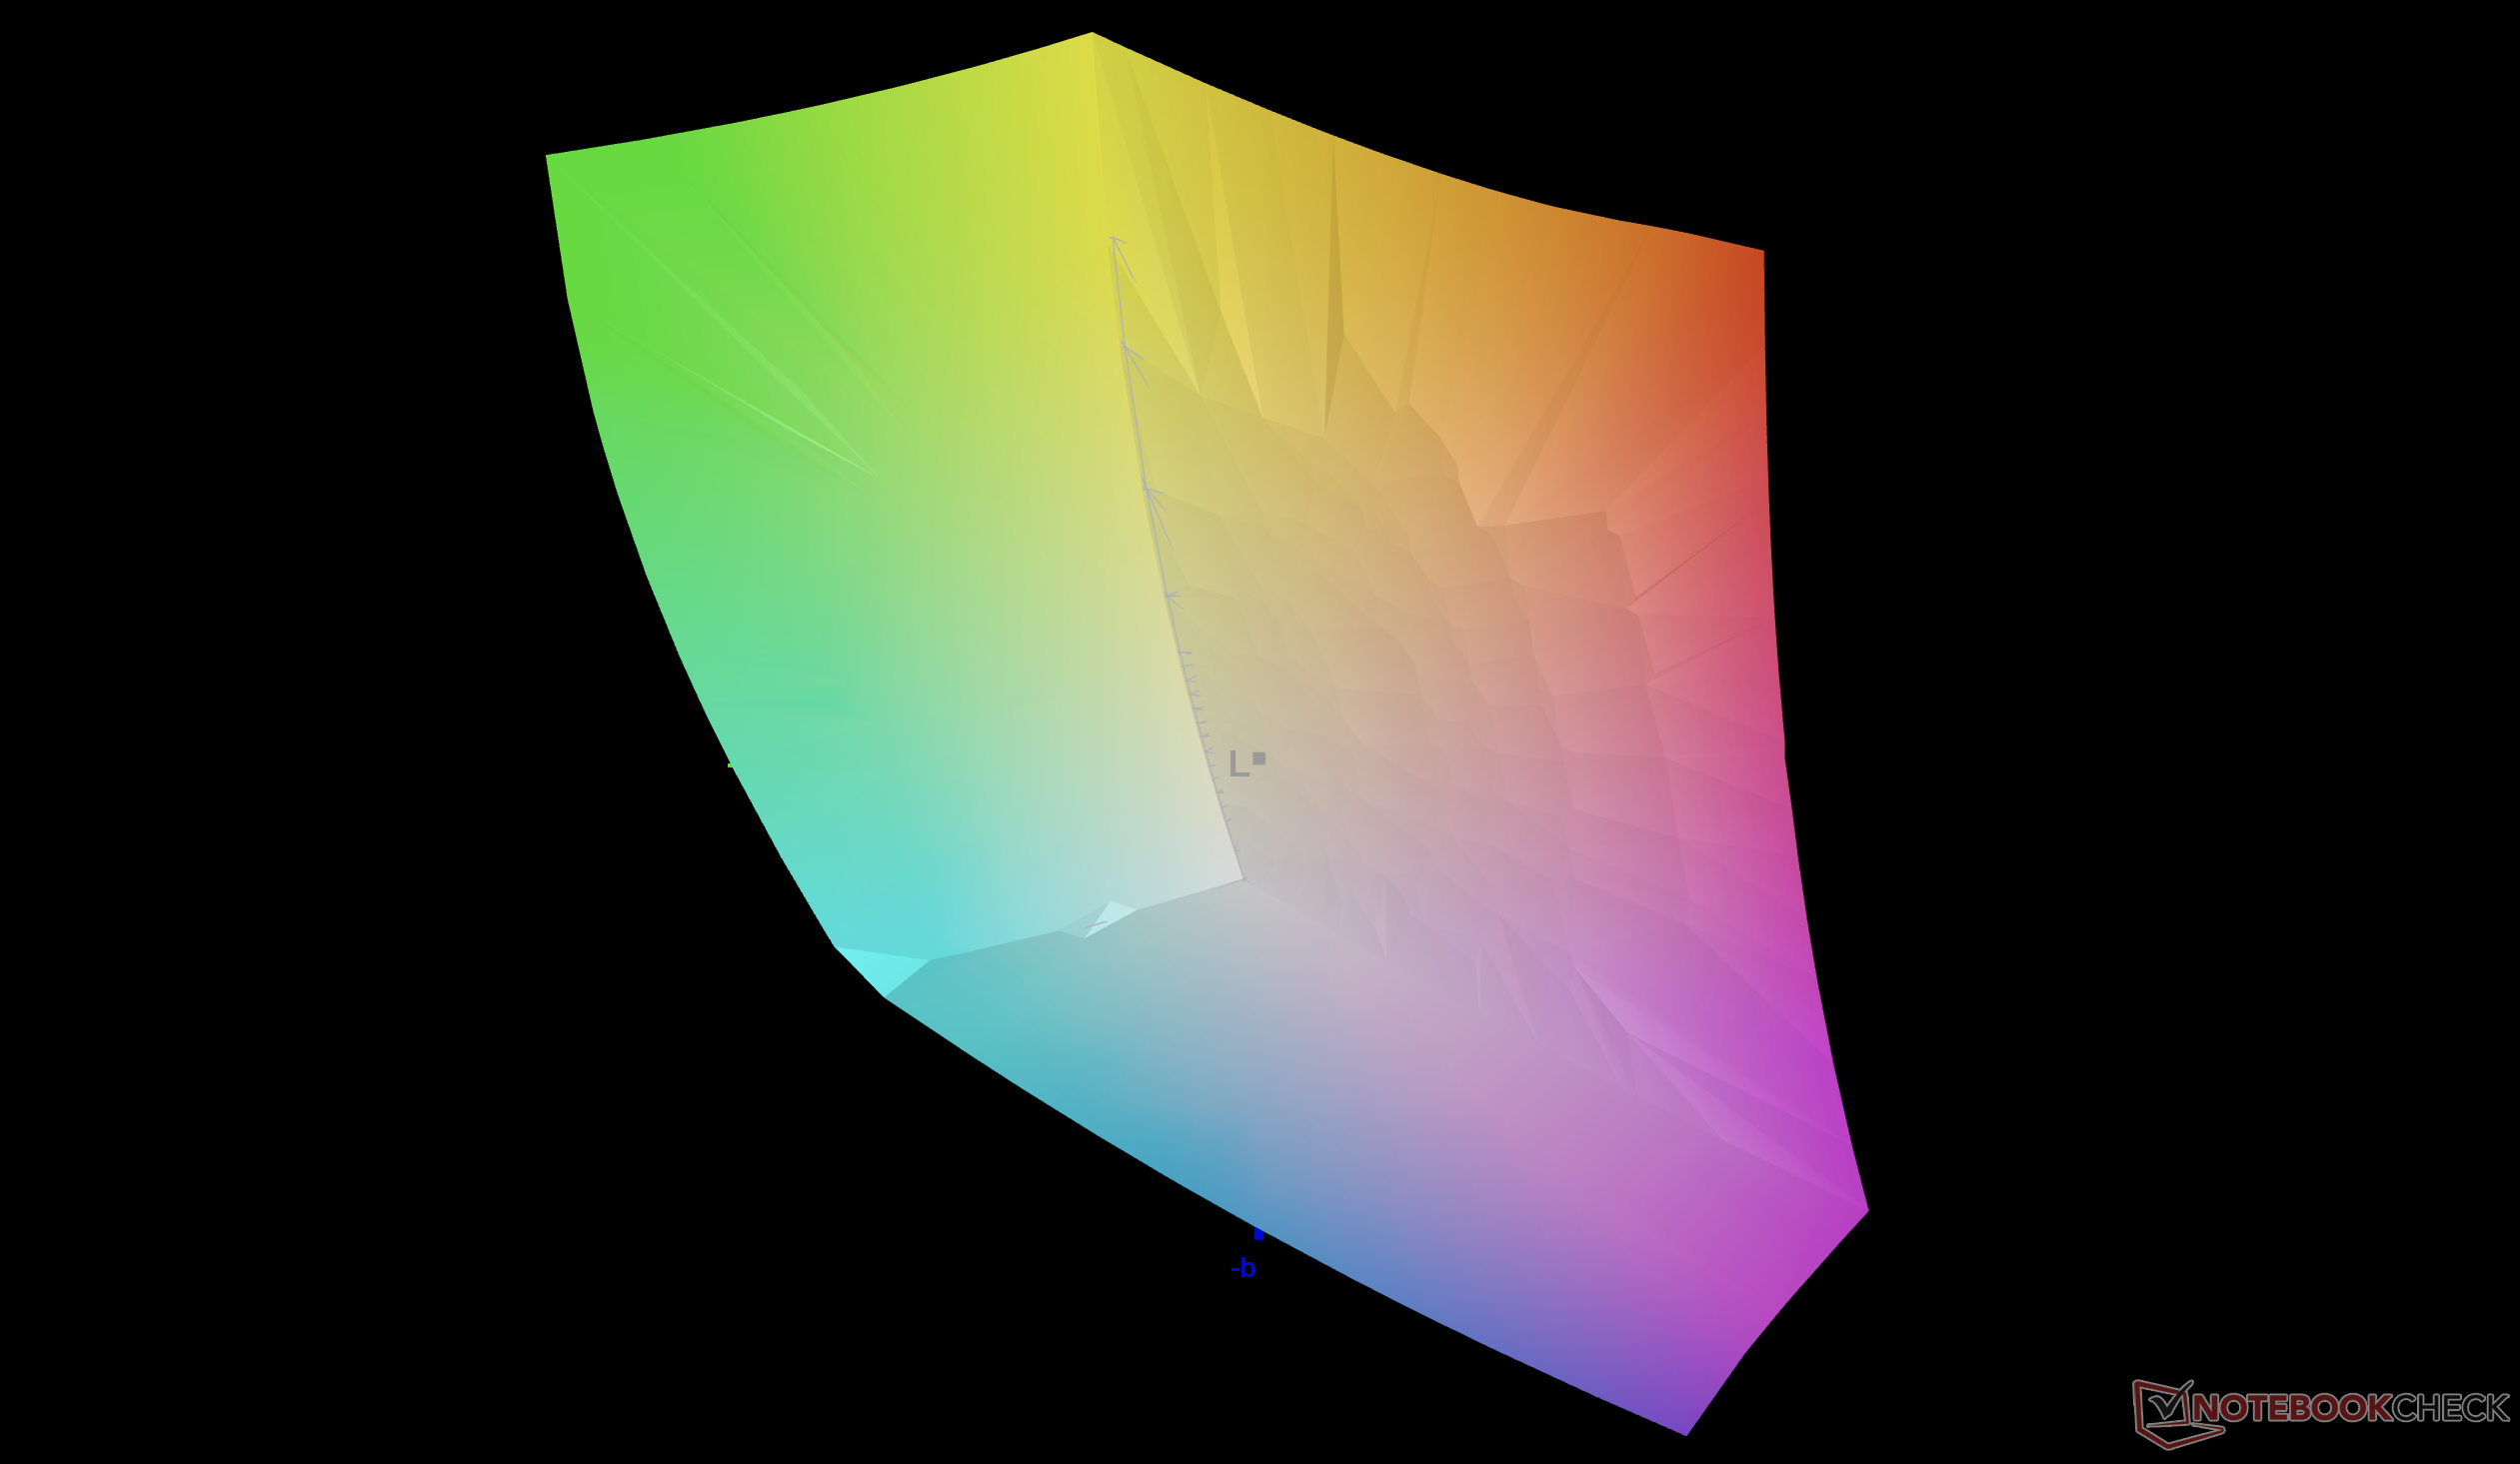
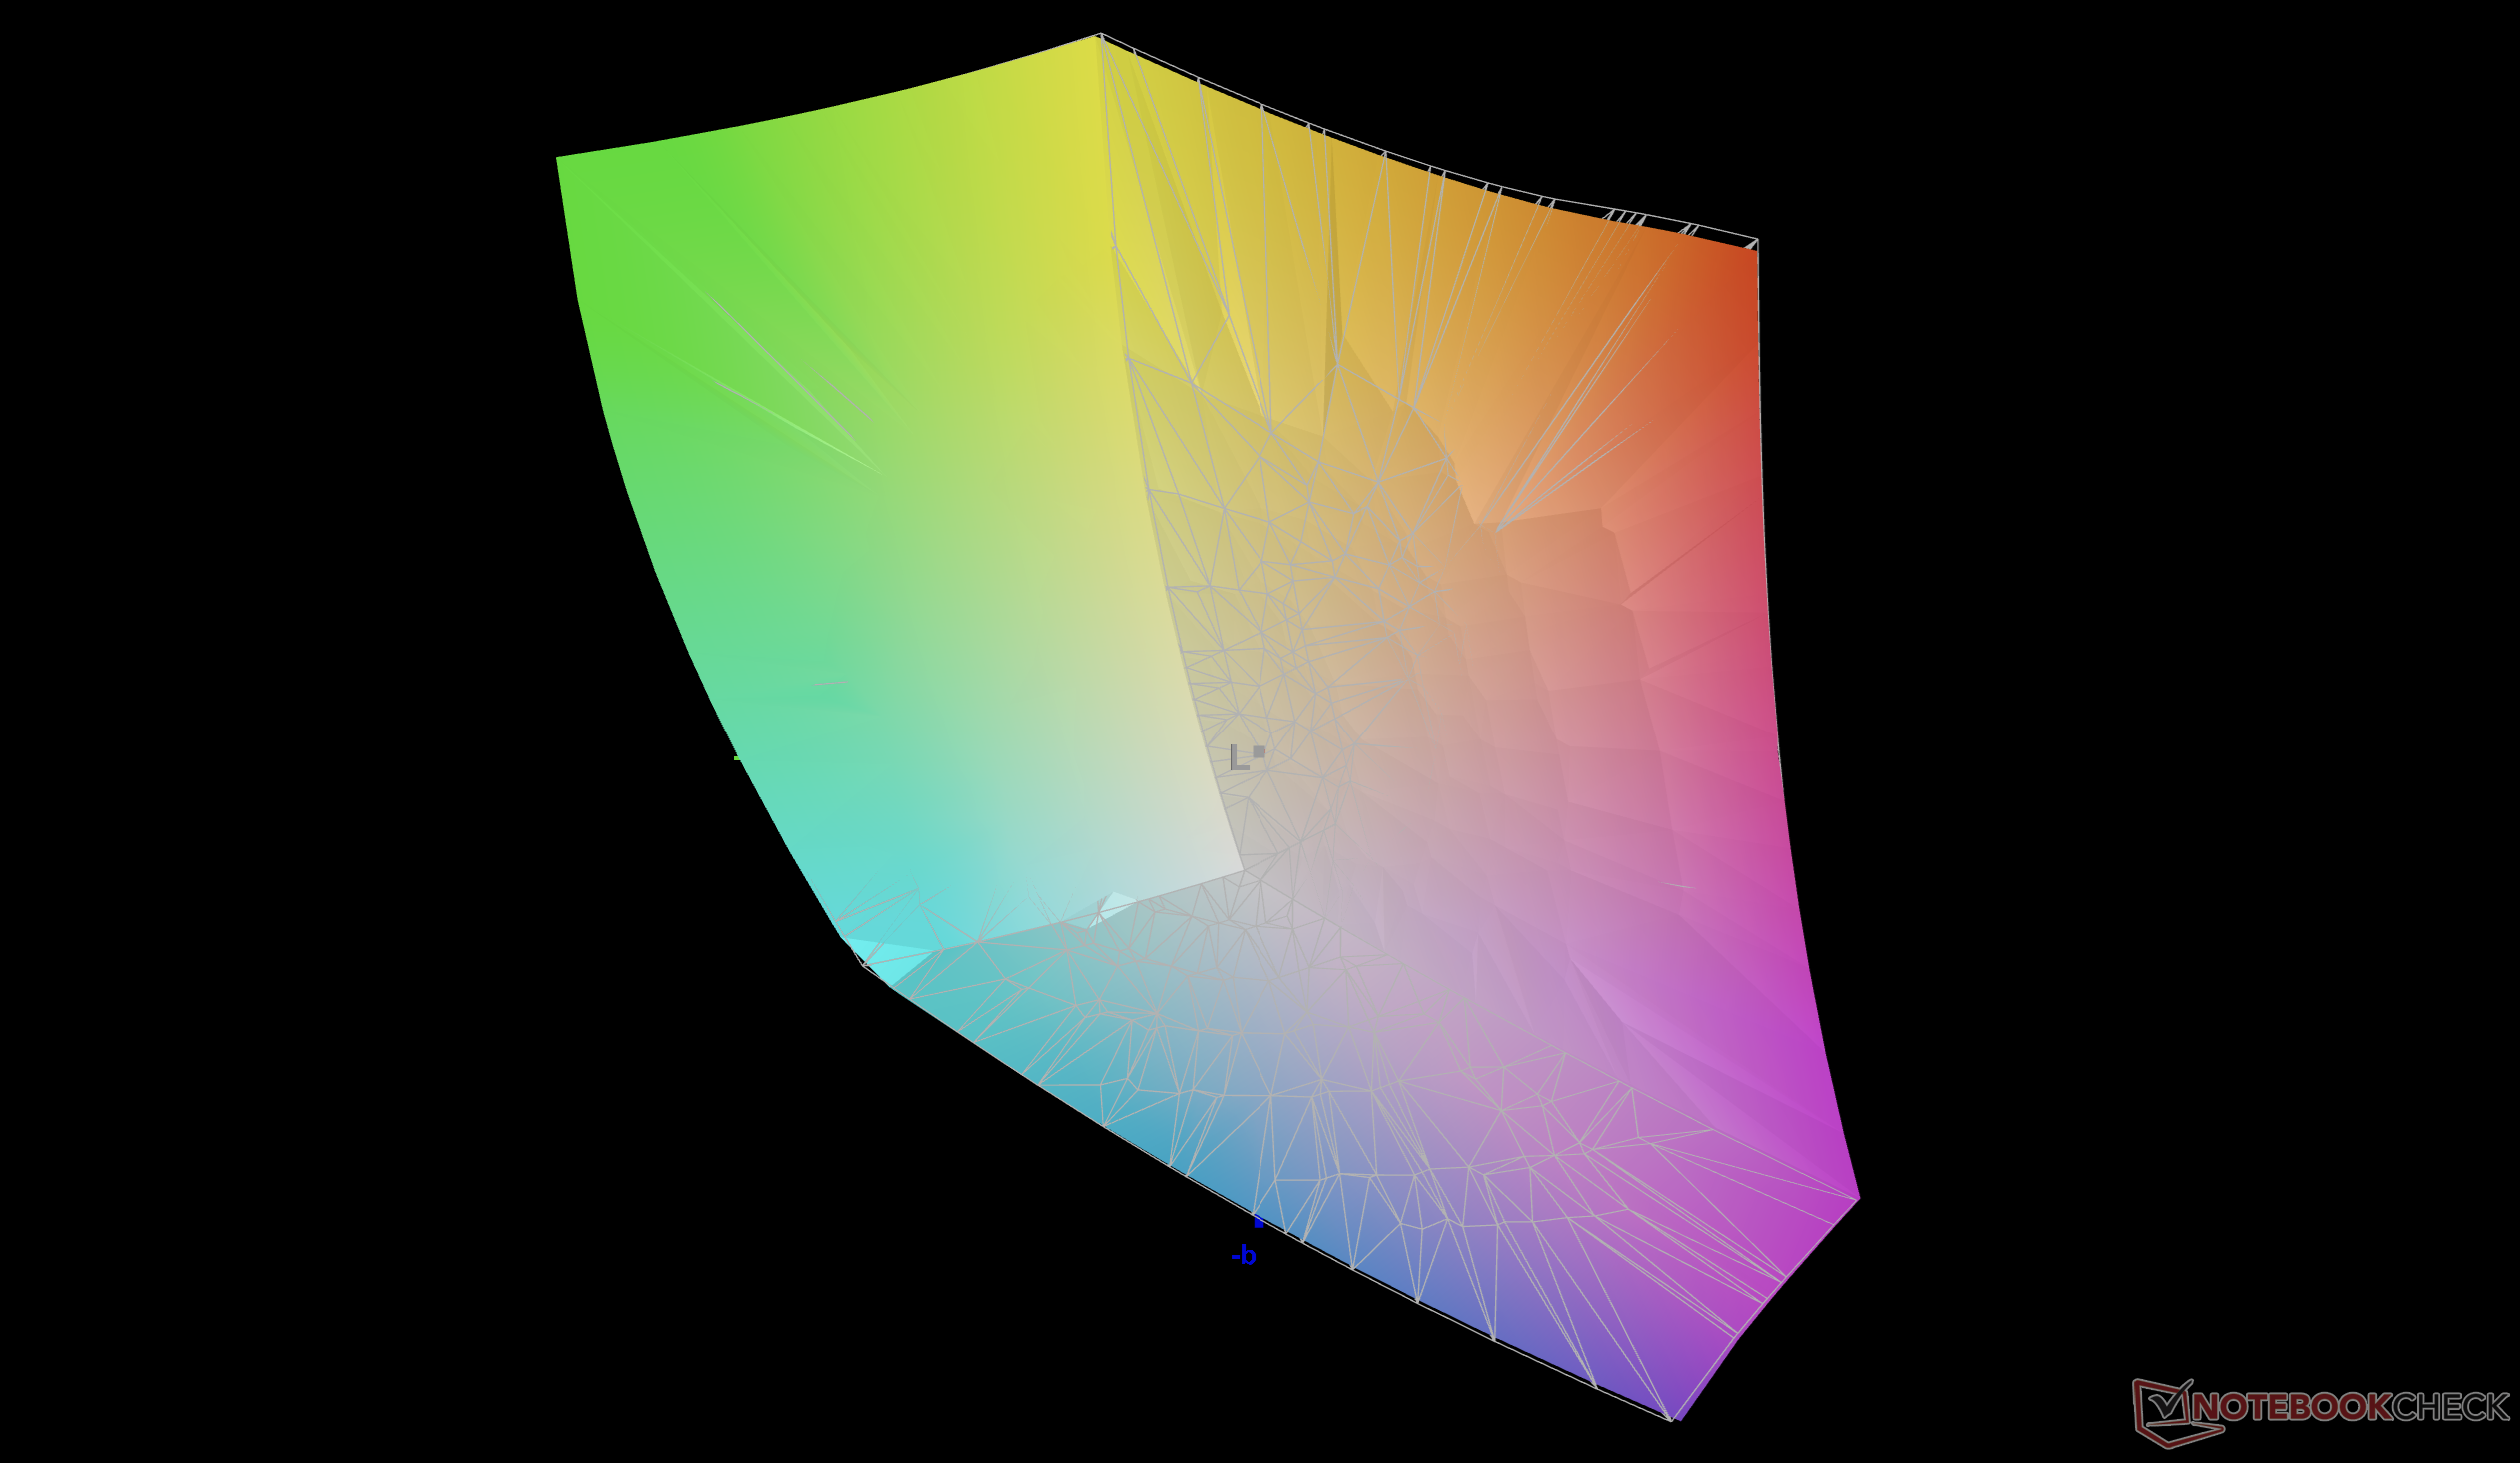
87.5% AdobeRGB 1998 (Argyll 3D)
99.9% sRGB (Argyll 3D)
99.3% Display P3 (Argyll 3D)
Gamma: 2.16
CCT: 6535 K
| MSI Raider 16 Max HX B2WJ Samsung ATNA60HU01-0, OLED, 2560x1600, 16", 240 Hz | MSI Crosshair 16 HX AI D2XWGKG AUO B160QAN02.3, IPS, 2560x1600, 16", 240 Hz | Razer Blade 16 Core Ultra 9 386H Samsung ATNA60HU06-0, OLED, 2560x1600, 16", 240 Hz | Alienware 16X Aurora Core Ultra 9 290HX Plus Samsung 160HU05, OLED, 2560x1600, 16", 240 Hz | Asus TUF Gaming A16 FA608UP MNG007DA5-3, IPS, 2560x1600, 16", 165 Hz | Lenovo Legion 7 16IAX10 Samsung ATNA60HS01-0, OLED, 2560x1600, 16", 165 Hz | |
|---|---|---|---|---|---|---|
| Display | -3% | 2% | 2% | -17% | 2% | |
| Display P3 Coverage (%) | 99.3 | 95.5 -4% | 99.7 0% | 99.6 0% | 69.4 -30% | 99.6 0% |
| sRGB Coverage (%) | 99.9 | 99.7 0% | 100 0% | 100 0% | 97.2 -3% | 100 0% |
| AdobeRGB 1998 Coverage (%) | 87.5 | 83.9 -4% | 93.5 7% | 93.9 7% | 71.9 -18% | 93.5 7% |
| Response Times | -1450% | 2% | -1% | -1641% | -62% | |
| Response Time Grey 50% / Grey 80% * (ms) | 0.28 ? | 3.59 ? -1182% | 0.28 ? -0% | 0.29 ? -4% | 6.3 ? -2150% | 0.6 ? -114% |
| Response Time Black / White * (ms) | 0.39 ? | 7.09 ? -1718% | 0.4 ? -3% | 0.45 ? -15% | 4.8 ? -1131% | 0.8 ? -105% |
| PWM Frequency (Hz) | 1440 ? | 1441 | 1439.8 ? | 1317 ? | ||
| PWM Amplitude * (%) | 35 | 32 9% | 29 17% | 23 34% | ||
| Screen | -326% | -81% | -105% | -33% | -91% | |
| Brightness middle (cd/m²) | 478.6 | 472 -1% | 462.2 -3% | 380.5 -20% | 480 0% | 477.6 0% |
| Brightness (cd/m²) | 481 | 438 -9% | 465 -3% | 384 -20% | 456 -5% | 483 0% |
| Brightness Distribution (%) | 98 | 88 -10% | 97 -1% | 98 0% | 91 -7% | 95 -3% |
| Black Level * (cd/m²) | 0.4 | 0.32 | ||||
| Colorchecker dE 2000 * | 0.62 | 6.07 -879% | 3.03 -389% | 3.27 -427% | 1.4 -126% | 3.11 -402% |
| Colorchecker dE 2000 max. * | 2.87 | 9.76 -240% | 5.84 -103% | 6.31 -120% | 2.5 13% | 5.99 -109% |
| Greyscale dE 2000 * | 0.7 | 6.4 -814% | 0.6 14% | 1 -43% | 1.2 -71% | 0.9 -29% |
| Gamma | 2.16 102% | 2.52 87% | 2.2 100% | 2.23 99% | 2.16 102% | 2.18 101% |
| CCT | 6535 99% | 7987 81% | 6452 101% | 6410 101% | 6620 98% | 6405 101% |
| Contrast (:1) | 1180 | 1500 | ||||
| Colorchecker dE 2000 calibrated * | 2.25 | 0.6 | 1.1 | 1.3 | 0.79 | |
| Teljes átlag (program / beállítások) | -593% /
-442% | -26% /
-39% | -35% /
-52% | -564% /
-321% | -50% /
-60% |
* ... a kisebb jobb

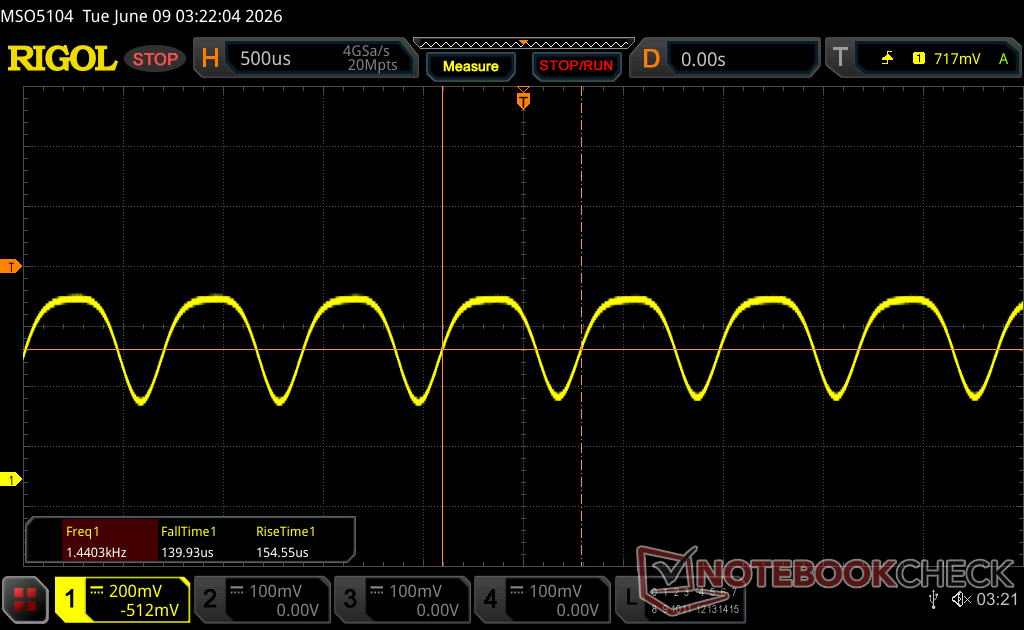
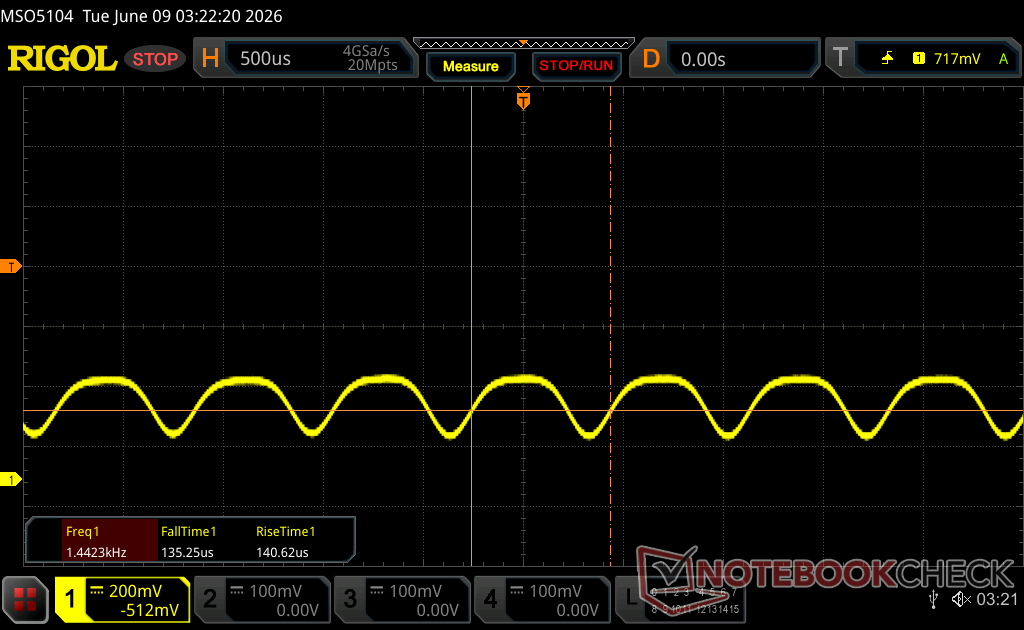
Megjelenítési válaszidők
| ↔ Válaszidő Fekete-fehér | ||
|---|---|---|
| 0.39 ms ... emelkedés és süllyedés ↘ kombinálva | ↗ 0.21 ms emelkedés |  |
| ↘ 0.18 ms ősz | ||
| A képernyő tesztjeinkben nagyon gyors reakciósebességet mutatott, és nagyon jól használható gyors tempójú játékokhoz. Összehasonlításképpen, az összes tesztelt eszköz 0.1 (minimum) és 240 (maximum) ms között mozog. » 0 % of all devices are better. Ez azt jelenti, hogy a mért válaszidő jobb, mint az összes vizsgált eszköz átlaga (19.8 ms). | ||
| ↔ Válaszidő 50% szürke és 80% szürke között | ||
| 0.28 ms ... emelkedés és süllyedés ↘ kombinálva | ↗ 0.14 ms emelkedés | 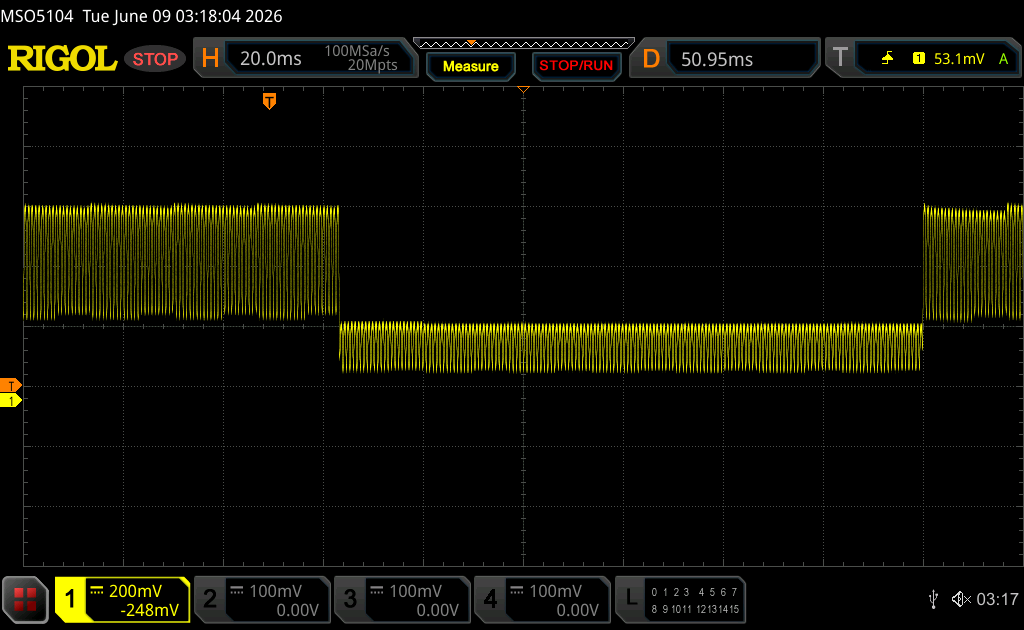 |
| ↘ 0.14 ms ősz | ||
| A képernyő tesztjeinkben nagyon gyors reakciósebességet mutatott, és nagyon jól használható gyors tempójú játékokhoz. Összehasonlításképpen, az összes tesztelt eszköz 0.165 (minimum) és 636 (maximum) ms között mozog. » 0 % of all devices are better. Ez azt jelenti, hogy a mért válaszidő jobb, mint az összes vizsgált eszköz átlaga (31 ms). | ||
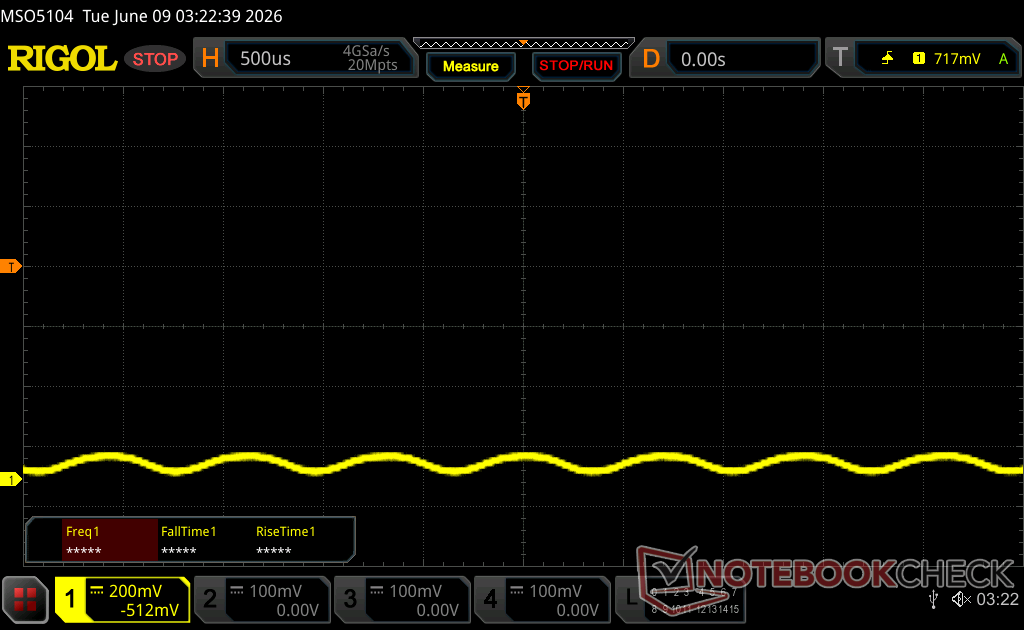
Képernyő villogása / PWM (impulzusszélesség-moduláció)
| Képernyő villogása / PWM észlelve | 1440 Hz Amplitude: 35 % | ≤ 100 % fényerő beállítása | 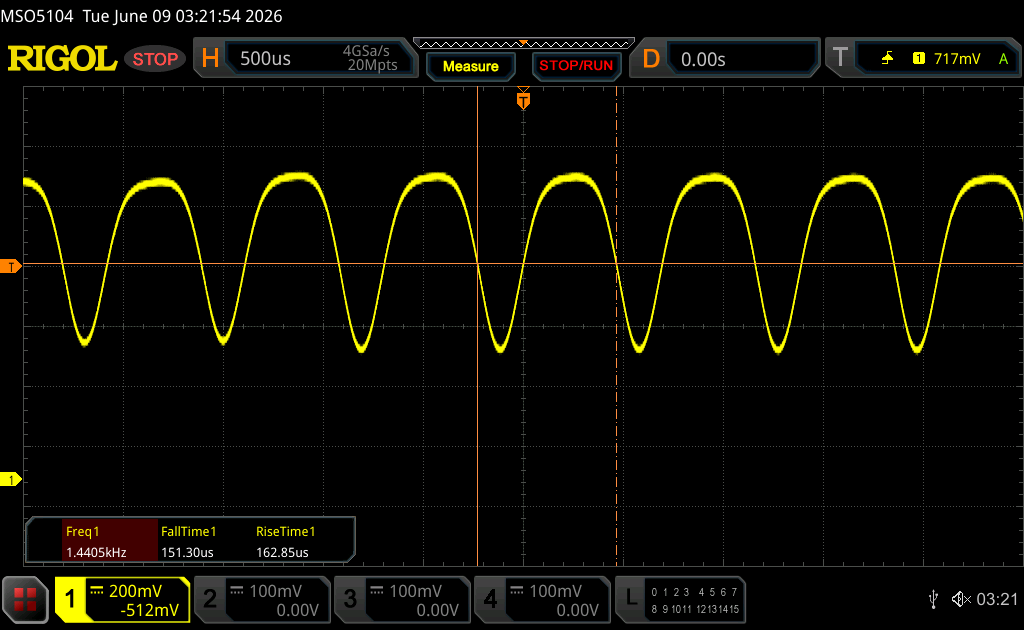 |
A kijelző háttérvilágítása 1440 Hz-en villog (a legrosszabb esetben, pl. PWM használatával) Villódzás észlelve a 100 % vagy annál kisebb fényerő-beállításnál. E fényerő-beállítás felett nem lehet villogás vagy PWM. A 1440 Hz frekvenciája meglehetősen magas, így a legtöbb PWM-re érzékeny felhasználó nem észlel semmilyen villogást. Összehasonlításképpen: az összes tesztelt eszköz 52 %-a nem használja a PWM-et a kijelző elsötétítésére. Ha PWM-et észleltek, akkor átlagosan 7757 (minimum: 5 - maximum: 343500) Hz-t mértek. | |||


Teljesítmény
Vizsgálati feltételek
Az alábbi benchmarkok futtatása előtt az MSI Center-t Extreme Performance módra és diszkrét grafikus módra állítottuk.
Processzor
A Core Ultra 9 290HX Plus lényegében egy túlhajtott Core Ultra 9 275HX pontosan ugyanolyan gyorsítótármérettel és magok számával. A felhasználók nagyjából 15 százalékkal gyorsabb CPU-teljesítményre számíthatnak, ha összehasonlítják a MSI Crosshair 16 HX. Még érdekesebb, hogy az MSI akár 10 százalékkal gyorsabban futna, mint a Dell Alienware 16X Aurora pontosan ugyanazzal a Core Ultra 9 290HX Plus processzorral, amint azt az alábbi összehasonlító táblázatok is mutatják.
Cinebench R15 Multi Loop
Cinebench R23: Multi Core | Single Core
Cinebench R20: CPU (Multi Core) | CPU (Single Core)
Cinebench R15: CPU Multi 64Bit | CPU Single 64Bit
Blender: v2.79 BMW27 CPU
7-Zip 18.03: 7z b 4 | 7z b 4 -mmt1
Geekbench 6.7: Multi-Core | Single-Core
Geekbench 5.5: Multi-Core | Single-Core
HWBOT x265 Benchmark v2.2: 4k Preset
LibreOffice : 20 Documents To PDF
R Benchmark 2.5: Overall mean
| CPU Performance rating | |
| MSI Raider 16 Max HX B2WJ | |
| Schenker XMG Neo 16 A25 5090 | |
| Átlagos Intel Core Ultra 9 290HX Plus | |
| Schenker XMG APEX 16 MAX | |
| Alienware 16X Aurora Core Ultra 9 290HX Plus | |
| MSI Crosshair 16 HX AI D2XWGKG | |
| MSI Raider GE68HX 13VF | |
| Lenovo Legion 7 16IAX10 | |
| HP Omen Transcend 16 -2! | |
| Razer Blade 16 Core Ultra 9 386H | |
| Lenovo Legion 7 16 AGP11 | |
| Asus TUF Gaming A16 FA608UP | |
| Lenovo Legion 5 Pro 16 G7 i7 RTX 3070Ti -2! | |
| Cinebench R23 / Multi Core | |
| MSI Raider 16 Max HX B2WJ | |
| Átlagos Intel Core Ultra 9 290HX Plus (37038 - 42661, n=5) | |
| Schenker XMG Neo 16 A25 5090 | |
| Alienware 16X Aurora Core Ultra 9 290HX Plus | |
| Schenker XMG APEX 16 MAX | |
| MSI Crosshair 16 HX AI D2XWGKG | |
| Lenovo Legion 7 16IAX10 | |
| MSI Raider GE68HX 13VF | |
| HP Omen Transcend 16 | |
| Lenovo Legion 7 16 AGP11 | |
| Razer Blade 16 Core Ultra 9 386H | |
| Lenovo Legion 5 Pro 16 G7 i7 RTX 3070Ti | |
| Asus TUF Gaming A16 FA608UP | |
| Cinebench R23 / Single Core | |
| Átlagos Intel Core Ultra 9 290HX Plus (2319 - 2415, n=5) | |
| MSI Raider 16 Max HX B2WJ | |
| Alienware 16X Aurora Core Ultra 9 290HX Plus | |
| MSI Crosshair 16 HX AI D2XWGKG | |
| Schenker XMG Neo 16 A25 5090 | |
| Schenker XMG APEX 16 MAX | |
| Lenovo Legion 7 16IAX10 | |
| HP Omen Transcend 16 | |
| MSI Raider GE68HX 13VF | |
| Razer Blade 16 Core Ultra 9 386H | |
| Lenovo Legion 7 16 AGP11 | |
| Lenovo Legion 5 Pro 16 G7 i7 RTX 3070Ti | |
| Asus TUF Gaming A16 FA608UP | |
| Cinebench R20 / CPU (Multi Core) | |
| MSI Raider 16 Max HX B2WJ | |
| Átlagos Intel Core Ultra 9 290HX Plus (14397 - 16433, n=5) | |
| Schenker XMG Neo 16 A25 5090 | |
| Alienware 16X Aurora Core Ultra 9 290HX Plus | |
| Schenker XMG APEX 16 MAX | |
| MSI Crosshair 16 HX AI D2XWGKG | |
| Lenovo Legion 7 16IAX10 | |
| MSI Raider GE68HX 13VF | |
| HP Omen Transcend 16 | |
| Lenovo Legion 7 16 AGP11 | |
| Razer Blade 16 Core Ultra 9 386H | |
| Lenovo Legion 5 Pro 16 G7 i7 RTX 3070Ti | |
| Asus TUF Gaming A16 FA608UP | |
| Cinebench R20 / CPU (Single Core) | |
| MSI Raider 16 Max HX B2WJ | |
| Átlagos Intel Core Ultra 9 290HX Plus (864 - 913, n=5) | |
| Alienware 16X Aurora Core Ultra 9 290HX Plus | |
| Schenker XMG APEX 16 MAX | |
| MSI Crosshair 16 HX AI D2XWGKG | |
| Schenker XMG Neo 16 A25 5090 | |
| Lenovo Legion 7 16IAX10 | |
| Lenovo Legion 7 16 AGP11 | |
| HP Omen Transcend 16 | |
| MSI Raider GE68HX 13VF | |
| Razer Blade 16 Core Ultra 9 386H | |
| Lenovo Legion 5 Pro 16 G7 i7 RTX 3070Ti | |
| Asus TUF Gaming A16 FA608UP | |
| Cinebench R15 / CPU Multi 64Bit | |
| MSI Raider 16 Max HX B2WJ | |
| Schenker XMG Neo 16 A25 5090 | |
| Átlagos Intel Core Ultra 9 290HX Plus (5617 - 6330, n=5) | |
| Schenker XMG APEX 16 MAX | |
| Alienware 16X Aurora Core Ultra 9 290HX Plus | |
| MSI Crosshair 16 HX AI D2XWGKG | |
| Lenovo Legion 7 16IAX10 | |
| MSI Raider GE68HX 13VF | |
| HP Omen Transcend 16 | |
| Lenovo Legion 7 16 AGP11 | |
| Razer Blade 16 Core Ultra 9 386H | |
| Lenovo Legion 5 Pro 16 G7 i7 RTX 3070Ti | |
| Asus TUF Gaming A16 FA608UP | |
| Cinebench R15 / CPU Single 64Bit | |
| Alienware 16X Aurora Core Ultra 9 290HX Plus | |
| Átlagos Intel Core Ultra 9 290HX Plus (324 - 350, n=5) | |
| MSI Raider 16 Max HX B2WJ | |
| Schenker XMG APEX 16 MAX | |
| Schenker XMG Neo 16 A25 5090 | |
| MSI Crosshair 16 HX AI D2XWGKG | |
| Lenovo Legion 7 16IAX10 | |
| Razer Blade 16 Core Ultra 9 386H | |
| HP Omen Transcend 16 | |
| MSI Raider GE68HX 13VF | |
| Asus TUF Gaming A16 FA608UP | |
| Lenovo Legion 5 Pro 16 G7 i7 RTX 3070Ti | |
| Lenovo Legion 7 16 AGP11 | |
| Blender / v2.79 BMW27 CPU | |
| Asus TUF Gaming A16 FA608UP | |
| Lenovo Legion 5 Pro 16 G7 i7 RTX 3070Ti | |
| Razer Blade 16 Core Ultra 9 386H | |
| Lenovo Legion 7 16 AGP11 | |
| HP Omen Transcend 16 | |
| Lenovo Legion 7 16IAX10 | |
| MSI Raider GE68HX 13VF | |
| MSI Crosshair 16 HX AI D2XWGKG | |
| Alienware 16X Aurora Core Ultra 9 290HX Plus | |
| Átlagos Intel Core Ultra 9 290HX Plus (79 - 94, n=5) | |
| Schenker XMG APEX 16 MAX | |
| MSI Raider 16 Max HX B2WJ | |
| Schenker XMG Neo 16 A25 5090 | |
| 7-Zip 18.03 / 7z b 4 -mmt1 | |
| Schenker XMG APEX 16 MAX | |
| Schenker XMG Neo 16 A25 5090 | |
| HP Omen Transcend 16 | |
| Átlagos Intel Core Ultra 9 290HX Plus (6562 - 7143, n=5) | |
| MSI Crosshair 16 HX AI D2XWGKG | |
| MSI Raider GE68HX 13VF | |
| MSI Raider 16 Max HX B2WJ | |
| Alienware 16X Aurora Core Ultra 9 290HX Plus | |
| Lenovo Legion 7 16IAX10 | |
| Razer Blade 16 Core Ultra 9 386H | |
| Lenovo Legion 7 16 AGP11 | |
| Asus TUF Gaming A16 FA608UP | |
| Lenovo Legion 5 Pro 16 G7 i7 RTX 3070Ti | |
| Geekbench 6.7 / Multi-Core | |
| Átlagos Intel Core Ultra 9 290HX Plus (19855 - 22850, n=6) | |
| MSI Raider 16 Max HX B2WJ | |
| Schenker XMG Neo 16 A25 5090 | |
| Alienware 16X Aurora Core Ultra 9 290HX Plus | |
| Schenker XMG APEX 16 MAX | |
| MSI Crosshair 16 HX AI D2XWGKG | |
| MSI Raider GE68HX 13VF | |
| Lenovo Legion 7 16IAX10 | |
| Razer Blade 16 Core Ultra 9 386H | |
| Lenovo Legion 7 16 AGP11 | |
| Asus TUF Gaming A16 FA608UP | |
| Geekbench 6.7 / Single-Core | |
| Schenker XMG APEX 16 MAX | |
| Schenker XMG Neo 16 A25 5090 | |
| Átlagos Intel Core Ultra 9 290HX Plus (3147 - 3228, n=6) | |
| MSI Raider 16 Max HX B2WJ | |
| Alienware 16X Aurora Core Ultra 9 290HX Plus | |
| MSI Crosshair 16 HX AI D2XWGKG | |
| Lenovo Legion 7 16 AGP11 | |
| Lenovo Legion 7 16IAX10 | |
| MSI Raider GE68HX 13VF | |
| Razer Blade 16 Core Ultra 9 386H | |
| Asus TUF Gaming A16 FA608UP | |
| Geekbench 5.5 / Multi-Core | |
| Átlagos Intel Core Ultra 9 290HX Plus (23839 - 28263, n=5) | |
| MSI Raider 16 Max HX B2WJ | |
| Alienware 16X Aurora Core Ultra 9 290HX Plus | |
| Schenker XMG Neo 16 A25 5090 | |
| Schenker XMG APEX 16 MAX | |
| MSI Crosshair 16 HX AI D2XWGKG | |
| MSI Raider GE68HX 13VF | |
| Lenovo Legion 7 16IAX10 | |
| HP Omen Transcend 16 | |
| Razer Blade 16 Core Ultra 9 386H | |
| Lenovo Legion 7 16 AGP11 | |
| Lenovo Legion 5 Pro 16 G7 i7 RTX 3070Ti | |
| Asus TUF Gaming A16 FA608UP | |
| Geekbench 5.5 / Single-Core | |
| Schenker XMG APEX 16 MAX | |
| Schenker XMG Neo 16 A25 5090 | |
| Átlagos Intel Core Ultra 9 290HX Plus (2282 - 2357, n=5) | |
| MSI Raider 16 Max HX B2WJ | |
| Alienware 16X Aurora Core Ultra 9 290HX Plus | |
| MSI Crosshair 16 HX AI D2XWGKG | |
| Lenovo Legion 7 16 AGP11 | |
| Lenovo Legion 7 16IAX10 | |
| Razer Blade 16 Core Ultra 9 386H | |
| HP Omen Transcend 16 | |
| MSI Raider GE68HX 13VF | |
| Asus TUF Gaming A16 FA608UP | |
| Lenovo Legion 5 Pro 16 G7 i7 RTX 3070Ti | |
| HWBOT x265 Benchmark v2.2 / 4k Preset | |
| Schenker XMG Neo 16 A25 5090 | |
| MSI Raider 16 Max HX B2WJ | |
| Átlagos Intel Core Ultra 9 290HX Plus (38.2 - 44.4, n=5) | |
| Schenker XMG APEX 16 MAX | |
| Alienware 16X Aurora Core Ultra 9 290HX Plus | |
| MSI Crosshair 16 HX AI D2XWGKG | |
| Lenovo Legion 7 16IAX10 | |
| MSI Raider GE68HX 13VF | |
| Lenovo Legion 7 16 AGP11 | |
| HP Omen Transcend 16 | |
| Razer Blade 16 Core Ultra 9 386H | |
| Lenovo Legion 5 Pro 16 G7 i7 RTX 3070Ti | |
| Asus TUF Gaming A16 FA608UP | |
| LibreOffice / 20 Documents To PDF | |
| Asus TUF Gaming A16 FA608UP | |
| Lenovo Legion 7 16 AGP11 | |
| Schenker XMG APEX 16 MAX | |
| Schenker XMG Neo 16 A25 5090 | |
| Átlagos Intel Core Ultra 9 290HX Plus (38.9 - 68.2, n=5) | |
| HP Omen Transcend 16 | |
| Lenovo Legion 5 Pro 16 G7 i7 RTX 3070Ti | |
| MSI Crosshair 16 HX AI D2XWGKG | |
| MSI Raider 16 Max HX B2WJ | |
| Alienware 16X Aurora Core Ultra 9 290HX Plus | |
| Razer Blade 16 Core Ultra 9 386H | |
| Lenovo Legion 7 16IAX10 | |
| MSI Raider GE68HX 13VF | |
| R Benchmark 2.5 / Overall mean | |
| Lenovo Legion 5 Pro 16 G7 i7 RTX 3070Ti | |
| Asus TUF Gaming A16 FA608UP | |
| Lenovo Legion 7 16IAX10 | |
| Lenovo Legion 7 16 AGP11 | |
| Razer Blade 16 Core Ultra 9 386H | |
| HP Omen Transcend 16 | |
| MSI Crosshair 16 HX AI D2XWGKG | |
| MSI Raider GE68HX 13VF | |
| Alienware 16X Aurora Core Ultra 9 290HX Plus | |
| MSI Raider 16 Max HX B2WJ | |
| Átlagos Intel Core Ultra 9 290HX Plus (0.3788 - 0.3951, n=5) | |
| Schenker XMG Neo 16 A25 5090 | |
| Schenker XMG APEX 16 MAX | |
Cinebench R23: Multi Core | Single Core
Cinebench R20: CPU (Multi Core) | CPU (Single Core)
Cinebench R15: CPU Multi 64Bit | CPU Single 64Bit
Blender: v2.79 BMW27 CPU
7-Zip 18.03: 7z b 4 | 7z b 4 -mmt1
Geekbench 6.7: Multi-Core | Single-Core
Geekbench 5.5: Multi-Core | Single-Core
HWBOT x265 Benchmark v2.2: 4k Preset
LibreOffice : 20 Documents To PDF
R Benchmark 2.5: Overall mean
* ... a kisebb jobb
AIDA64: FP32 Ray-Trace | FPU Julia | CPU SHA3 | CPU Queen | FPU SinJulia | FPU Mandel | CPU AES | CPU ZLib | FP64 Ray-Trace | CPU PhotoWorxx | CPU CheckMate
| Performance rating | |
| Átlagos Intel Core Ultra 9 290HX Plus | |
| MSI Raider 16 Max HX B2WJ -1! | |
| Alienware 16X Aurora Core Ultra 9 290HX Plus -1! | |
| MSI Crosshair 16 HX AI D2XWGKG -1! | |
| Lenovo Legion 7 16IAX10 -1! | |
| Asus TUF Gaming A16 FA608UP -1! | |
| Razer Blade 16 Core Ultra 9 386H -1! | |
| AIDA64 / FP32 Ray-Trace | |
| MSI Raider 16 Max HX B2WJ (v8.20.8100) | |
| Átlagos Intel Core Ultra 9 290HX Plus (34761 - 43239, n=6) | |
| MSI Crosshair 16 HX AI D2XWGKG (v6.92.6600) | |
| Alienware 16X Aurora Core Ultra 9 290HX Plus (v8.20.8100) | |
| Lenovo Legion 7 16IAX10 (v6.92.6600) | |
| Asus TUF Gaming A16 FA608UP (v6.92.6600) | |
| Razer Blade 16 Core Ultra 9 386H (v8.20.8100) | |
| AIDA64 / FPU Julia | |
| MSI Raider 16 Max HX B2WJ (v8.20.8100) | |
| Átlagos Intel Core Ultra 9 290HX Plus (174665 - 218895, n=6) | |
| MSI Crosshair 16 HX AI D2XWGKG (v6.92.6600) | |
| Alienware 16X Aurora Core Ultra 9 290HX Plus (v8.20.8100) | |
| Lenovo Legion 7 16IAX10 (v6.92.6600) | |
| Asus TUF Gaming A16 FA608UP (v6.92.6600) | |
| Razer Blade 16 Core Ultra 9 386H (v8.20.8100) | |
| AIDA64 / CPU SHA3 | |
| MSI Raider 16 Max HX B2WJ (v8.20.8100) | |
| Átlagos Intel Core Ultra 9 290HX Plus (8352 - 10115, n=6) | |
| MSI Crosshair 16 HX AI D2XWGKG (v6.92.6600) | |
| Alienware 16X Aurora Core Ultra 9 290HX Plus (v8.20.8100) | |
| Lenovo Legion 7 16IAX10 (v6.92.6600) | |
| Razer Blade 16 Core Ultra 9 386H (v8.20.8100) | |
| Asus TUF Gaming A16 FA608UP (v6.92.6600) | |
| AIDA64 / CPU Queen | |
| Átlagos Intel Core Ultra 9 290HX Plus (n=1) | |
| Lenovo Legion 7 16IAX10 (v6.92.6600) | |
| MSI Crosshair 16 HX AI D2XWGKG (v6.92.6600) | |
| Asus TUF Gaming A16 FA608UP (v6.92.6600) | |
| AIDA64 / FPU SinJulia | |
| Asus TUF Gaming A16 FA608UP (v6.92.6600) | |
| MSI Raider 16 Max HX B2WJ (v8.20.8100) | |
| Átlagos Intel Core Ultra 9 290HX Plus (13612 - 14874, n=6) | |
| Alienware 16X Aurora Core Ultra 9 290HX Plus (v8.20.8100) | |
| MSI Crosshair 16 HX AI D2XWGKG (v6.92.6600) | |
| Lenovo Legion 7 16IAX10 (v6.92.6600) | |
| Razer Blade 16 Core Ultra 9 386H (v8.20.8100) | |
| AIDA64 / FPU Mandel | |
| MSI Raider 16 Max HX B2WJ (v8.20.8100) | |
| Átlagos Intel Core Ultra 9 290HX Plus (91215 - 115371, n=6) | |
| MSI Crosshair 16 HX AI D2XWGKG (v6.92.6600) | |
| Alienware 16X Aurora Core Ultra 9 290HX Plus (v8.20.8100) | |
| Lenovo Legion 7 16IAX10 (v6.92.6600) | |
| Asus TUF Gaming A16 FA608UP (v6.92.6600) | |
| Razer Blade 16 Core Ultra 9 386H (v8.20.8100) | |
| AIDA64 / CPU AES | |
| MSI Raider 16 Max HX B2WJ (v8.20.8100) | |
| Átlagos Intel Core Ultra 9 290HX Plus (127585 - 143205, n=6) | |
| Alienware 16X Aurora Core Ultra 9 290HX Plus (v8.20.8100) | |
| MSI Crosshair 16 HX AI D2XWGKG (v6.92.6600) | |
| Lenovo Legion 7 16IAX10 (v6.92.6600) | |
| Asus TUF Gaming A16 FA608UP (v6.92.6600) | |
| Razer Blade 16 Core Ultra 9 386H (v8.20.8100) | |
| AIDA64 / CPU ZLib | |
| MSI Raider 16 Max HX B2WJ (v8.20.8100) | |
| Átlagos Intel Core Ultra 9 290HX Plus (1967 - 2340, n=6) | |
| MSI Crosshair 16 HX AI D2XWGKG (v6.92.6600) | |
| Alienware 16X Aurora Core Ultra 9 290HX Plus (v8.20.8100) | |
| Lenovo Legion 7 16IAX10 (v6.92.6600) | |
| Razer Blade 16 Core Ultra 9 386H (v8.20.8100) | |
| Asus TUF Gaming A16 FA608UP (v6.92.6600) | |
| AIDA64 / FP64 Ray-Trace | |
| MSI Raider 16 Max HX B2WJ (v8.20.8100) | |
| Átlagos Intel Core Ultra 9 290HX Plus (18611 - 23843, n=6) | |
| MSI Crosshair 16 HX AI D2XWGKG (v6.92.6600) | |
| Alienware 16X Aurora Core Ultra 9 290HX Plus (v8.20.8100) | |
| Lenovo Legion 7 16IAX10 (v6.92.6600) | |
| Asus TUF Gaming A16 FA608UP (v6.92.6600) | |
| Razer Blade 16 Core Ultra 9 386H (v8.20.8100) | |
| AIDA64 / CPU PhotoWorxx | |
| Razer Blade 16 Core Ultra 9 386H (v8.20.8100) | |
| Átlagos Intel Core Ultra 9 290HX Plus (51134 - 65272, n=6) | |
| Alienware 16X Aurora Core Ultra 9 290HX Plus (v8.20.8100) | |
| MSI Raider 16 Max HX B2WJ (v8.20.8100) | |
| Lenovo Legion 7 16IAX10 (v6.92.6600) | |
| Asus TUF Gaming A16 FA608UP (v6.92.6600) | |
| MSI Crosshair 16 HX AI D2XWGKG (v6.92.6600) | |
| AIDA64 / CPU CheckMate | |
| MSI Raider 16 Max HX B2WJ (v8.20.8100) | |
| Átlagos Intel Core Ultra 9 290HX Plus (7624 - 8765, n=5) | |
| Alienware 16X Aurora Core Ultra 9 290HX Plus (v8.20.8100) | |
| Razer Blade 16 Core Ultra 9 386H (v8.20.8100) | |
Rendszer teljesítménye
PCMark 10: Score | Essentials | Productivity | Digital Content Creation
CrossMark: Overall | Productivity | Creativity | Responsiveness
WebXPRT 3: Overall
WebXPRT 4: Overall
Mozilla Kraken 1.1: Total
Geekbench AI: Quantized GPU 1.7 | Half Precision GPU 1.7 | Single Precision GPU 1.7
| Performance rating | |
| Átlagos Intel Core Ultra 9 290HX Plus, NVIDIA GeForce RTX 5090 Laptop | |
| MSI Raider 16 Max HX B2WJ | |
| Alienware 16X Aurora Core Ultra 9 290HX Plus | |
| Razer Blade 16 Core Ultra 9 386H | |
| MSI Crosshair 16 HX AI D2XWGKG | |
| Lenovo Legion 7 16IAX10 | |
| Asus TUF Gaming A16 FA608UP -4! | |
| PCMark 10 / Score | |
| Átlagos Intel Core Ultra 9 290HX Plus, NVIDIA GeForce RTX 5090 Laptop (11015 - 12414, n=3) | |
| MSI Raider 16 Max HX B2WJ | |
| Alienware 16X Aurora Core Ultra 9 290HX Plus | |
| Razer Blade 16 Core Ultra 9 386H | |
| MSI Crosshair 16 HX AI D2XWGKG | |
| Lenovo Legion 7 16IAX10 | |
| PCMark 10 / Essentials | |
| Alienware 16X Aurora Core Ultra 9 290HX Plus | |
| Lenovo Legion 7 16IAX10 | |
| Átlagos Intel Core Ultra 9 290HX Plus, NVIDIA GeForce RTX 5090 Laptop (11316 - 11604, n=3) | |
| MSI Raider 16 Max HX B2WJ | |
| Razer Blade 16 Core Ultra 9 386H | |
| MSI Crosshair 16 HX AI D2XWGKG | |
| PCMark 10 / Productivity | |
| Átlagos Intel Core Ultra 9 290HX Plus, NVIDIA GeForce RTX 5090 Laptop (16305 - 25323, n=3) | |
| Alienware 16X Aurora Core Ultra 9 290HX Plus | |
| MSI Raider 16 Max HX B2WJ | |
| Razer Blade 16 Core Ultra 9 386H | |
| Lenovo Legion 7 16IAX10 | |
| MSI Crosshair 16 HX AI D2XWGKG | |
| PCMark 10 / Digital Content Creation | |
| MSI Raider 16 Max HX B2WJ | |
| Átlagos Intel Core Ultra 9 290HX Plus, NVIDIA GeForce RTX 5090 Laptop (17665 - 19954, n=3) | |
| Alienware 16X Aurora Core Ultra 9 290HX Plus | |
| MSI Crosshair 16 HX AI D2XWGKG | |
| Razer Blade 16 Core Ultra 9 386H | |
| Lenovo Legion 7 16IAX10 | |
| CrossMark / Overall | |
| MSI Raider 16 Max HX B2WJ | |
| Alienware 16X Aurora Core Ultra 9 290HX Plus | |
| Átlagos Intel Core Ultra 9 290HX Plus, NVIDIA GeForce RTX 5090 Laptop (2177 - 2401, n=3) | |
| Razer Blade 16 Core Ultra 9 386H | |
| MSI Crosshair 16 HX AI D2XWGKG | |
| Lenovo Legion 7 16IAX10 | |
| Asus TUF Gaming A16 FA608UP | |
| CrossMark / Productivity | |
| Alienware 16X Aurora Core Ultra 9 290HX Plus | |
| MSI Raider 16 Max HX B2WJ | |
| Átlagos Intel Core Ultra 9 290HX Plus, NVIDIA GeForce RTX 5090 Laptop (1994 - 2213, n=3) | |
| Razer Blade 16 Core Ultra 9 386H | |
| MSI Crosshair 16 HX AI D2XWGKG | |
| Lenovo Legion 7 16IAX10 | |
| Asus TUF Gaming A16 FA608UP | |
| CrossMark / Creativity | |
| Átlagos Intel Core Ultra 9 290HX Plus, NVIDIA GeForce RTX 5090 Laptop (2548 - 2786, n=3) | |
| MSI Raider 16 Max HX B2WJ | |
| Alienware 16X Aurora Core Ultra 9 290HX Plus | |
| Razer Blade 16 Core Ultra 9 386H | |
| MSI Crosshair 16 HX AI D2XWGKG | |
| Lenovo Legion 7 16IAX10 | |
| Asus TUF Gaming A16 FA608UP | |
| CrossMark / Responsiveness | |
| Alienware 16X Aurora Core Ultra 9 290HX Plus | |
| MSI Raider 16 Max HX B2WJ | |
| Átlagos Intel Core Ultra 9 290HX Plus, NVIDIA GeForce RTX 5090 Laptop (1766 - 2249, n=3) | |
| Razer Blade 16 Core Ultra 9 386H | |
| MSI Crosshair 16 HX AI D2XWGKG | |
| Lenovo Legion 7 16IAX10 | |
| Asus TUF Gaming A16 FA608UP | |
| WebXPRT 3 / Overall | |
| Alienware 16X Aurora Core Ultra 9 290HX Plus | |
| MSI Raider 16 Max HX B2WJ | |
| Átlagos Intel Core Ultra 9 290HX Plus, NVIDIA GeForce RTX 5090 Laptop (354 - 369, n=3) | |
| Lenovo Legion 7 16IAX10 | |
| MSI Crosshair 16 HX AI D2XWGKG | |
| Razer Blade 16 Core Ultra 9 386H | |
| Asus TUF Gaming A16 FA608UP | |
| WebXPRT 4 / Overall | |
| Alienware 16X Aurora Core Ultra 9 290HX Plus | |
| MSI Raider 16 Max HX B2WJ | |
| Átlagos Intel Core Ultra 9 290HX Plus, NVIDIA GeForce RTX 5090 Laptop (310 - 336, n=3) | |
| Lenovo Legion 7 16IAX10 | |
| MSI Crosshair 16 HX AI D2XWGKG | |
| Razer Blade 16 Core Ultra 9 386H | |
| Asus TUF Gaming A16 FA608UP | |
| Mozilla Kraken 1.1 / Total | |
| Asus TUF Gaming A16 FA608UP | |
| Razer Blade 16 Core Ultra 9 386H | |
| Lenovo Legion 7 16IAX10 | |
| MSI Crosshair 16 HX AI D2XWGKG | |
| MSI Raider 16 Max HX B2WJ | |
| Átlagos Intel Core Ultra 9 290HX Plus, NVIDIA GeForce RTX 5090 Laptop (393 - 399, n=3) | |
| Alienware 16X Aurora Core Ultra 9 290HX Plus | |
| Geekbench AI / Quantized GPU 1.7 | |
| Átlagos Intel Core Ultra 9 290HX Plus, NVIDIA GeForce RTX 5090 Laptop (25151 - 25211, n=2) | |
| MSI Raider 16 Max HX B2WJ | |
| Razer Blade 16 Core Ultra 9 386H | |
| Alienware 16X Aurora Core Ultra 9 290HX Plus | |
| MSI Crosshair 16 HX AI D2XWGKG | |
| Asus TUF Gaming A16 FA608UP | |
| Lenovo Legion 7 16IAX10 | |
| Geekbench AI / Half Precision GPU 1.7 | |
| Átlagos Intel Core Ultra 9 290HX Plus, NVIDIA GeForce RTX 5090 Laptop (55223 - 56393, n=2) | |
| MSI Raider 16 Max HX B2WJ | |
| Alienware 16X Aurora Core Ultra 9 290HX Plus | |
| Razer Blade 16 Core Ultra 9 386H | |
| MSI Crosshair 16 HX AI D2XWGKG | |
| Asus TUF Gaming A16 FA608UP | |
| Lenovo Legion 7 16IAX10 | |
| Geekbench AI / Single Precision GPU 1.7 | |
| Átlagos Intel Core Ultra 9 290HX Plus, NVIDIA GeForce RTX 5090 Laptop (31828 - 32576, n=2) | |
| MSI Raider 16 Max HX B2WJ | |
| Razer Blade 16 Core Ultra 9 386H | |
| Alienware 16X Aurora Core Ultra 9 290HX Plus | |
| MSI Crosshair 16 HX AI D2XWGKG | |
| Asus TUF Gaming A16 FA608UP | |
| Lenovo Legion 7 16IAX10 | |
* ... a kisebb jobb
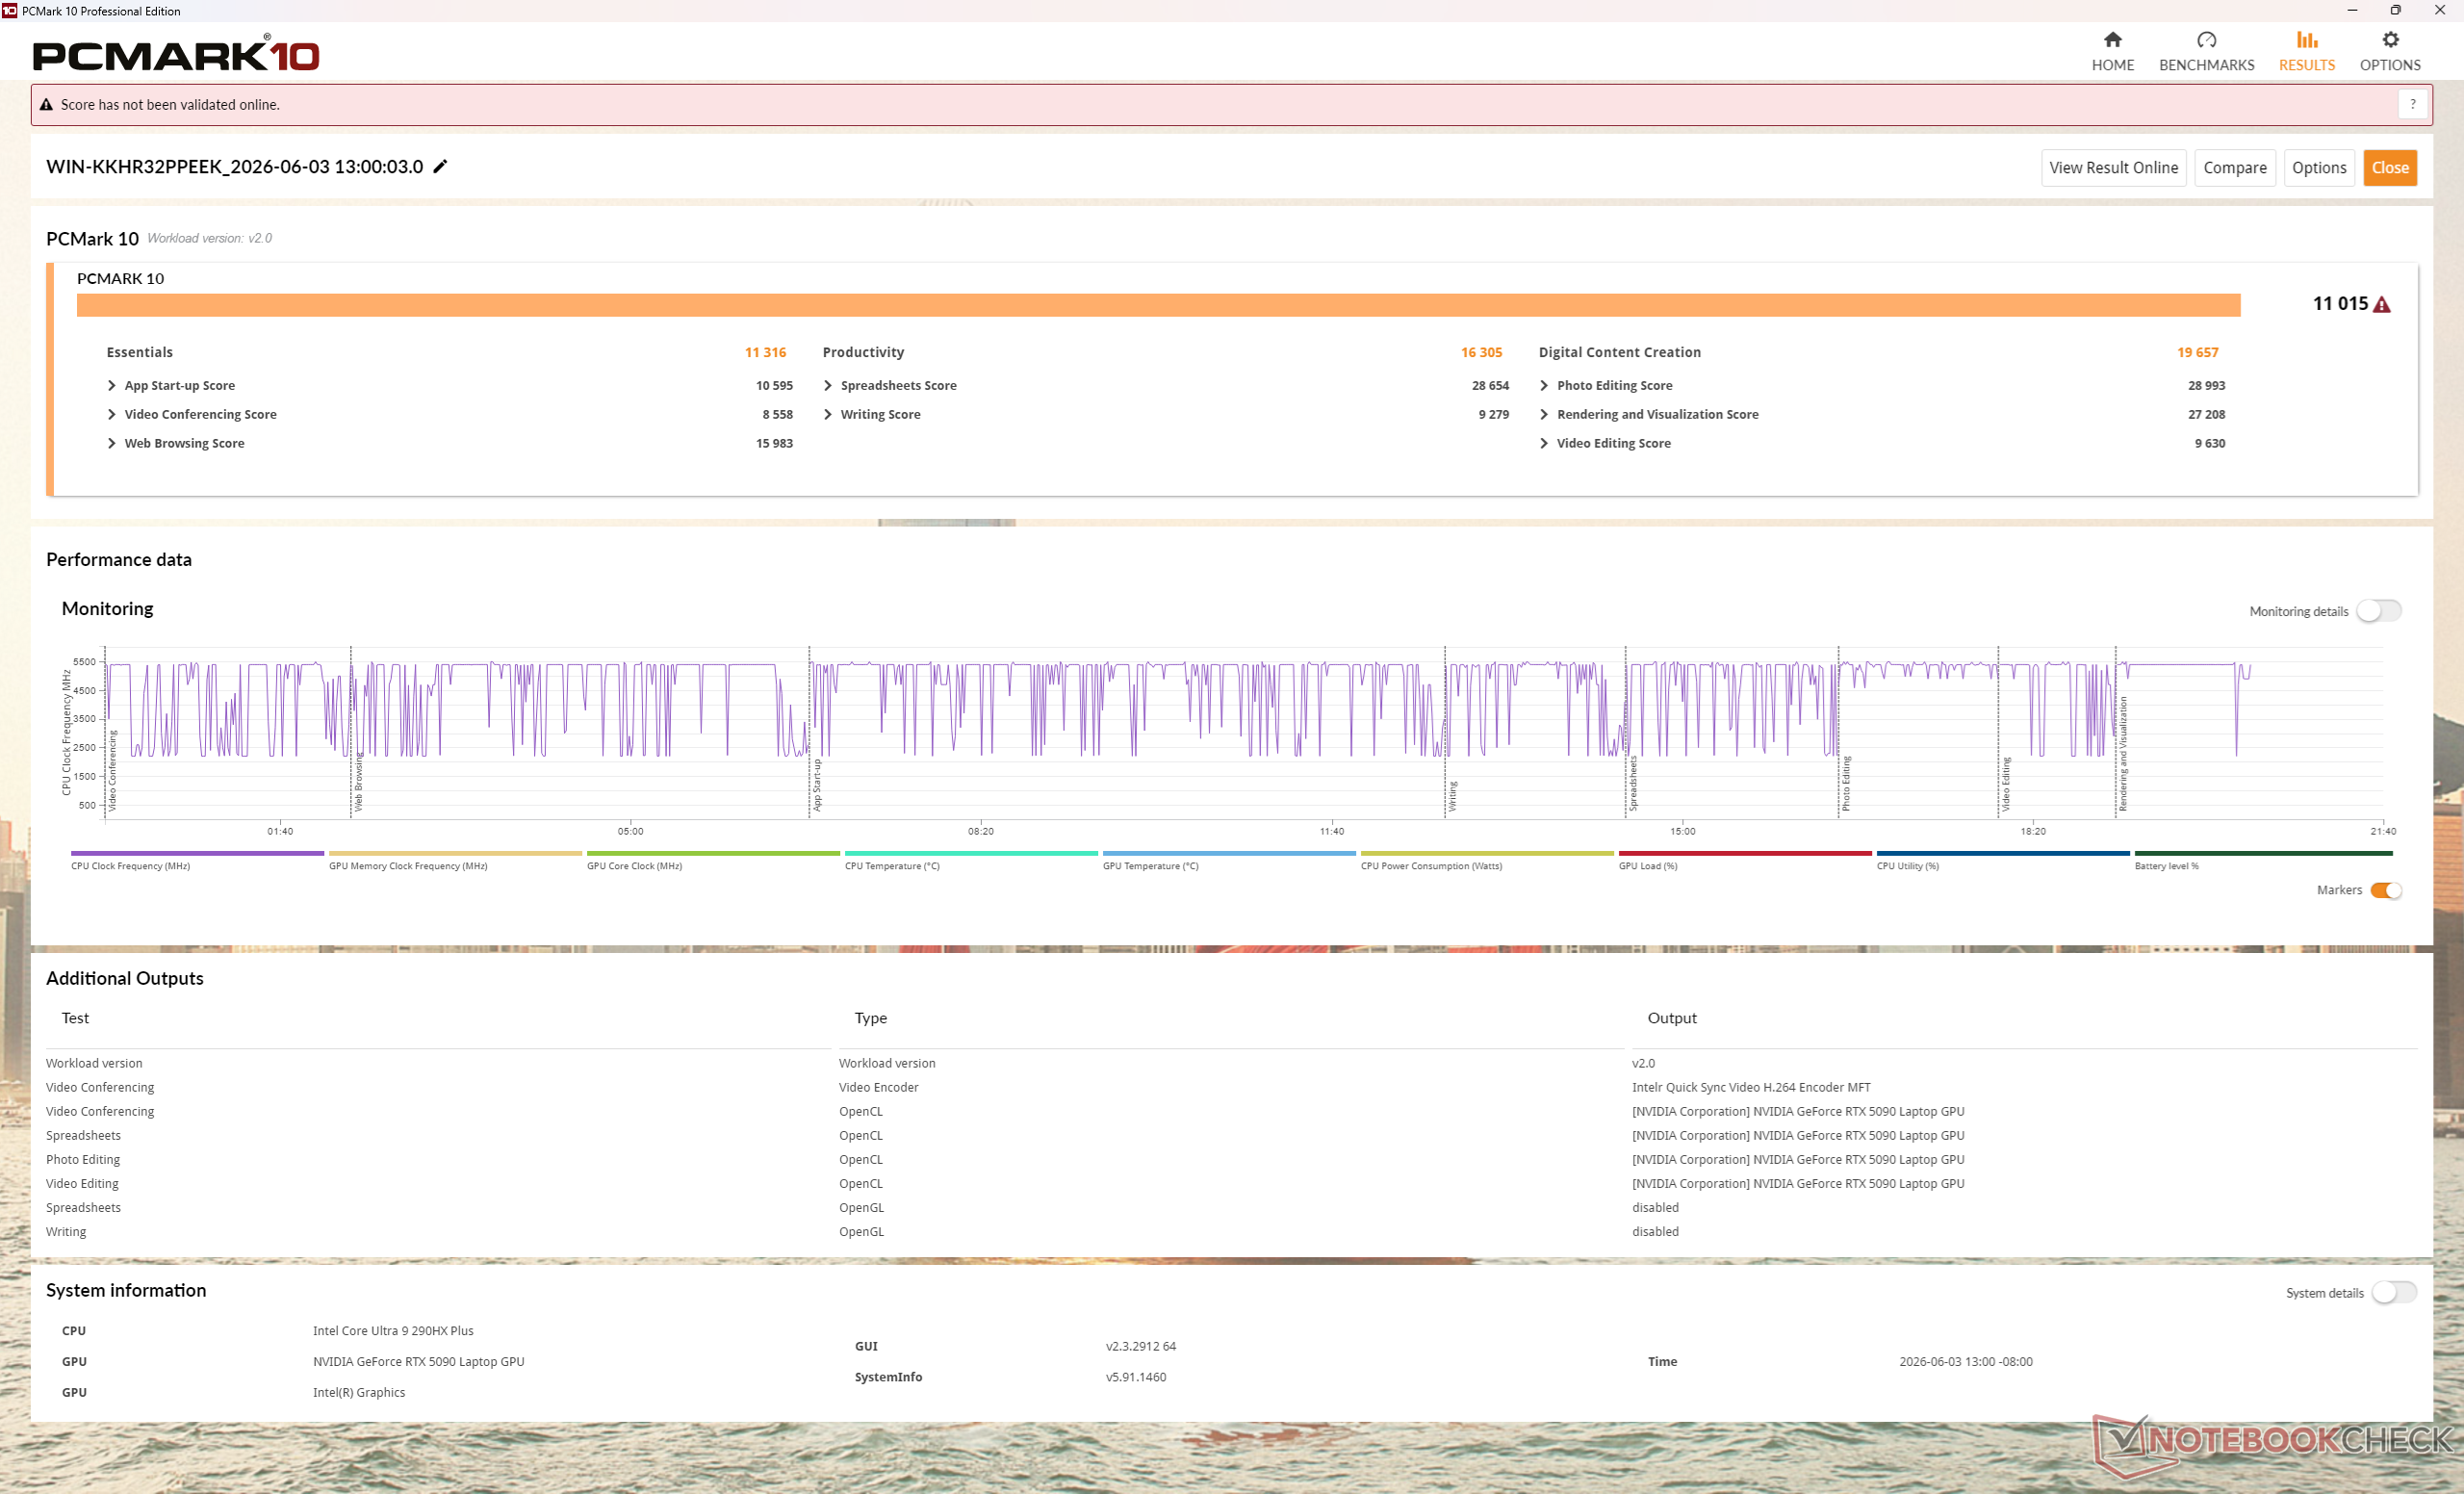
| PCMark 10 Score | 11015 pontok | |
Segítség | ||
| AIDA64 / Memory Copy | |
| Razer Blade 16 Core Ultra 9 386H | |
| Lenovo Legion 7 16IAX10 | |
| Átlagos Intel Core Ultra 9 290HX Plus (76912 - 93930, n=6) | |
| MSI Raider 16 Max HX B2WJ | |
| Alienware 16X Aurora Core Ultra 9 290HX Plus | |
| MSI Crosshair 16 HX AI D2XWGKG | |
| Asus TUF Gaming A16 FA608UP | |
| AIDA64 / Memory Read | |
| Razer Blade 16 Core Ultra 9 386H | |
| Átlagos Intel Core Ultra 9 290HX Plus (84638 - 98574, n=6) | |
| MSI Raider 16 Max HX B2WJ | |
| Lenovo Legion 7 16IAX10 | |
| Alienware 16X Aurora Core Ultra 9 290HX Plus | |
| MSI Crosshair 16 HX AI D2XWGKG | |
| Asus TUF Gaming A16 FA608UP | |
| AIDA64 / Memory Write | |
| Razer Blade 16 Core Ultra 9 386H | |
| Asus TUF Gaming A16 FA608UP | |
| Átlagos Intel Core Ultra 9 290HX Plus (76094 - 100988, n=6) | |
| MSI Raider 16 Max HX B2WJ | |
| Lenovo Legion 7 16IAX10 | |
| Alienware 16X Aurora Core Ultra 9 290HX Plus | |
| MSI Crosshair 16 HX AI D2XWGKG | |
| AIDA64 / Memory Latency | |
| MSI Crosshair 16 HX AI D2XWGKG | |
| Alienware 16X Aurora Core Ultra 9 290HX Plus | |
| Lenovo Legion 7 16IAX10 | |
| MSI Raider 16 Max HX B2WJ | |
| Átlagos Intel Core Ultra 9 290HX Plus (100.7 - 108.4, n=6) | |
| Asus TUF Gaming A16 FA608UP | |
| Razer Blade 16 Core Ultra 9 386H | |
* ... a kisebb jobb
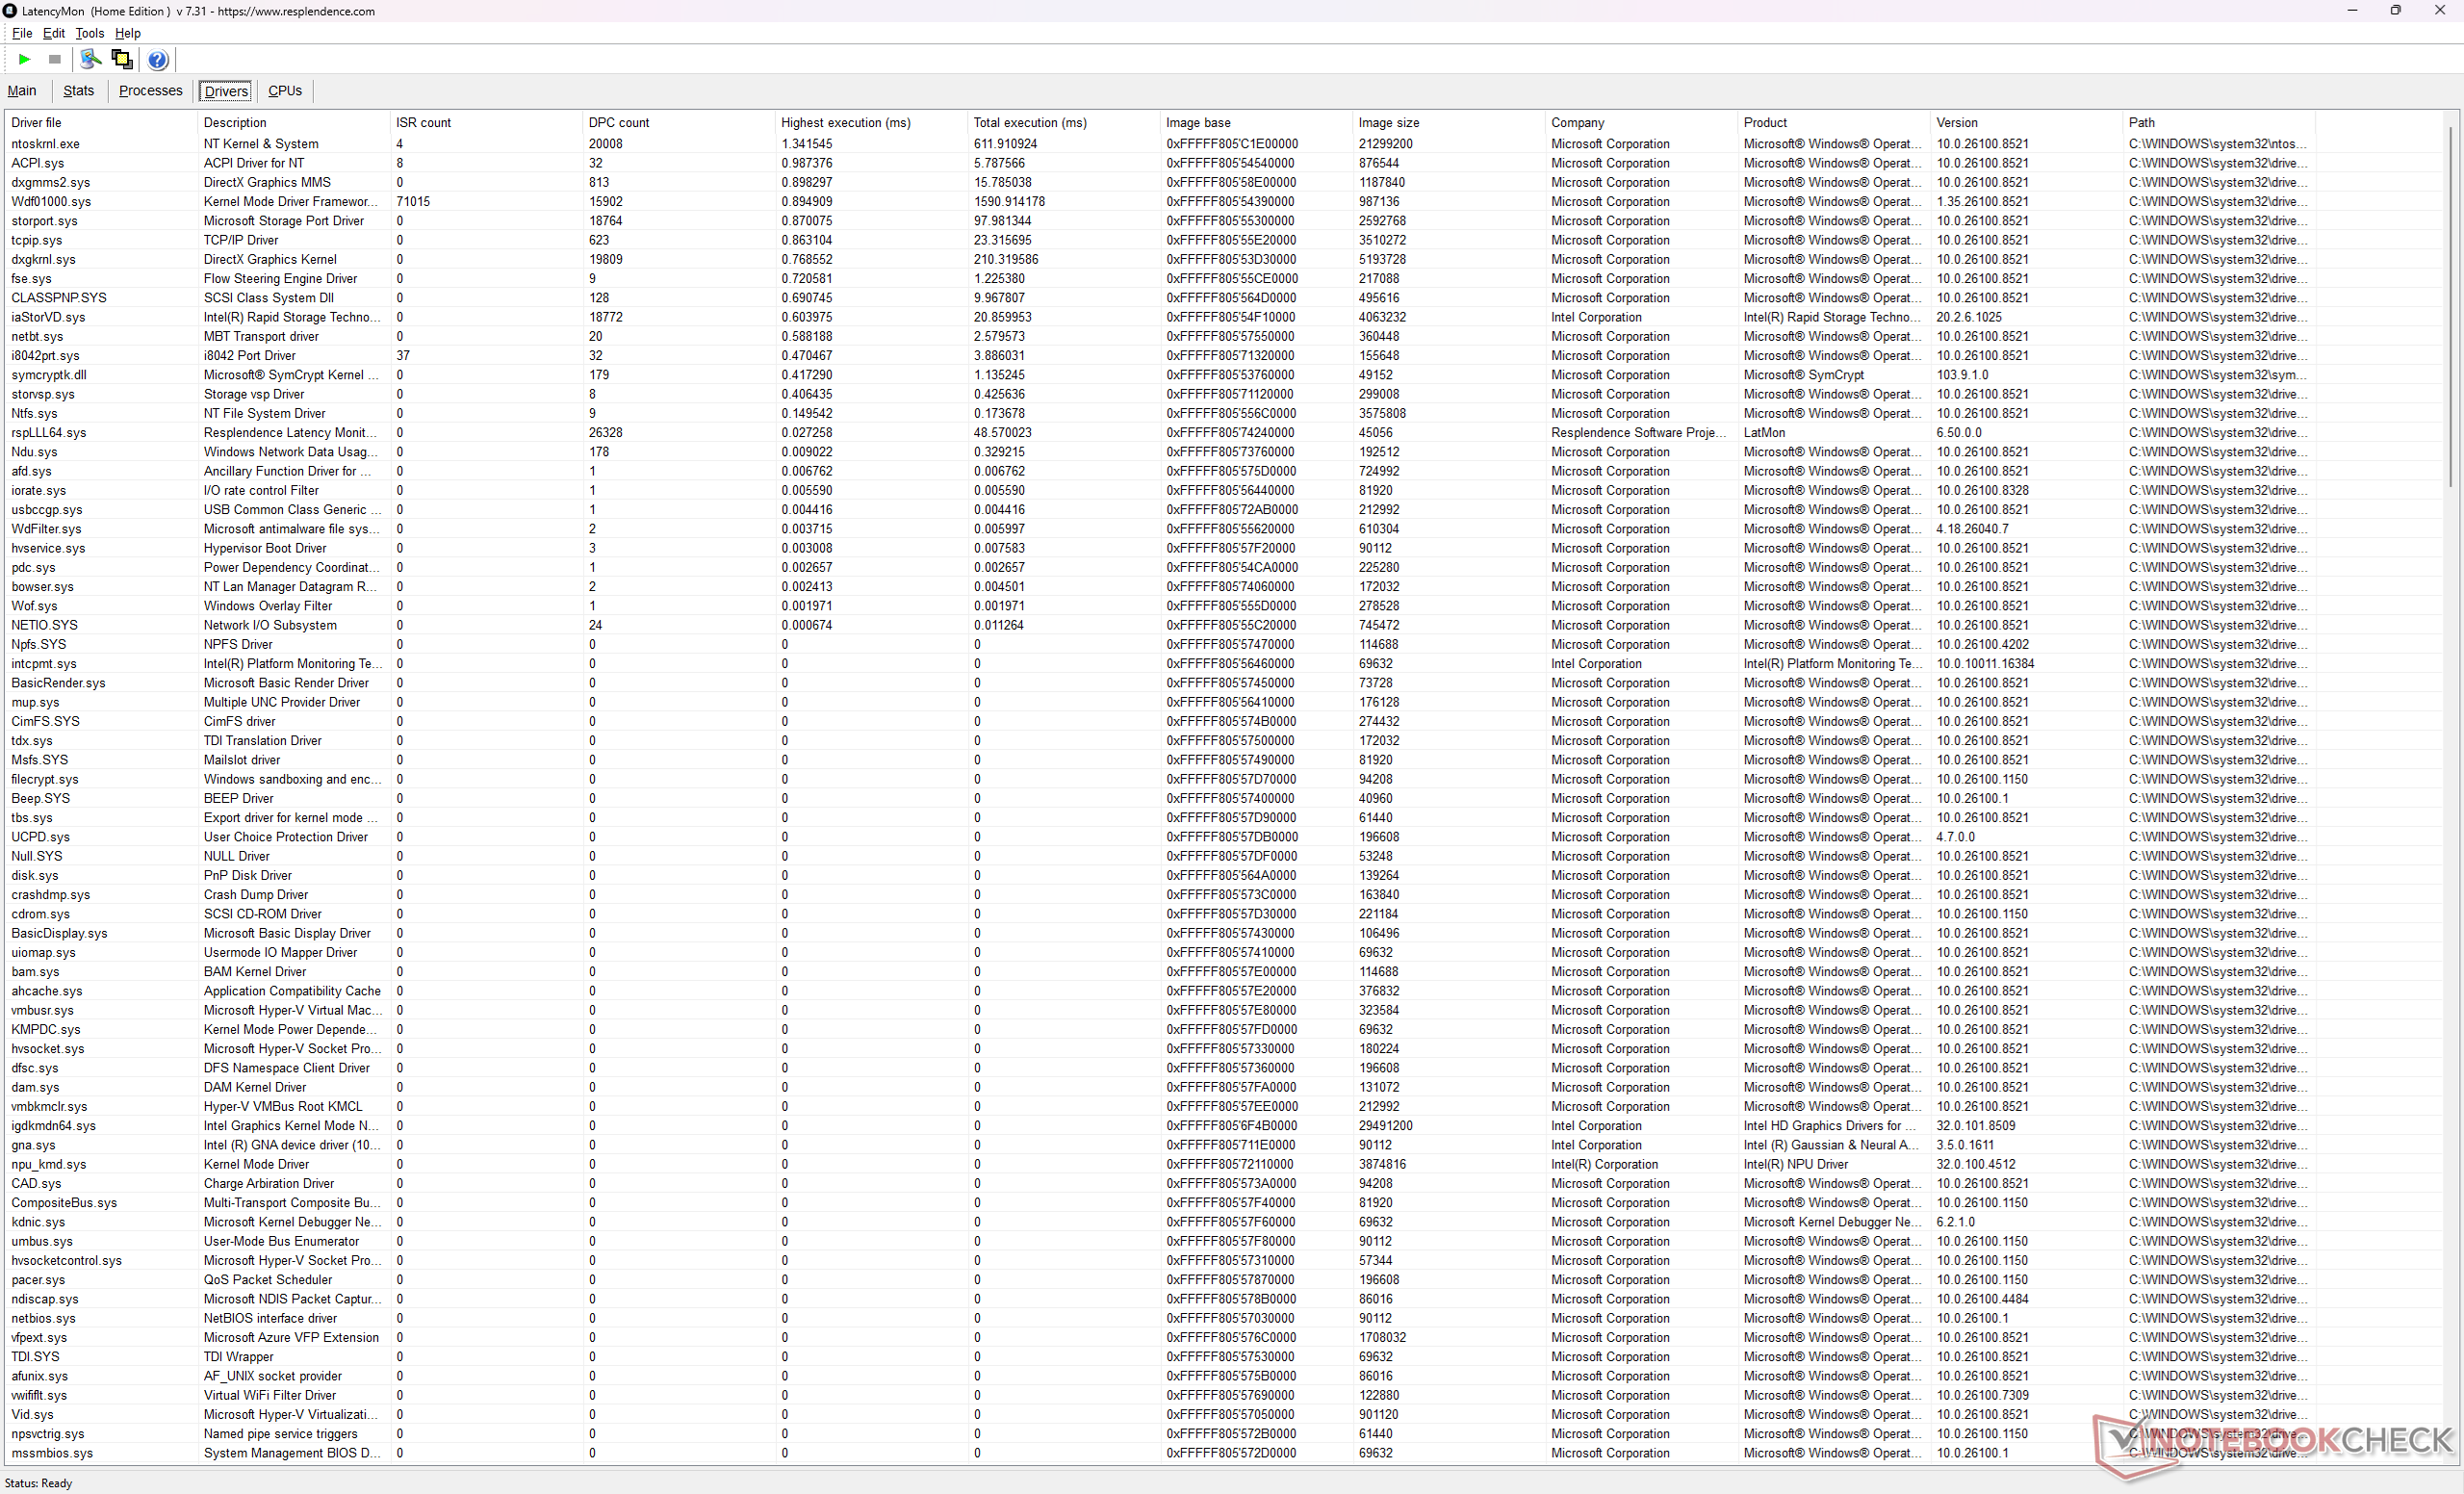
DPC késleltetés
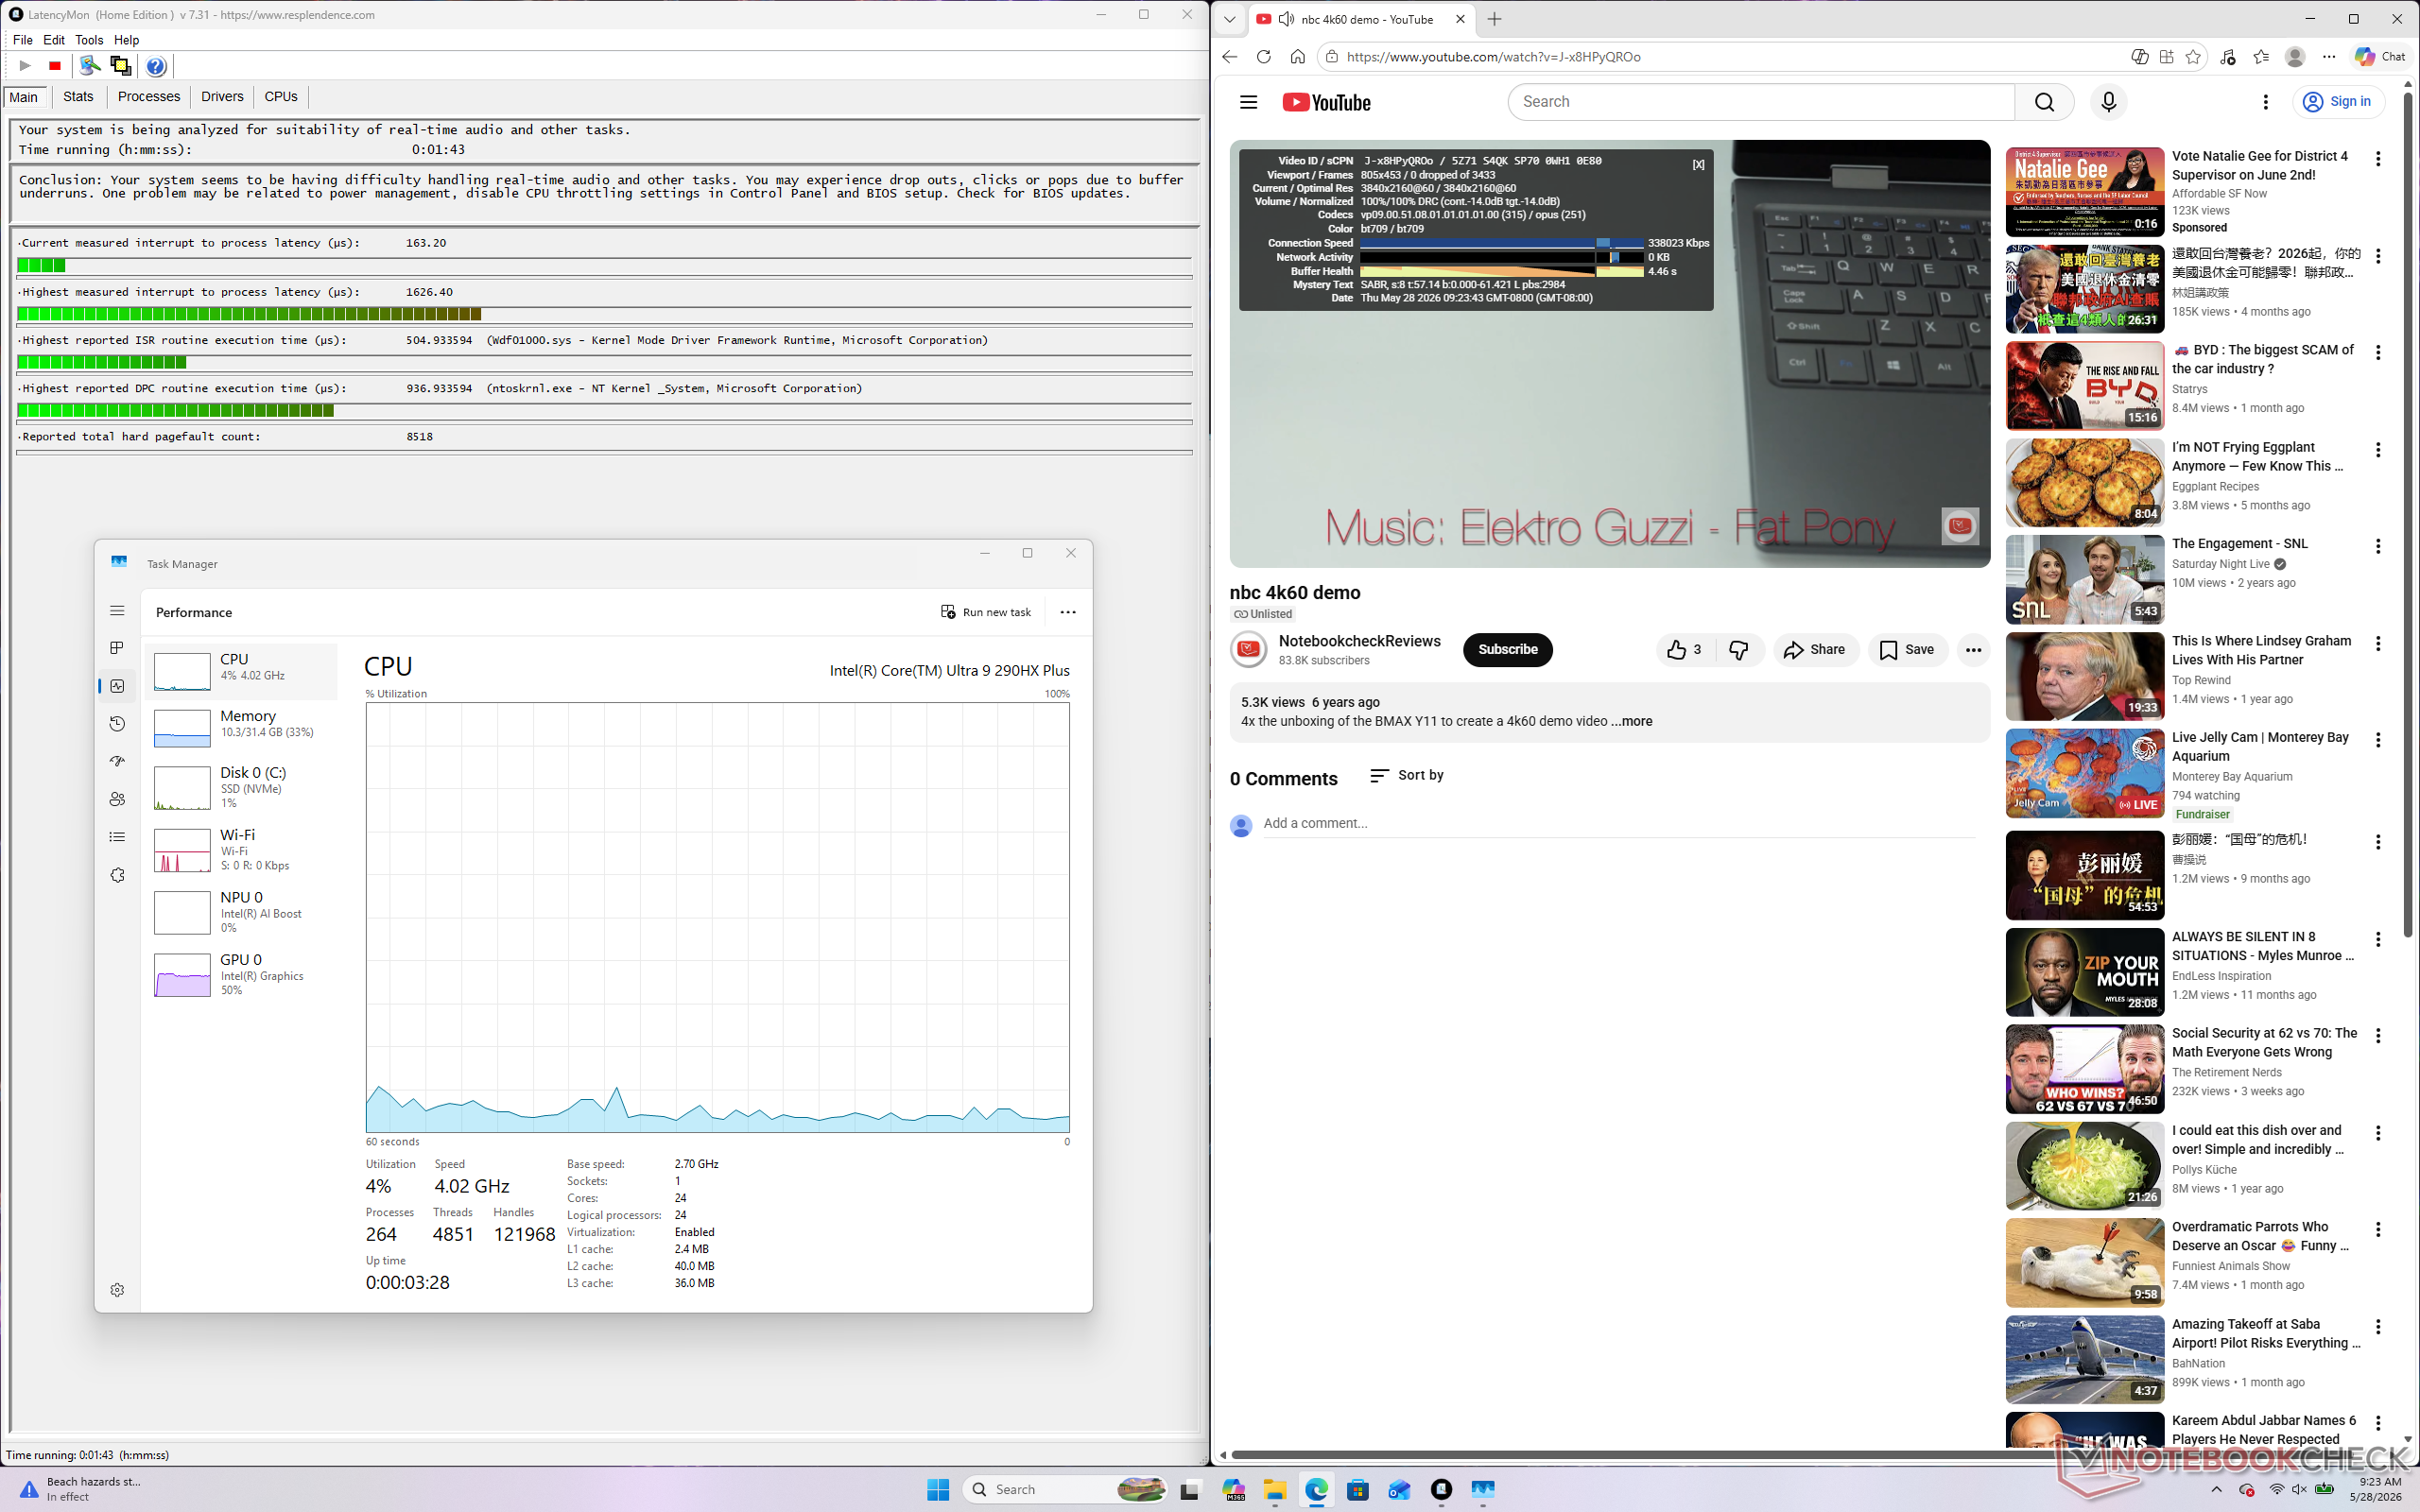
| DPC Latencies / LatencyMon - interrupt to process latency (max), Web, Youtube, Prime95 | |
| Alienware 16X Aurora Core Ultra 9 290HX Plus | |
| Razer Blade 16 Core Ultra 9 386H | |
| MSI Raider 16 Max HX B2WJ | |
| MSI Crosshair 16 HX AI D2XWGKG | |
| Lenovo Legion 7 16IAX10 | |
| Asus TUF Gaming A16 FA608UP | |
* ... a kisebb jobb
Tárolóeszközök
A tesztegységünk ugyanazzal a Micron 2500 PCIe4 x4 NVMe SSD-vel, mint a Crosshair 16 HX-ben.
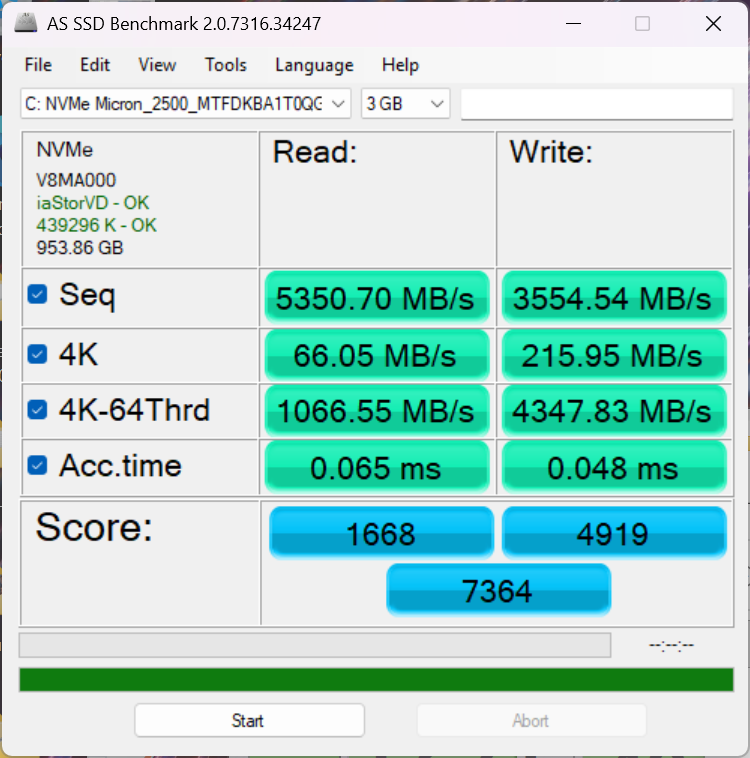
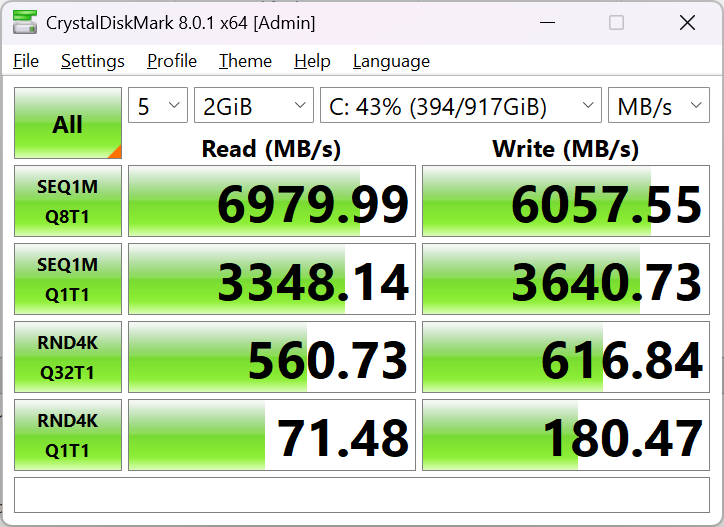

* ... a kisebb jobb
Lemezduguláscsökkentés: DiskSpd Read Loop, Queue Depth 8
GPU teljesítmény
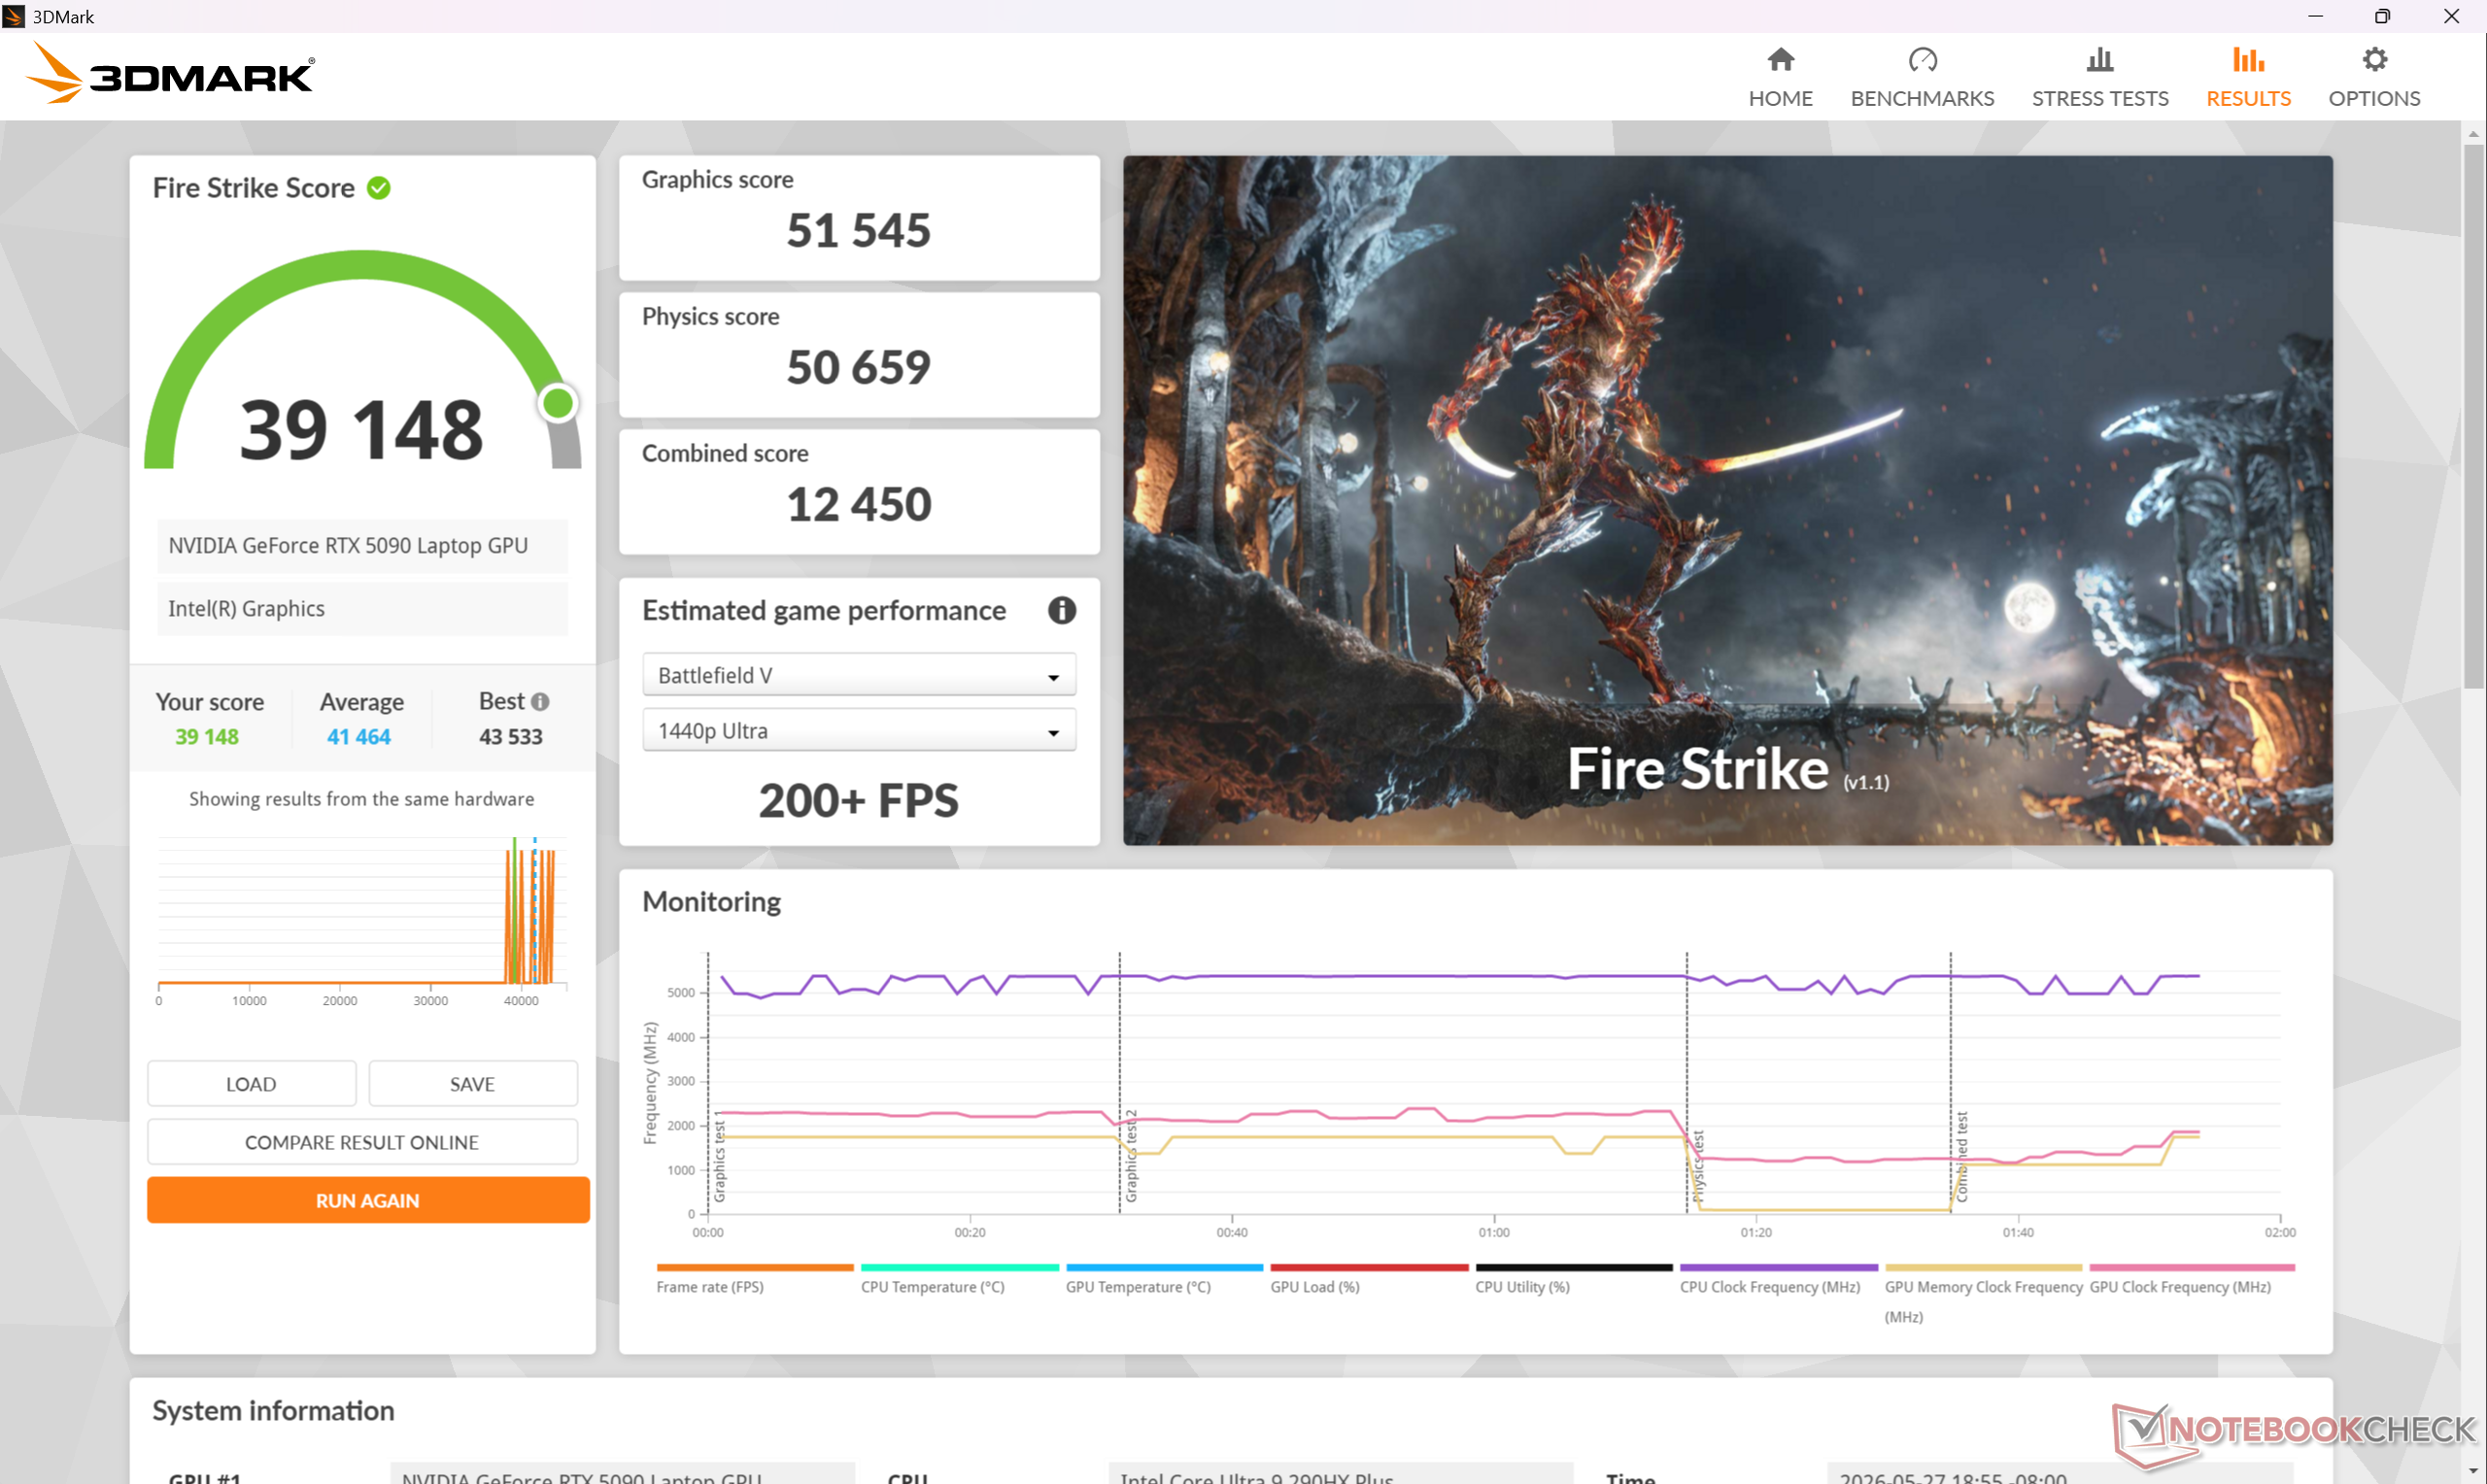
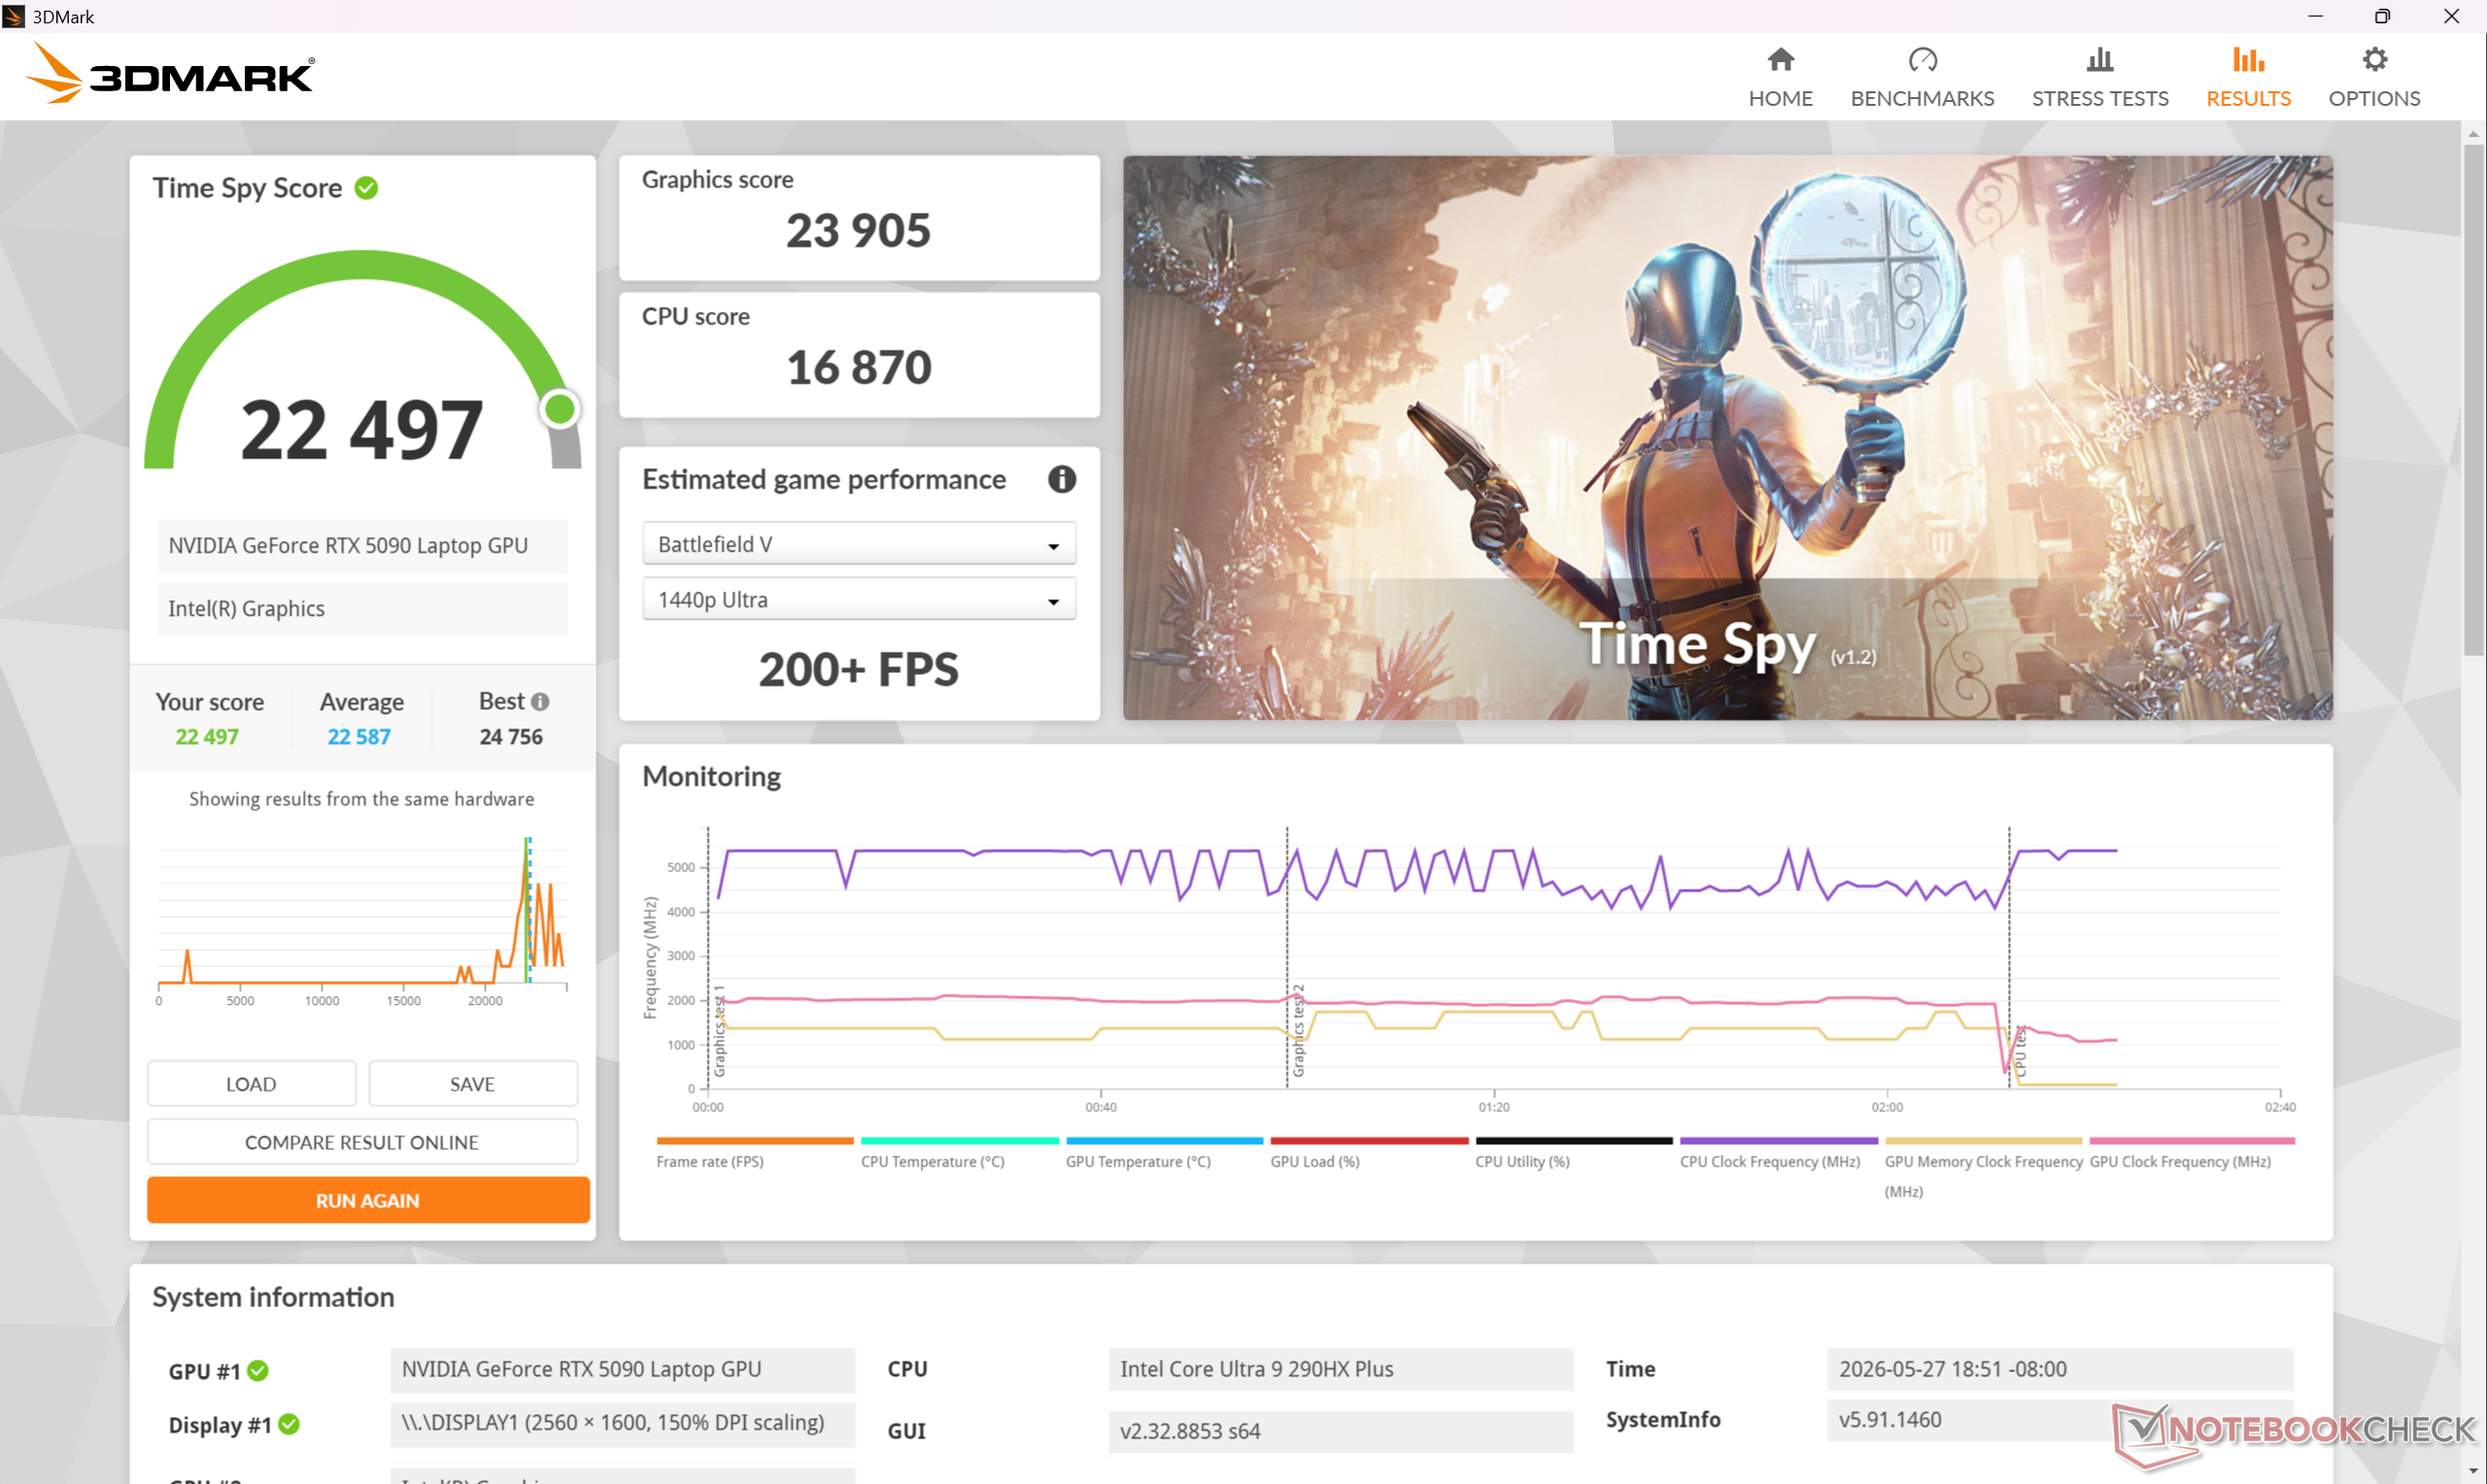
A rendszer Apex üzemmódban vagy Cooler Boost módban (azaz maximális ventilátorzaj üzemmódban) történő futtatása az egyetlen módja annak, hogy a lehető legnagyobb feldolgozási teljesítményt kapja a CPU és a GeForce RTX 5090 GPU-t, ahogyan azt a Time Spy alábbi eredménytáblázatunk is mutatja. A csendesebb Balanced üzemmódra való visszalépés nagyjából 10 százalékkal csökkenti az összteljesítményt.
| Teljesítményprofil | Grafikai pontszám | Fizikai pontszám | Kombinált pontszám |
| Cooler Boost mód | 26009 | 16635 | 23981 |
| Apex mód | 25594 (-2%) | 16938 (-2%) | 23771 (-1%) |
| Extrém teljesítmény üzemmód | 23905 (-8%) | 16870 (-1%) | 22497 (-6%) |
| Kiegyensúlyozott üzemmód | 23572 (-9%) | 14462 (-13%) | 21536 (-10%) |
| Energiatakarékos üzemmód | 18192 (-30%) | 13786 (-17%) | 17912 (-25%) |
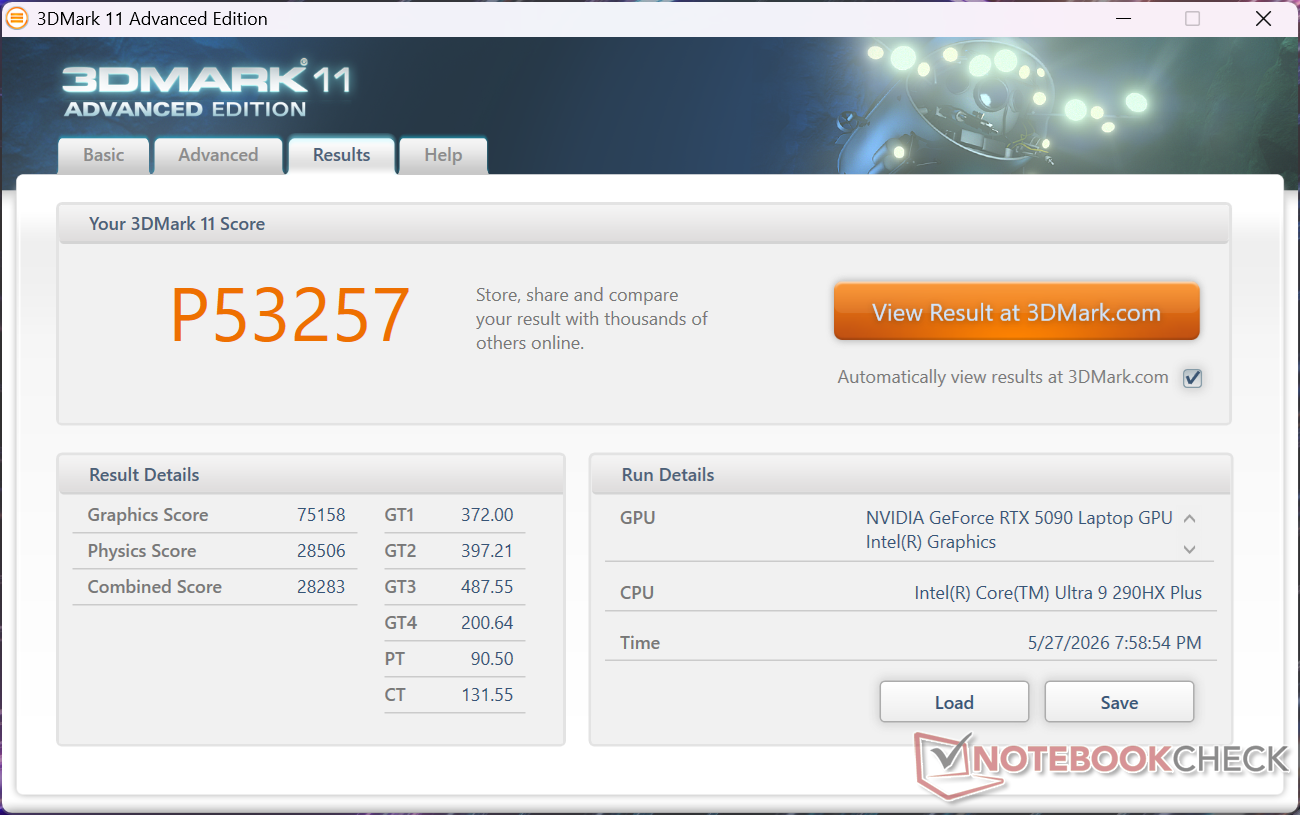
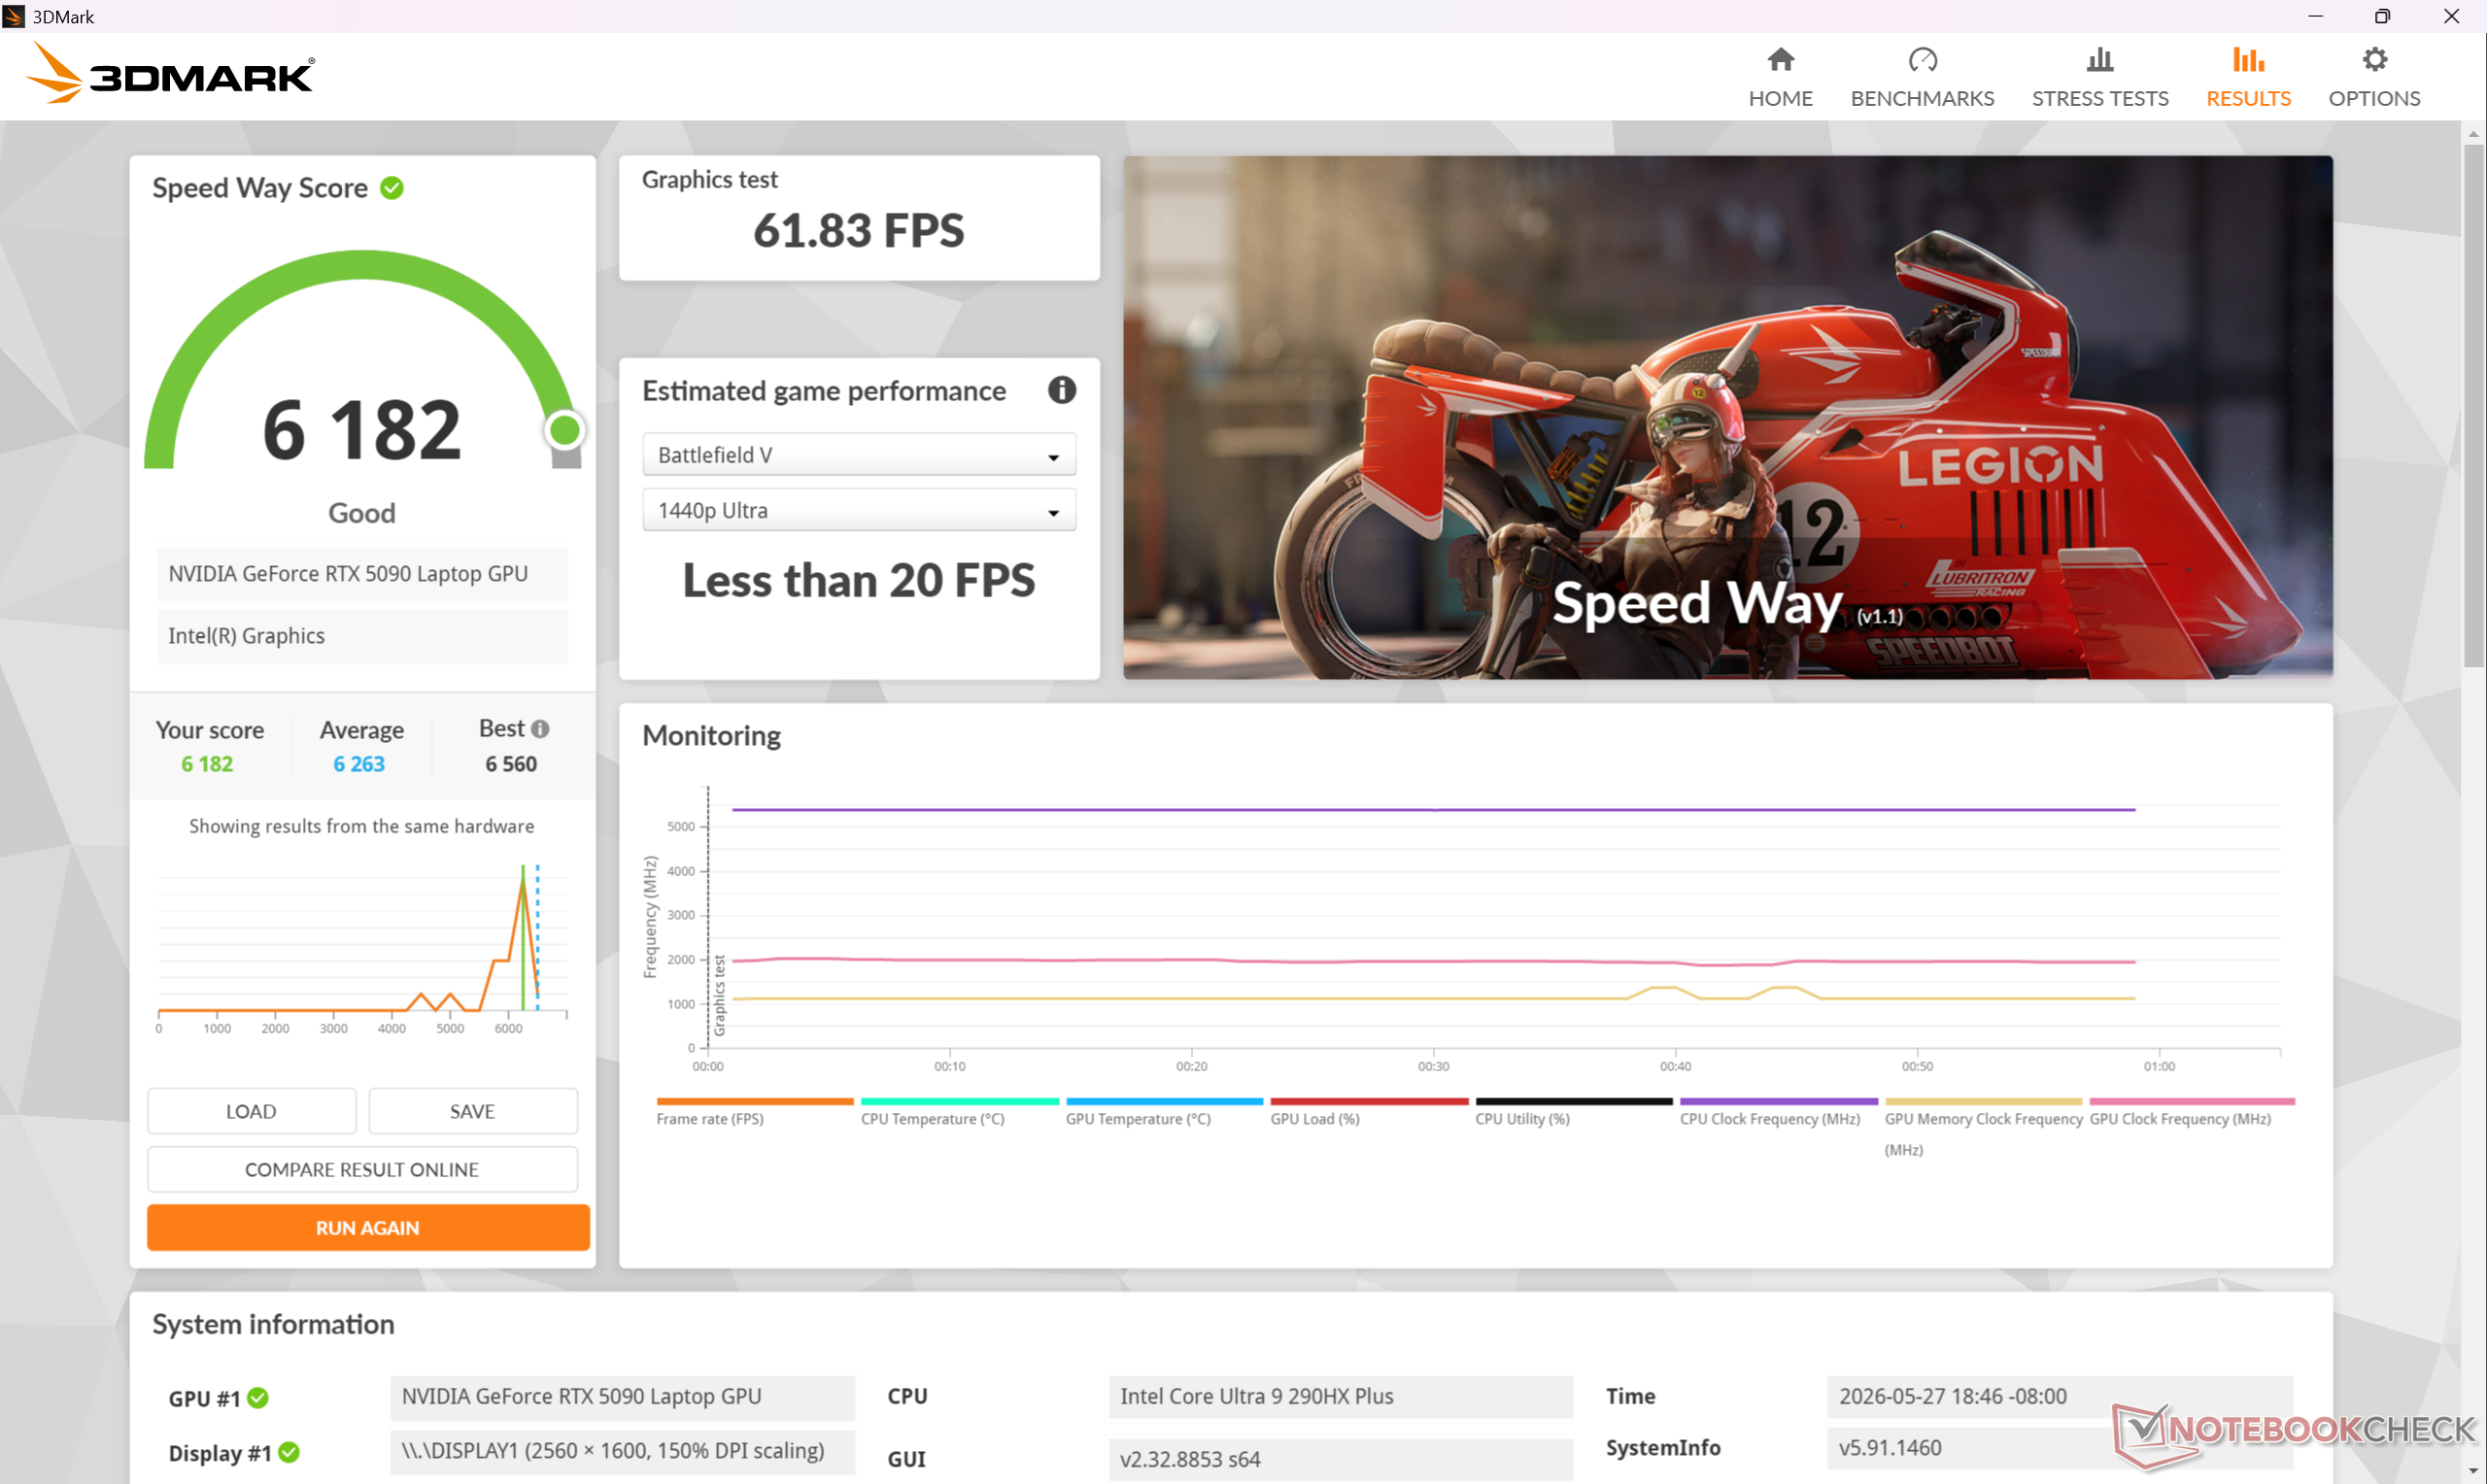
| 3DMark 11 Performance | 53257 pontok | |
| 3DMark Cloud Gate Standard Score | 77700 pontok | |
| 3DMark Fire Strike Score | 39148 pontok | |
| 3DMark Time Spy Score | 22497 pontok | |
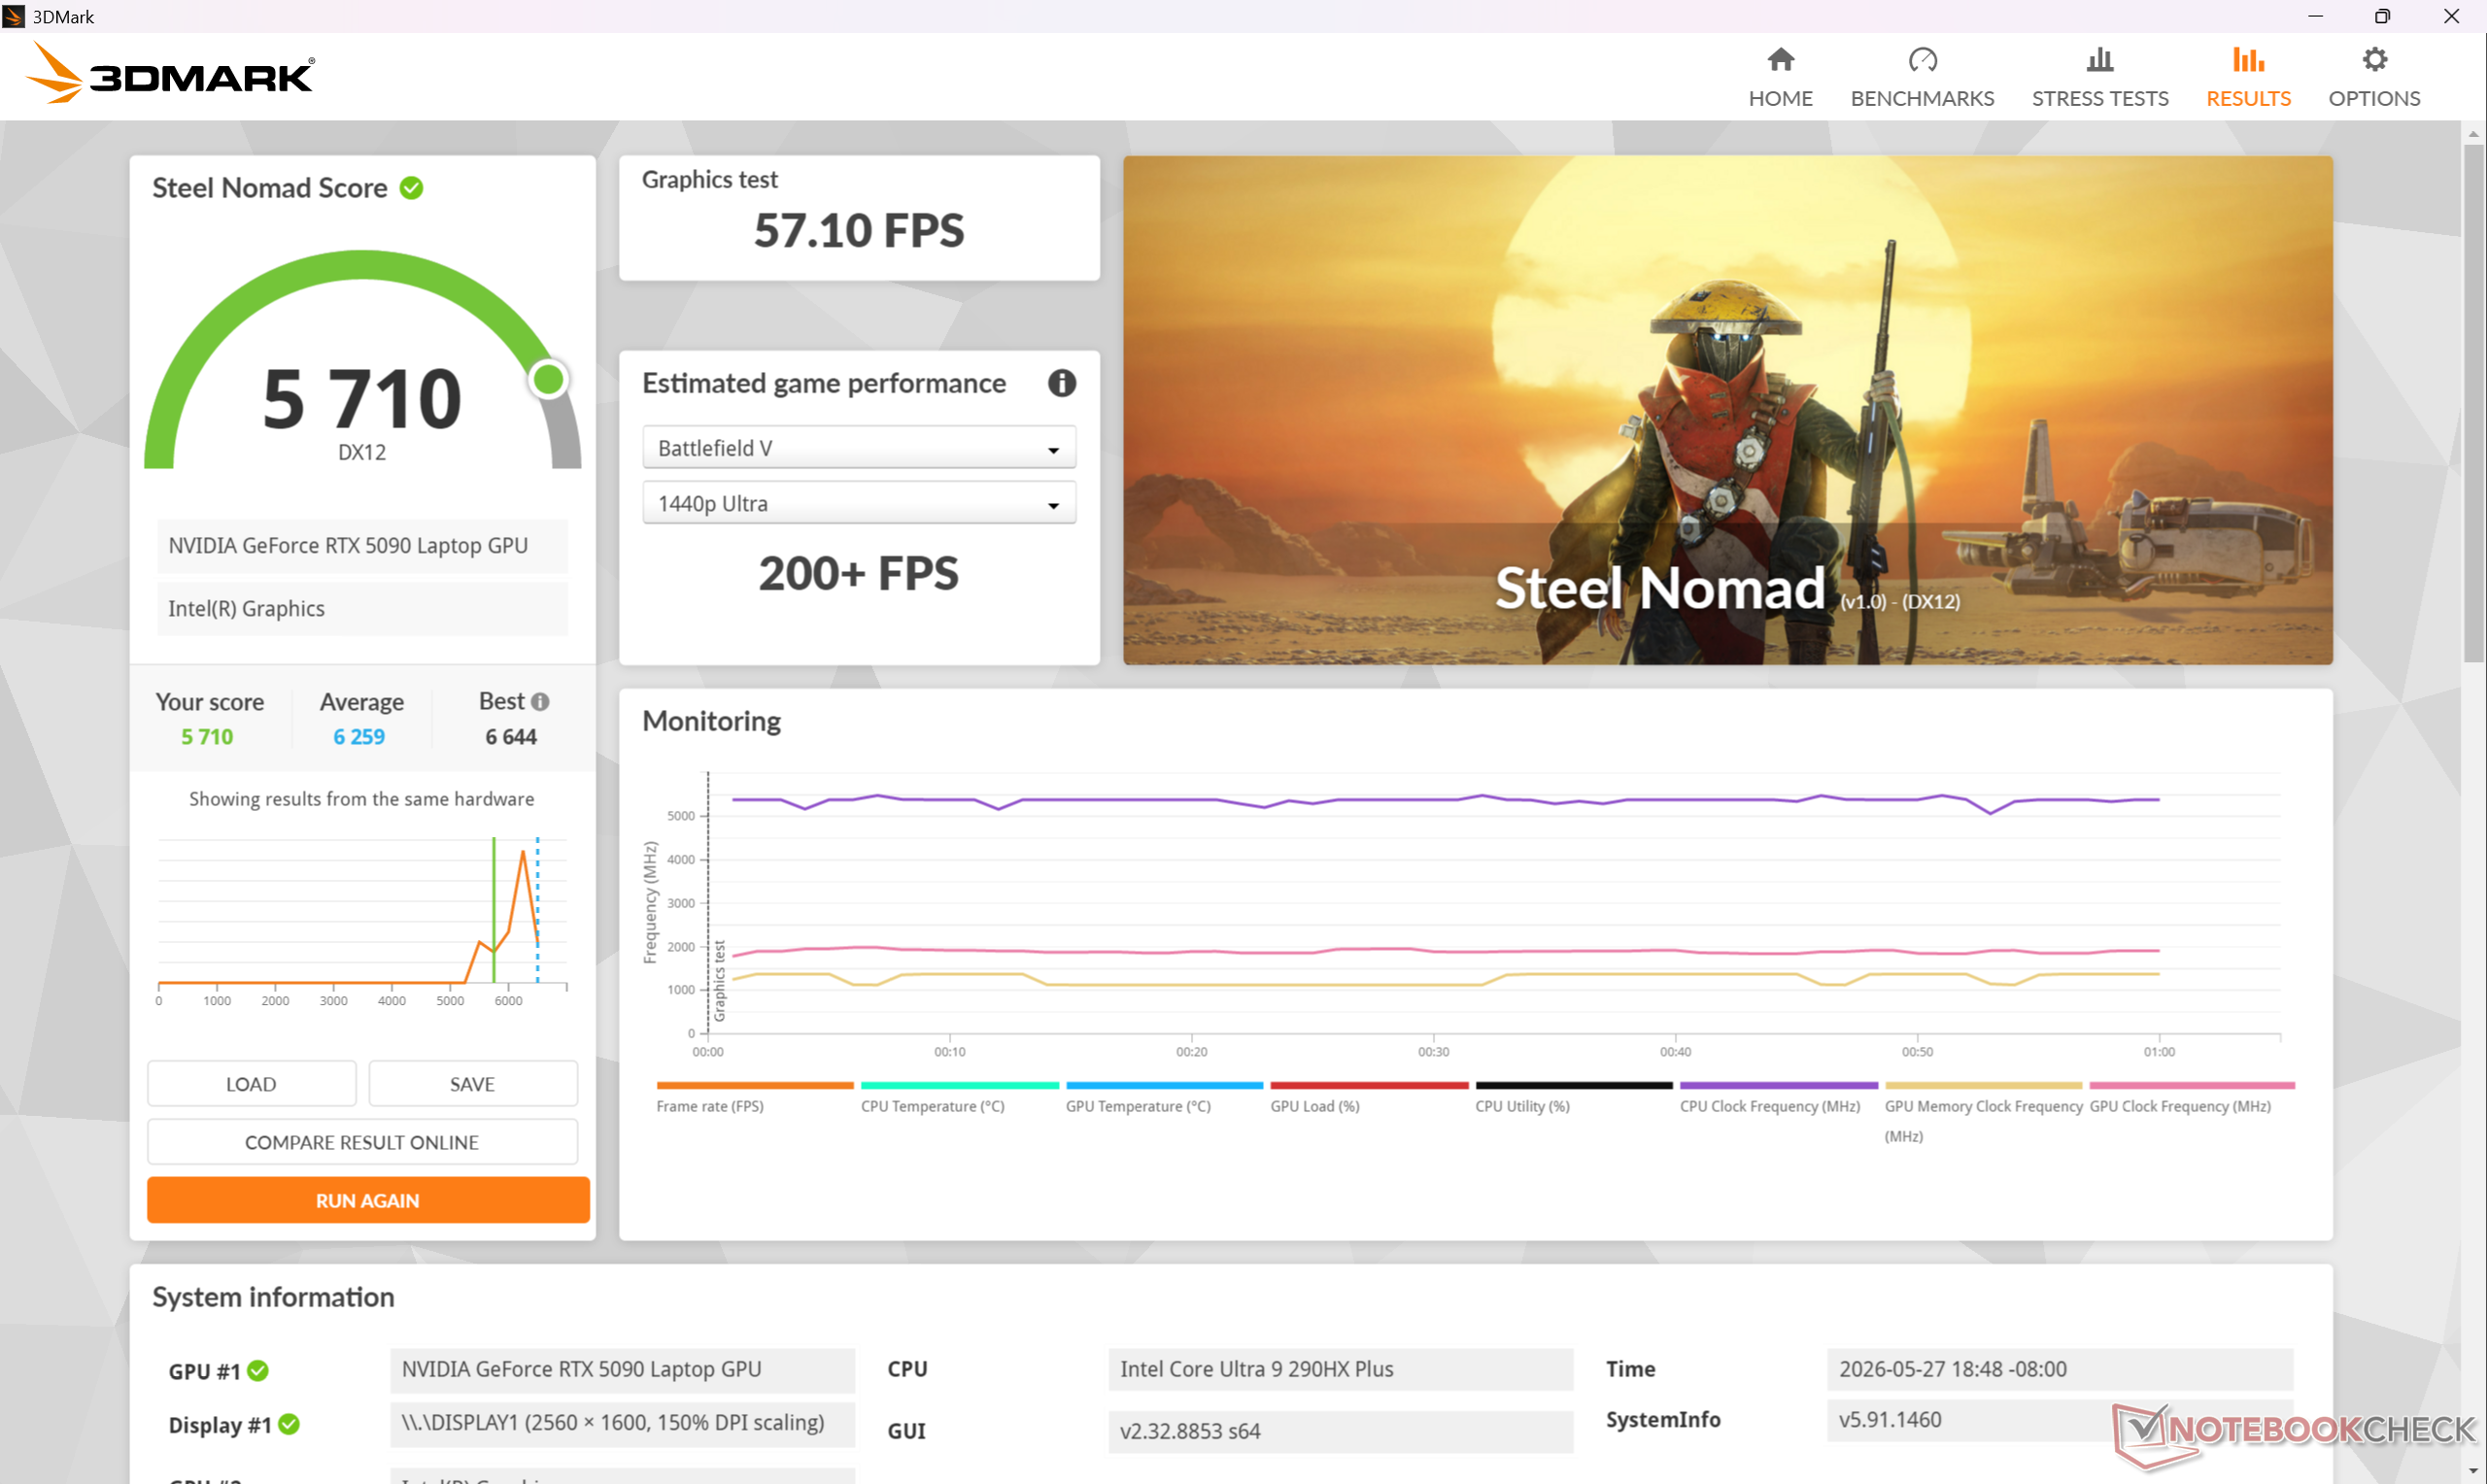
| 3DMark Steel Nomad Score | 5710 pontok | |
Segítség | ||
* ... a kisebb jobb
Játékteljesítmény
A mobil GeForce RTX 5090 vitathatatlanul jobban párosul egy natív 1600p kijelzővel a 4K helyett, ha figyelembe vesszük, hogy a asztali verzió kétszer erősebb lehet. Ne feledje, hogy a rendszert Apex módra vagy Cooler Boost módra kell állítani, hogy teljes mértékben kihasználja a hirdetett 175 W TGP-t.
| Cyberpunk 2077 - 1920x1080 Ultra Preset (FSR off) | |
| MSI Raider 16 Max HX B2WJ | |
| Razer Blade 16 Core Ultra 9 386H | |
| Alienware 16X Aurora Core Ultra 9 290HX Plus | |
| Asus TUF Gaming A16 FA608UP | |
| MSI Crosshair 16 HX AI D2XWGKG | |
| Lenovo Legion 7 16IAX10 | |
| Baldur's Gate 3 - 1920x1080 Ultra Preset AA:T | |
| MSI Raider 16 Max HX B2WJ | |
| Razer Blade 16 Core Ultra 9 386H | |
| Alienware 16X Aurora Core Ultra 9 290HX Plus | |
| MSI Crosshair 16 HX AI D2XWGKG | |
| Asus TUF Gaming A16 FA608UP | |
| Lenovo Legion 7 16IAX10 | |
| GTA V - 1920x1080 Highest AA:4xMSAA + FX AF:16x | |
| MSI Raider 16 Max HX B2WJ | |
| Alienware 16X Aurora Core Ultra 9 290HX Plus | |
| Lenovo Legion 7 16IAX10 | |
| MSI Crosshair 16 HX AI D2XWGKG | |
| Asus TUF Gaming A16 FA608UP | |
| Razer Blade 16 Core Ultra 9 386H | |
| Final Fantasy XV Benchmark - 1920x1080 High Quality | |
| MSI Raider 16 Max HX B2WJ | |
| Razer Blade 16 Core Ultra 9 386H | |
| Alienware 16X Aurora Core Ultra 9 290HX Plus | |
| Asus TUF Gaming A16 FA608UP | |
| MSI Crosshair 16 HX AI D2XWGKG | |
| Lenovo Legion 7 16IAX10 | |
| Strange Brigade - 1920x1080 ultra AA:ultra AF:16 | |
| MSI Raider 16 Max HX B2WJ | |
| Razer Blade 16 Core Ultra 9 386H | |
| Alienware 16X Aurora Core Ultra 9 290HX Plus | |
| MSI Crosshair 16 HX AI D2XWGKG | |
| Lenovo Legion 7 16IAX10 | |
| Asus TUF Gaming A16 FA608UP | |
| Dota 2 Reborn - 1920x1080 ultra (3/3) best looking | |
| Alienware 16X Aurora Core Ultra 9 290HX Plus | |
| MSI Raider 16 Max HX B2WJ | |
| MSI Crosshair 16 HX AI D2XWGKG | |
| Lenovo Legion 7 16IAX10 | |
| Razer Blade 16 Core Ultra 9 386H | |
| Asus TUF Gaming A16 FA608UP | |
Cyberpunk 2077 ultra FPS Diagram
| alacsony | közepes | magas | ultra | QHD DLSS | QHD | 4K DLSS | 4K | |
|---|---|---|---|---|---|---|---|---|
| GTA V (2015) | 191.4 | 190.9 | 187.5 | 165.2 | 162.3 | 181.5 | ||
| Dota 2 Reborn (2015) | 225 | 206 | 189.6 | 176.1 | 160 | |||
| Final Fantasy XV Benchmark (2018) | 234 | 236 | 205 | 171.3 | 96.3 | |||
| X-Plane 11.11 (2018) | 154.8 | 138 | 112.6 | 93.8 | ||||
| Strange Brigade (2018) | 639 | 503 | 471 | 433 | 329 | 179.6 | ||
| Baldur's Gate 3 (2023) | 287 | 242 | 211 | 207 | 202 | 147.7 | 125.9 | 83.1 |
| Cyberpunk 2077 (2023) | 199.4 | 196.6 | 177.3 | 161.7 | 122.7 | 111.2 | 61 | 50.4 |
| F1 24 (2024) | 353 | 379 | 364 | 153.8 | 154.1 | 99.8 | 85.3 | 50.5 |
| Black Myth: Wukong (2024) | 122 | 97 | 58 | 65 | 45 | 46 | 27 | |
| Assassin's Creed Shadows (2025) | 102 | 89 | 69 | 70 | 59 | 56 | 43 |
Kibocsátás
Rendszerzaj
A ventilátorzaj szorosan kapcsolódik az öt teljesítményprofil-beállításhoz, a legkisebb teljesítménytől a legnagyobb teljesítményig terjedő sorrendben: A legmagasabb fokozat: Eco, Kiegyensúlyozott, Extrém teljesítmény, Apex és Cooler Boost: Eco, Kiegyensúlyozott, Extrém teljesítmény, Apex és Cooler Boost. Amikor a Cyberpunk 2077-et ezeken a profilokon futtatjuk, a ventilátorzaj 36,2 dB(A), 47,5 dB(A), 51,1 dB(A), 57 dB(A) és 60,2 dB(A) értéken stabilizálódik. A pulzáló viselkedés általában minimális, ha kiegyensúlyozott vagy alacsonyabb üzemmódra van állítva. Még így is, az 51,1 dB(A) az Extreme Performance módban való játék során valamivel halkabb, mint a konkurens modellek, például a Lenovo Legion 7 16IAX10 vagy a Razer Blade 16.
Zajszint
| Üresjárat |
| 26.6 / 26.7 / 26.9 dB(A) |
| Terhelés |
| 36 / 60.2 dB(A) |
 | ||
30 dB csendes 40 dB(A) hallható 50 dB(A) hangos |
||
min: | ||
| MSI Raider 16 Max HX B2WJ Ultra 9 290HX Plus, GeForce RTX 5090 Laptop | MSI Crosshair 16 HX AI D2XWGKG Ultra 9 275HX, GeForce RTX 5070 Laptop | Razer Blade 16 Core Ultra 9 386H Ultra 9 386H, GeForce RTX 5090 Laptop | Alienware 16X Aurora Core Ultra 9 290HX Plus Ultra 9 290HX Plus, GeForce RTX 5070 Ti Laptop | Asus TUF Gaming A16 FA608UP R7 260, GeForce RTX 5070 Laptop | Lenovo Legion 7 16IAX10 Ultra 7 255HX, GeForce RTX 5060 Laptop | |
|---|---|---|---|---|---|---|
| Noise | -11% | -1% | -4% | -11% | 1% | |
| off / környezet * (dB) | 23.1 | 25.56 -11% | 23.1 -0% | 23.4 -1% | 25.1 -9% | 23.9 -3% |
| Idle Minimum * (dB) | 26.6 | 28.3 -6% | 23.4 12% | 23.8 11% | 32.2 -21% | 24 10% |
| Idle Average * (dB) | 26.7 | 28.3 -6% | 25.4 5% | 23.8 11% | 32.2 -21% | 26 3% |
| Idle Maximum * (dB) | 26.9 | 28.3 -5% | 29.3 -9% | 31.4 -17% | 32.2 -20% | 29.4 -9% |
| Load Average * (dB) | 36 | 50.26 -40% | 42.6 -18% | 48.7 -35% | 38.1 -6% | 35.4 2% |
| Cyberpunk 2077 ultra * (dB) | 51.1 | 57.8 -13% | 53.6 -5% | 51.5 -1% | 53.9 -5% | 54.6 -7% |
| Load Maximum * (dB) | 60.2 | 57.95 4% | 53.7 11% | 59.8 1% | 57.1 5% | 54.7 9% |
* ... a kisebb jobb
Hőmérséklet
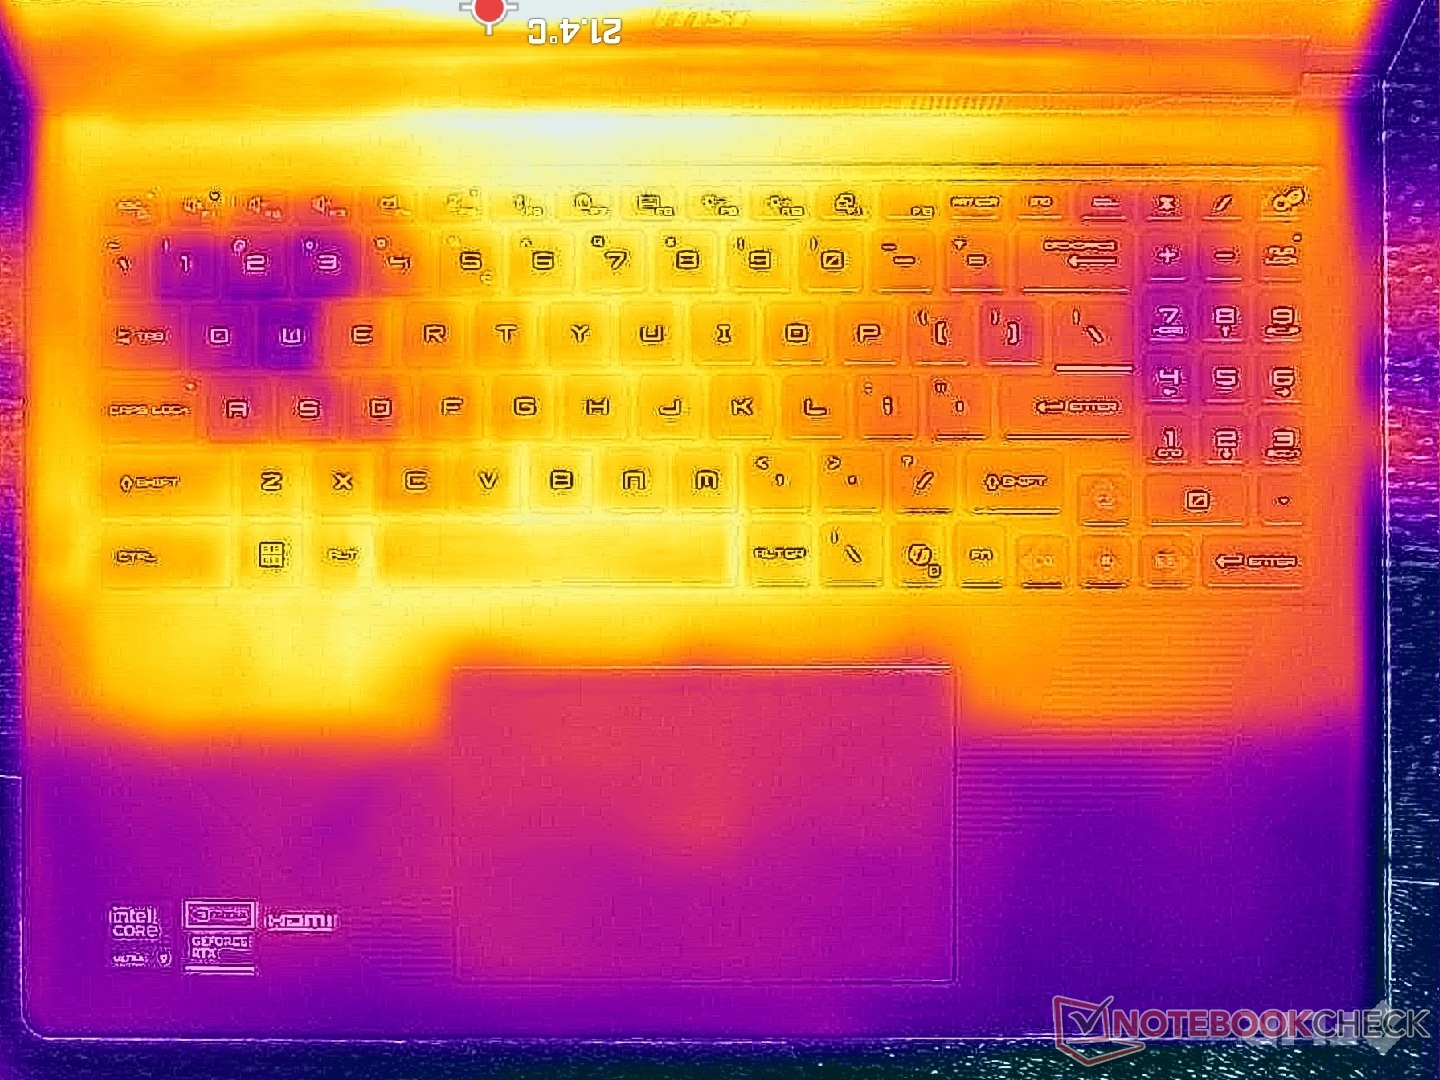
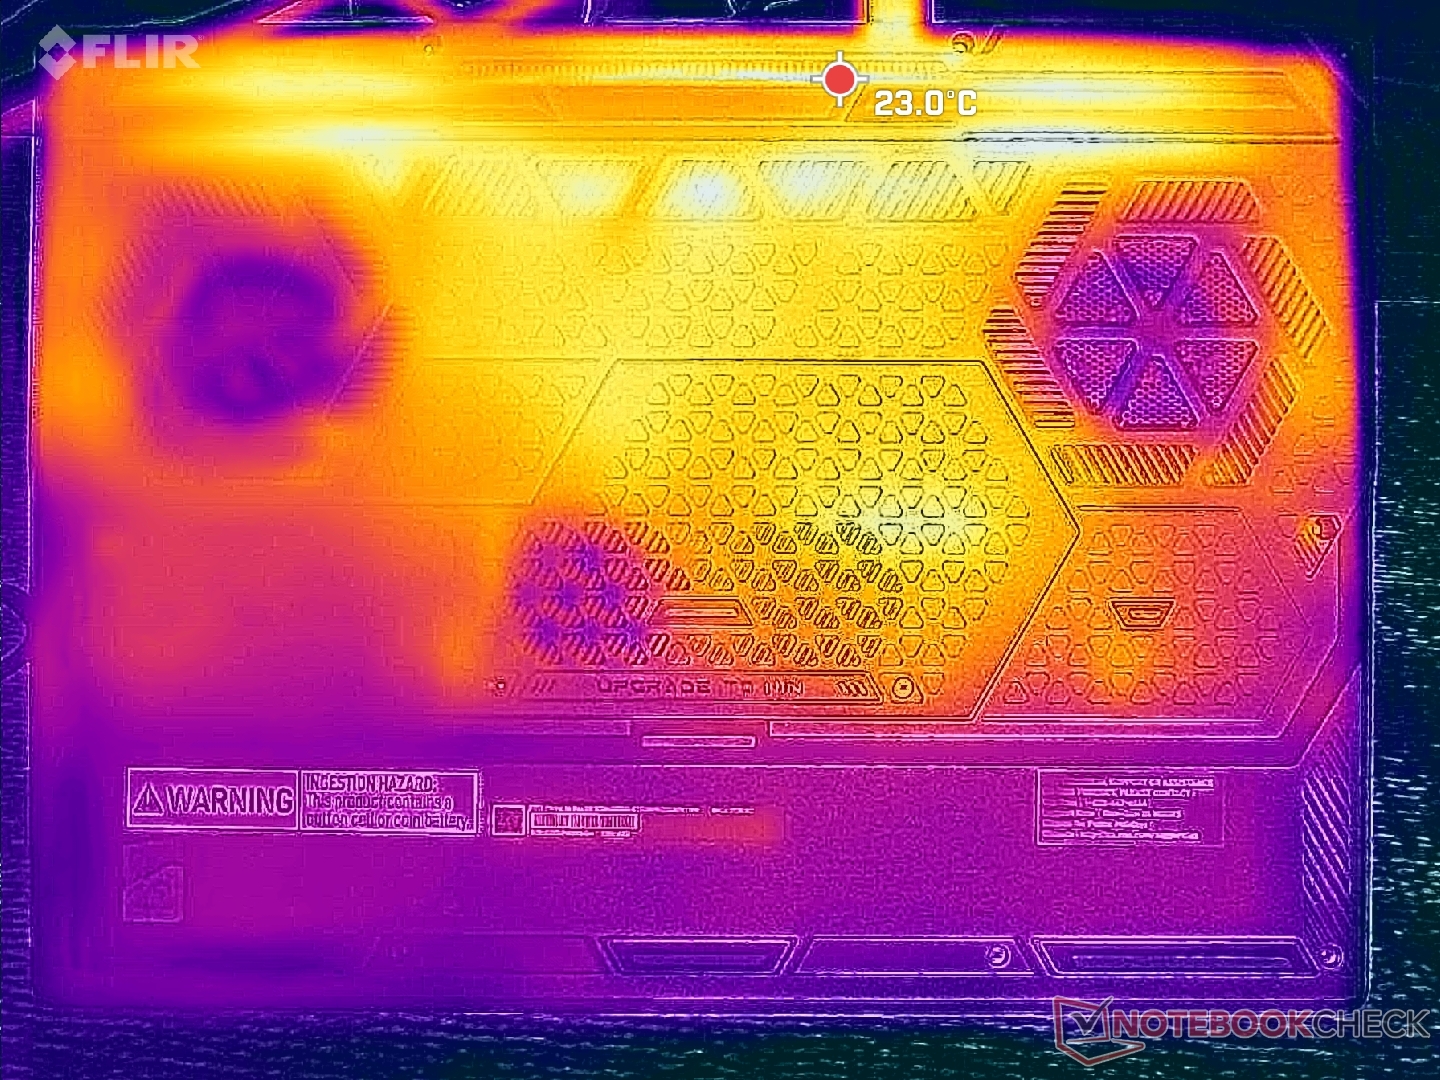
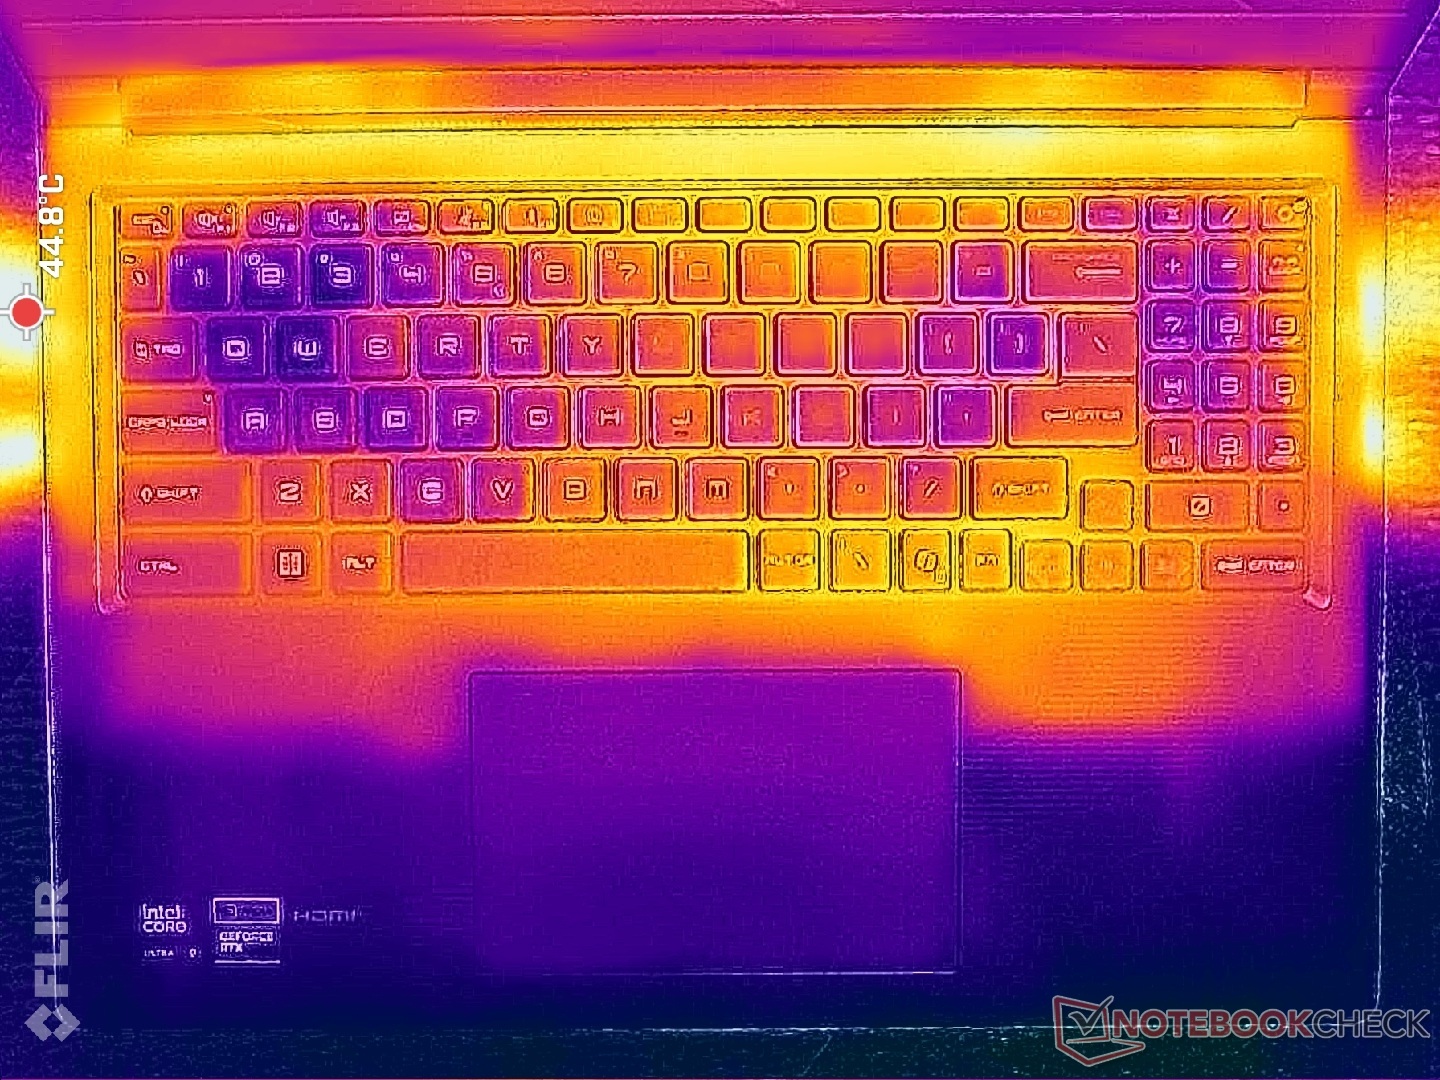
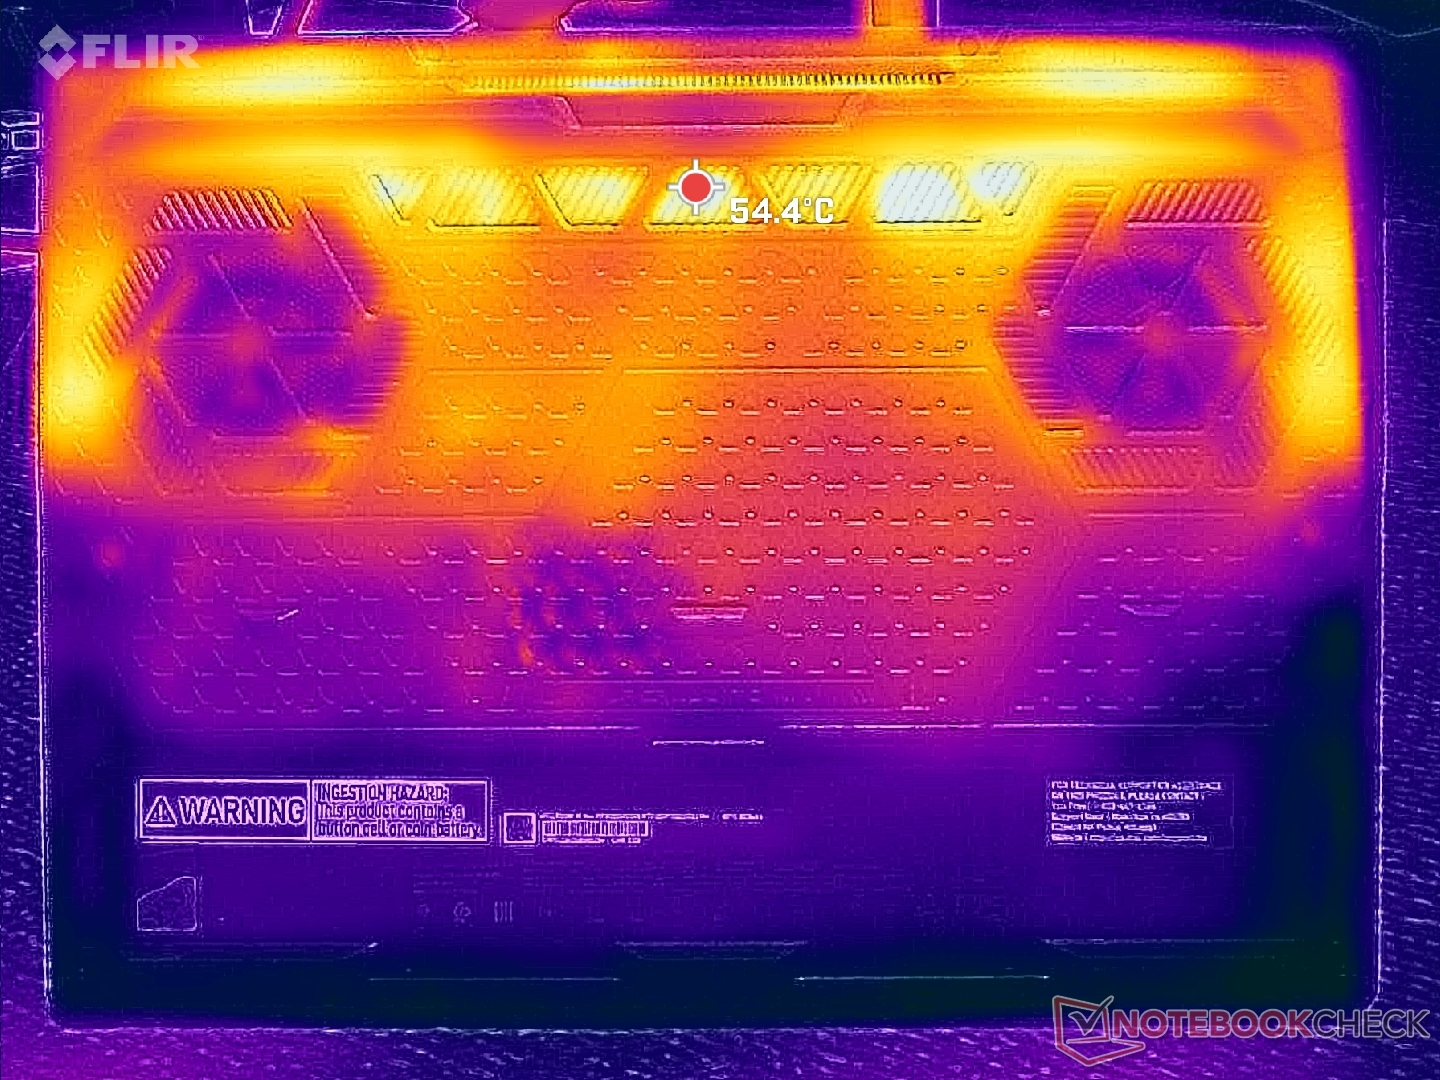
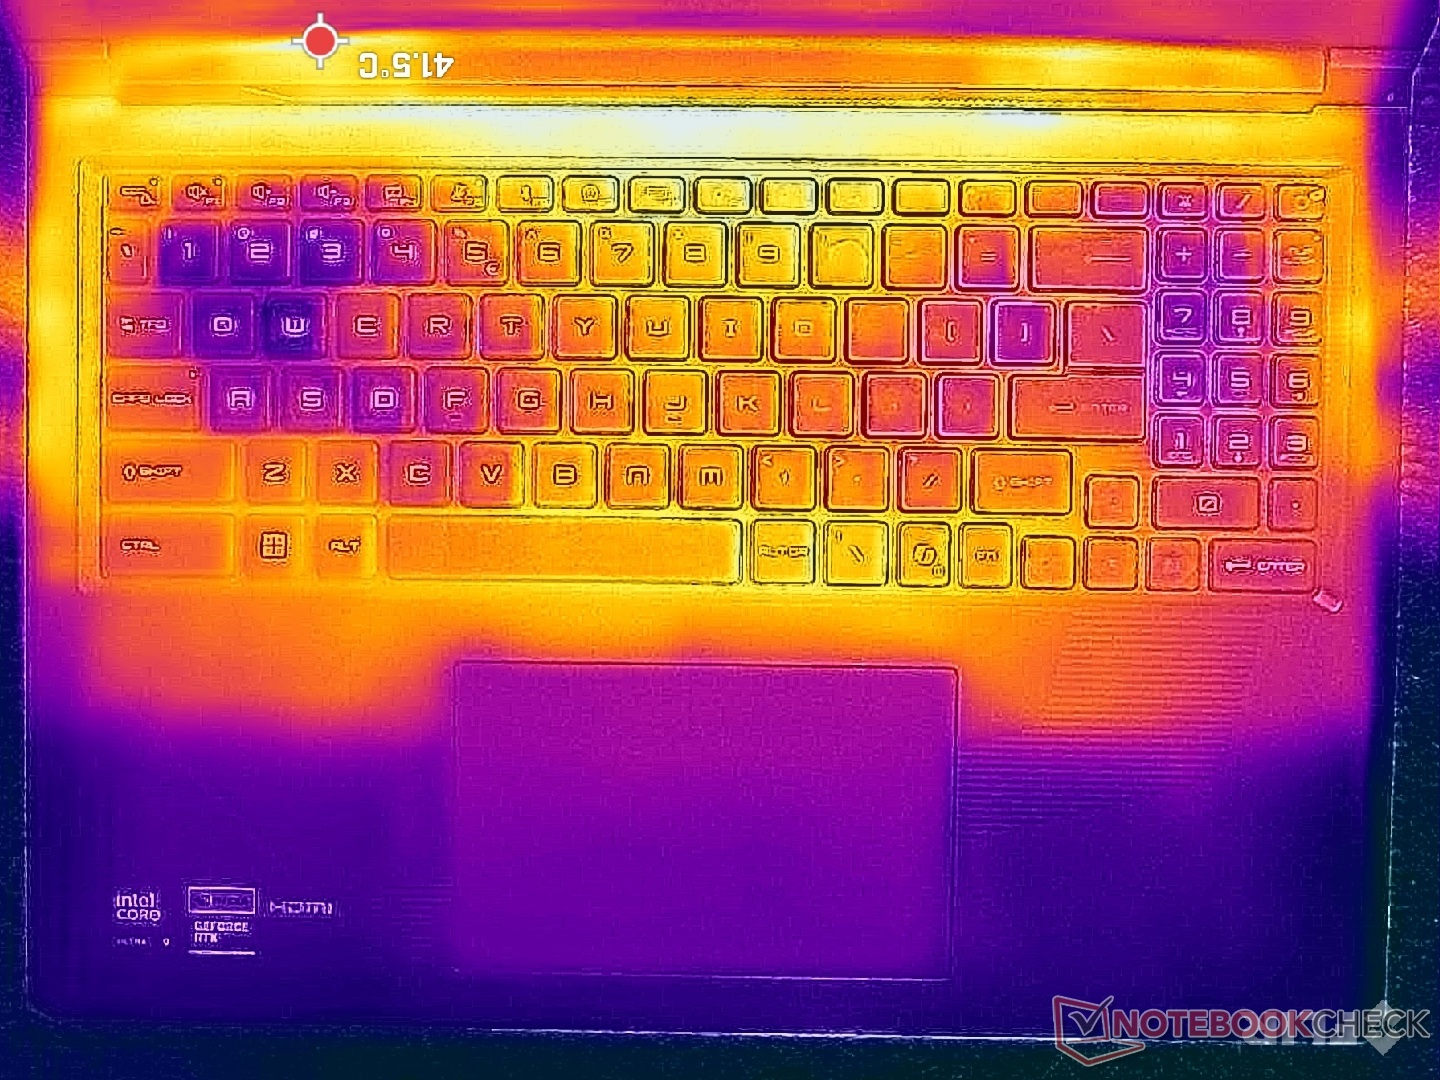
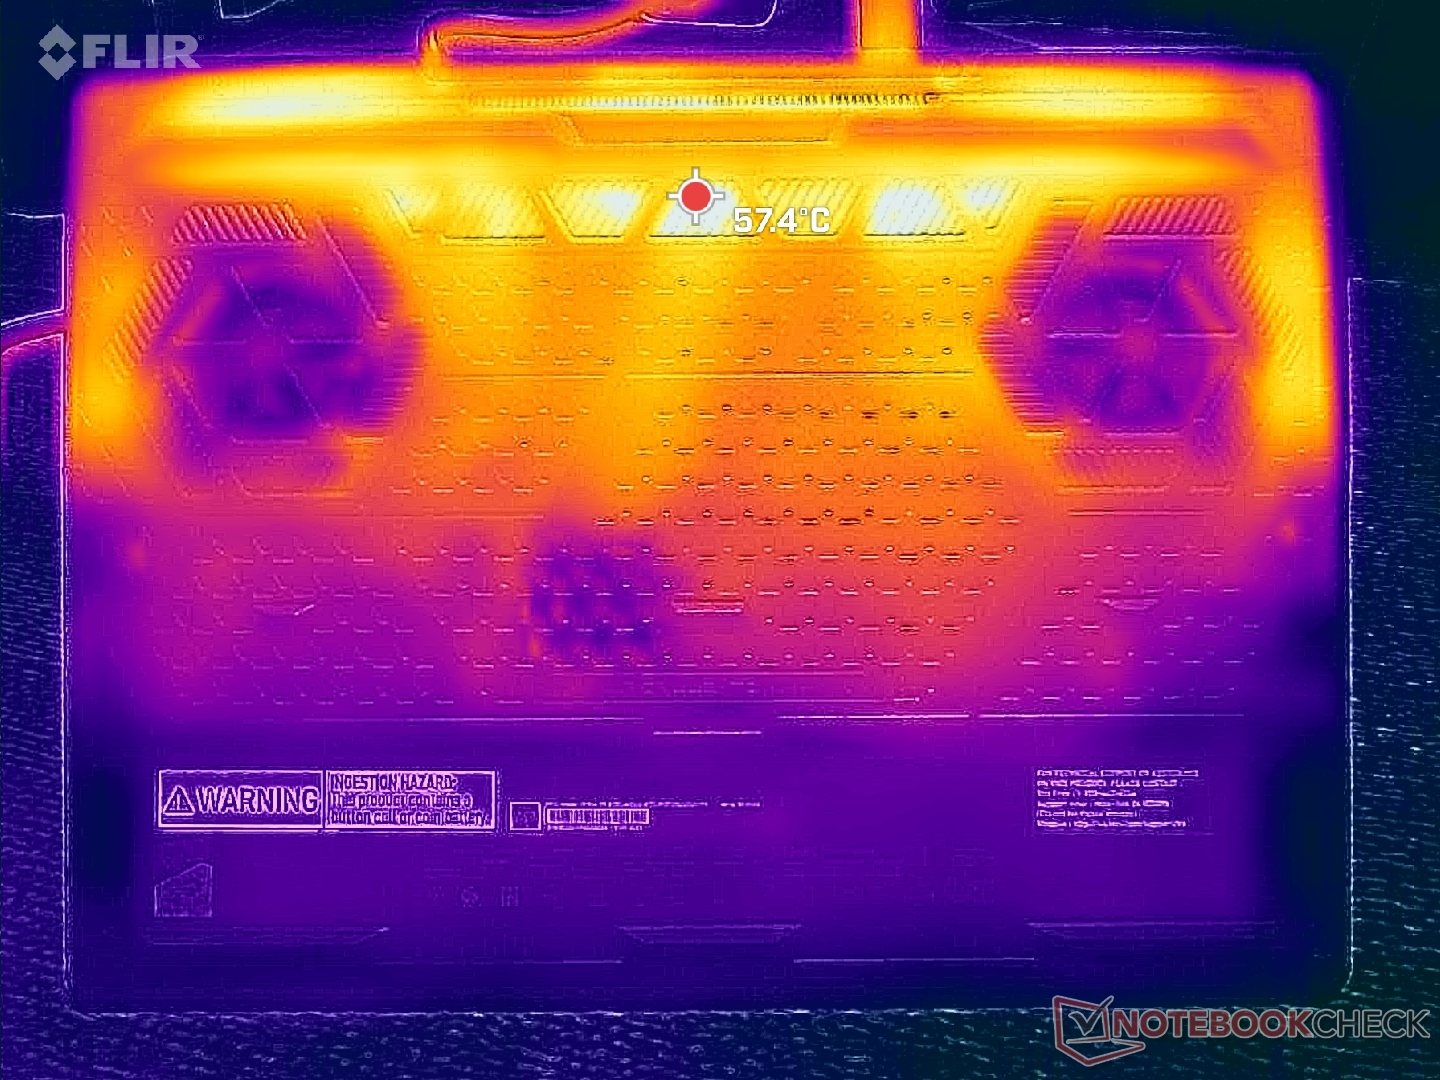
A felületi hőmérséklet forró pontjai elérnék a 44 C és 46 C-ot a billentyűzetfedélen, illetve az alsó borításon, ami néhány C fokkal hűvösebb, mint amit a vékonyabb Razer Blade 16-on megfigyeltünk.
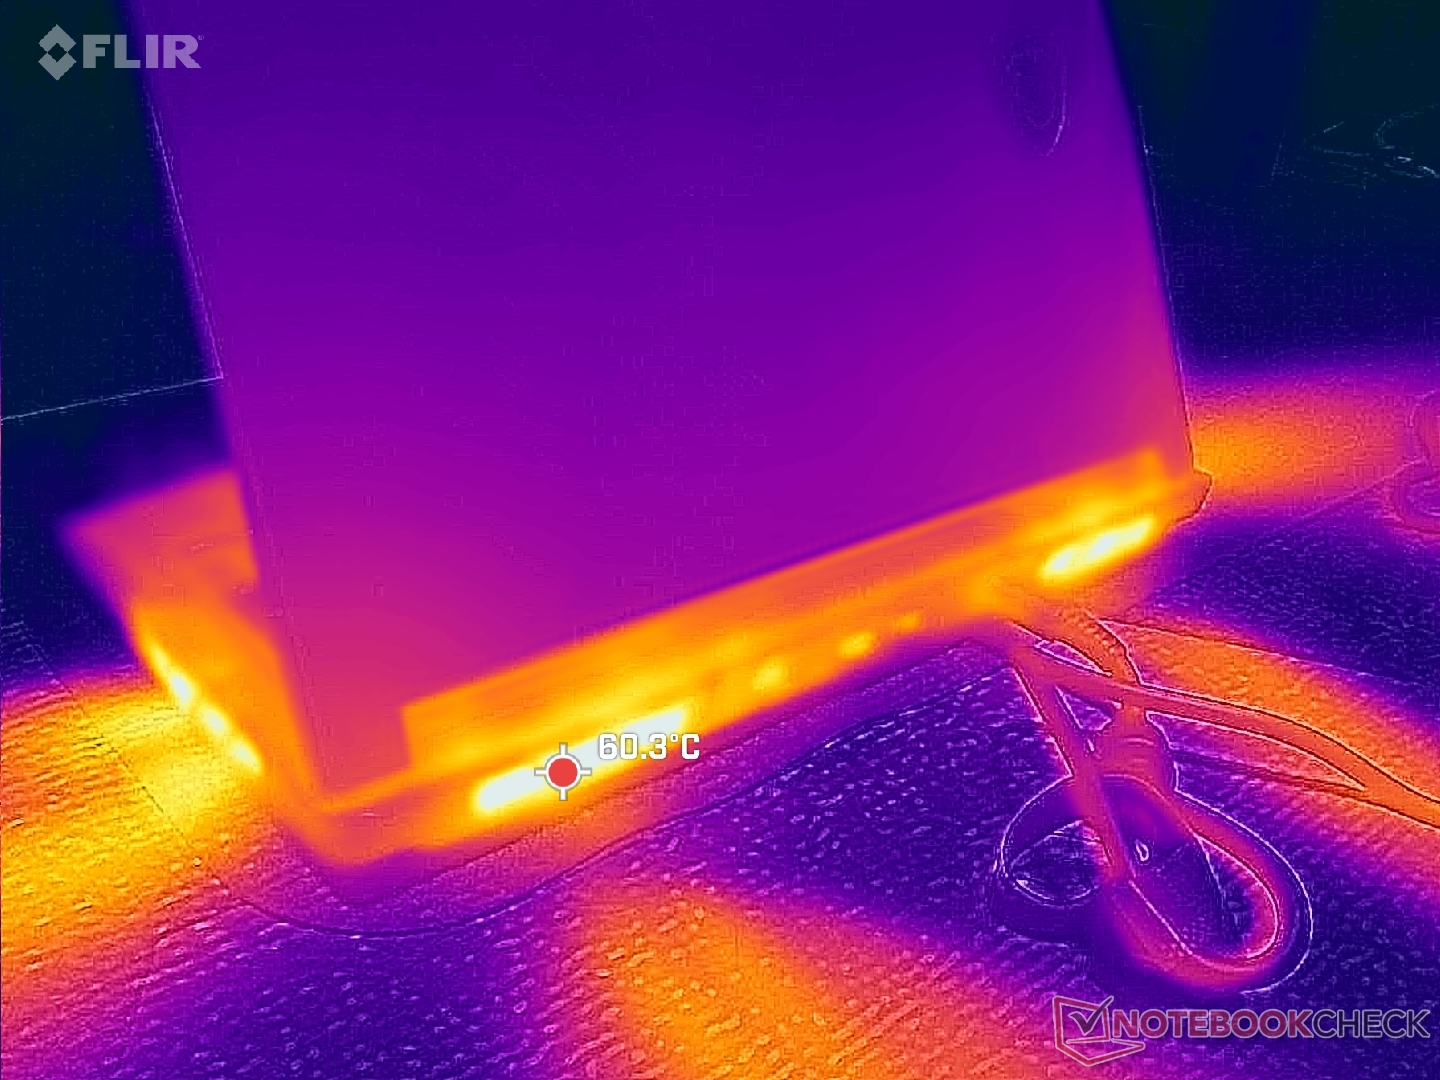
(±) A felső oldalon a maximális hőmérséklet 43.2 °C / 110 F, összehasonlítva a 40.4 °C / 105 F átlagával , 21.2 és 68.8 °C között a Gaming osztálynál.
(-) Az alsó maximum 45.6 °C / 114 F-ig melegszik fel, összehasonlítva a 43.2 °C / 110 F átlagával
(+) Üresjáratban a felső oldal átlagos hőmérséklete 26.1 °C / 79 F, összehasonlítva a 33.9 °C / ### eszközátlaggal class_avg_f### F.
(±) 3: The average temperature for the upper side is 34.1 °C / 93 F, compared to the average of 33.9 °C / 93 F for the class Gaming.
(+) A csuklótámasz és az érintőpad eléri a bőr maximális hőmérsékletét (33.6 °C / 92.5 F), ezért nem forrók.
(-) A hasonló eszközök csuklótámasz területének átlagos hőmérséklete 28.8 °C / 83.8 F volt (-4.8 °C / -8.7 F).
| MSI Raider 16 Max HX B2WJ Ultra 9 290HX Plus, GeForce RTX 5090 Laptop | MSI Crosshair 16 HX AI D2XWGKG Ultra 9 275HX, GeForce RTX 5070 Laptop | Razer Blade 16 Core Ultra 9 386H Ultra 9 386H, GeForce RTX 5090 Laptop | Alienware 16X Aurora Core Ultra 9 290HX Plus Ultra 9 290HX Plus, GeForce RTX 5070 Ti Laptop | Asus TUF Gaming A16 FA608UP R7 260, GeForce RTX 5070 Laptop | Lenovo Legion 7 16IAX10 Ultra 7 255HX, GeForce RTX 5060 Laptop | |
|---|---|---|---|---|---|---|
| Heat | -3% | -17% | 2% | 8% | -14% | |
| Maximum Upper Side * (°C) | 43.2 | 44.8 -4% | 45.6 -6% | 48.2 -12% | 39.5 9% | 47 -9% |
| Maximum Bottom * (°C) | 45.6 | 43.4 5% | 47 -3% | 41 10% | 45.1 1% | 44 4% |
| Idle Upper Side * (°C) | 27.8 | 31.2 -12% | 35.2 -27% | 28.2 -1% | 25.7 8% | 35.6 -28% |
| Idle Bottom * (°C) | 29 | 28.8 1% | 37.6 -30% | 26.2 10% | 25.5 12% | 35.2 -21% |
* ... a kisebb jobb
Stressz teszt
A CPU a Prime95 stressz elindítása után körülbelül egy percig 4,5 GHz-re, 215 W-ra és 105 C-ra gyorsult. Ezután 3,9 GHz-re és ~152 W-ra csökken, hogy a maghőmérsékletet 96 C-on, kezelhetőbb szinten tartsa Alienware 16 Area-51, amely pontosan ugyanazzal a CPU-val rendelkezik, mint az MSI, hasonló körülmények között szintén a magas 90 C-os tartományban stabilizálódott, ami arra utal, hogy a Core Ultra 9 290HX Plus az egyik legmelegebb mobil CPU a piacon.
Figyeljük meg a GPU átlagos órajelének folyamatos növekedését, amikor gyorsabb teljesítményprofilokra váltunk, amint azt az alábbi képernyőképek és táblázat is mutatja.
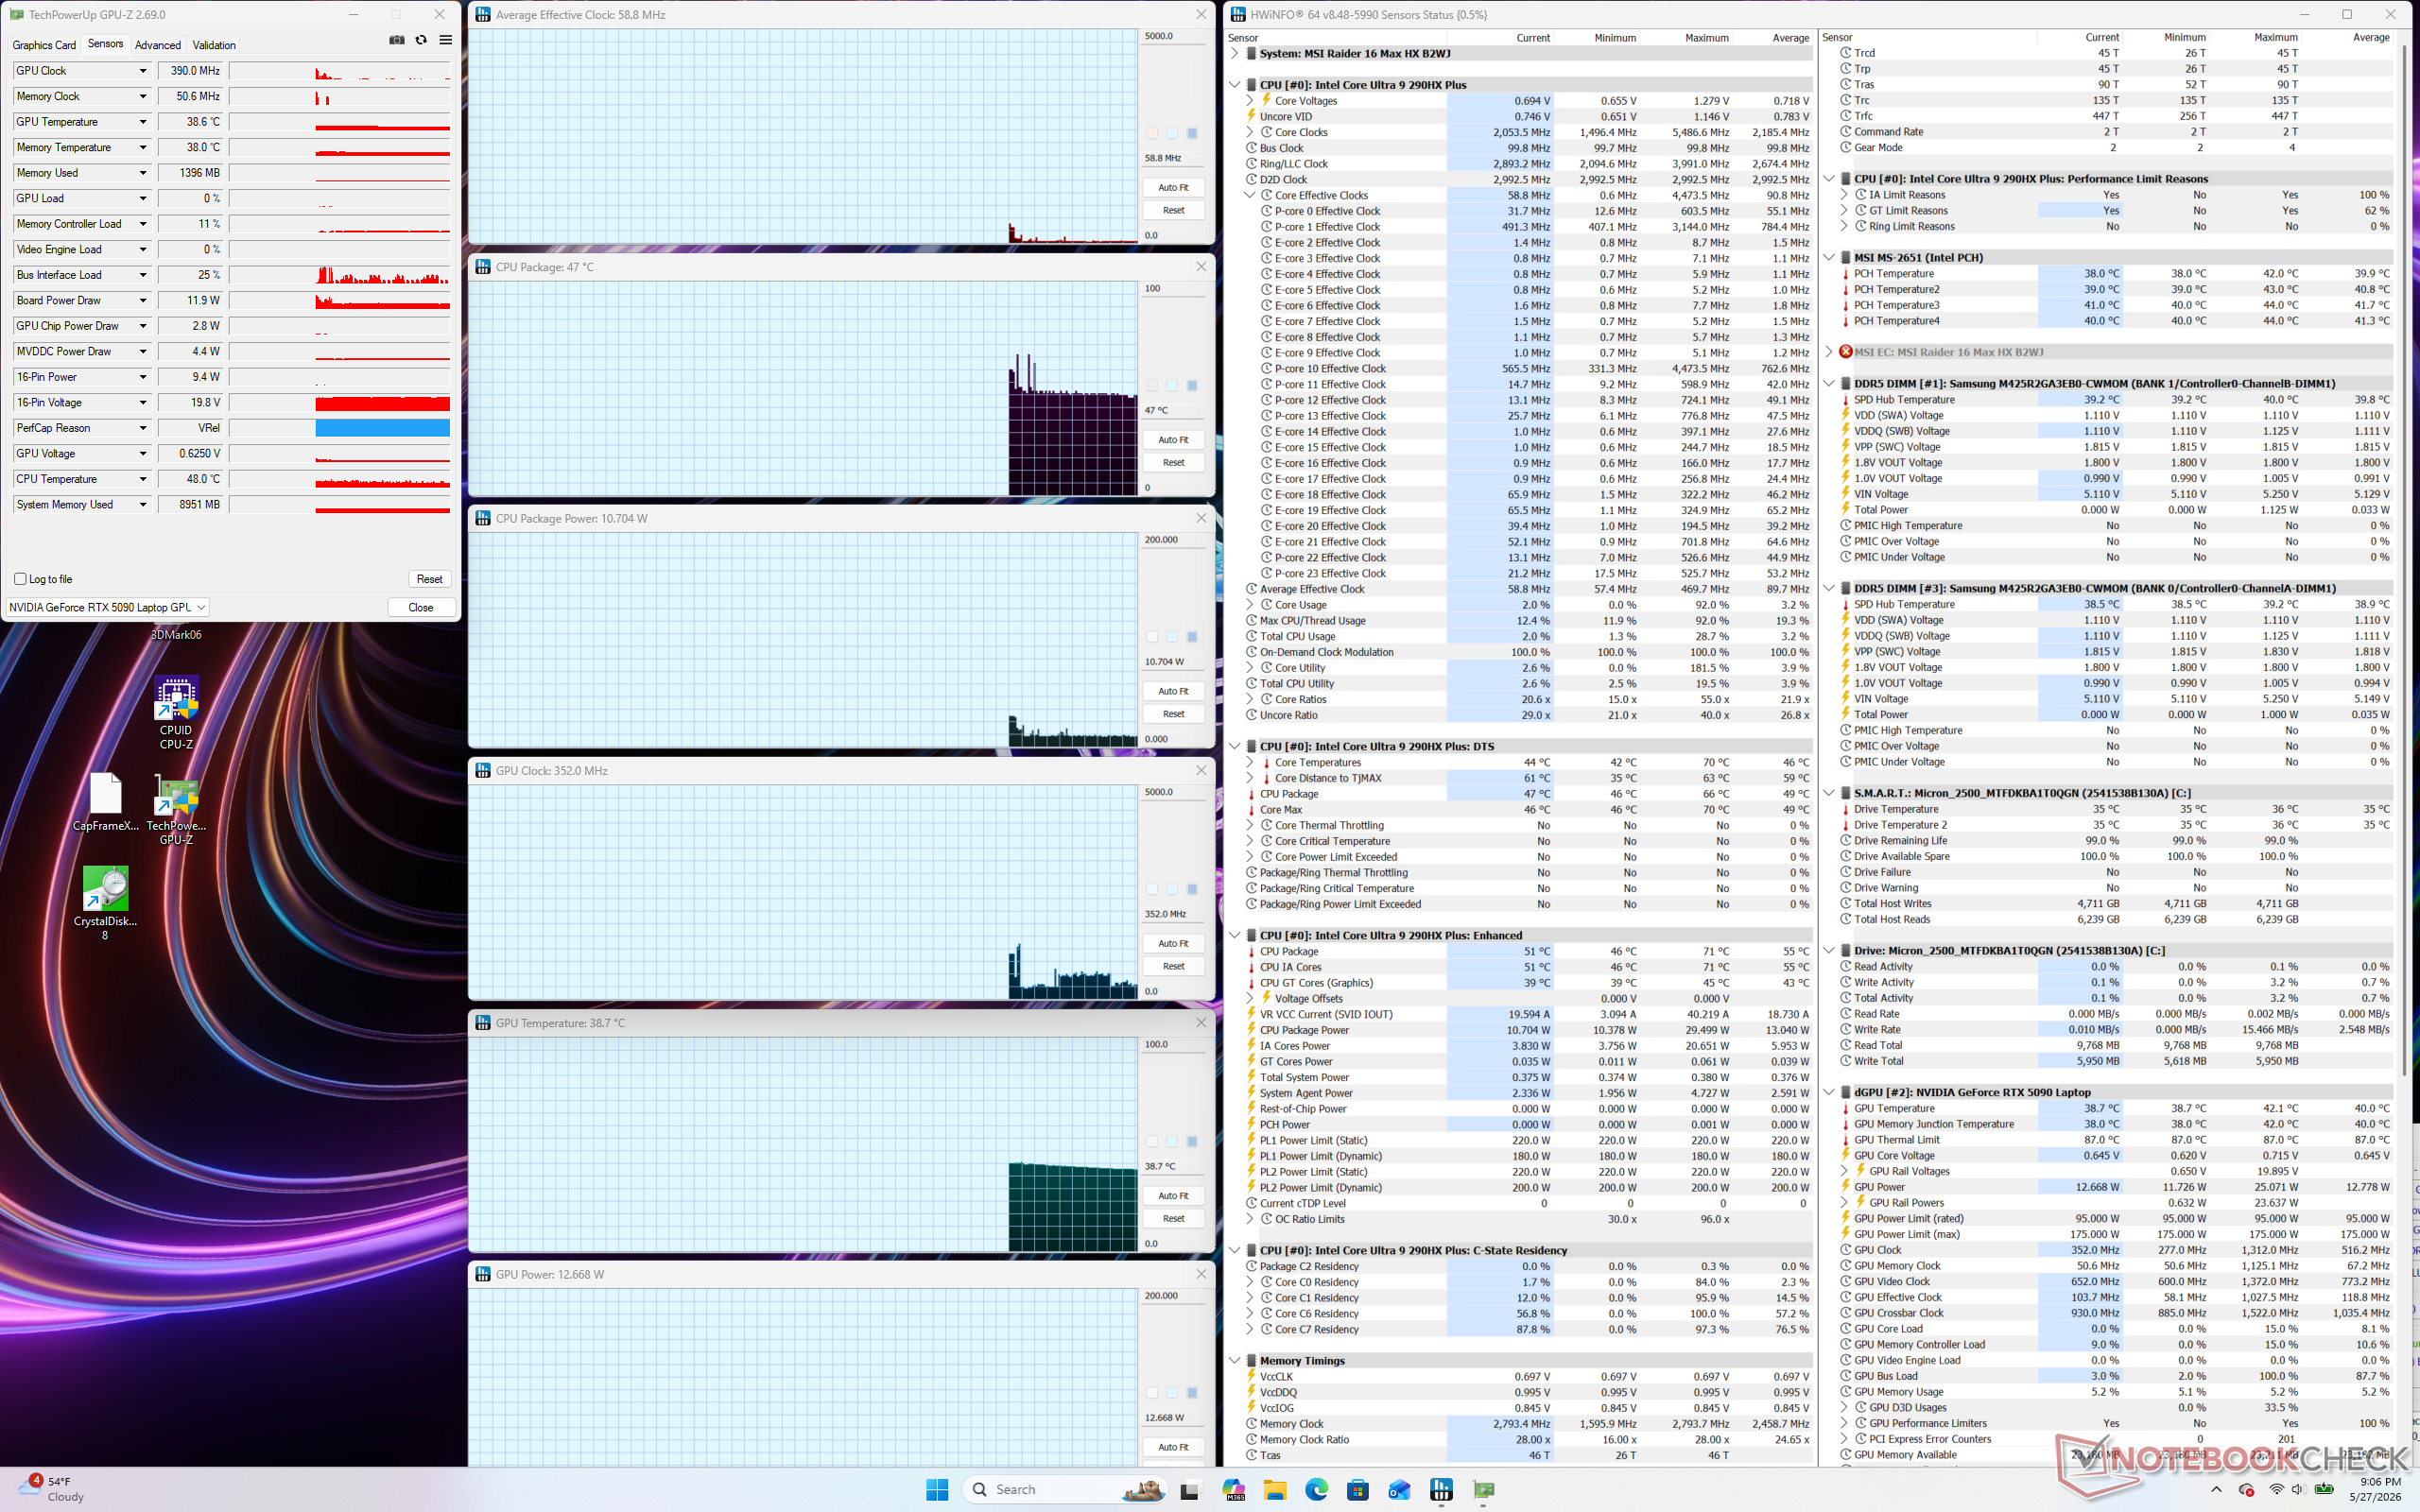
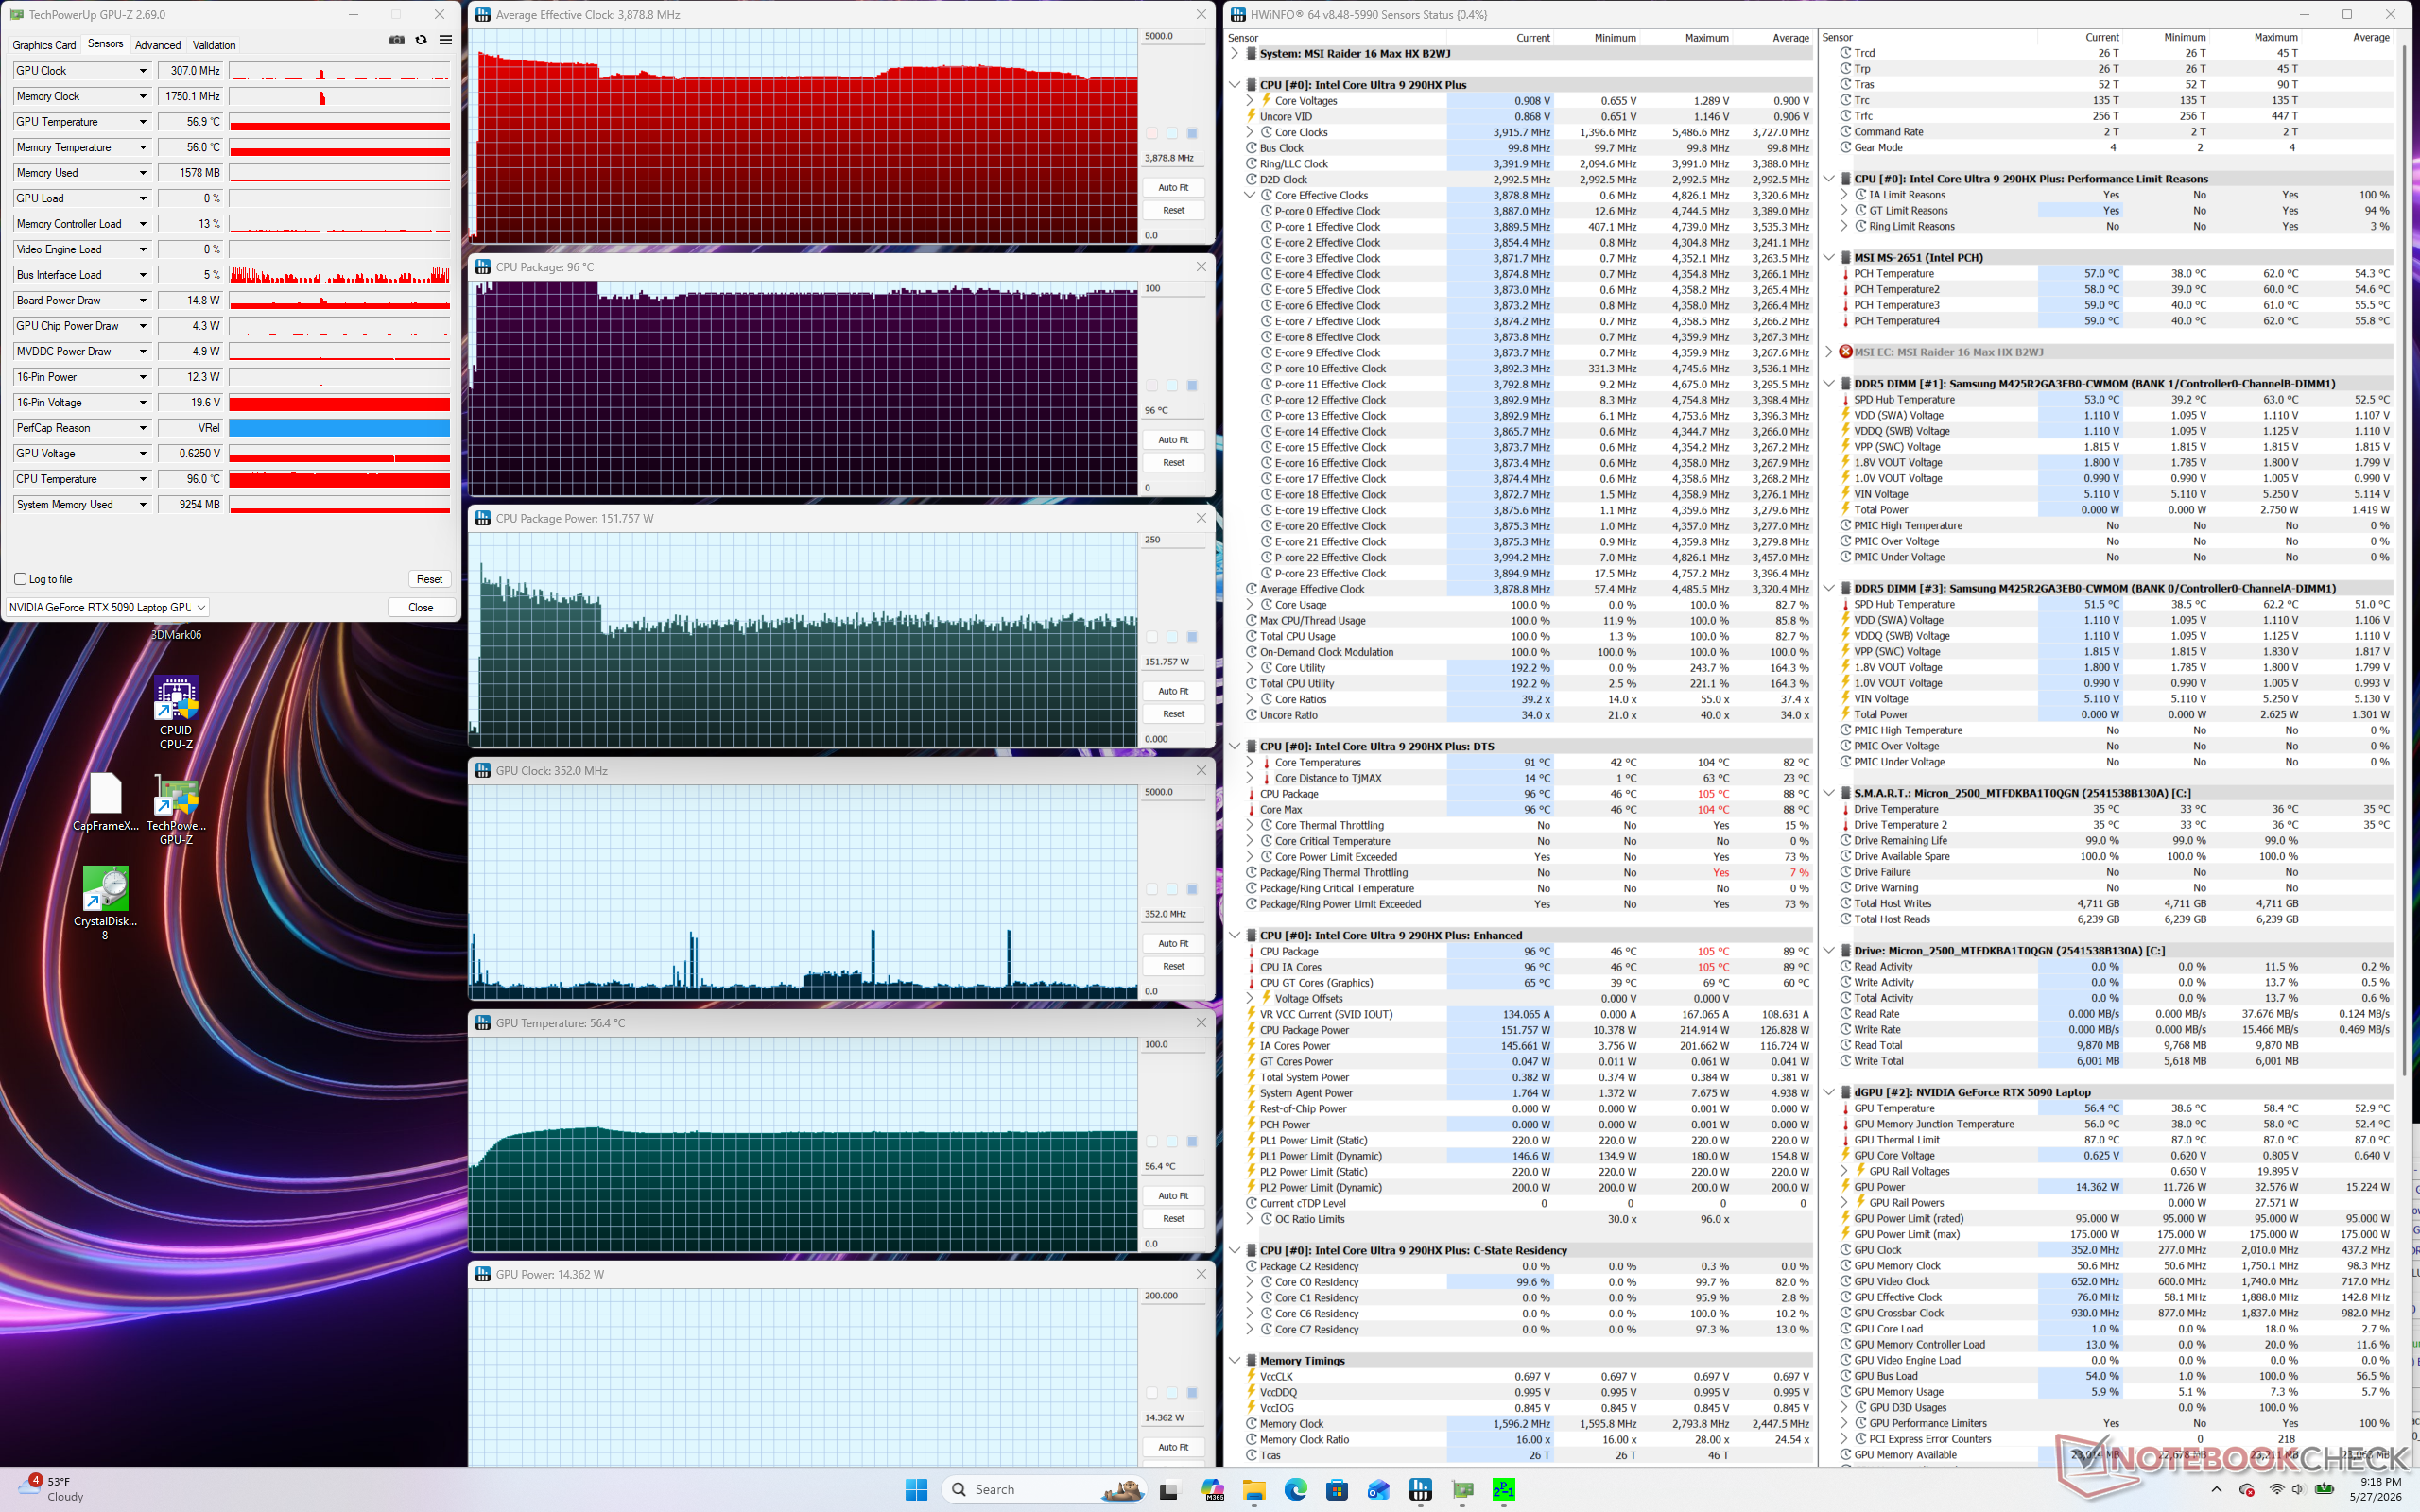
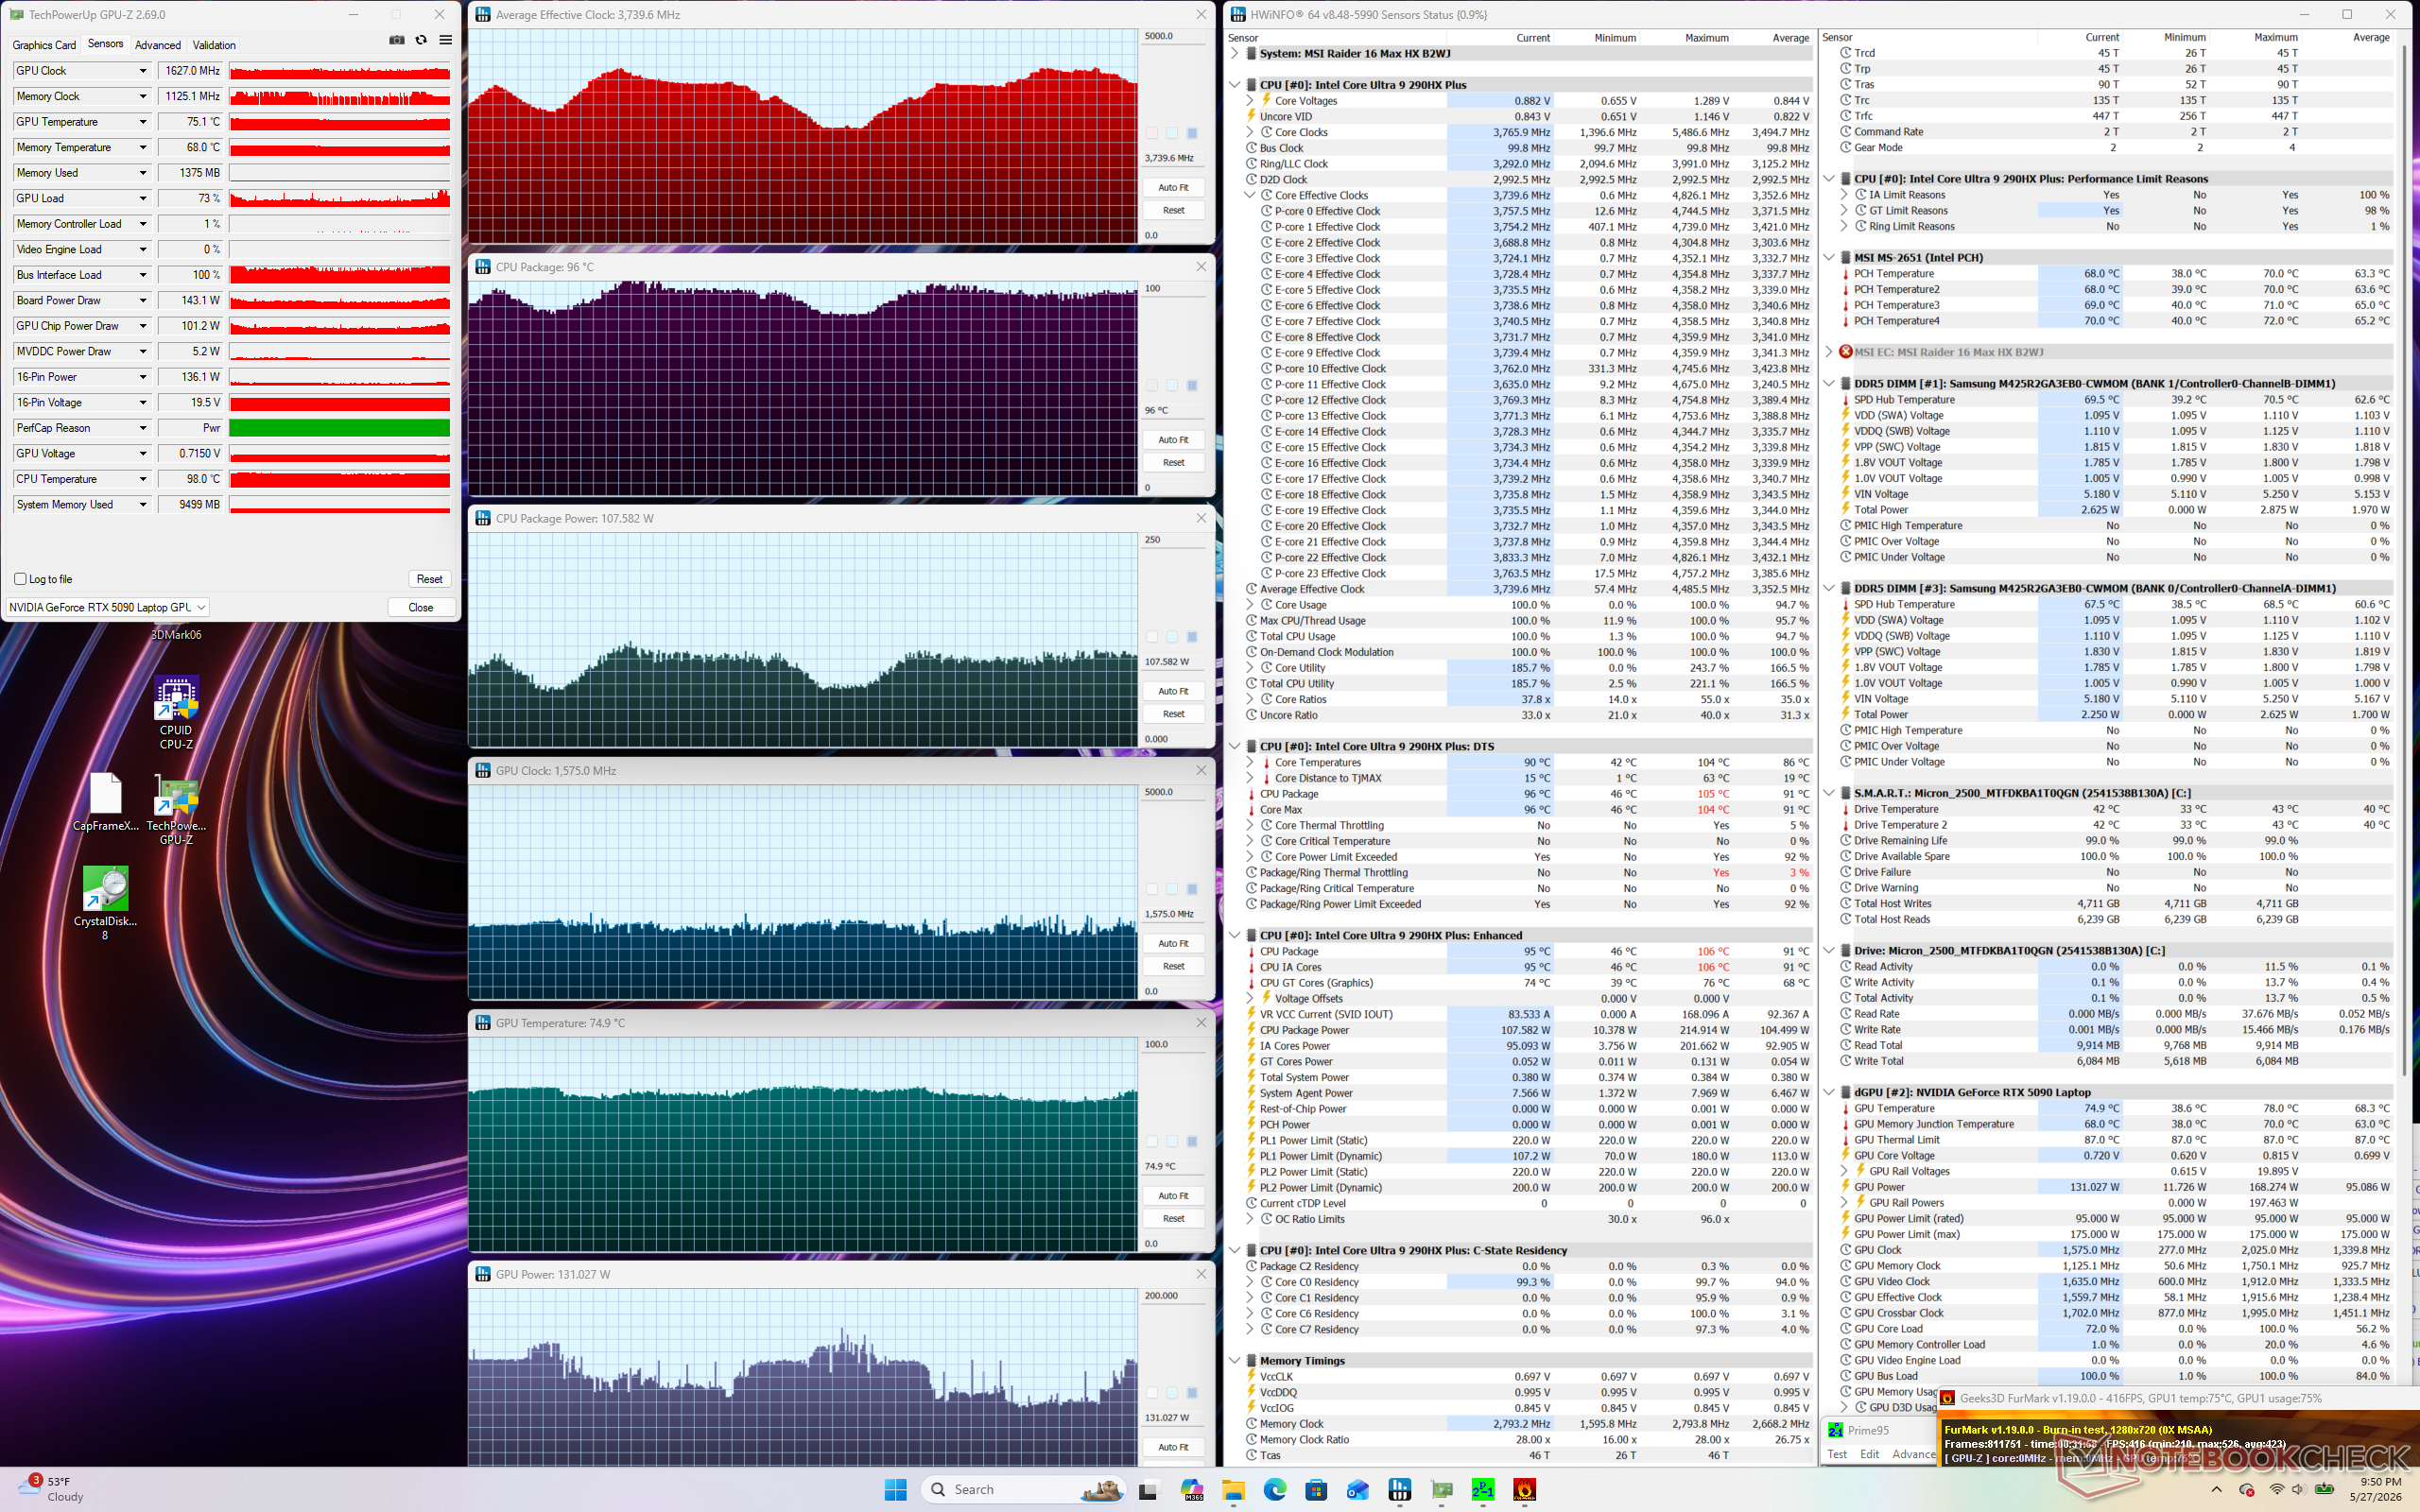
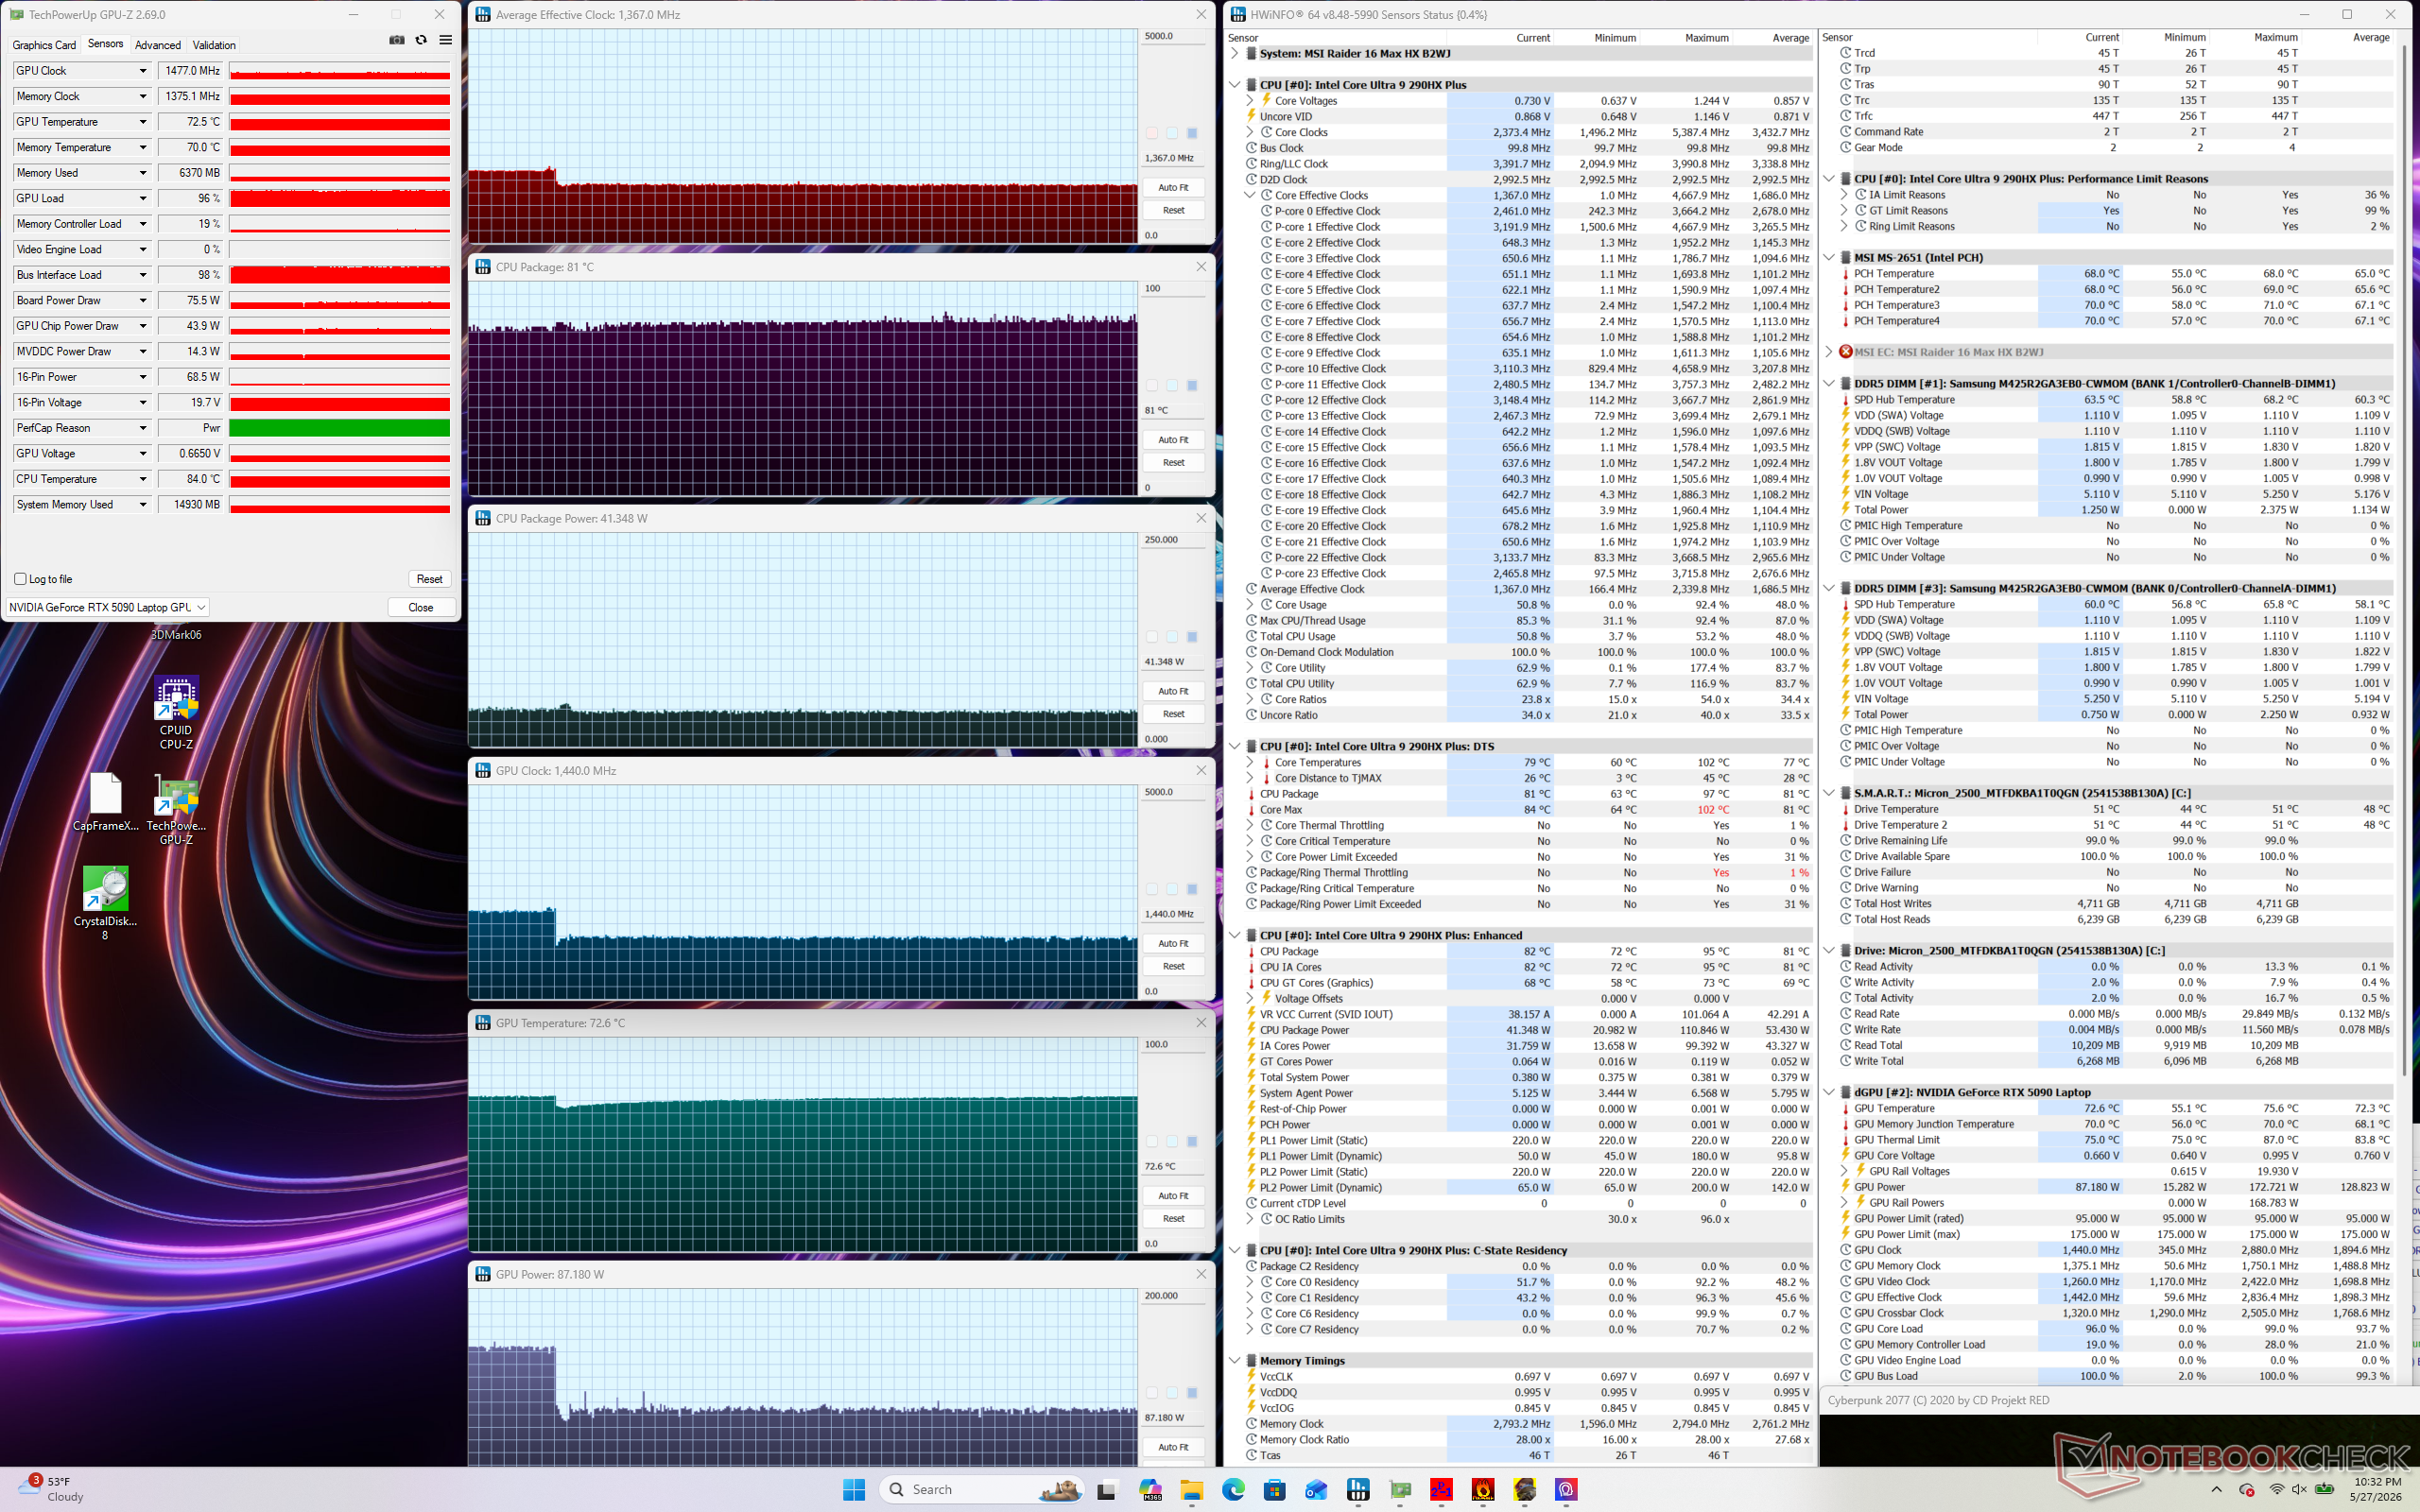
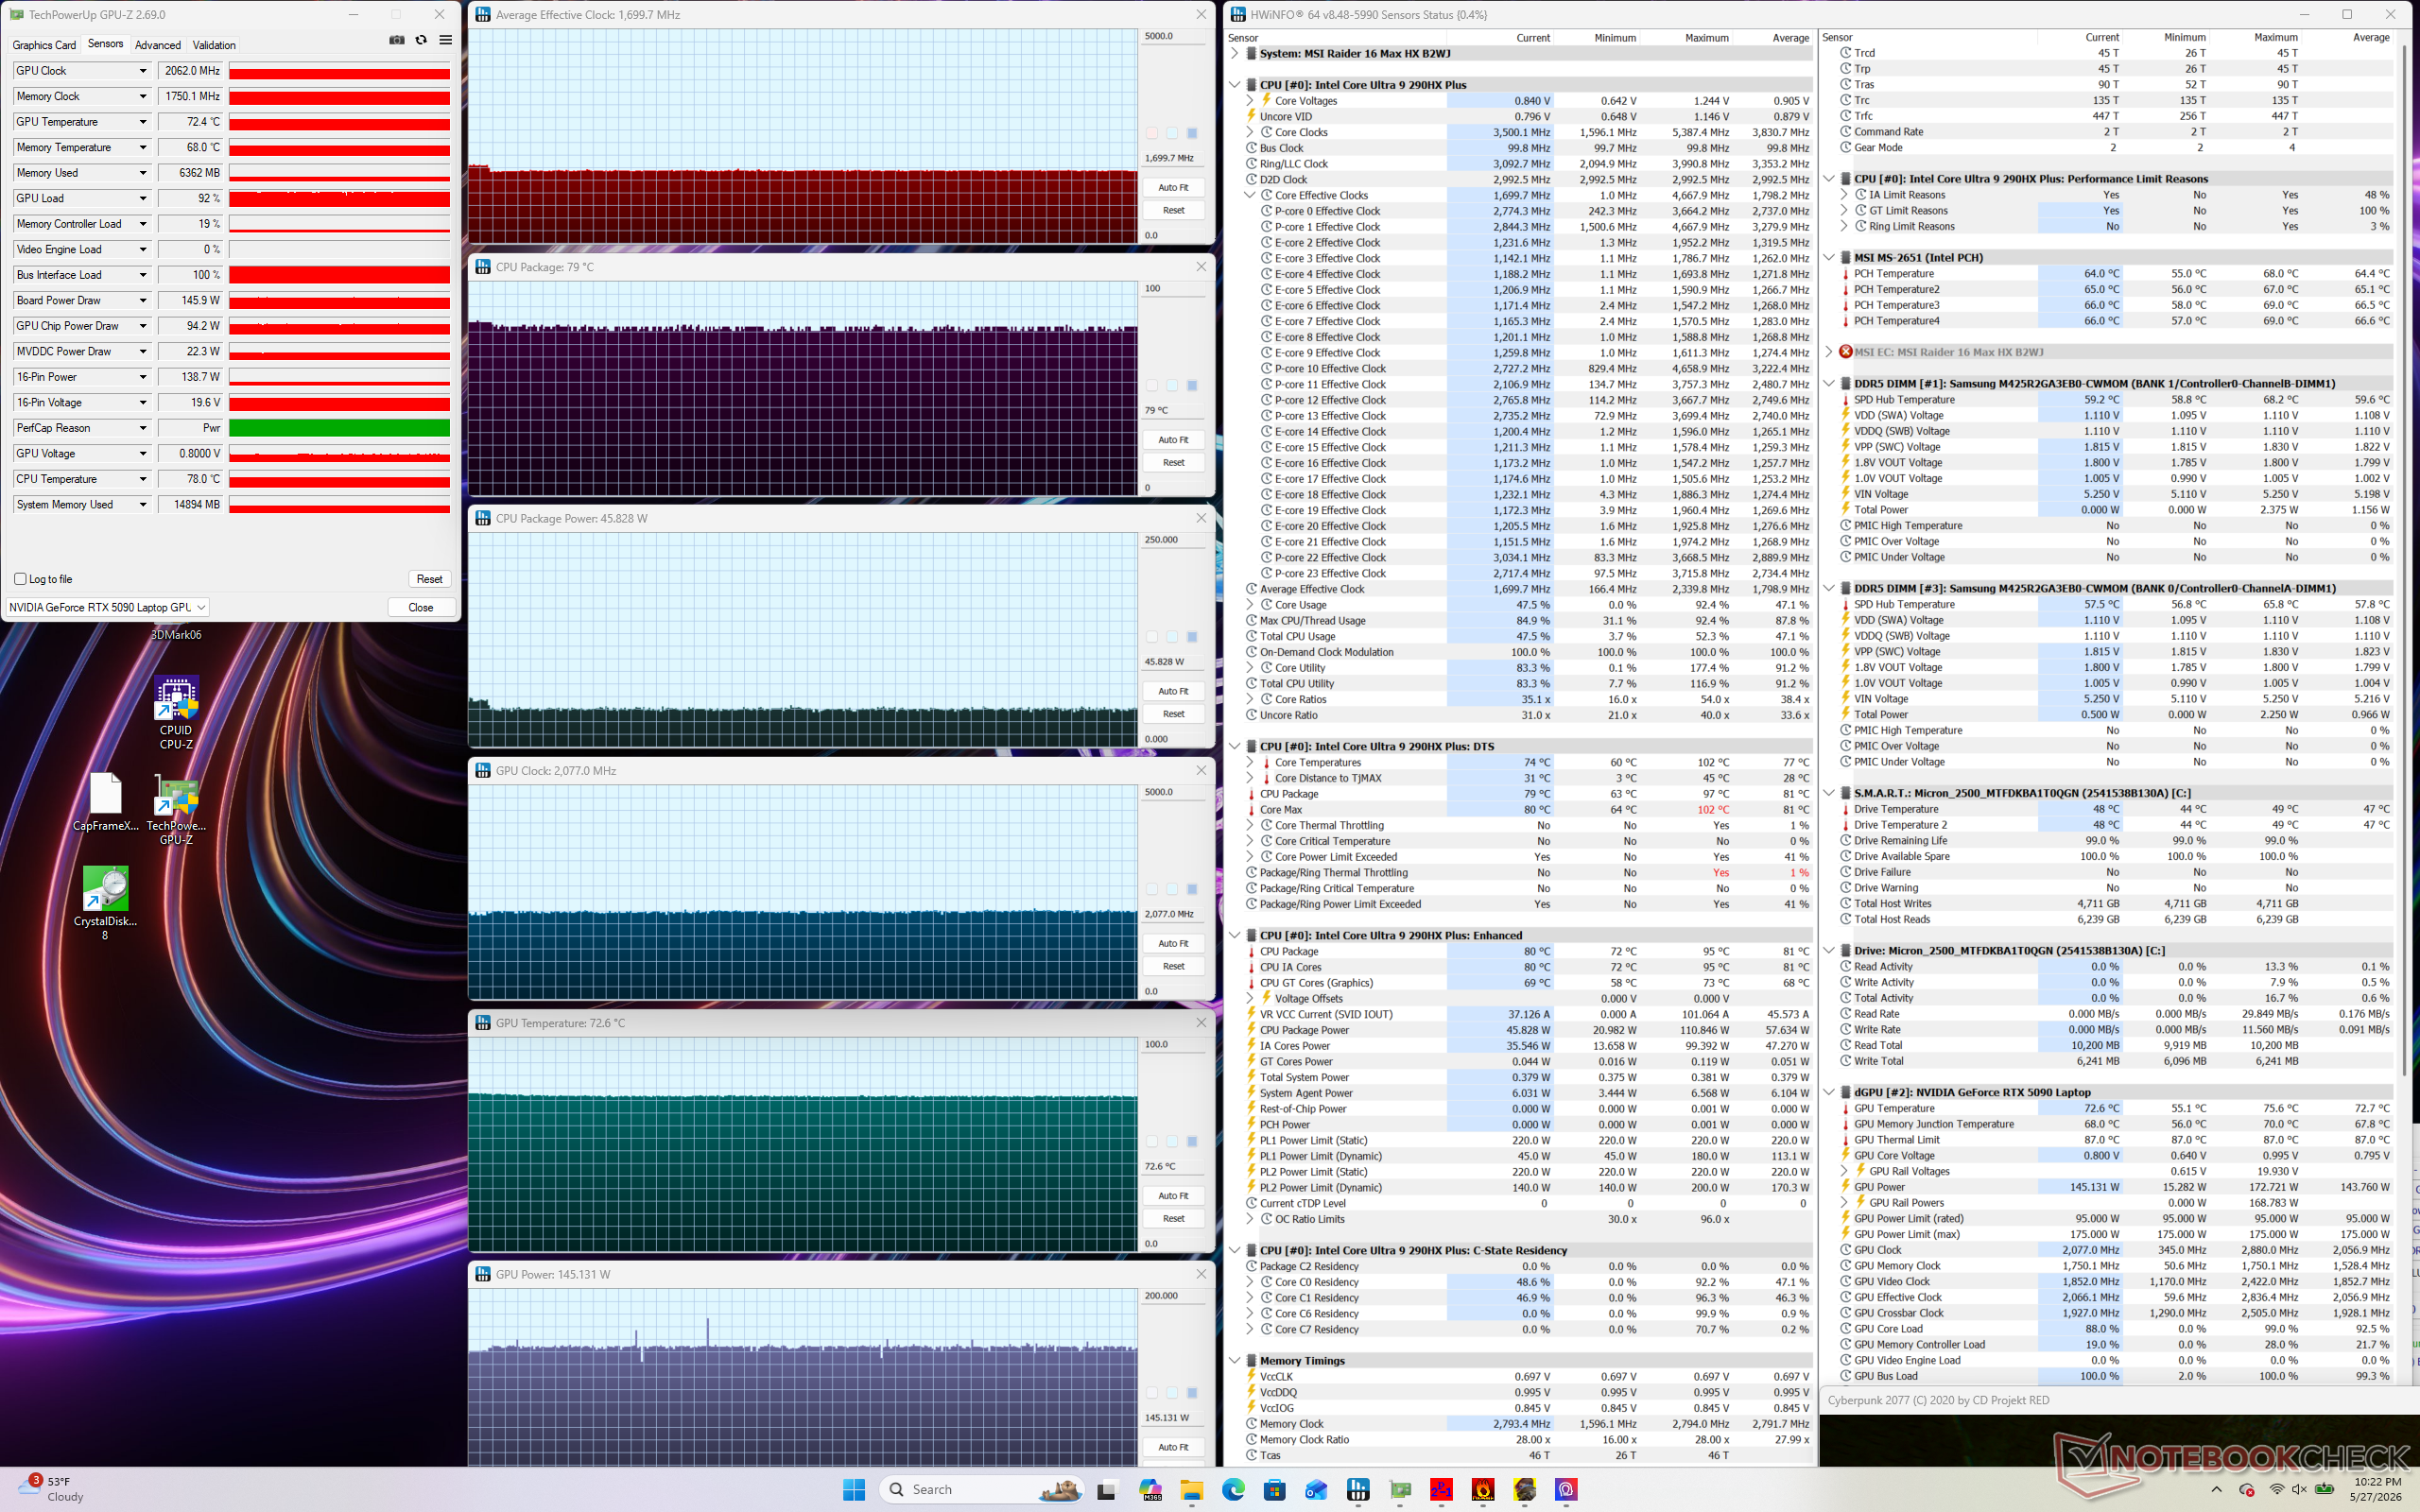
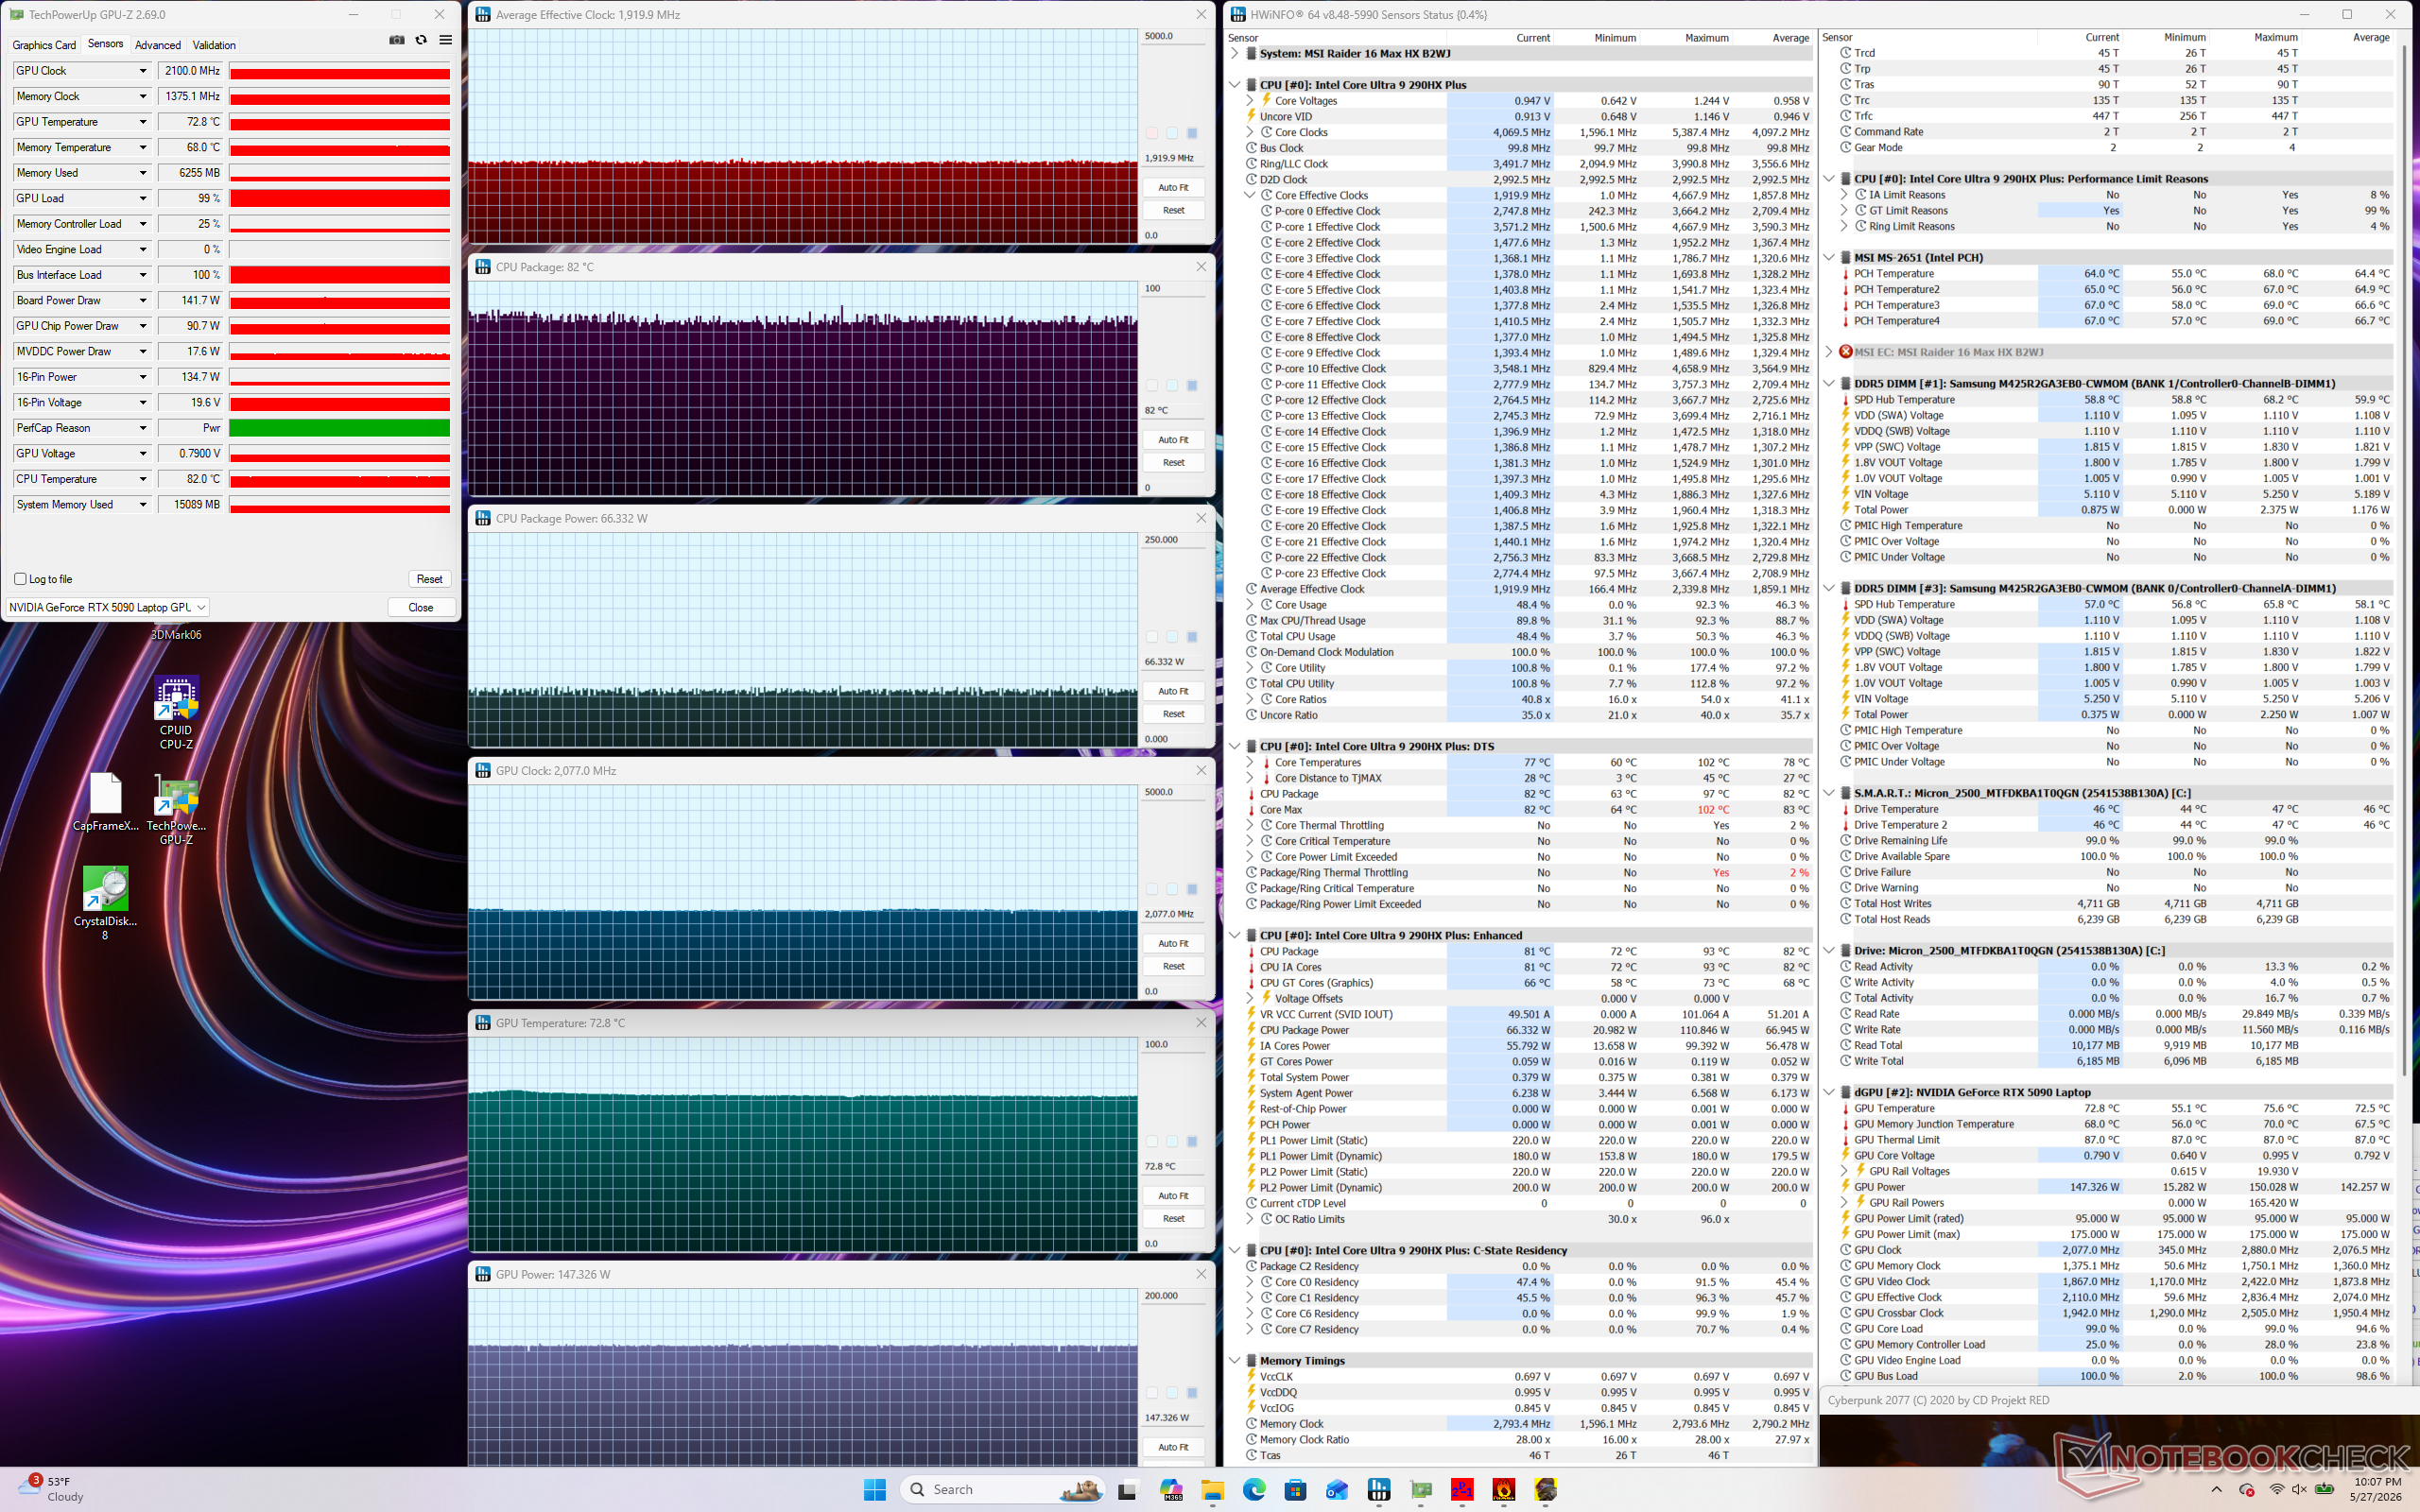

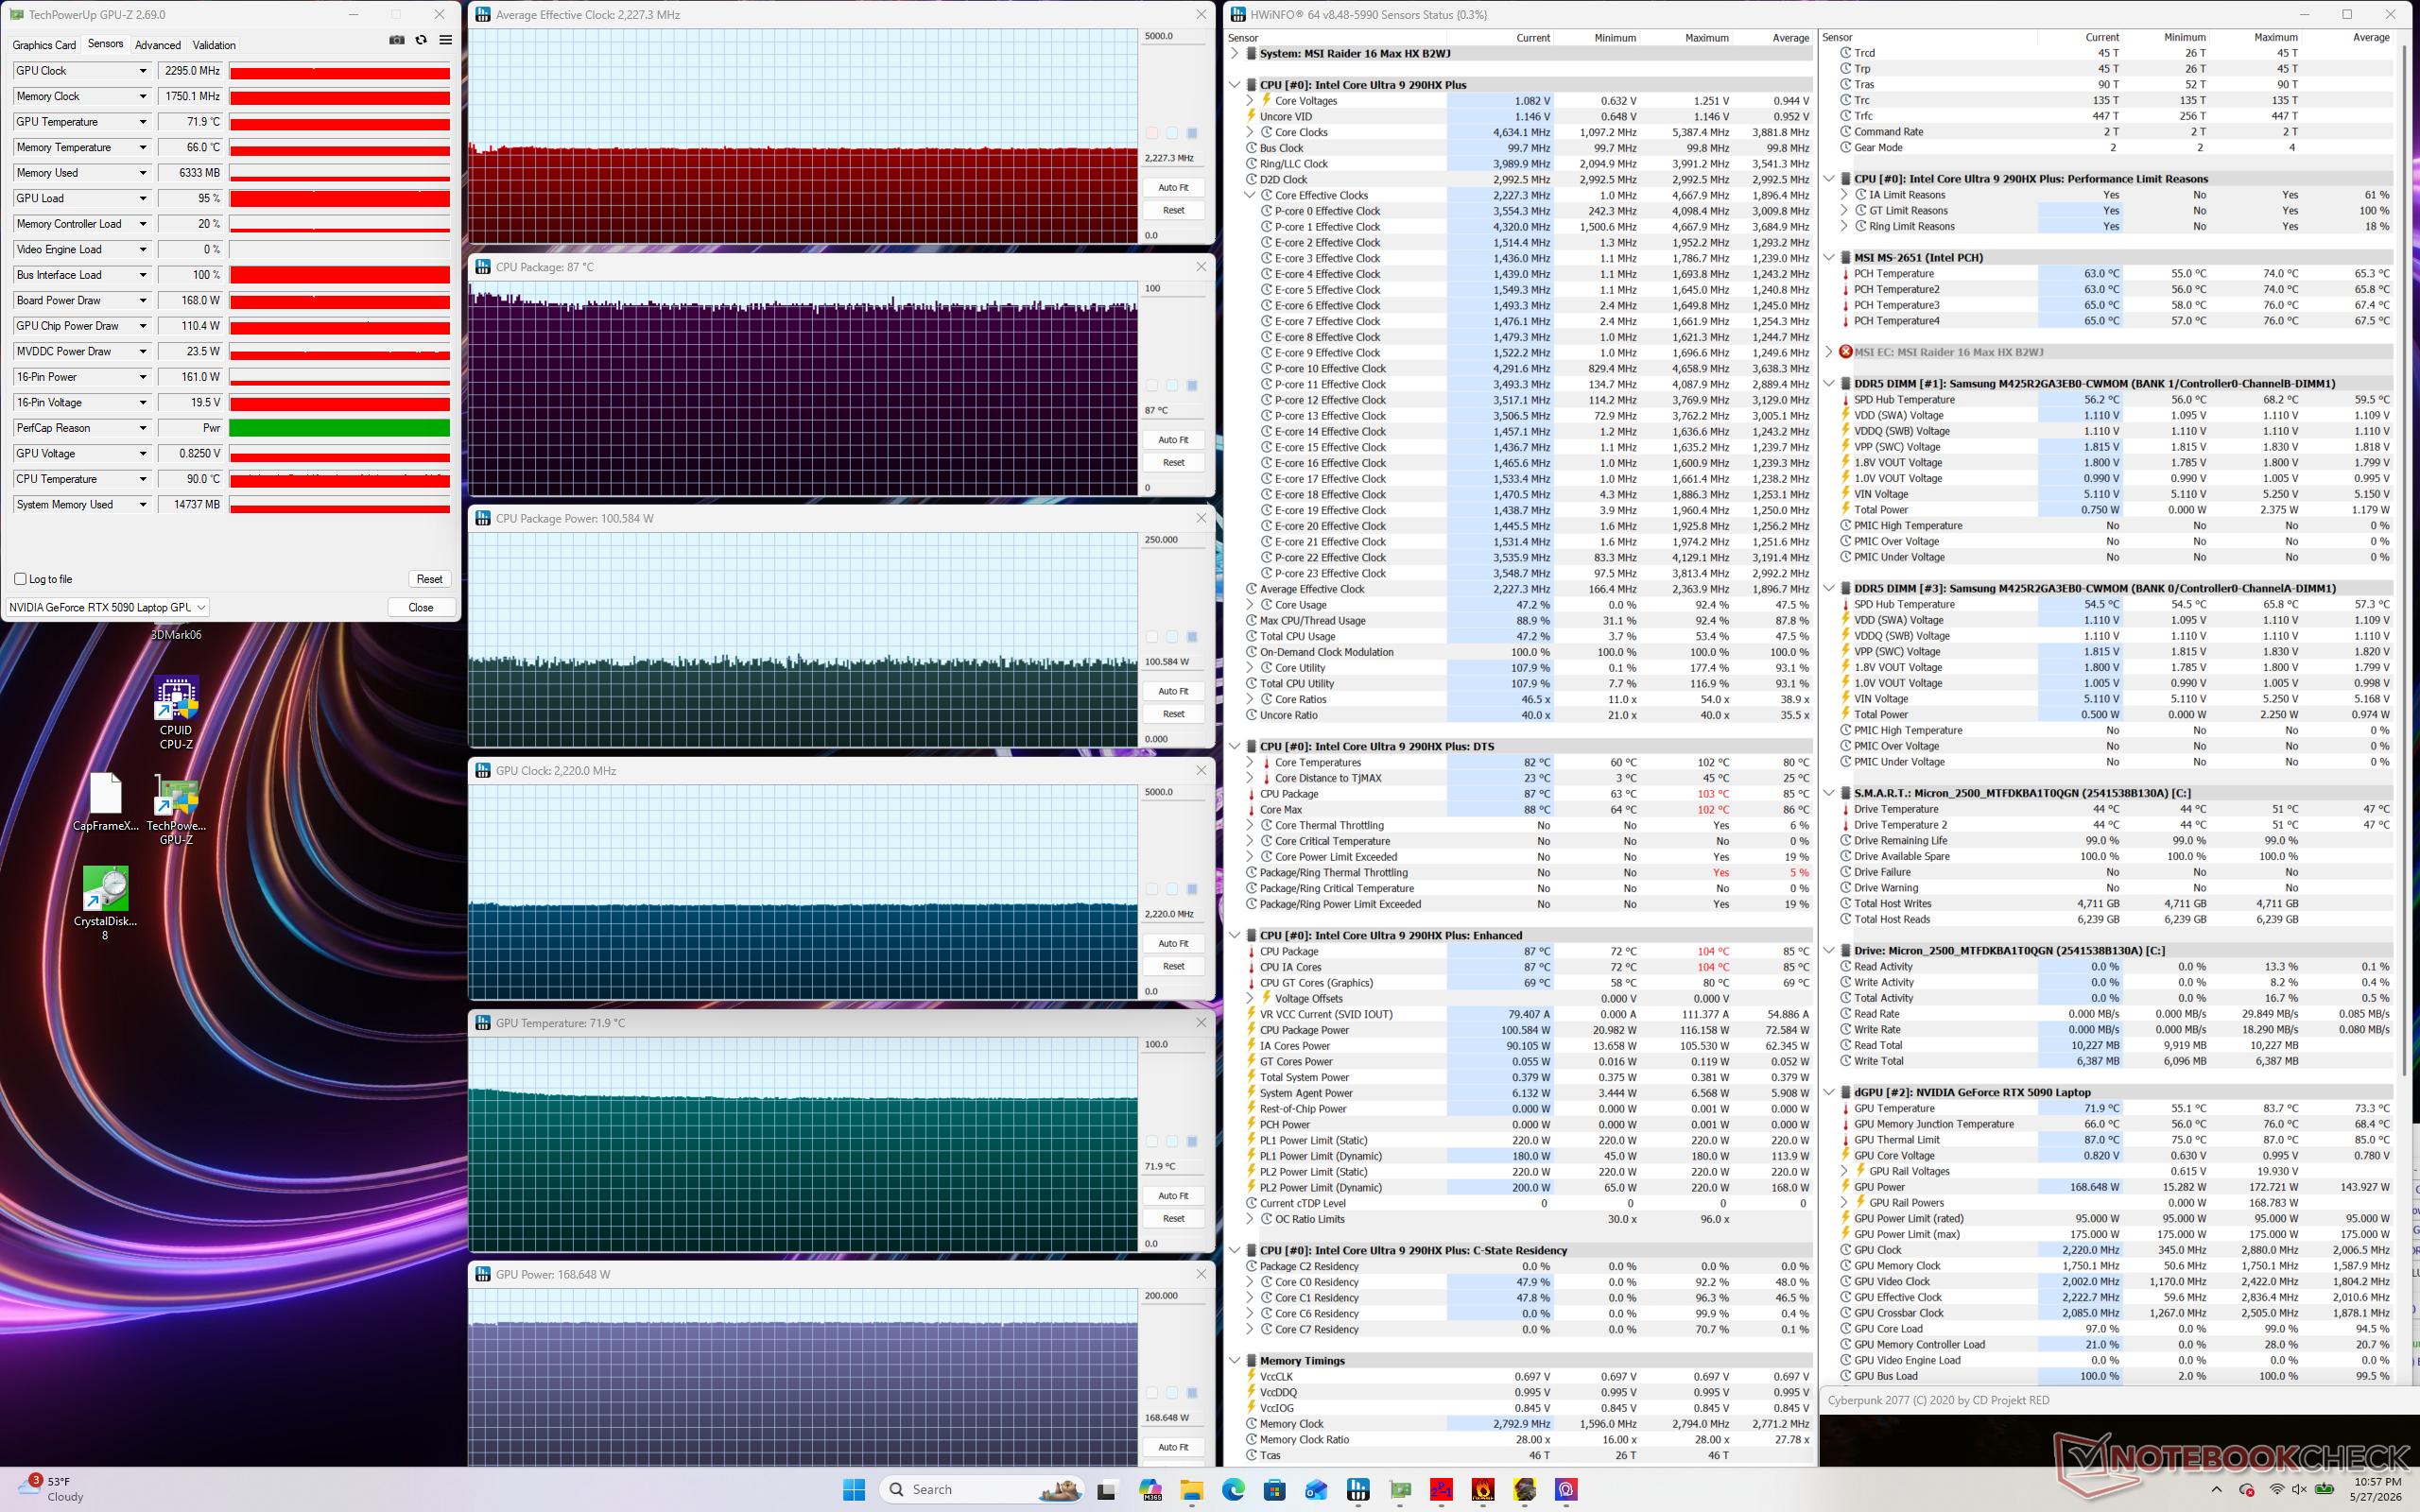
| Átlagos CPU órajel (GHz) | GPU órajel (MHz) | Átlagos CPU hőmérséklet (°C) | Átlagos GPU hőmérséklet (°C) | |
| Rendszer üresjárat | -- | -- | 47 | 39 |
| Prime95 Stressz | 3,9 | -- | 96 | 56 |
| Prime95 + FurMark Stressz | 2,7 - 3,9 | ~1600 | 96 | 75 |
| Cyberpunk 2077 Stressz (csendes mód) | 1.4 | 1440 | 81 | 73 |
| Cyberpunk 2077 Stressz (kiegyensúlyozott mód) | 1.7 | 2062 | 79 | 73 |
| Cyberpunk 2077 Stressz (Extrém teljesítmény mód) | 1.9 | 2100 | 82 | 73 |
| Cyberpunk 2077 Stressz (Apex mód) | 2.3 | 2175 | 96 | 76 |
| Cyberpunk 2077 Stress (Cooler Boost Mode) | 2.2 | 2295 | 87 | 72 |
Hangszórók
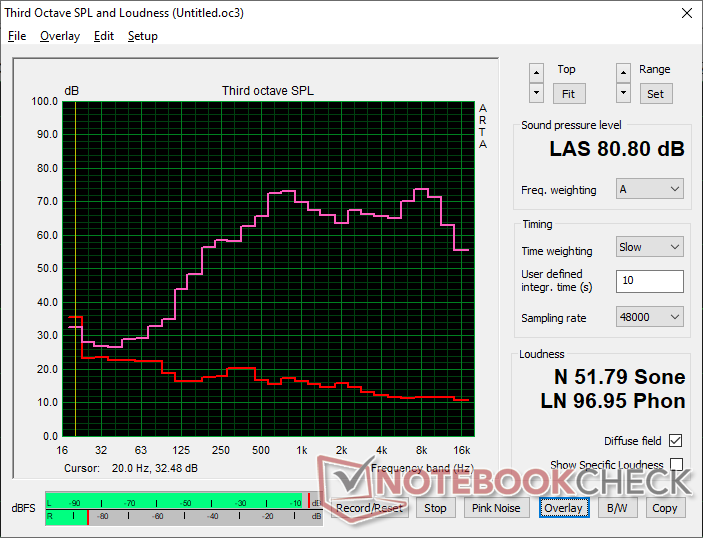
MSI Raider 16 Max HX B2WJ hangelemzés
(±) | a hangszóró hangereje átlagos, de jó (80.8 dB)
Basszus 100 - 315 Hz
(-) | szinte nincs basszus – átlagosan 15.7%-kal alacsonyabb a mediánnál
(±) | a basszus linearitása átlagos (8.6% delta az előző frekvenciához)
Közepes 400-2000 Hz
(+) | kiegyensúlyozott középpontok – csak 3.2% választja el a mediántól
(+) | a középpontok lineárisak (6.1% delta az előző frekvenciához)
Maximum 2-16 kHz
(+) | kiegyensúlyozott csúcsok – csak 2.9% választja el a mediántól
(+) | a csúcsok lineárisak (4.9% delta az előző frekvenciához képest)
Összességében 100 - 16.000 Hz
(+) | általános hangzás lineáris (14.5% eltérés a mediánhoz képest)
Ugyanazon osztályhoz képest
» 27%Ebben az osztályban az összes tesztelt eszköz %-a jobb volt, 7% hasonló, 66%-kal rosszabb
» A legjobb delta értéke 6%, az átlag 18%, a legrosszabb 132% volt
Az összes tesztelt eszközzel összehasonlítva
» 18% az összes tesztelt eszköz jobb volt, 4% hasonló, 77%-kal rosszabb
» A legjobb delta értéke 4%, az átlag 23%, a legrosszabb 134% volt
Apple MacBook Pro 16 2021 M1 Pro hangelemzés
(+) | a hangszórók viszonylag hangosan tudnak játszani (84.7 dB)
Basszus 100 - 315 Hz
(+) | jó basszus – csak 3.8% választja el a mediántól
(+) | a basszus lineáris (5.2% delta az előző frekvenciához)
Közepes 400-2000 Hz
(+) | kiegyensúlyozott középpontok – csak 1.3% választja el a mediántól
(+) | a középpontok lineárisak (2.1% delta az előző frekvenciához)
Maximum 2-16 kHz
(+) | kiegyensúlyozott csúcsok – csak 1.9% választja el a mediántól
(+) | a csúcsok lineárisak (2.7% delta az előző frekvenciához képest)
Összességében 100 - 16.000 Hz
(+) | általános hangzás lineáris (4.6% eltérés a mediánhoz képest)
Ugyanazon osztályhoz képest
» 0%Ebben az osztályban az összes tesztelt eszköz %-a jobb volt, 0% hasonló, 100%-kal rosszabb
» A legjobb delta értéke 5%, az átlag 17%, a legrosszabb 45% volt
Az összes tesztelt eszközzel összehasonlítva
» 0% az összes tesztelt eszköz jobb volt, 0% hasonló, 100%-kal rosszabb
» A legjobb delta értéke 4%, az átlag 23%, a legrosszabb 134% volt
Energiagazdálkodás
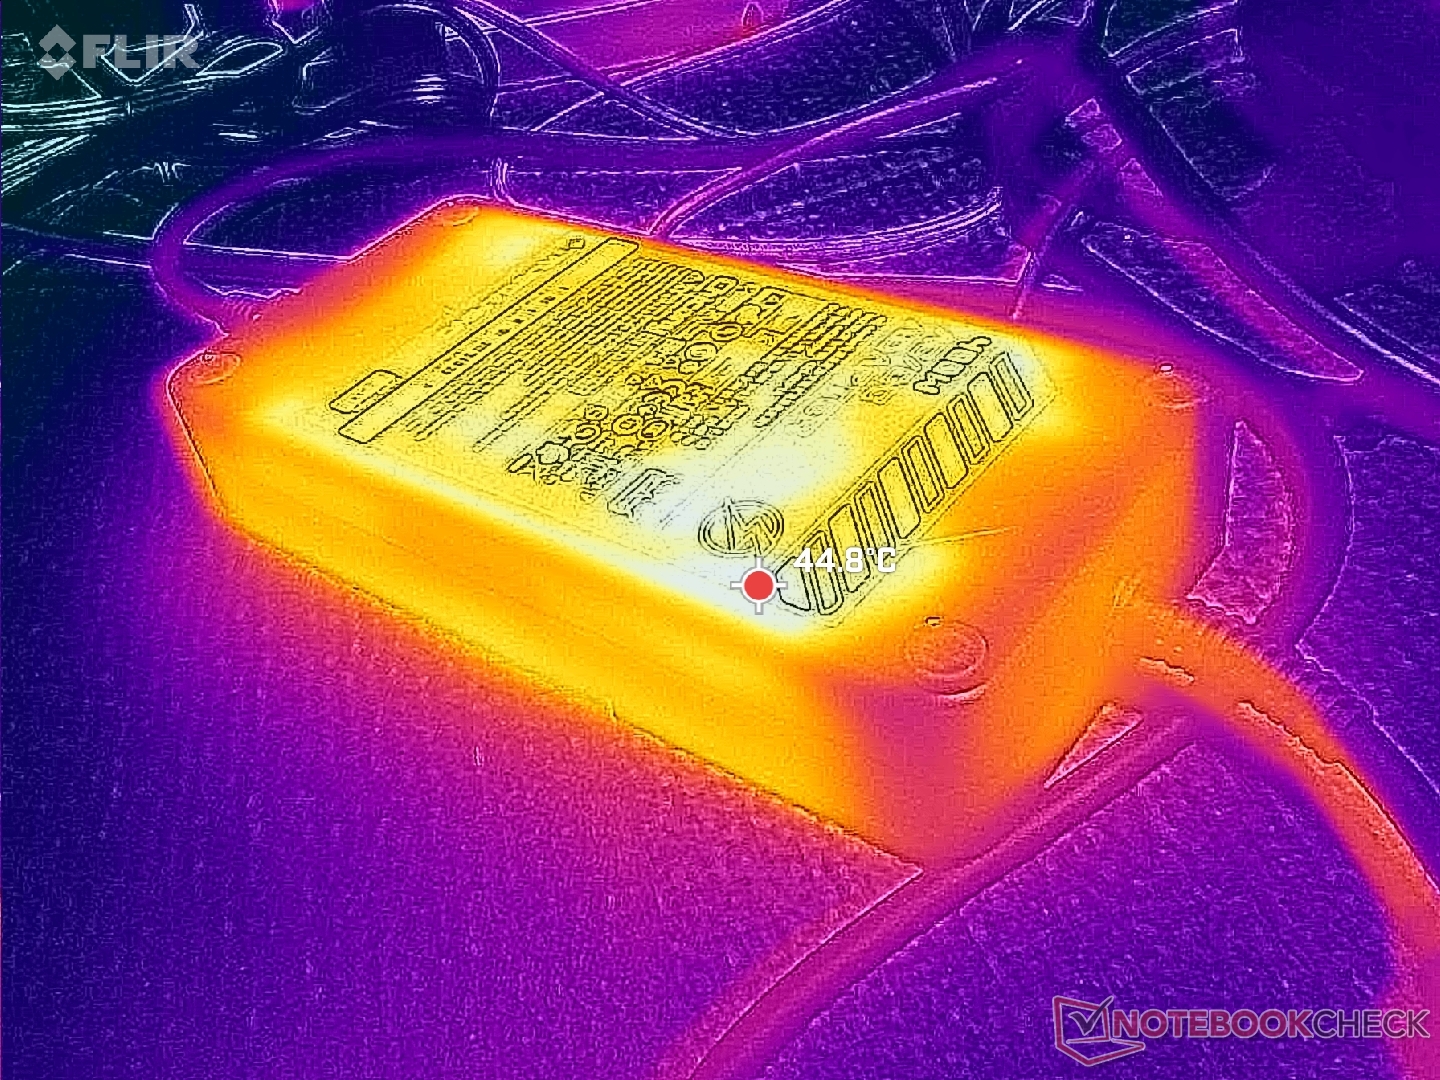
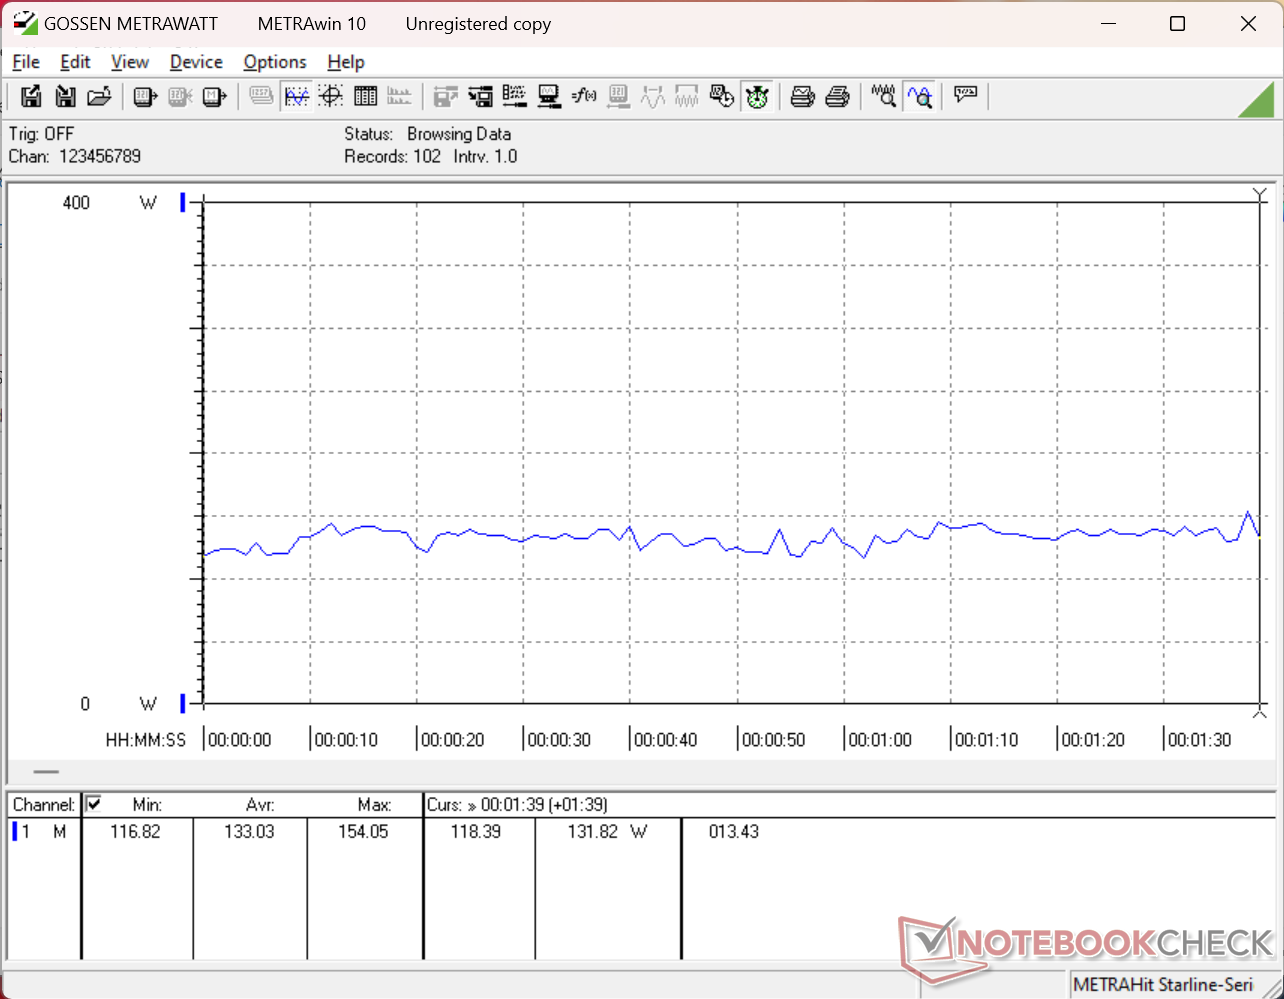
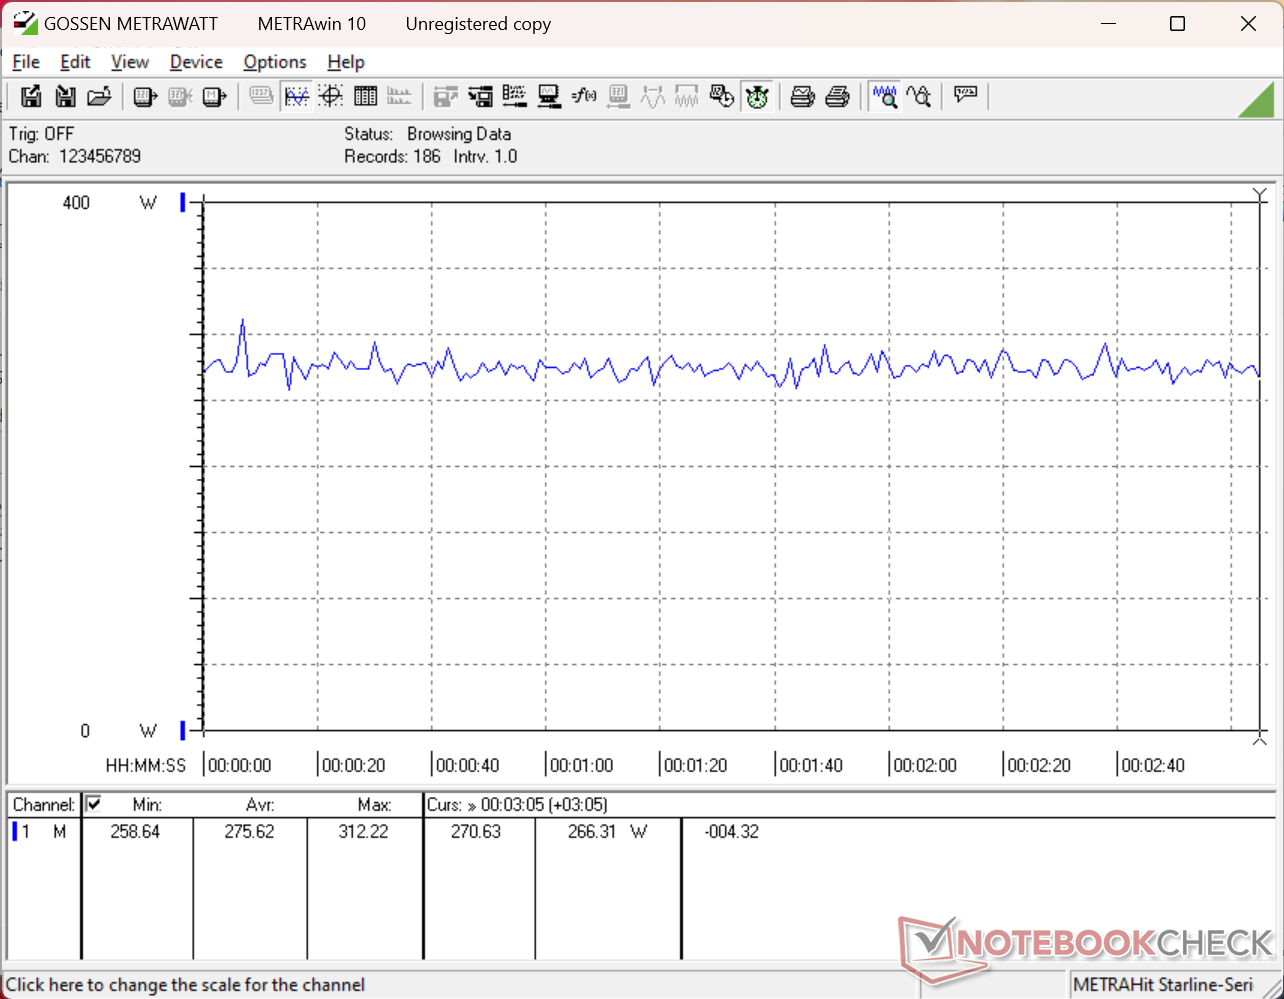
Energiafogyasztás
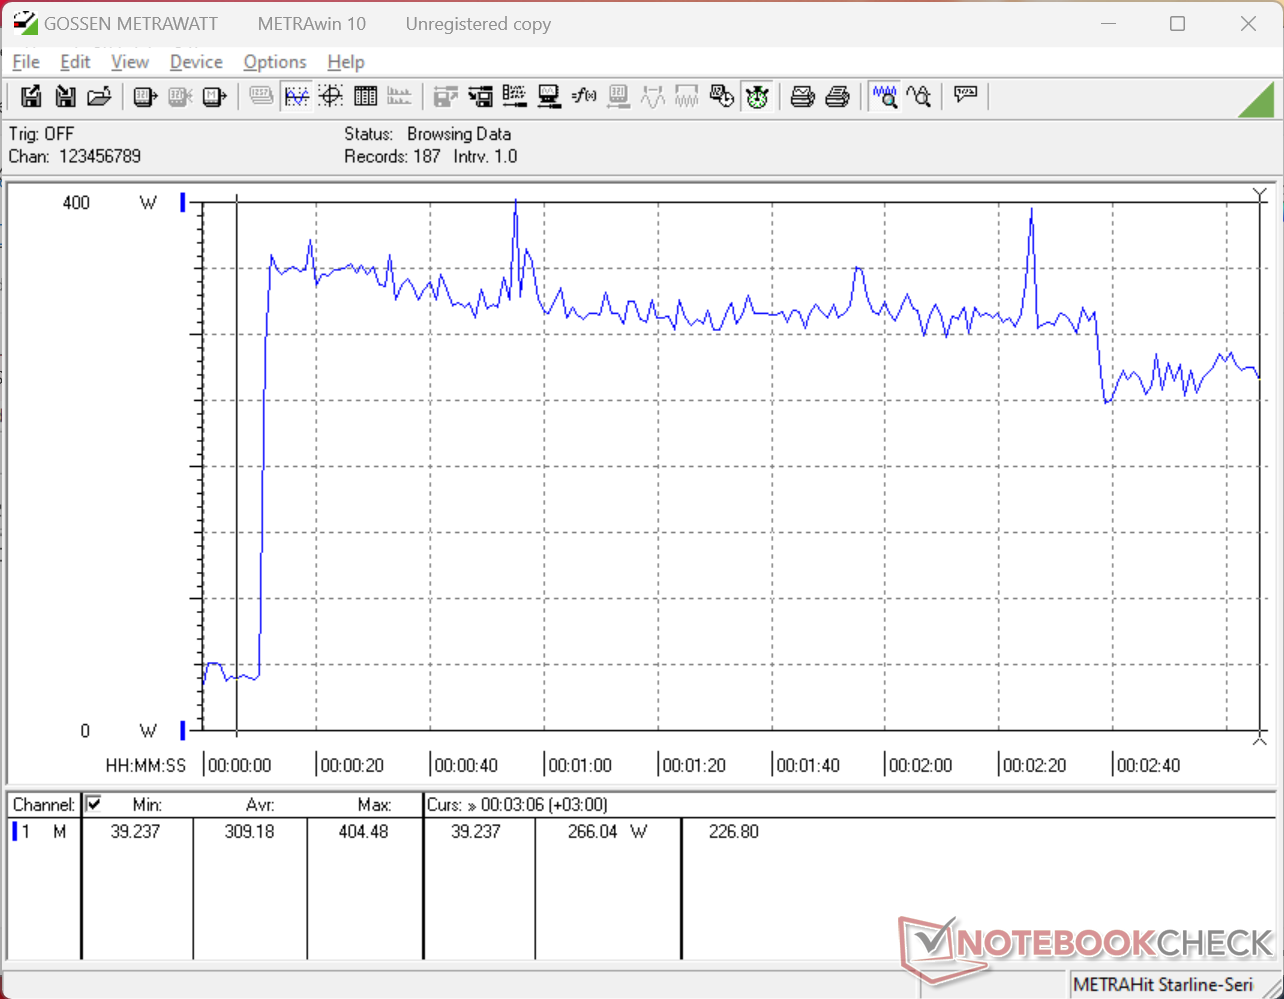
Az energiafogyasztás a hardverhez képest előre láthatóan nagyon magas. A Cyberpunk 2077 futtatása Extreme Performance módban nagyjából 28 százalékkal nagyobb igénybevételt jelent, mint a Razer Blade 16 annak ellenére, hogy az utóbbiban ugyanaz az RTX 5090 GPU dolgozik. A nagy eltérés az Arrow Lake-HX CPU-nak tudható be a lassabb, de jóval hatékonyabb Panther Lake-H szériával szemben.
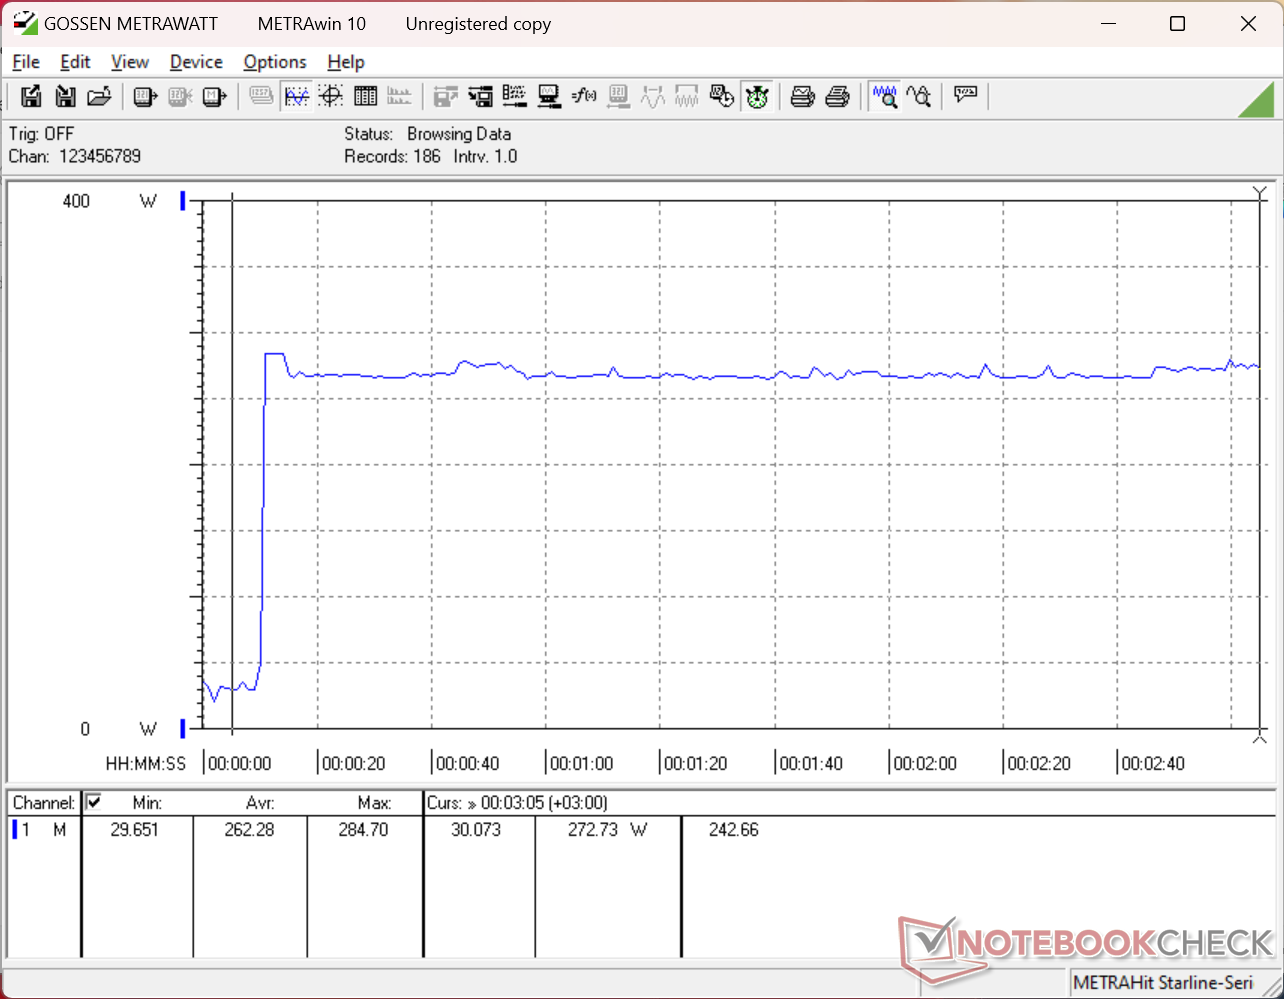
A nagyméretű (~18,8 x 8,8 x 3,4 cm) 400 W-os hálózati tápegységből történő használat során 405 W-os ideiglenes maximális fogyasztást tudunk rögzíteni.
| Kikapcsolt állapot / Készenlét | |
| Üresjárat | |
| Terhelés |
|
Kulcs:
min: | |
| MSI Raider 16 Max HX B2WJ Ultra 9 290HX Plus, GeForce RTX 5090 Laptop, Micron 2500 1TB MTFDKBA1T0QGN, OLED, 2560x1600, 16" | MSI Crosshair 16 HX AI D2XWGKG Ultra 9 275HX, GeForce RTX 5070 Laptop, Micron 2500 1TB MTFDKBA1T0QGN, IPS, 2560x1600, 16" | Razer Blade 16 Core Ultra 9 386H Ultra 9 386H, GeForce RTX 5090 Laptop, Lexar NM790 2TB, OLED, 2560x1600, 16" | Alienware 16X Aurora Core Ultra 9 290HX Plus Ultra 9 290HX Plus, GeForce RTX 5070 Ti Laptop, , OLED, 2560x1600, 16" | Asus TUF Gaming A16 FA608UP R7 260, GeForce RTX 5070 Laptop, Western Digital PC SN5000S SDEQNSJ-1T00, IPS, 2560x1600, 16" | Lenovo Legion 7 16IAX10 Ultra 7 255HX, GeForce RTX 5060 Laptop, WD PC SN7100S SDFPMSL-1T00-1101, OLED, 2560x1600, 16" | |
|---|---|---|---|---|---|---|
| Power Consumption | -53% | 8% | 19% | 38% | 13% | |
| Idle Minimum * (Watt) | 7.2 | 26.2 -264% | 4.4 39% | 6.9 4% | 4.6 36% | 9.4 -31% |
| Idle Average * (Watt) | 12 | 33.8 -182% | 22.3 -86% | 8.1 32% | 9.8 18% | 10.6 12% |
| Idle Maximum * (Watt) | 32.8 | 34 -4% | 30.4 7% | 31 5% | 10.2 69% | 36.4 -11% |
| Load Average * (Watt) | 133 | 112 16% | 110.7 17% | 131.6 1% | 76.1 43% | 107.7 19% |
| Cyberpunk 2077 ultra external monitor * (Watt) | 275 | 220 20% | 216 21% | 172.1 37% | 198.1 28% | 187.5 32% |
| Cyberpunk 2077 ultra * (Watt) | 276 | 224 19% | 216 22% | 198.3 28% | 198.9 28% | 188 32% |
| Load Maximum * (Watt) | 404.5 | 315 22% | 251.3 38% | 300.1 26% | 235.2 42% | 247 39% |
* ... a kisebb jobb
Energiafogyasztás Cyberpunk / Stressz teszt
Energiafogyasztás külső monitor
Az akkumulátor élettartama
Az üzemidő tisztességes, de rövidebb, mint sok előző generációs modellnél, részben az IPS-ről az OLED-re való áttérés miatt.
| MSI Raider 16 Max HX B2WJ Ultra 9 290HX Plus, GeForce RTX 5090 Laptop, 91.8 Wh | MSI Crosshair 16 HX AI D2XWGKG Ultra 9 275HX, GeForce RTX 5070 Laptop, 90 Wh | Razer Blade 16 Core Ultra 9 386H Ultra 9 386H, GeForce RTX 5090 Laptop, 90 Wh | Alienware 16X Aurora Core Ultra 9 290HX Plus Ultra 9 290HX Plus, GeForce RTX 5070 Ti Laptop, 96 Wh | Asus TUF Gaming A16 FA608UP R7 260, GeForce RTX 5070 Laptop, 90 Wh | Lenovo Legion 7 16IAX10 Ultra 7 255HX, GeForce RTX 5060 Laptop, 84 Wh | |
|---|---|---|---|---|---|---|
| Akkumulátor üzemidő | 41% | 48% | -6% | 65% | -41% | |
| WiFi v1.3 (h) | 7.9 | 11.1 41% | 11.7 48% | 7.4 -6% | 13 65% | 4.7 -41% |
| H.264 (h) | 14.2 |
Notebookcheck Értékelés
A Raider 16 Max HX nehezebb és nagyobb, mint sok más 16 hüvelykes gamer laptop, de ennek eredményeképpen nagyobb teljesítményt tud kipréselni a CPU-ból és a GPU-ból.
MSI Raider 16 Max HX B2WJ
- 06/09/2026 v8
Allen Ngo
 Total Sustainability Score:
 Potenciális versenytársak összehasonlításban
Kép | Modell / Review | Legjobb ár | Súly | Magasság | Kijelző |
|---|---|---|---|---|---|
1. 87.7%  | MSI Raider 16 Max HX B2WJ Intel Core Ultra 9 290HX Plus ⎘ NVIDIA GeForce RTX 5090 Laptop ⎘ 32 GB Memória, 1024 GB SSD | Amazon: List Price: 4200 USD | 2.7 kg | 28.9 mm | 16.00" 2560x1600 189 PPI OLED |
2. 81.9%  | MSI Crosshair 16 HX AI D2XWGKG Intel Core Ultra 9 275HX ⎘ NVIDIA GeForce RTX 5070 Laptop ⎘ 16 GB Memória, 1024 GB SSD | Amazon: List Price: 2500 EUR | 2.5 kg | 27.9 mm | 16.00" 2560x1600 189 PPI IPS |
3. 87.7%  | Razer Blade 16 Core Ultra 9 386H Intel Core Ultra 9 386H ⎘ NVIDIA GeForce RTX 5090 Laptop ⎘ 32 GB Memória, 2048 GB SSD | Amazon: 1. $3,499.99 Razer Blade 16 (2026) Gaming... 2. $4,899.99 Razer Blade 16 (2026) Gaming... 3. $4,699.99 Razer Blade 16 (2026) Gaming... List Price: 4900 USD | 2.1 kg | 17.4 mm | 16.00" 2560x1600 189 PPI OLED |
4. 85.9%  | Alienware 16X Aurora Core Ultra 9 290HX Plus Intel Core Ultra 9 290HX Plus ⎘ NVIDIA GeForce RTX 5070 Ti Laptop ⎘ 32 GB Memória | Amazon: List Price: 3000 USD | 2.6 kg | 23.4 mm | 16.00" 2560x1600 189 PPI OLED |
5. 83.8%  | Asus TUF Gaming A16 FA608UP AMD Ryzen 7 260 ⎘ NVIDIA GeForce RTX 5070 Laptop ⎘ 32 GB Memória, 1024 GB SSD | Amazon: List Price: 2199€ | 2.2 kg | 25.7 mm | 16.00" 2560x1600 189 PPI IPS |
6. 86.6%  | Lenovo Legion 7 16IAX10 Intel Core Ultra 7 255HX ⎘ NVIDIA GeForce RTX 5060 Laptop ⎘ 32 GB Memória, 1024 GB SSD | Amazon: List Price: 1650 USD | 2 kg | 17.9 mm | 16.00" 2560x1600 189 PPI OLED |
Átláthatóság
A felülvizsgálandó készülékek kiválasztását szerkesztőségünk végzi. A tesztmintát a gyártó vagy a kiskereskedő kölcsönként bocsátotta a szerző rendelkezésére a felülvizsgálat céljából. A hitelezőnek nem volt befolyása erre a felülvizsgálatra, és a gyártó sem kapott másolatot erről a felülvizsgálatról a közzététel előtt. Nem volt kötelesség ezt az ismertetőt közzétenni. Független médiavállalatként a Notebookcheck nincs alávetve a gyártók, kiskereskedők vagy kiadók felhatalmazásának.
Így tesztel a Notebookcheck
A Notebookcheck minden évben független, laptopok és okostelefonok százait vizsgálja meg szabványosított eljárások alkalmazásával annak érdekében, hogy minden eredmény összehasonlítható legyen. Körülbelül 20 éve folyamatosan fejlesztjük vizsgálati módszereinket, és ennek során iparági szabványokat állítottunk fel. Tesztlaboratóriumainkban kiváló minőségű mérőberendezéseket használnak tapasztalt technikusok és szerkesztők. Ezek a tesztek többlépcsős validációs folyamatot foglalnak magukban. Komplex minősítési rendszerünk több száz megalapozott mérésen és benchmarkon alapul, ami megőrzi az objektivitást.
