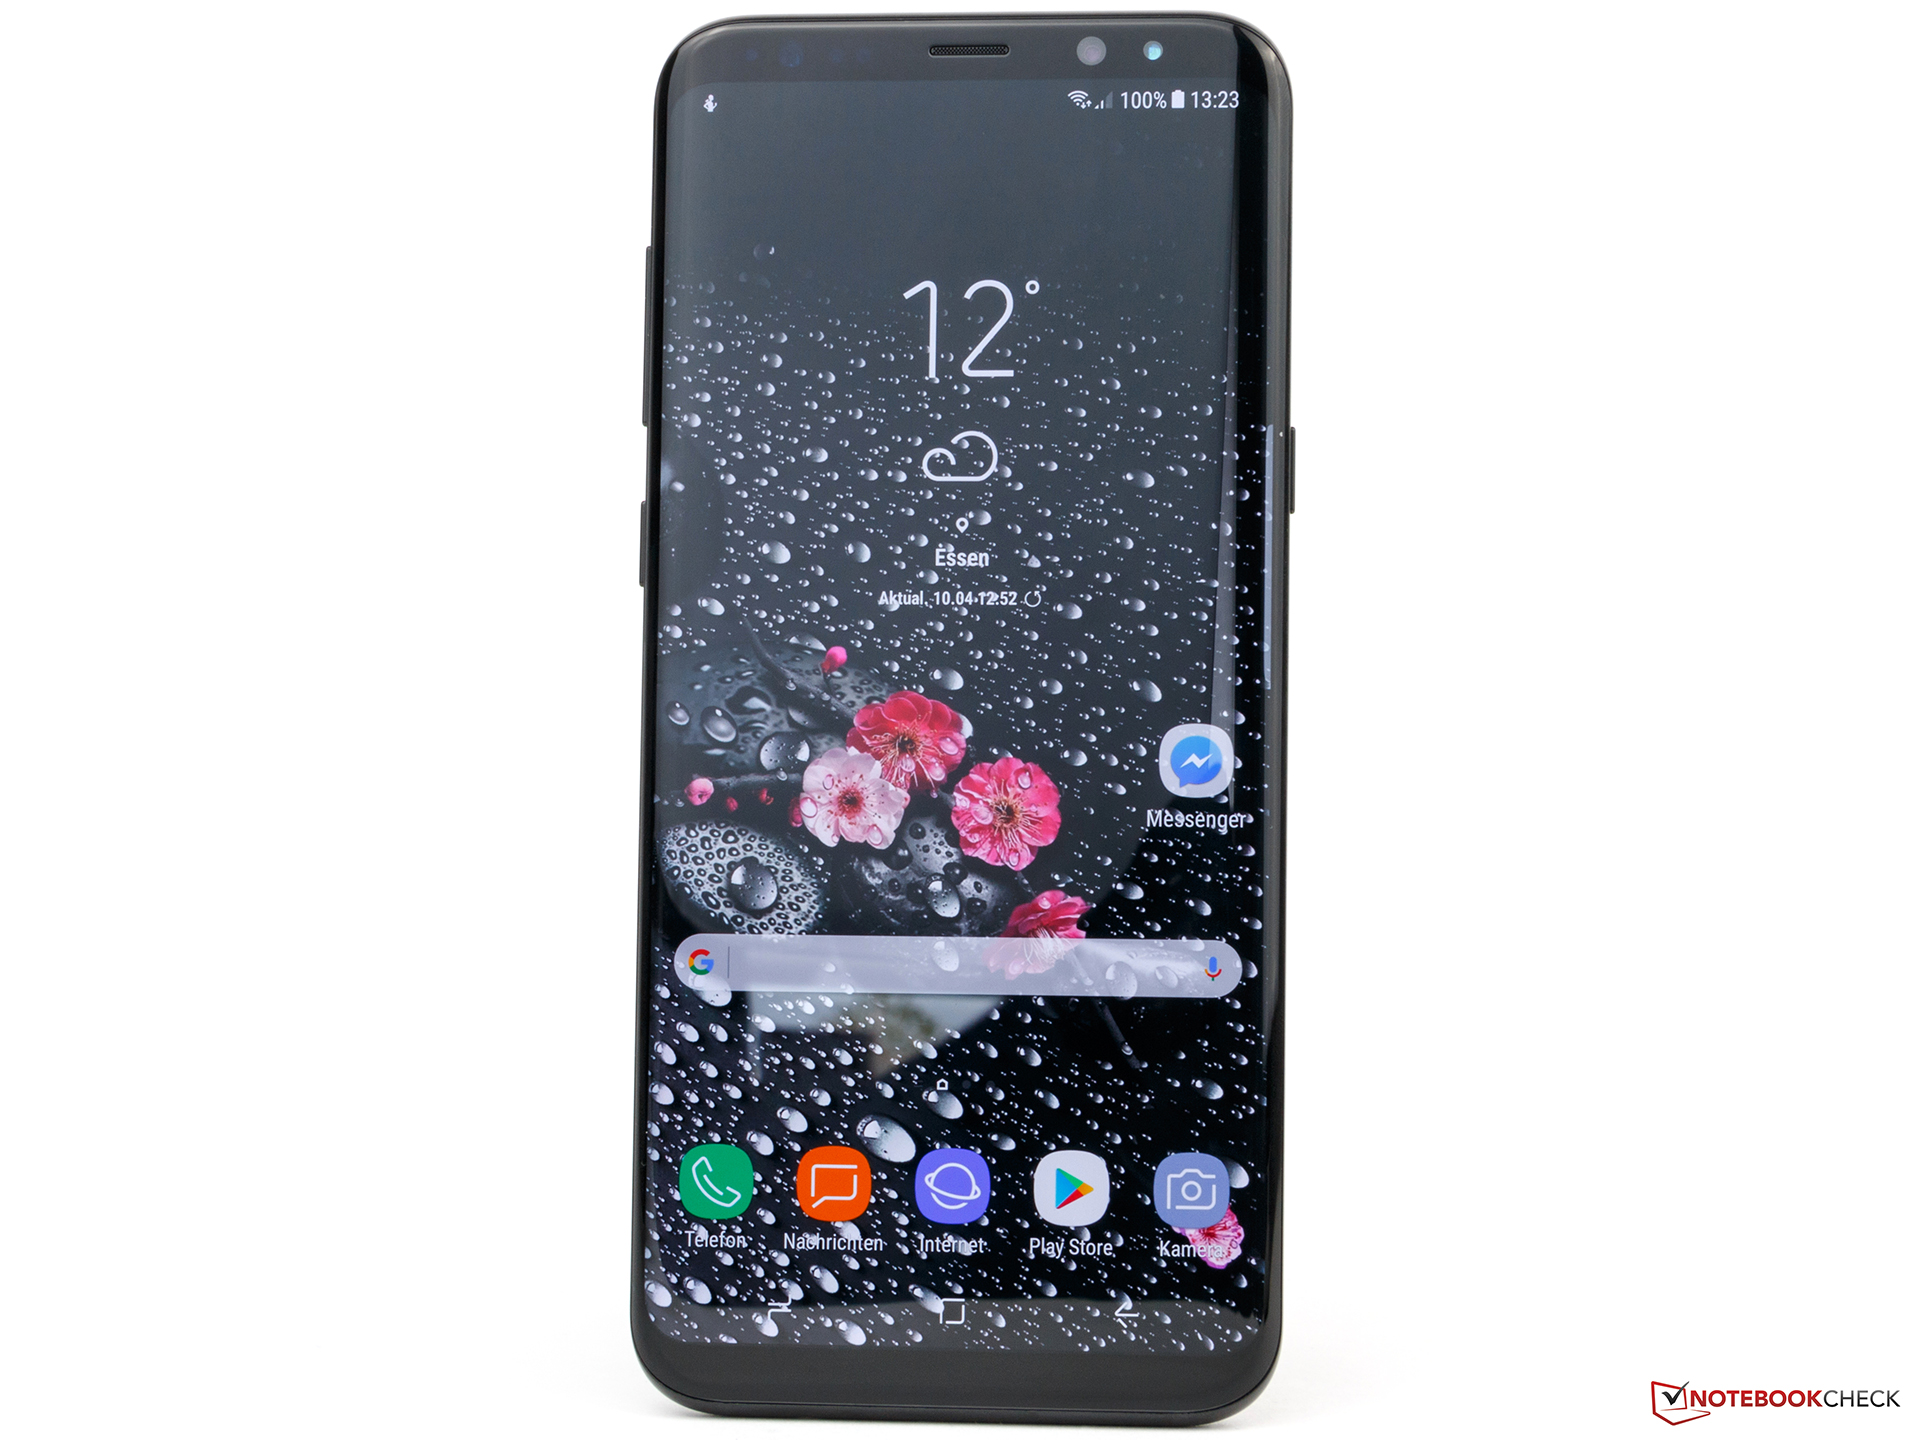
Samsung Galaxy S8+ (Plus, SM-G955F) Smartphone rövid értékelés
| Networking | |
| iperf3 transmit AX12 | |
| Samsung Galaxy S8 Plus | |
| Apple iPhone 7 (Klaus I211) | |
| Google Pixel XL 2016 | |
| Samsung Galaxy S7 Edge | |
| LG G6 | |
| Huawei Mate 9 | |
| iperf3 receive AX12 | |
| Apple iPhone 7 (Klaus I211) | |
| Google Pixel XL 2016 | |
| Samsung Galaxy S8 Plus | |
| LG G6 | |
| Samsung Galaxy S7 Edge | |
| Huawei Mate 9 | |


| |||||||||||||||||||||||||
Fényerő megoszlás: 93 %
Centrumban: 560 cd/m²
Kontraszt: ∞:1 (Fekete: 0 cd/m²)
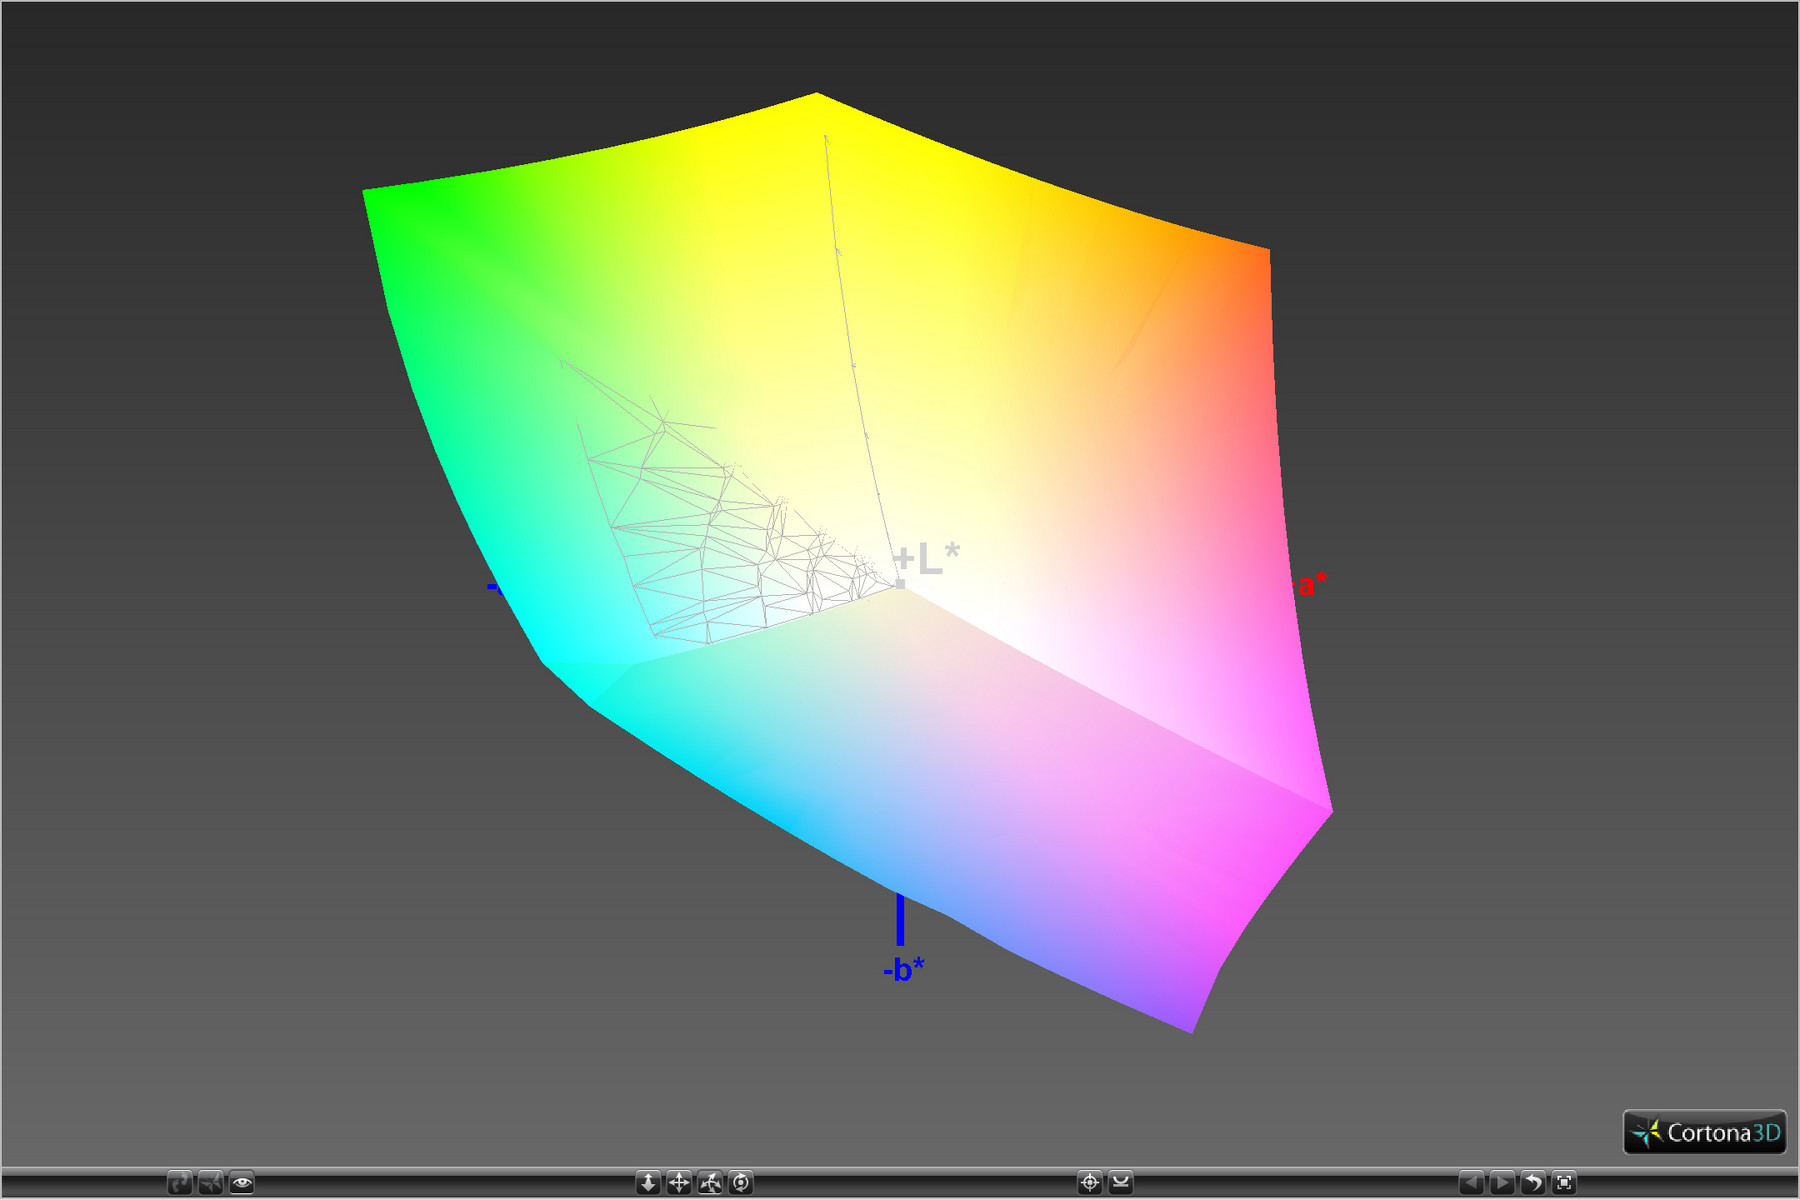
ΔE ColorChecker Calman: 1.7 | ∀{0.5-29.43 Ø4.71}
ΔE Greyscale Calman: 1.6 | ∀{0.09-98 Ø4.96}
99.87% sRGB (Argyll 1.6.3 3D)
81.57% AdobeRGB 1998 (Argyll 1.6.3 3D)
92.3% AdobeRGB 1998 (Argyll 3D)
99.3% sRGB (Argyll 3D)
83.2% Display P3 (Argyll 3D)
Gamma: 2.13
CCT: 6435 K
| Samsung Galaxy S8 Plus Super AMOLED, 2960x1440, 6.2" | Samsung Galaxy S7 Edge Super AMOLED, 2560x1440, 5.5" | Huawei Mate 9 IPS, 1920x1080, 5.9" | Apple iPhone 7 Plus IPS, 1920x1080, 5.5" | Google Pixel XL 2016 AMOLED, 2560x1440, 5.5" | Lenovo Moto Z AMOLED, 2560x1440, 5.5" | HTC U Ultra SLCD 5, 2560x1440, 5.7" | |
|---|---|---|---|---|---|---|---|
| Screen | 1% | -81% | 3% | -83% | -21% | -149% | |
| Brightness middle (cd/m²) | 560 | 554 -1% | 696 24% | 557 -1% | 402 -28% | 485 -13% | 470 -16% |
| Brightness (cd/m²) | 562 | 552 -2% | 680 21% | 553 -2% | 408 -27% | 490 -13% | 445 -21% |
| Brightness Distribution (%) | 93 | 96 3% | 93 0% | 97 4% | 85 -9% | 92 -1% | 88 -5% |
| Black Level * (cd/m²) | 0.42 | 0.35 | 0.22 | ||||
| Colorchecker dE 2000 * | 1.7 | 1.59 6% | 4.3 -153% | 1.4 18% | 4 -135% | 2.1 -24% | 5.5 -224% |
| Colorchecker dE 2000 max. * | 3.4 | 2.56 25% | 9.4 -176% | 3.1 9% | 10.1 -197% | 5.5 -62% | 11.9 -250% |
| Greyscale dE 2000 * | 1.6 | 2.01 -26% | 4.8 -200% | 1.3 19% | 3.2 -100% | 2.6 -63% | 7.6 -375% |
| Gamma | 2.13 103% | 2.01 109% | 2.33 94% | 2.21 100% | 2.19 100% | 2.23 99% | 2.2 100% |
| CCT | 6435 101% | 6321 103% | 7255 90% | 6667 97% | 7037 92% | 6843 95% | 7454 87% |
| Color Space (Percent of AdobeRGB 1998) (%) | 81.57 | 82.12 1% | 63.1 -23% | 88.14 8% | |||
| Color Space (Percent of sRGB) (%) | 99.87 | 99.98 0% | 99.83 0% | 100 0% | |||
| Contrast (:1) | 1657 | 1591 | 2136 |
* ... a kisebb jobb
Képernyő villogása / PWM (impulzusszélesség-moduláció)
| Képernyő villogása / PWM észlelve | 250 Hz | 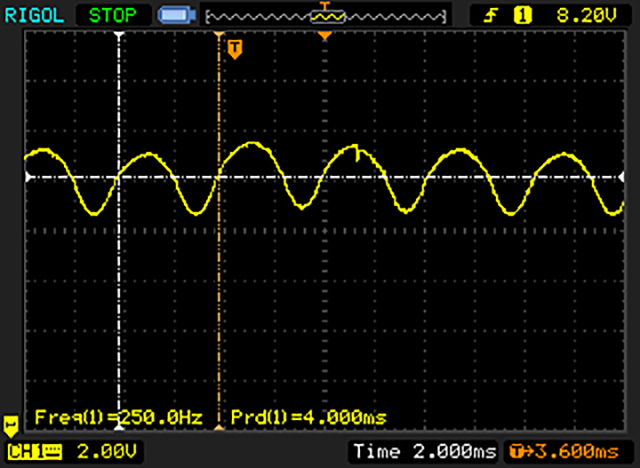 | |
A kijelző háttérvilágítása 250 Hz-en villog (a legrosszabb esetben, pl. PWM használatával) . A 250 Hz frekvenciája viszonylag alacsony, így az érzékeny felhasználók valószínűleg villogást észlelnek, és megerőltetik a szemüket a megadott és az alatti fényerő-beállítás mellett. Összehasonlításképpen: az összes tesztelt eszköz 52 %-a nem használja a PWM-et a kijelző elsötétítésére. Ha PWM-et észleltek, akkor átlagosan 7741 (minimum: 5 - maximum: 343500) Hz-t mértek. | |||

Megjelenítési válaszidők
| ↔ Válaszidő Fekete-fehér | ||
|---|---|---|
| 3.2 ms ... emelkedés és süllyedés ↘ kombinálva | ↗ 2 ms emelkedés | 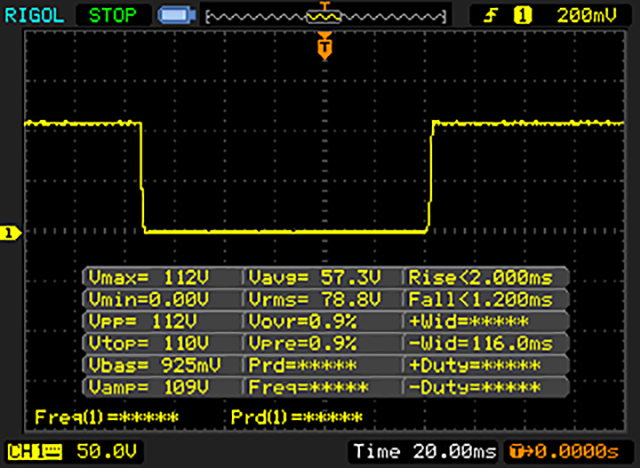 |
| ↘ 1.2 ms ősz | ||
| A képernyő tesztjeinkben nagyon gyors reakciósebességet mutatott, és nagyon jól használható gyors tempójú játékokhoz. Összehasonlításképpen, az összes tesztelt eszköz 0.1 (minimum) és 240 (maximum) ms között mozog. » 15 % of all devices are better. Ez azt jelenti, hogy a mért válaszidő jobb, mint az összes vizsgált eszköz átlaga (19.8 ms). | ||
| ↔ Válaszidő 50% szürke és 80% szürke között | ||
| 5.6 ms ... emelkedés és süllyedés ↘ kombinálva | ↗ 2.8 ms emelkedés | 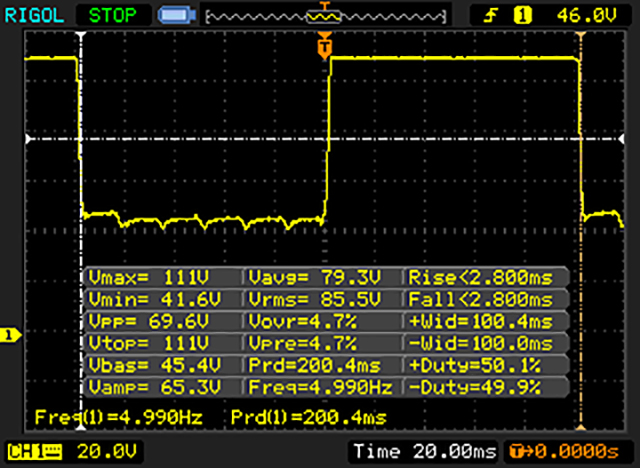 |
| ↘ 2.8 ms ősz | ||
| A képernyő tesztjeinkben nagyon gyors reakciósebességet mutatott, és nagyon jól használható gyors tempójú játékokhoz. Összehasonlításképpen, az összes tesztelt eszköz 0.165 (minimum) és 636 (maximum) ms között mozog. » 18 % of all devices are better. Ez azt jelenti, hogy a mért válaszidő jobb, mint az összes vizsgált eszköz átlaga (30.9 ms). | ||
| AnTuTu v6 - Total Score (érték szerinti rendezés) | |
| Samsung Galaxy S8 Plus | |
| Samsung Galaxy S7 Edge | |
| Sony Xperia XZ | |
| HTC U Ultra | |
| LG G6 | |
| Google Pixel XL 2016 | |
| Lenovo Moto Z | |
| Huawei Mate 9 | |
| Apple iPhone 7 Plus | |
| Geekbench 4.4 | |
| 64 Bit Single-Core Score (érték szerinti rendezés) | |
| Samsung Galaxy S8 Plus | |
| LG G6 | |
| Huawei Mate 9 | |
| 64 Bit Multi-Core Score (érték szerinti rendezés) | |
| Samsung Galaxy S8 Plus | |
| LG G6 | |
| Huawei Mate 9 | |
| Basemark ES 3.1 / Metal - offscreen Overall Score (érték szerinti rendezés) | |
| Samsung Galaxy S8 Plus | |
| Samsung Galaxy S7 Edge | |
| LG G6 | |
| Google Pixel XL 2016 | |
| Lenovo Moto Z | |
| Huawei Mate 9 | |
| Apple iPhone 7 Plus | |
| GFXBench 3.0 | |
| on screen Manhattan Onscreen OGL (érték szerinti rendezés) | |
| Samsung Galaxy S8 Plus | |
| Samsung Galaxy S7 Edge | |
| Sony Xperia XZ | |
| HTC U Ultra | |
| LG G6 | |
| Google Pixel XL 2016 | |
| Lenovo Moto Z | |
| Huawei Mate 9 | |
| Apple iPhone 7 Plus | |
| 1920x1080 1080p Manhattan Offscreen (érték szerinti rendezés) | |
| Samsung Galaxy S8 Plus | |
| Samsung Galaxy S7 Edge | |
| Sony Xperia XZ | |
| HTC U Ultra | |
| LG G6 | |
| Google Pixel XL 2016 | |
| Lenovo Moto Z | |
| Huawei Mate 9 | |
| Apple iPhone 7 Plus | |
| GFXBench 3.1 | |
| on screen Manhattan ES 3.1 Onscreen (érték szerinti rendezés) | |
| Samsung Galaxy S8 Plus | |
| Samsung Galaxy S7 Edge | |
| Sony Xperia XZ | |
| HTC U Ultra | |
| LG G6 | |
| Google Pixel XL 2016 | |
| Lenovo Moto Z | |
| Huawei Mate 9 | |
| Apple iPhone 7 Plus | |
| 1920x1080 Manhattan ES 3.1 Offscreen (érték szerinti rendezés) | |
| Samsung Galaxy S8 Plus | |
| Samsung Galaxy S7 Edge | |
| Sony Xperia XZ | |
| HTC U Ultra | |
| LG G6 | |
| Google Pixel XL 2016 | |
| Lenovo Moto Z | |
| Huawei Mate 9 | |
| Apple iPhone 7 Plus | |
| PCMark for Android | |
| Work performance score (érték szerinti rendezés) | |
| Samsung Galaxy S8 Plus | |
| Samsung Galaxy S7 Edge | |
| Sony Xperia XZ | |
| HTC U Ultra | |
| LG G6 | |
| Google Pixel XL 2016 | |
| Lenovo Moto Z | |
| Huawei Mate 9 | |
| Work 2.0 performance score (érték szerinti rendezés) | |
| Samsung Galaxy S8 Plus | |
| Sony Xperia XZ | |
| HTC U Ultra | |
| LG G6 | |
| Huawei Mate 9 | |
| Lightmark - 1920x1080 1080p (érték szerinti rendezés) | |
| Samsung Galaxy S8 Plus | |
| Samsung Galaxy S7 Edge | |
| LG G6 | |
| Lenovo Moto Z | |
| Huawei Mate 9 | |
| WebXPRT 2015 - Overall (érték szerinti rendezés) | |
| Samsung Galaxy S8 Plus | |
| Samsung Galaxy S7 Edge | |
| Sony Xperia XZ | |
| LG G6 | |
| Google Pixel XL 2016 | |
| Lenovo Moto Z | |
| Huawei Mate 9 | |
| Apple iPhone 7 Plus | |
| JetStream 1.1 - 1.1 Total (érték szerinti rendezés) | |
| Samsung Galaxy S8 Plus | |
| Samsung Galaxy S7 Edge | |
| Sony Xperia XZ | |
| HTC U Ultra | |
| LG G6 | |
| Google Pixel XL 2016 | |
| Lenovo Moto Z | |
| Huawei Mate 9 | |
| Apple iPhone 7 Plus | |
| Vellamo 3.x - Browser (érték szerinti rendezés) | |
| Samsung Galaxy S8 Plus | |
| Samsung Galaxy S7 Edge | |
| LG G6 | |
| Google Pixel XL 2016 | |
| Lenovo Moto Z | |
| Huawei Mate 9 | |
| Octane V2 - Total Score (érték szerinti rendezés) | |
| Samsung Galaxy S8 Plus | |
| Samsung Galaxy S7 Edge | |
| Sony Xperia XZ | |
| HTC U Ultra | |
| LG G6 | |
| Google Pixel XL 2016 | |
| Lenovo Moto Z | |
| Huawei Mate 9 | |
| Apple iPhone 7 Plus | |
| Mozilla Kraken 1.1 - Total (érték szerinti rendezés) | |
| Samsung Galaxy S8 Plus | |
| Samsung Galaxy S7 Edge | |
| Sony Xperia XZ | |
| HTC U Ultra | |
| LG G6 | |
| Google Pixel XL 2016 | |
| Lenovo Moto Z | |
| Huawei Mate 9 | |
| Apple iPhone 7 Plus | |
* ... a kisebb jobb
| Samsung Galaxy S8 Plus | Samsung Galaxy S7 Edge | Sony Xperia XZ | HTC U Ultra | Google Pixel XL 2016 | Lenovo Moto Z | Huawei Mate 9 | Apple iPhone 7 Plus | |
|---|---|---|---|---|---|---|---|---|
| AndroBench 3-5 | -16% | -45% | -12% | -40% | 53% | -32% | ||
| Sequential Read 256KB (MB/s) | 788 | 487.3 -38% | 281 -64% | 423.9 -46% | 258.2 -67% | 439.7 -44% | 594 -25% | |
| Sequential Write 256KB (MB/s) | 194.2 | 145.1 -25% | 138 -29% | 164.7 -15% | 83.4 -57% | 168.3 -13% | 142.9 -26% | |
| Random Read 4KB (MB/s) | 127.2 | 86.7 -32% | 71.5 -44% | 84.2 -34% | 87.7 -31% | 117.2 -8% | 94.7 -26% | |
| Random Write 4KB (MB/s) | 15.27 | 15.79 3% | 10.5 -31% | 13.7 -10% | 14.56 -5% | 74.9 391% | 8.77 -43% | |
| Sequential Read 256KB SDCard (MB/s) | 71.1 | 76.4 7% | 33.5 -53% | 82.8 16% | 78.5 10% | 54 -24% | ||
| Sequential Write 256KB SDCard (MB/s) | 57.2 | 50.4 -12% | 29.8 -48% | 67.6 18% | 45.64 -20% | 29.53 -48% | ||
| PassMark PerformanceTest Mobile V1 | -50% | -27% | -18% | 38% | 55% | |||
| Disk Tests (Points) | 92548 | 36364 -61% | 44706 -52% | 68378 -26% | 117939 27% | 48907 -47% | ||
| Memory Tests (Points) | 9844 | 6136 -38% | 9673 -2% | 8912 -9% | 14580 48% | 25299 157% | ||
| BaseMark OS II | ||||||||
| Memory (Points) | 3135 | 2072 -34% | 1434 -54% | 1581 -50% | 1677 -47% | 2190 -30% | 3850 23% | 1319 -58% |
| Teljes átlag (program / beállítások) | -33% /
-26% | -50% /
-46% | -31% /
-17% | -38% /
-37% | 2% /
28% | 10% /
-10% | -2% /
17% |
| Asphalt 8: Airborne | |||
| Beállítások | Érték | ||
| high | 30 fps | ||
| very low | 30 fps | ||
| Dead Trigger 2 | |||
| Beállítások | Érték | ||
| high | 30 fps | ||
(+) A felső oldalon a maximális hőmérséklet 35.7 °C / 96 F, összehasonlítva a 35.3 °C / 96 F átlagával , 21.9 és 247 °C között a Smartphone osztálynál.
(+) Az alsó maximum 36 °C / 97 F-ig melegszik fel, összehasonlítva a 34 °C / 93 F átlagával
(+) Üresjáratban a felső oldal átlagos hőmérséklete 28 °C / 82 F, összehasonlítva a 33 °C / ### eszközátlaggal class_avg_f### F.
Samsung Galaxy S8 Plus hangelemzés
(+) | a hangszórók viszonylag hangosan tudnak játszani (82.9 dB)
Basszus 100 - 315 Hz
(-) | szinte nincs basszus – átlagosan 21.5%-kal alacsonyabb a mediánnál
(±) | a basszus linearitása átlagos (12% delta az előző frekvenciához)
Közepes 400-2000 Hz
(±) | magasabb középértékek – átlagosan 5.2%-kal magasabb, mint a medián
(+) | a középpontok lineárisak (3.8% delta az előző frekvenciához)
Maximum 2-16 kHz
(±) | magasabb csúcsok – átlagosan 5.2%-kal magasabb, mint a medián
(±) | a csúcsok linearitása átlagos (7.7% delta az előző gyakorisághoz)
Összességében 100 - 16.000 Hz
(±) | az általános hang linearitása átlagos (22.2% eltérés a mediánhoz képest)
Ugyanazon osztályhoz képest
» 47%Ebben az osztályban az összes tesztelt eszköz %-a jobb volt, 7% hasonló, 46%-kal rosszabb
» A legjobb delta értéke 11%, az átlag 34%, a legrosszabb 134% volt
Az összes tesztelt eszközzel összehasonlítva
» 65% az összes tesztelt eszköz jobb volt, 6% hasonló, 29%-kal rosszabb
» A legjobb delta értéke 4%, az átlag 23%, a legrosszabb 134% volt
Apple iPhone 7 Plus hangelemzés
(±) | a hangszóró hangereje átlagos, de jó (81.4 dB)
Basszus 100 - 315 Hz
(-) | szinte nincs basszus – átlagosan 24.1%-kal alacsonyabb a mediánnál
(±) | a basszus linearitása átlagos (7.4% delta az előző frekvenciához)
Közepes 400-2000 Hz
(+) | kiegyensúlyozott középpontok – csak 4.7% választja el a mediántól
(±) | a középpontok linearitása átlagos (7.6% delta az előző gyakorisághoz)
Maximum 2-16 kHz
(+) | kiegyensúlyozott csúcsok – csak 4.3% választja el a mediántól
(+) | a csúcsok lineárisak (6.9% delta az előző frekvenciához képest)
Összességében 100 - 16.000 Hz
(±) | az általános hang linearitása átlagos (22% eltérés a mediánhoz képest)
Ugyanazon osztályhoz képest
» 46%Ebben az osztályban az összes tesztelt eszköz %-a jobb volt, 7% hasonló, 47%-kal rosszabb
» A legjobb delta értéke 11%, az átlag 34%, a legrosszabb 134% volt
Az összes tesztelt eszközzel összehasonlítva
» 64% az összes tesztelt eszköz jobb volt, 6% hasonló, 30%-kal rosszabb
» A legjobb delta értéke 4%, az átlag 23%, a legrosszabb 134% volt
Teufel Boomster hangelemzés
(+) | a hangszórók viszonylag hangosan tudnak játszani (93.5 dB)
Basszus 100 - 315 Hz
(+) | jó basszus – csak 2.9% választja el a mediántól
(+) | a basszus lineáris (3.1% delta az előző frekvenciához)
Közepes 400-2000 Hz
(+) | kiegyensúlyozott középpontok – csak 1.5% választja el a mediántól
(+) | a középpontok lineárisak (1.4% delta az előző frekvenciához)
Maximum 2-16 kHz
(+) | kiegyensúlyozott csúcsok – csak 4.7% választja el a mediántól
(+) | a csúcsok lineárisak (3.7% delta az előző frekvenciához képest)
Összességében 100 - 16.000 Hz
(+) | általános hangzás lineáris (8.8% eltérés a mediánhoz képest)
Ugyanazon osztályhoz képest
» 11%Ebben az osztályban az összes tesztelt eszköz %-a jobb volt, 2% hasonló, 87%-kal rosszabb
» A legjobb delta értéke 5%, az átlag 17%, a legrosszabb 45% volt
Az összes tesztelt eszközzel összehasonlítva
» 3% az összes tesztelt eszköz jobb volt, 1% hasonló, 97%-kal rosszabb
» A legjobb delta értéke 4%, az átlag 23%, a legrosszabb 134% volt
| Kikapcsolt állapot / Készenlét | |
| Üresjárat | |
| Terhelés |
|
Kulcs:
min: | |
| Samsung Galaxy S8 Plus 3500 mAh | Samsung Galaxy S7 Edge 3600 mAh | LG G6 3300 mAh | HTC U Ultra 3000 mAh | Google Pixel XL 2016 3450 mAh | Apple iPhone 7 Plus 2915 mAh | Huawei Mate 9 4000 mAh | |
|---|---|---|---|---|---|---|---|
| Power Consumption | -16% | -33% | -77% | -1% | -50% | -50% | |
| Idle Minimum * (Watt) | 0.68 | 0.63 7% | 0.62 9% | 1 -47% | 0.53 22% | 0.77 -13% | 0.78 -15% |
| Idle Average * (Watt) | 1.13 | 1.1 3% | 1.43 -27% | 2.41 -113% | 1.07 5% | 2.04 -81% | 2.13 -88% |
| Idle Maximum * (Watt) | 1.16 | 1.56 -34% | 1.48 -28% | 2.46 -112% | 1.12 3% | 2.24 -93% | 2.17 -87% |
| Load Average * (Watt) | 4.69 | 5.95 -27% | 5.52 -18% | 6.8 -45% | 5.53 -18% | 4.69 -0% | 6.32 -35% |
| Load Maximum * (Watt) | 5.24 | 6.7 -28% | 10.47 -100% | 8.9 -70% | 6.26 -19% | 8.66 -65% | 6.49 -24% |
* ... a kisebb jobb
| PCMark for Android - Work 2.0 battery life | |
| Samsung Galaxy A5 2017 | |
| Huawei Mate 9 | |
| Samsung Galaxy S8 Plus | |
| Sony Xperia XZ | |
| Samsung Galaxy S7 | |
| Samsung Galaxy S8 Plus 3500 mAh | Samsung Galaxy S7 Edge 3600 mAh | HTC U Ultra 3000 mAh | Google Pixel XL 2016 3450 mAh | LG G6 3300 mAh | Huawei Mate 9 4000 mAh | Sony Xperia XZ 2900 mAh | Lenovo Moto Z 2600 mAh | |
|---|---|---|---|---|---|---|---|---|
| Akkumulátor üzemidő | 17% | -17% | -24% | 1% | 2% | -34% | -11% | |
| Reader / Idle (h) | 26.1 | 27.7 6% | 26.1 0% | 22.2 -15% | 29.8 14% | 25.6 -2% | 18.8 -28% | 22.9 -12% |
| H.264 (h) | 12.4 | 15.2 23% | 10.1 -19% | 8.4 -32% | 13 5% | 15.8 27% | 8.4 -32% | 12.1 -2% |
| WiFi v1.3 (h) | 12.3 | 12.2 -1% | 9.1 -26% | 8.4 -32% | 11.5 -7% | 12.6 2% | 7.3 -41% | 6.8 -45% |
| Load (h) | 4.6 | 6.5 41% | 3.6 -22% | 3.8 -17% | 4.2 -9% | 3.7 -20% | 3.1 -33% | 5.3 15% |
Pro
Kontra
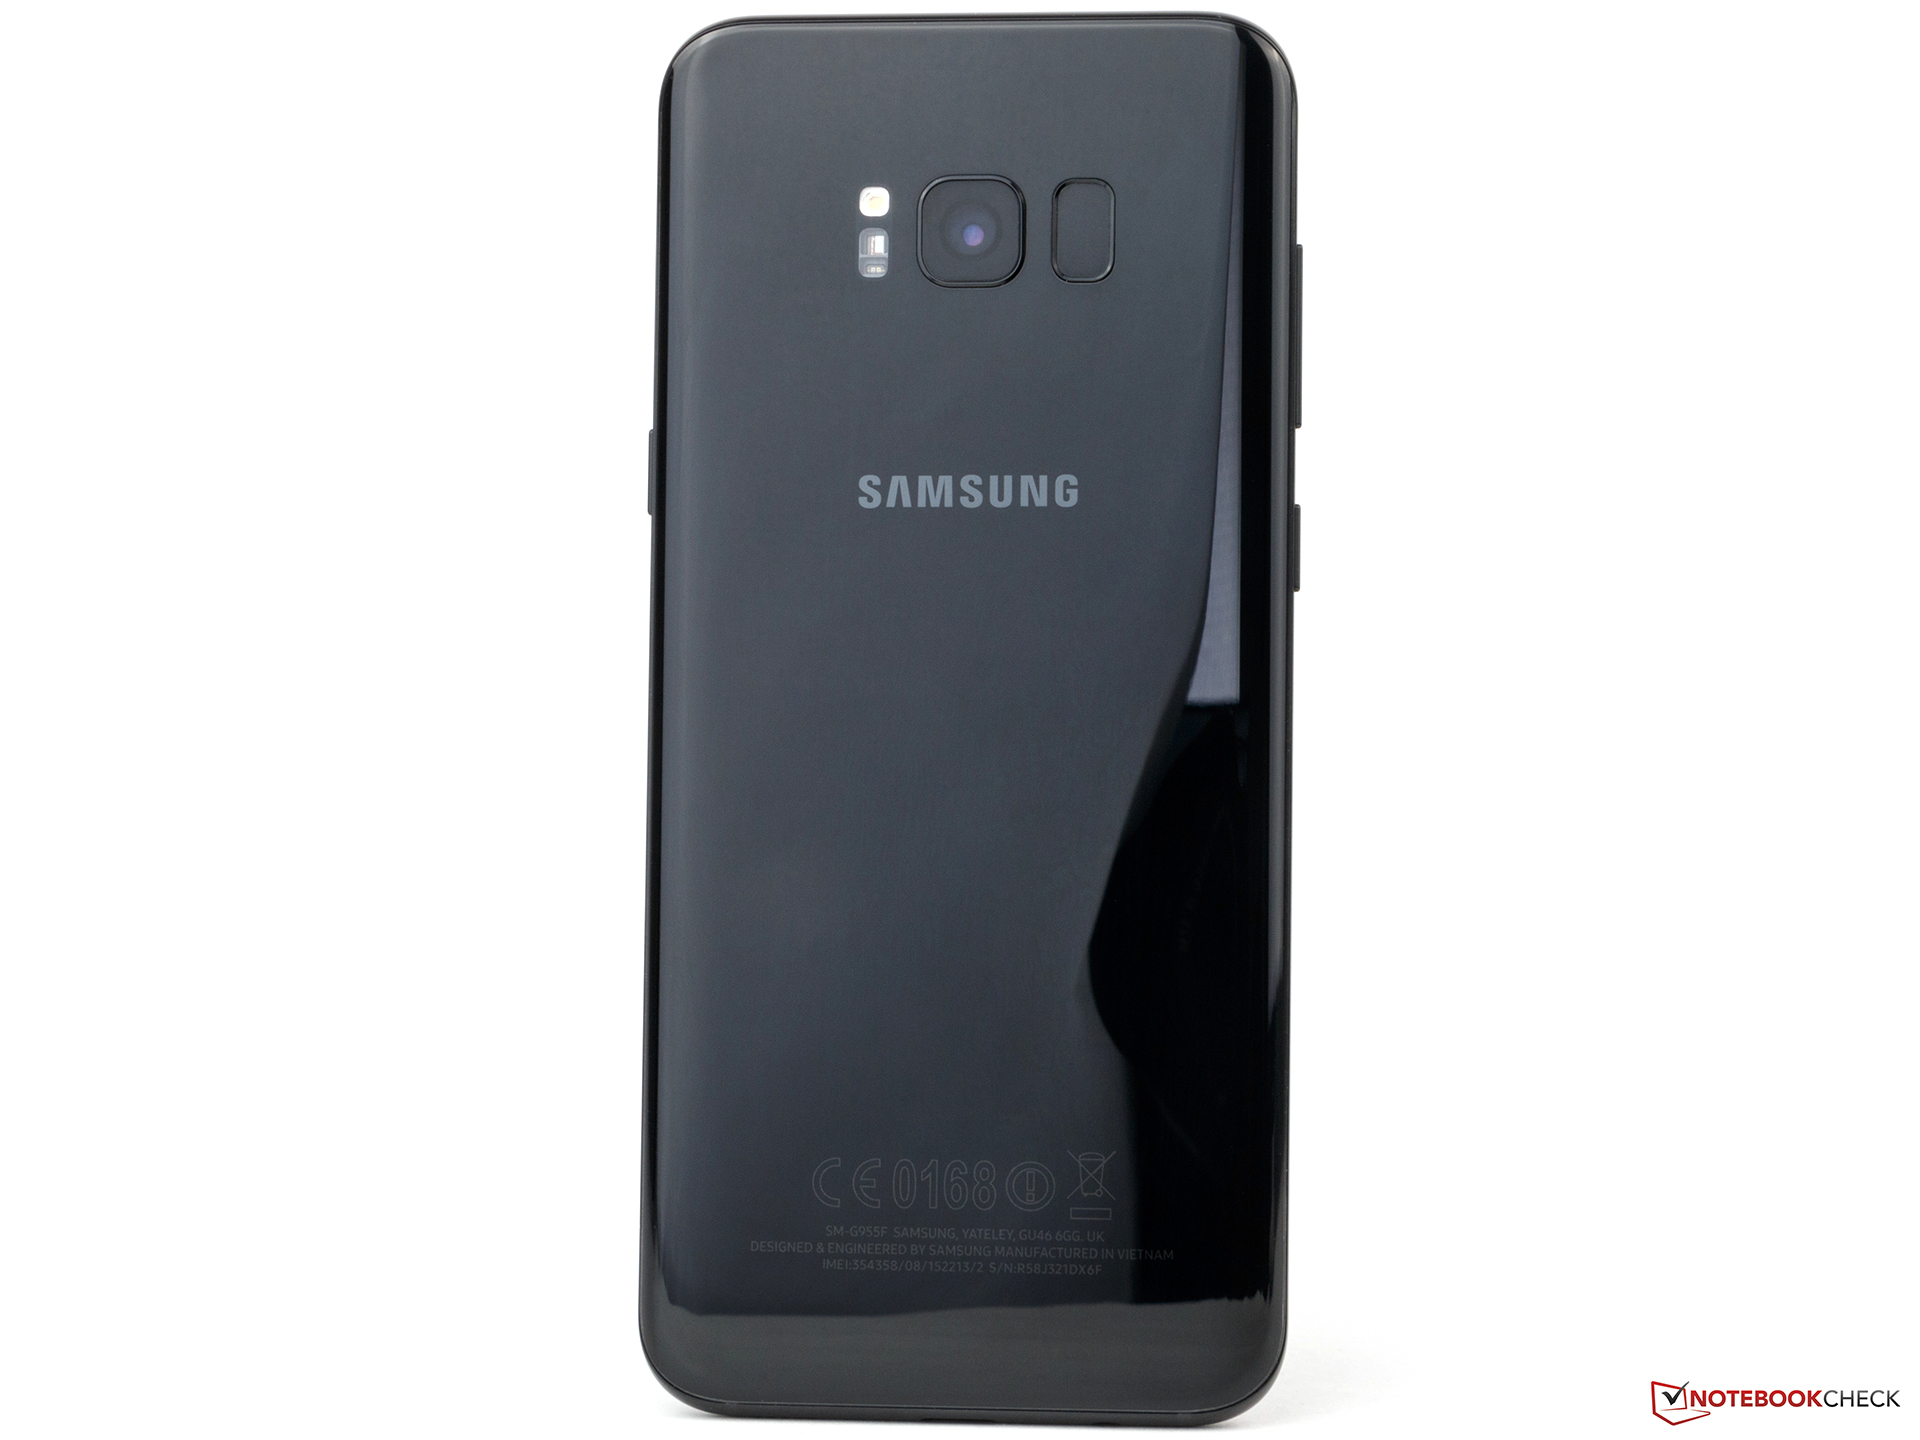
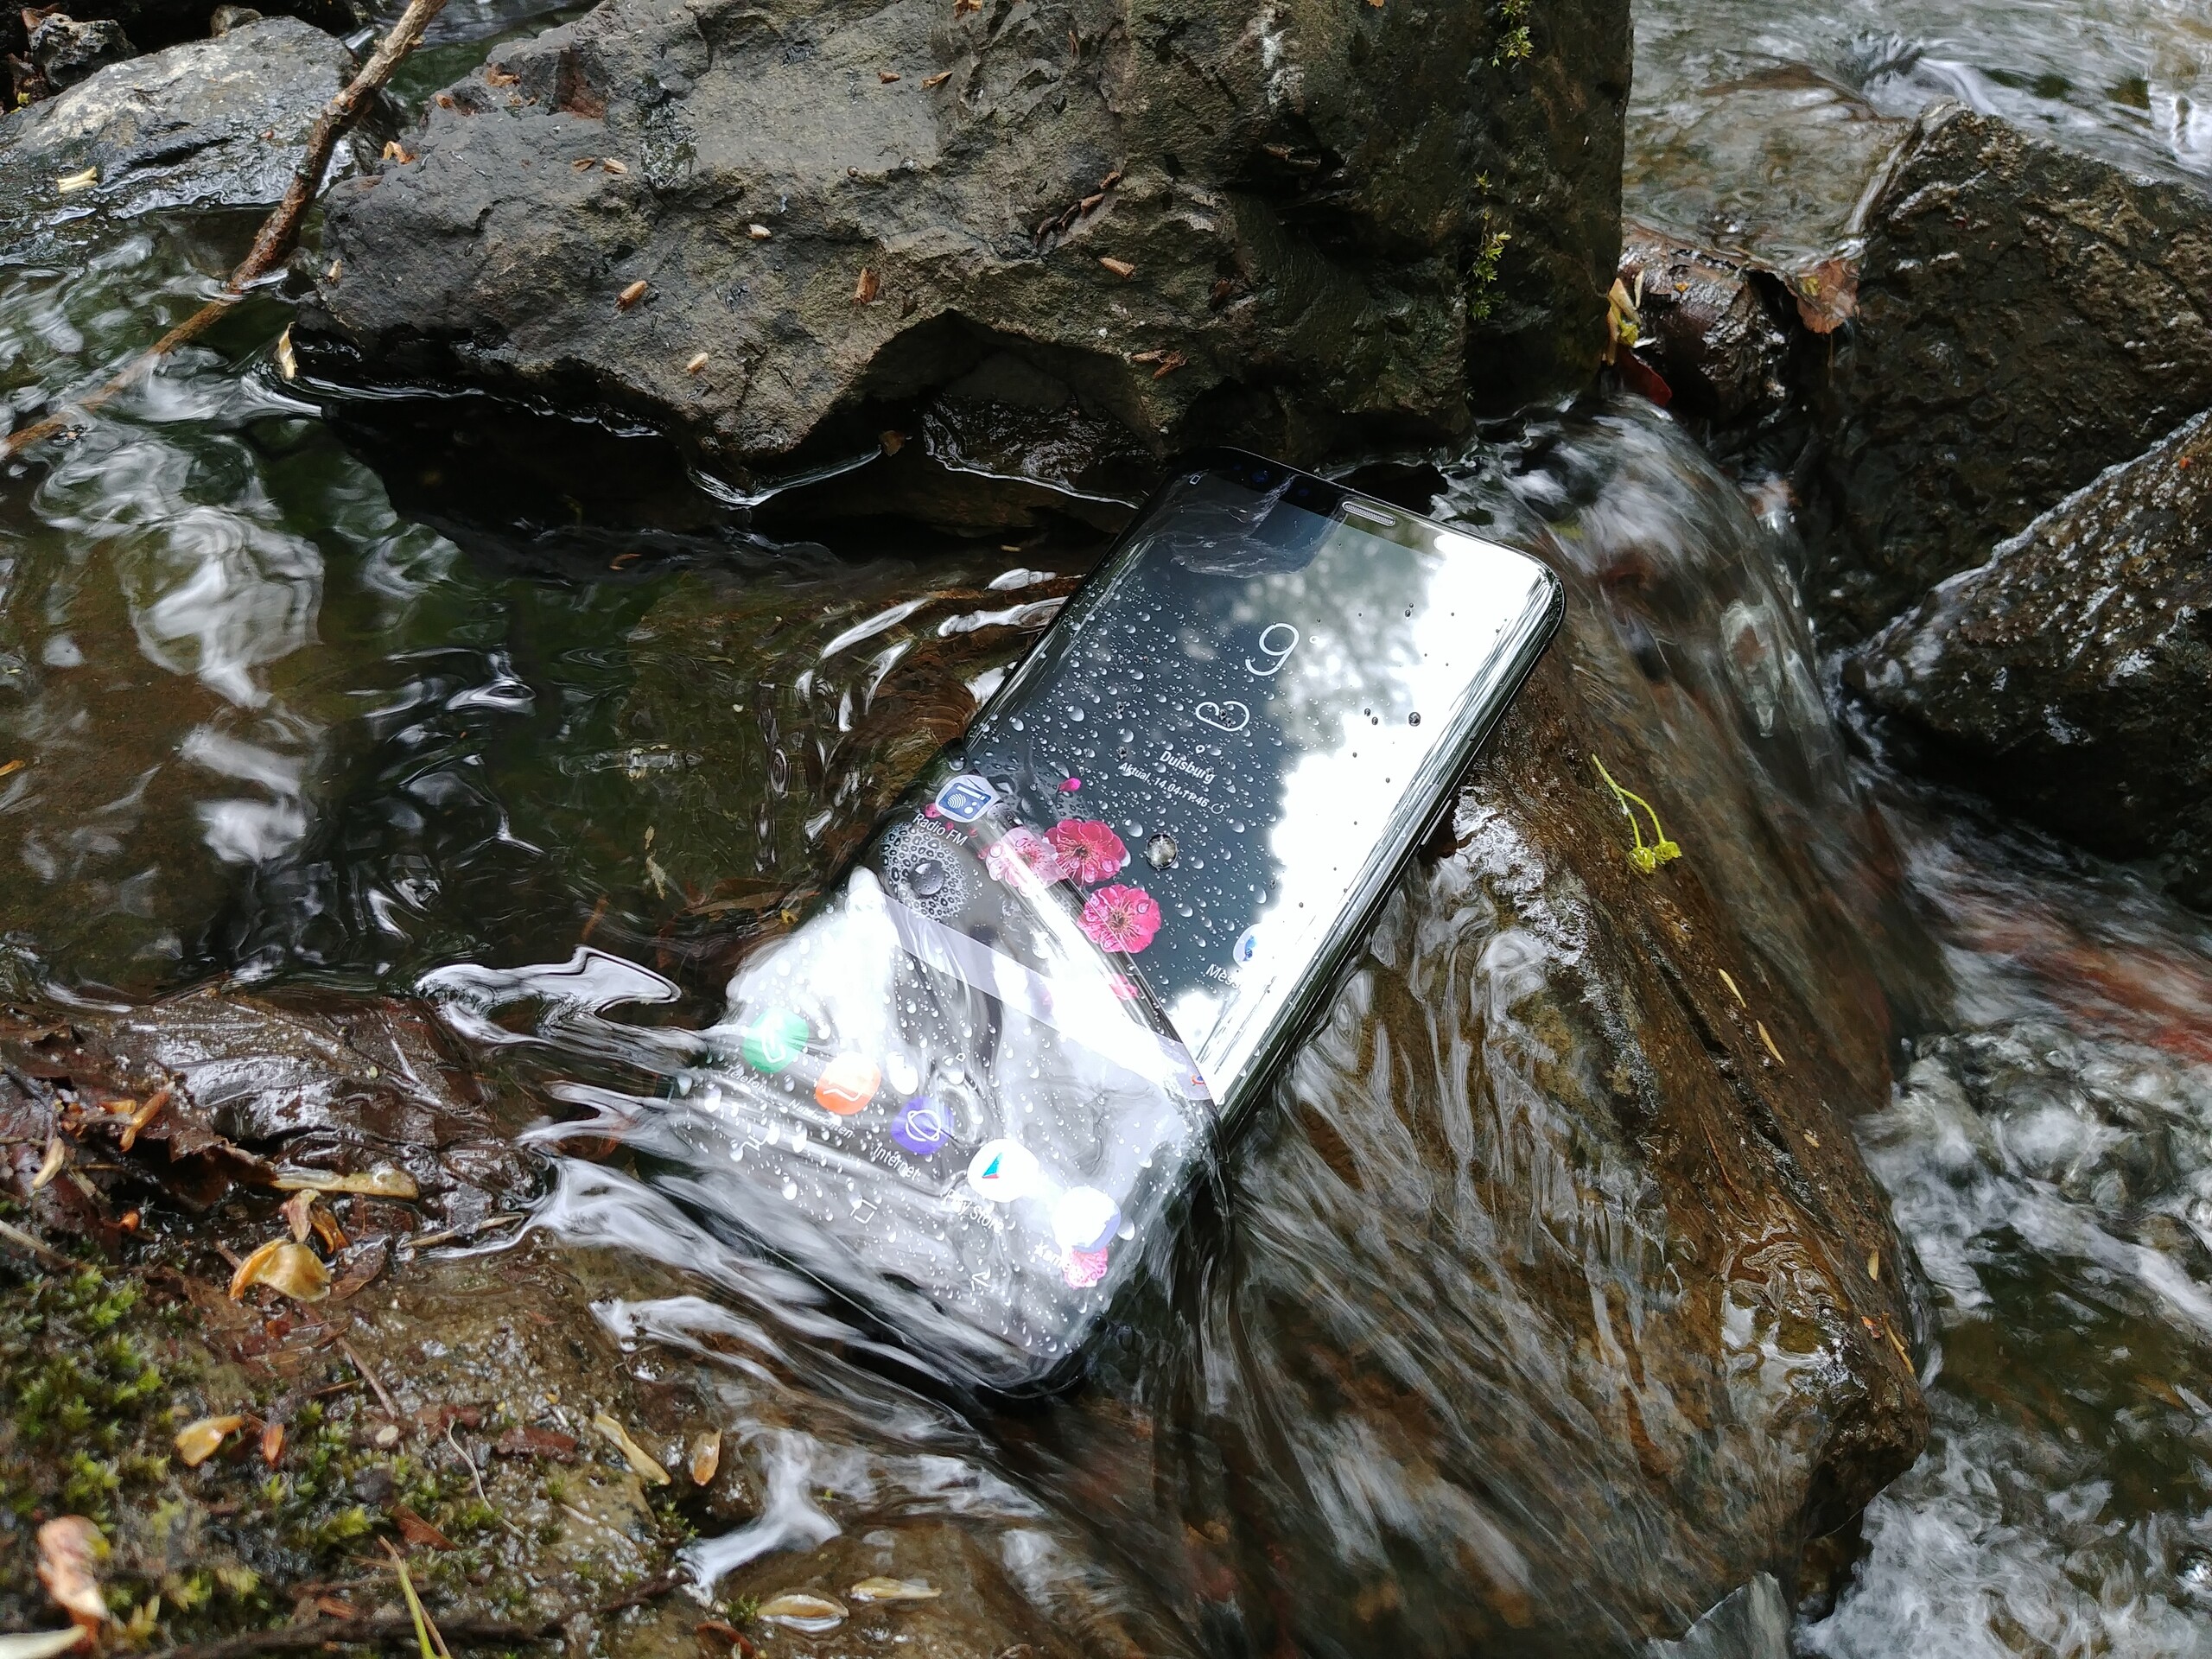
A Samsung Galaxy S8 Plus kiváló okostelefon, amelynek nincs nagyobb hiányossága. Az új, majdnem teljesen keret nélküli design képen is jól mutat, de élőben még lenyűgözőbb. Az Infinity kijelző minden téren jól teljesít: színhűség, fényerő, tükröződésmentesség. Az új Samsung Exynos 8895 teljesítménye is remek, képes lépést tartani az Apple A10 chipjével.
A Galaxy S8 Plus konnektivitását sem tudjuk kritikával illetni. A hangminősége jó, és nagyon gyors WiFi-t, és gigabites LTE-t kapunk. Az utóbbi azért támogathatna több frekvenciasávot, mert Észak-Amerikában, vagy Ázsiában gondjaink lehetnek vele. A gyártó helyfüggő korlátozásai idegesítőek, ráadásul Európában nem kapható dual-SIM képes modell sem.
A Samsung Galaxy S8+ sok csúcsfunkcióval, remek kamerával és kiváló üzemidővel bír. Tesztünk után nem sok rosszat tudunk mondani róla.
Úgy általában is szívesen látnánk valamivel több választási lehetőséget a vásárlók számára. A 128 GB-os verzió, és egyes színek sem lesznek elérhetők Európában.
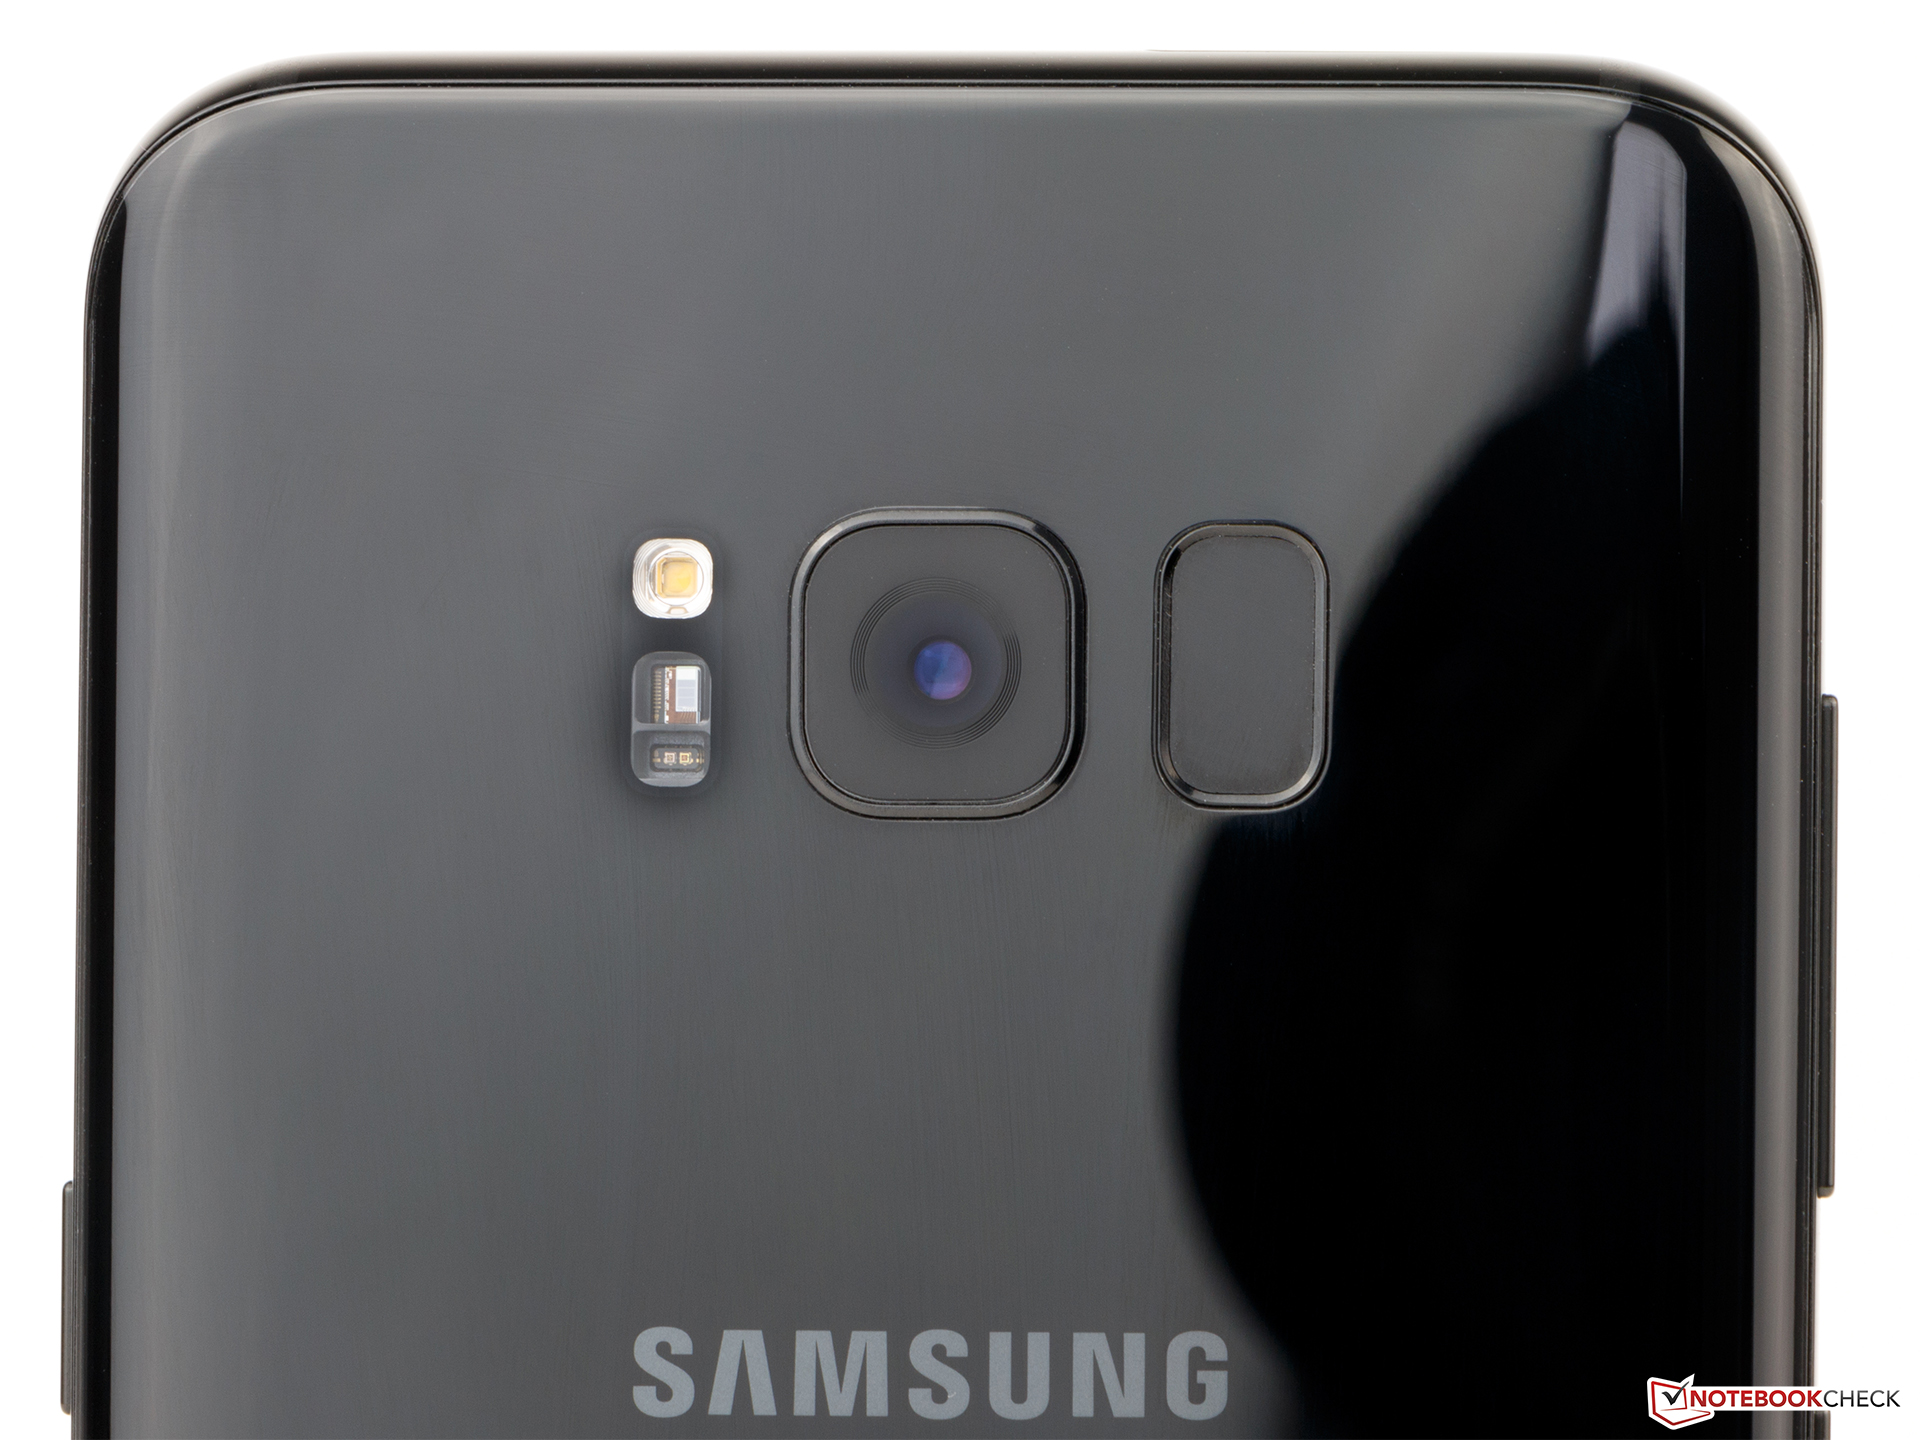
A Samsung egy sor biztonsági funkcióval is ellátta a telefont. Az arcfelismerő használatát azonban nem javasoljuk, mert könnyen átverhető. A hátlapra került ujjlenyomat olvasót is nehéz elérni.
Mindent egybevetve, a Samsung kiváló okostelefont alkotott, amely dizájnjával, kiváló kamerájával, nagyon jó üzemidejével, és csodás, keret nélküli kijelzőjével nyűgözött le minket. Csak a kisebb S8 modell árára rápakolt plusz magas kissé.
Ez az eredeti értékelés rövidített változata. A teljes, angol nyelvű cikk itt olvasható.
Samsung Galaxy S8 Plus
- 04/13/2017 v6 (old)
Daniel Schmidt
Price comparison
