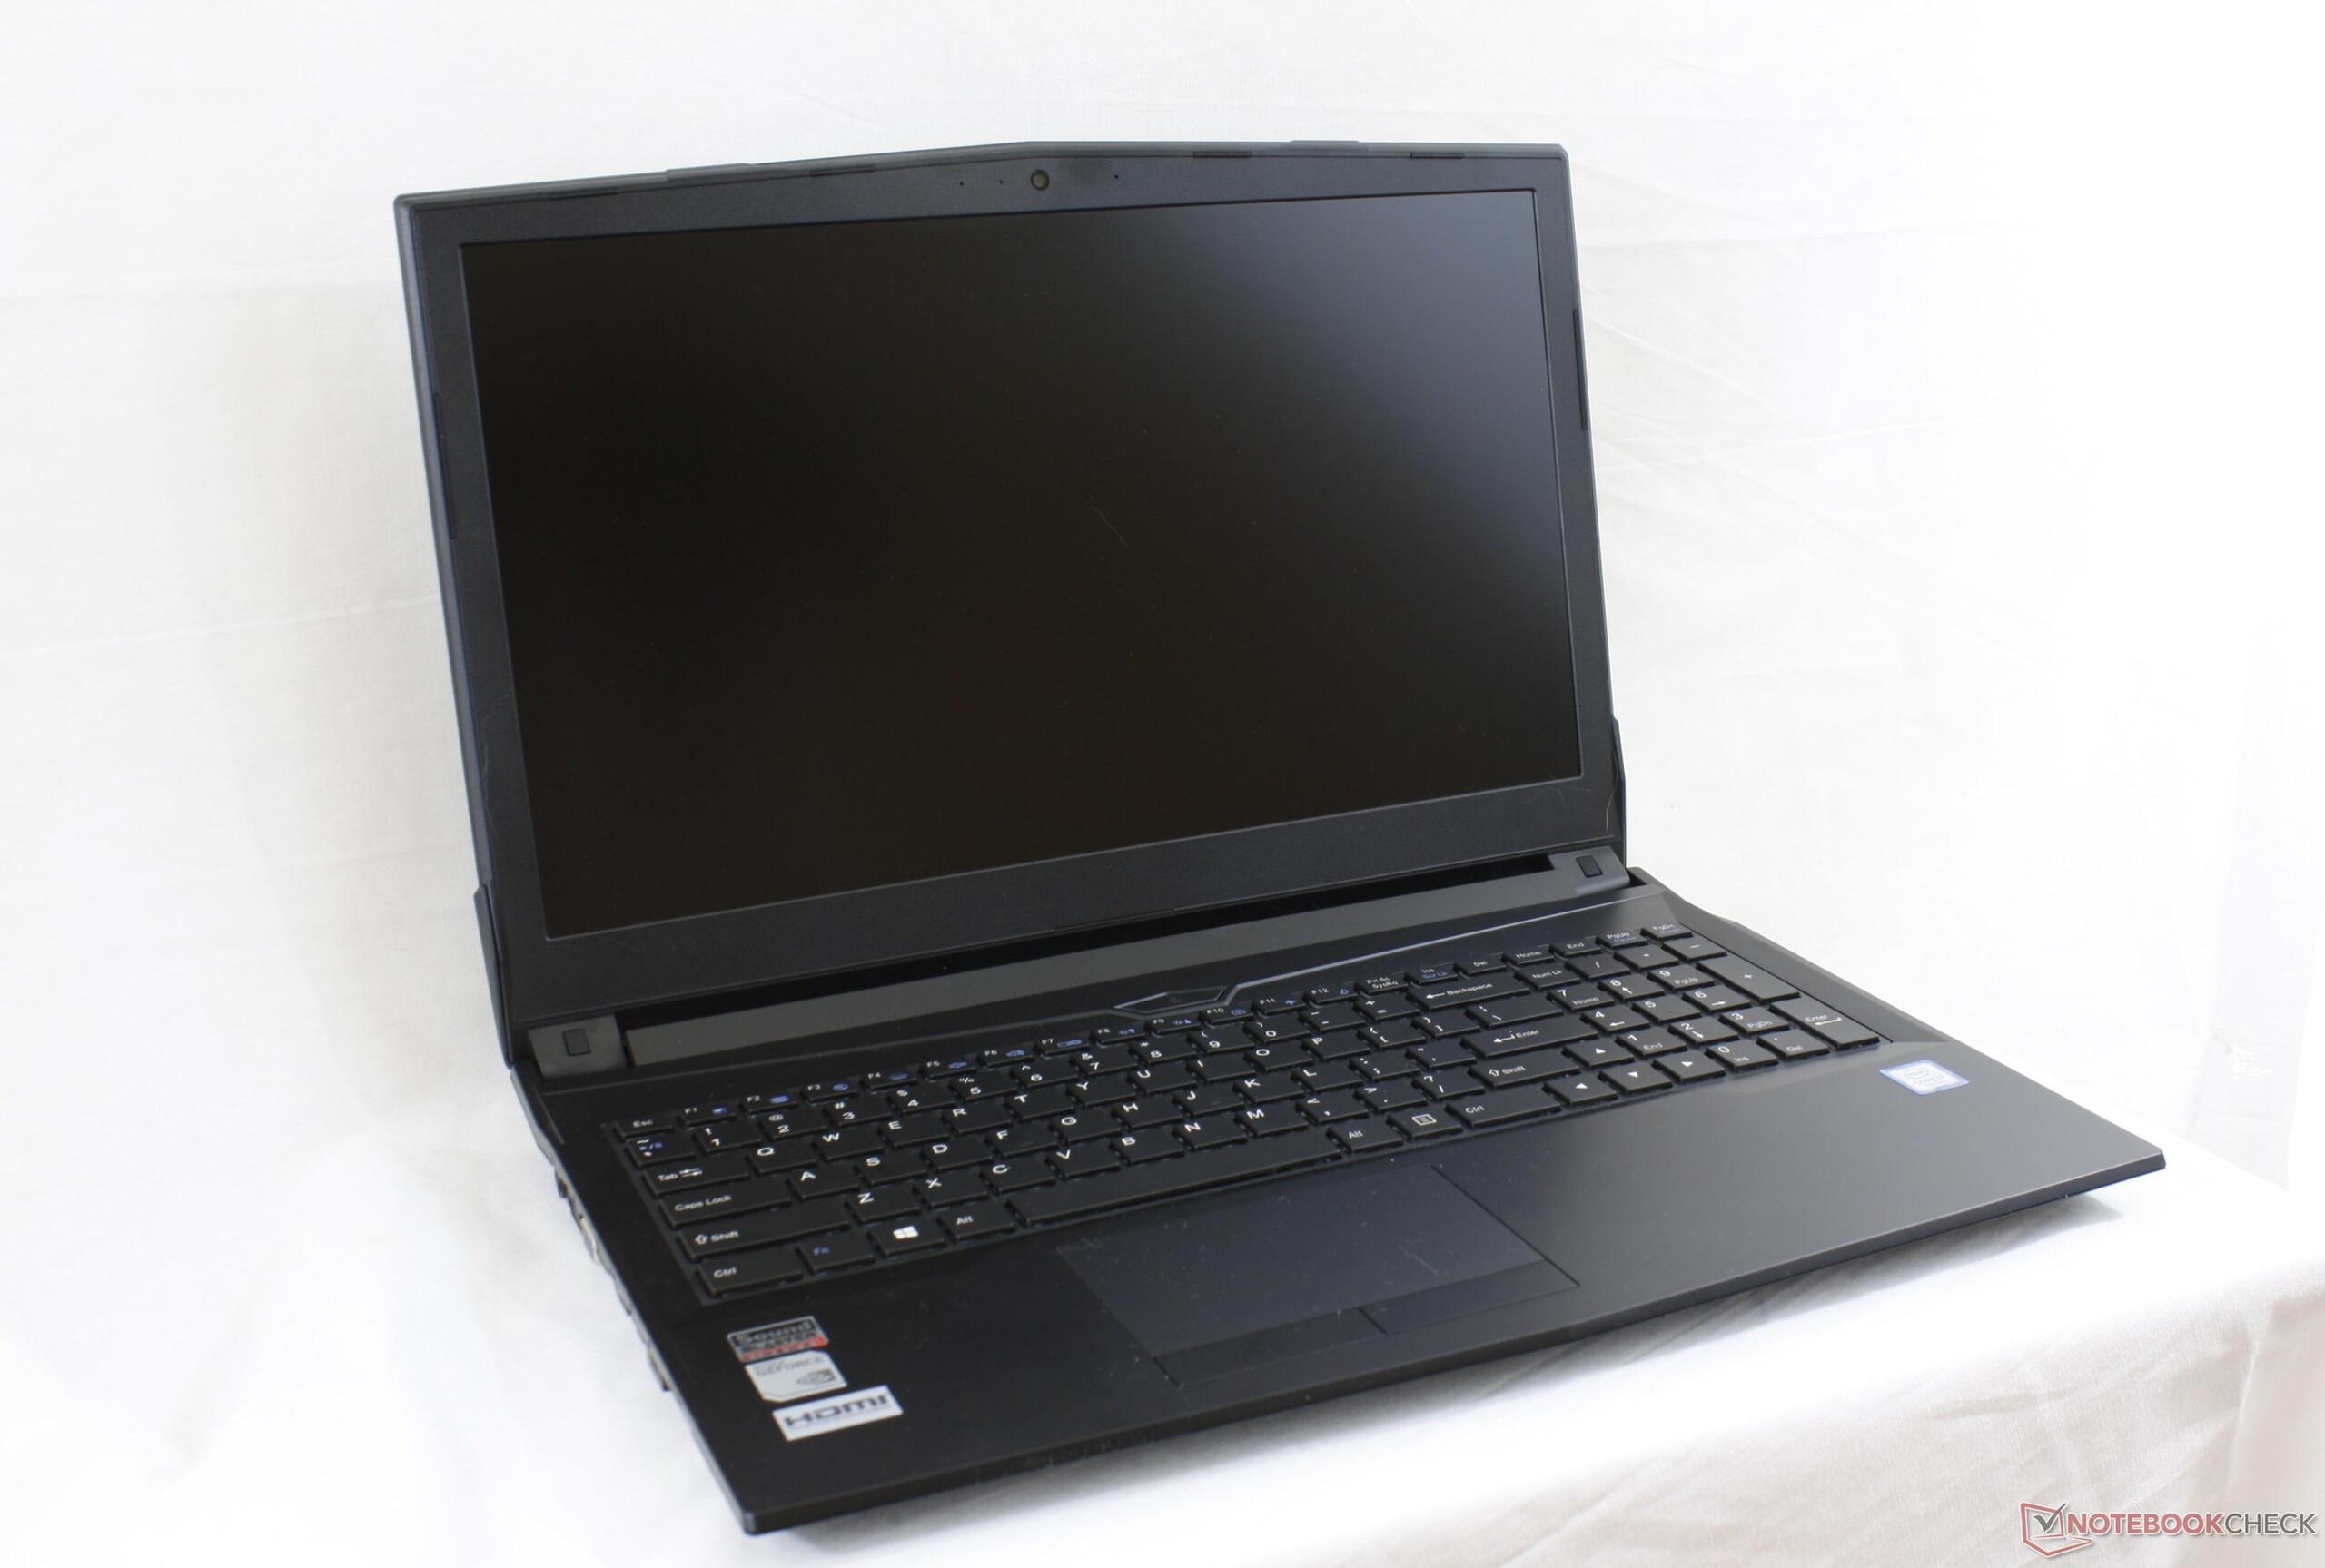
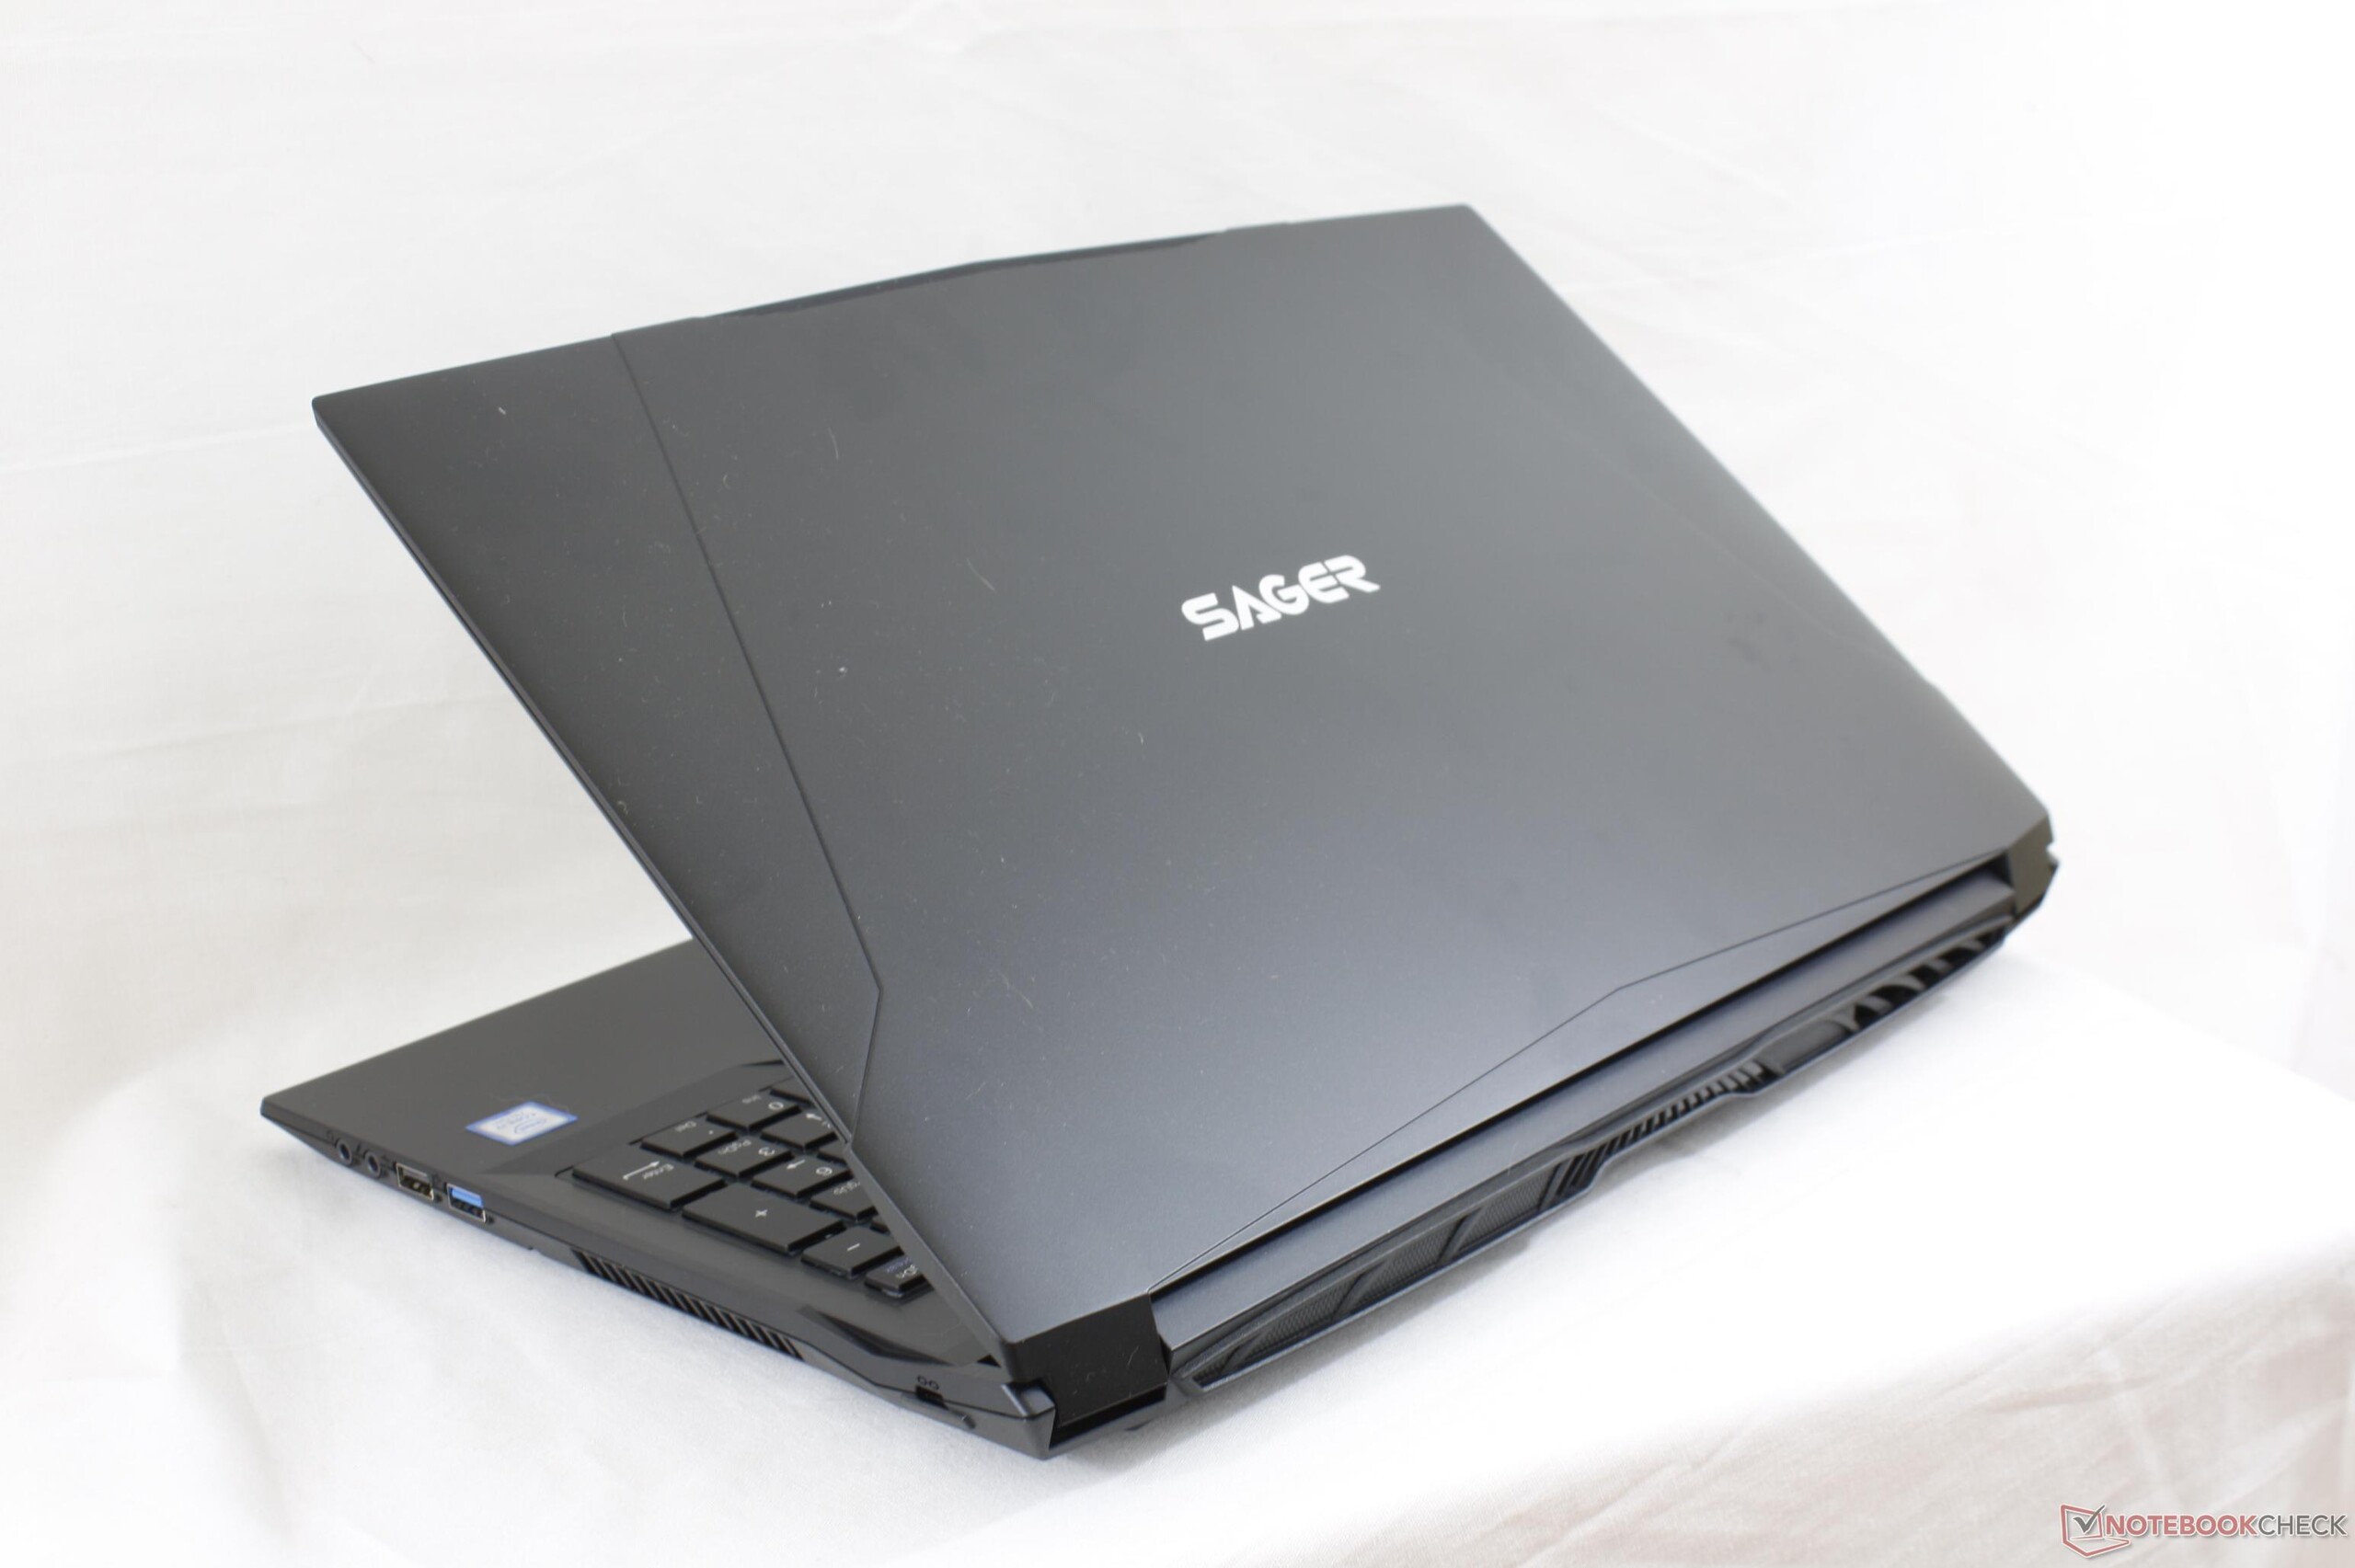
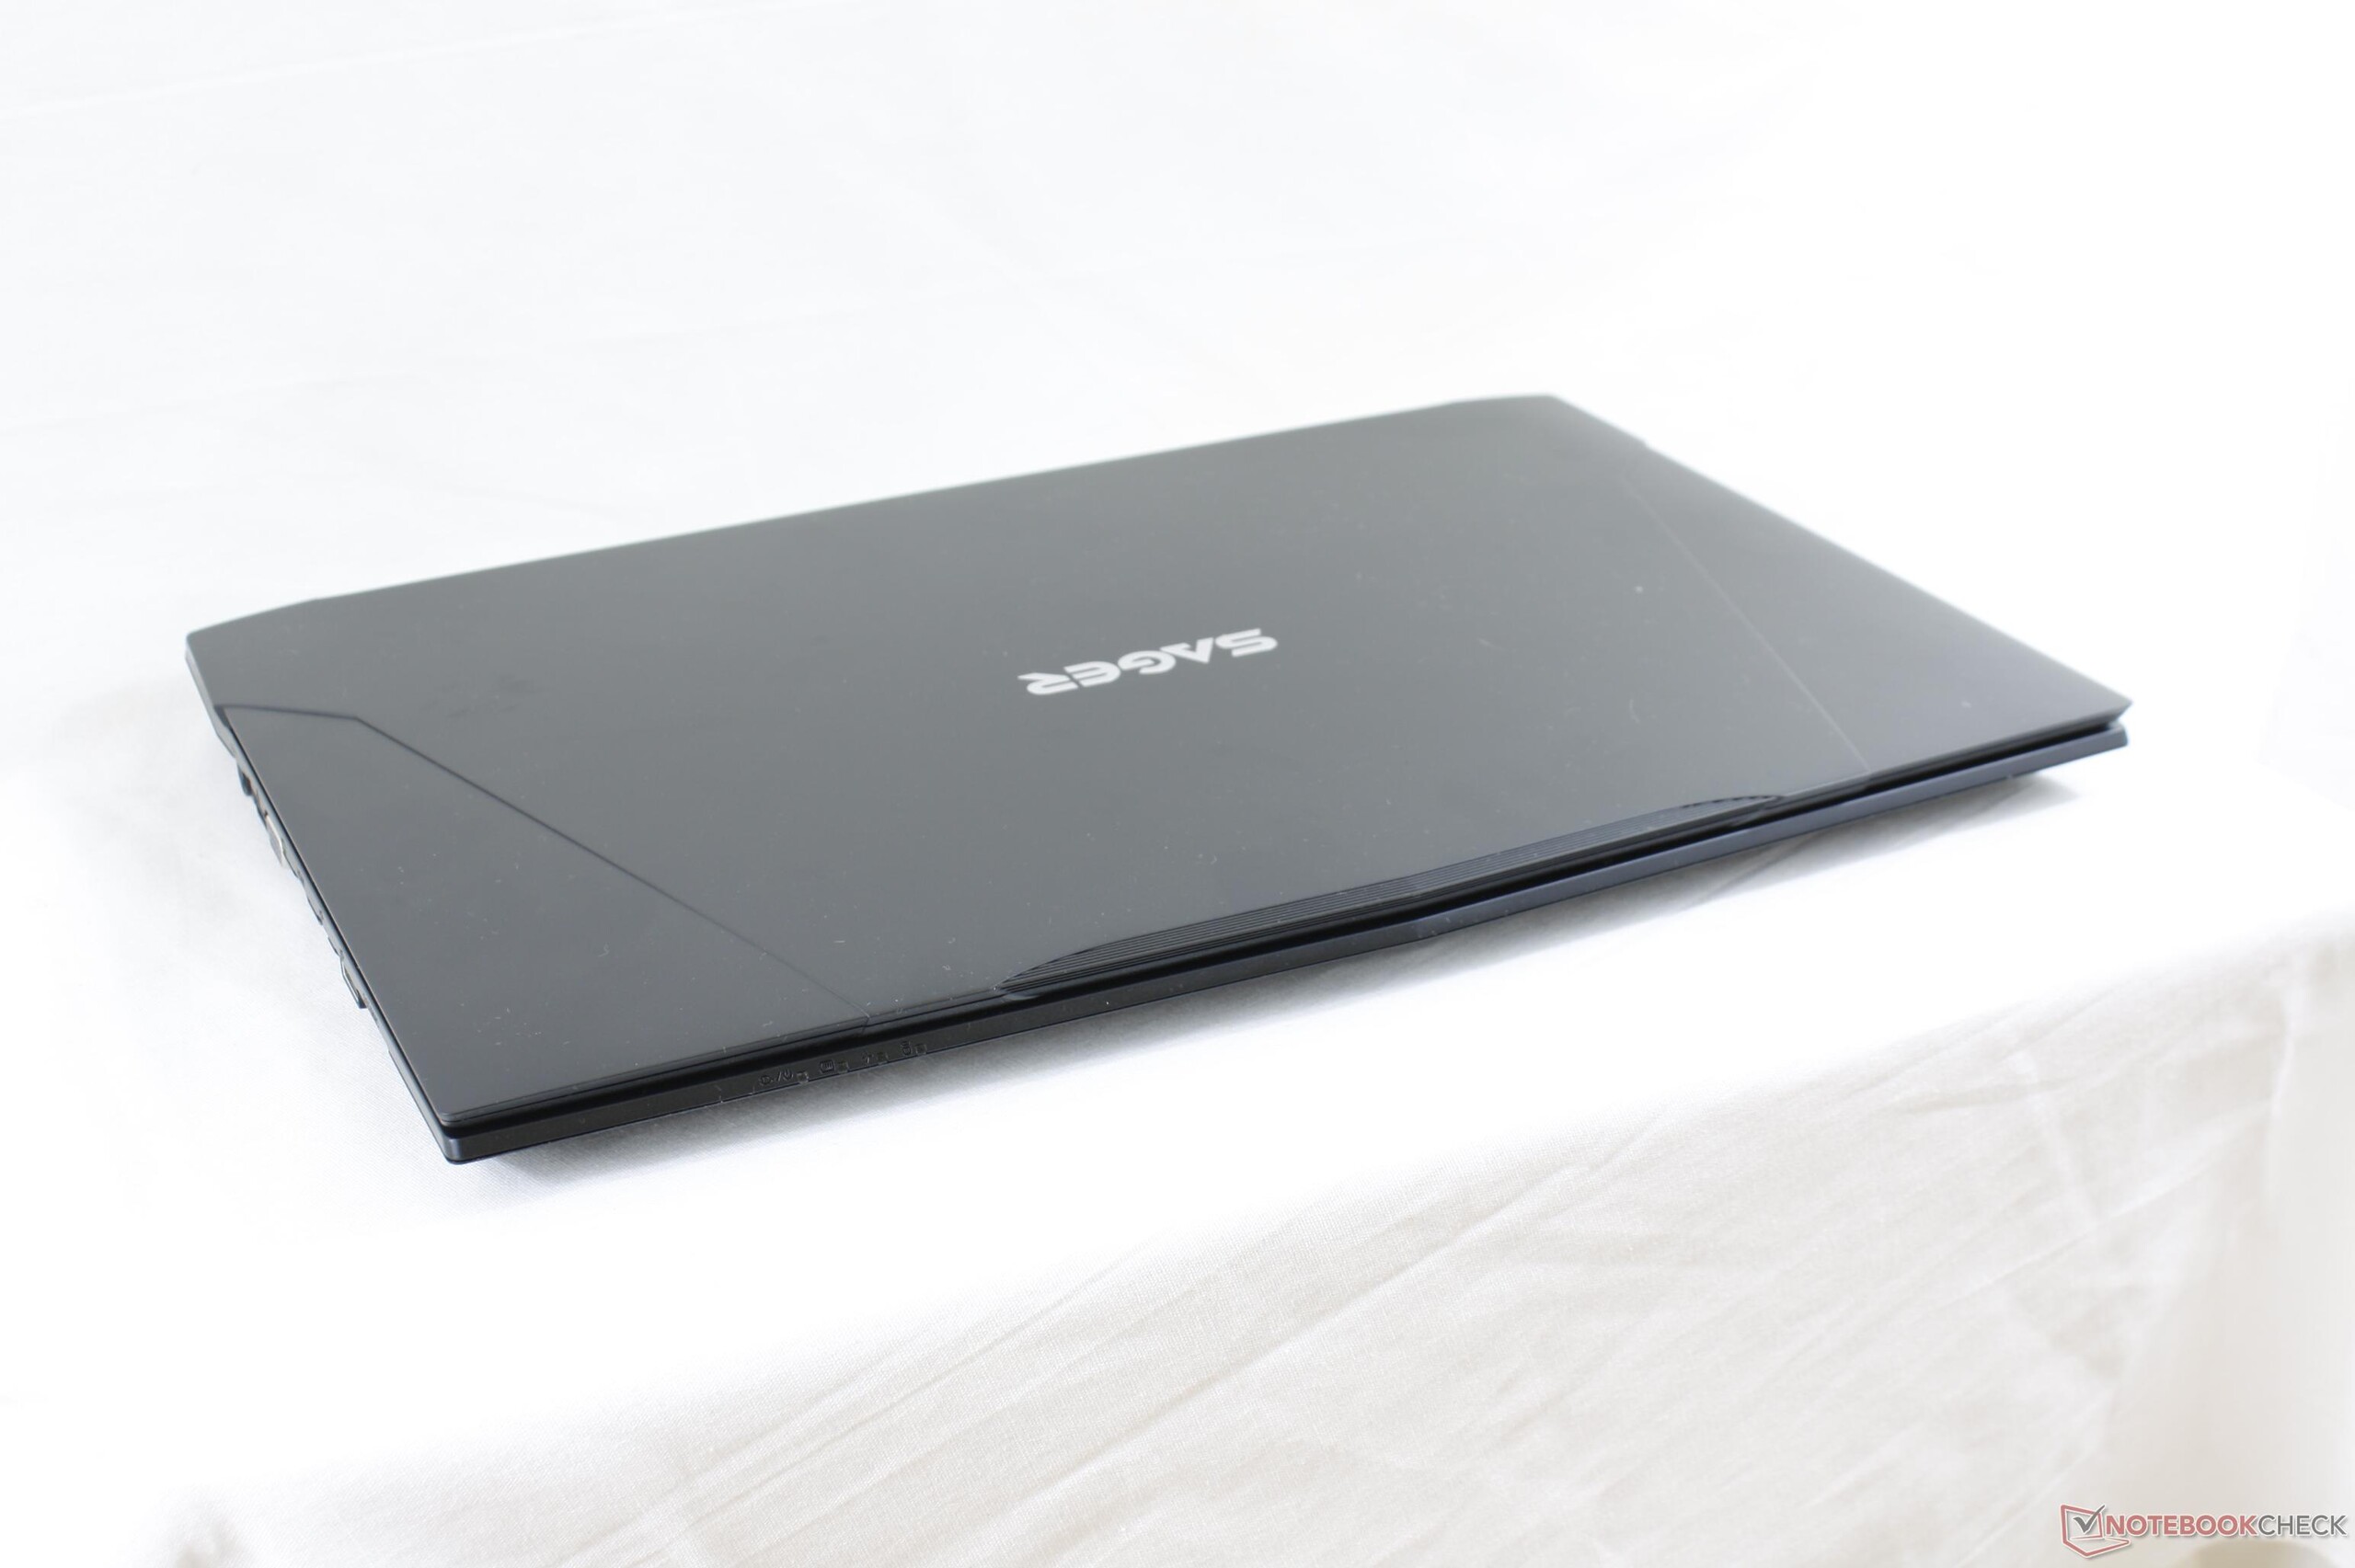
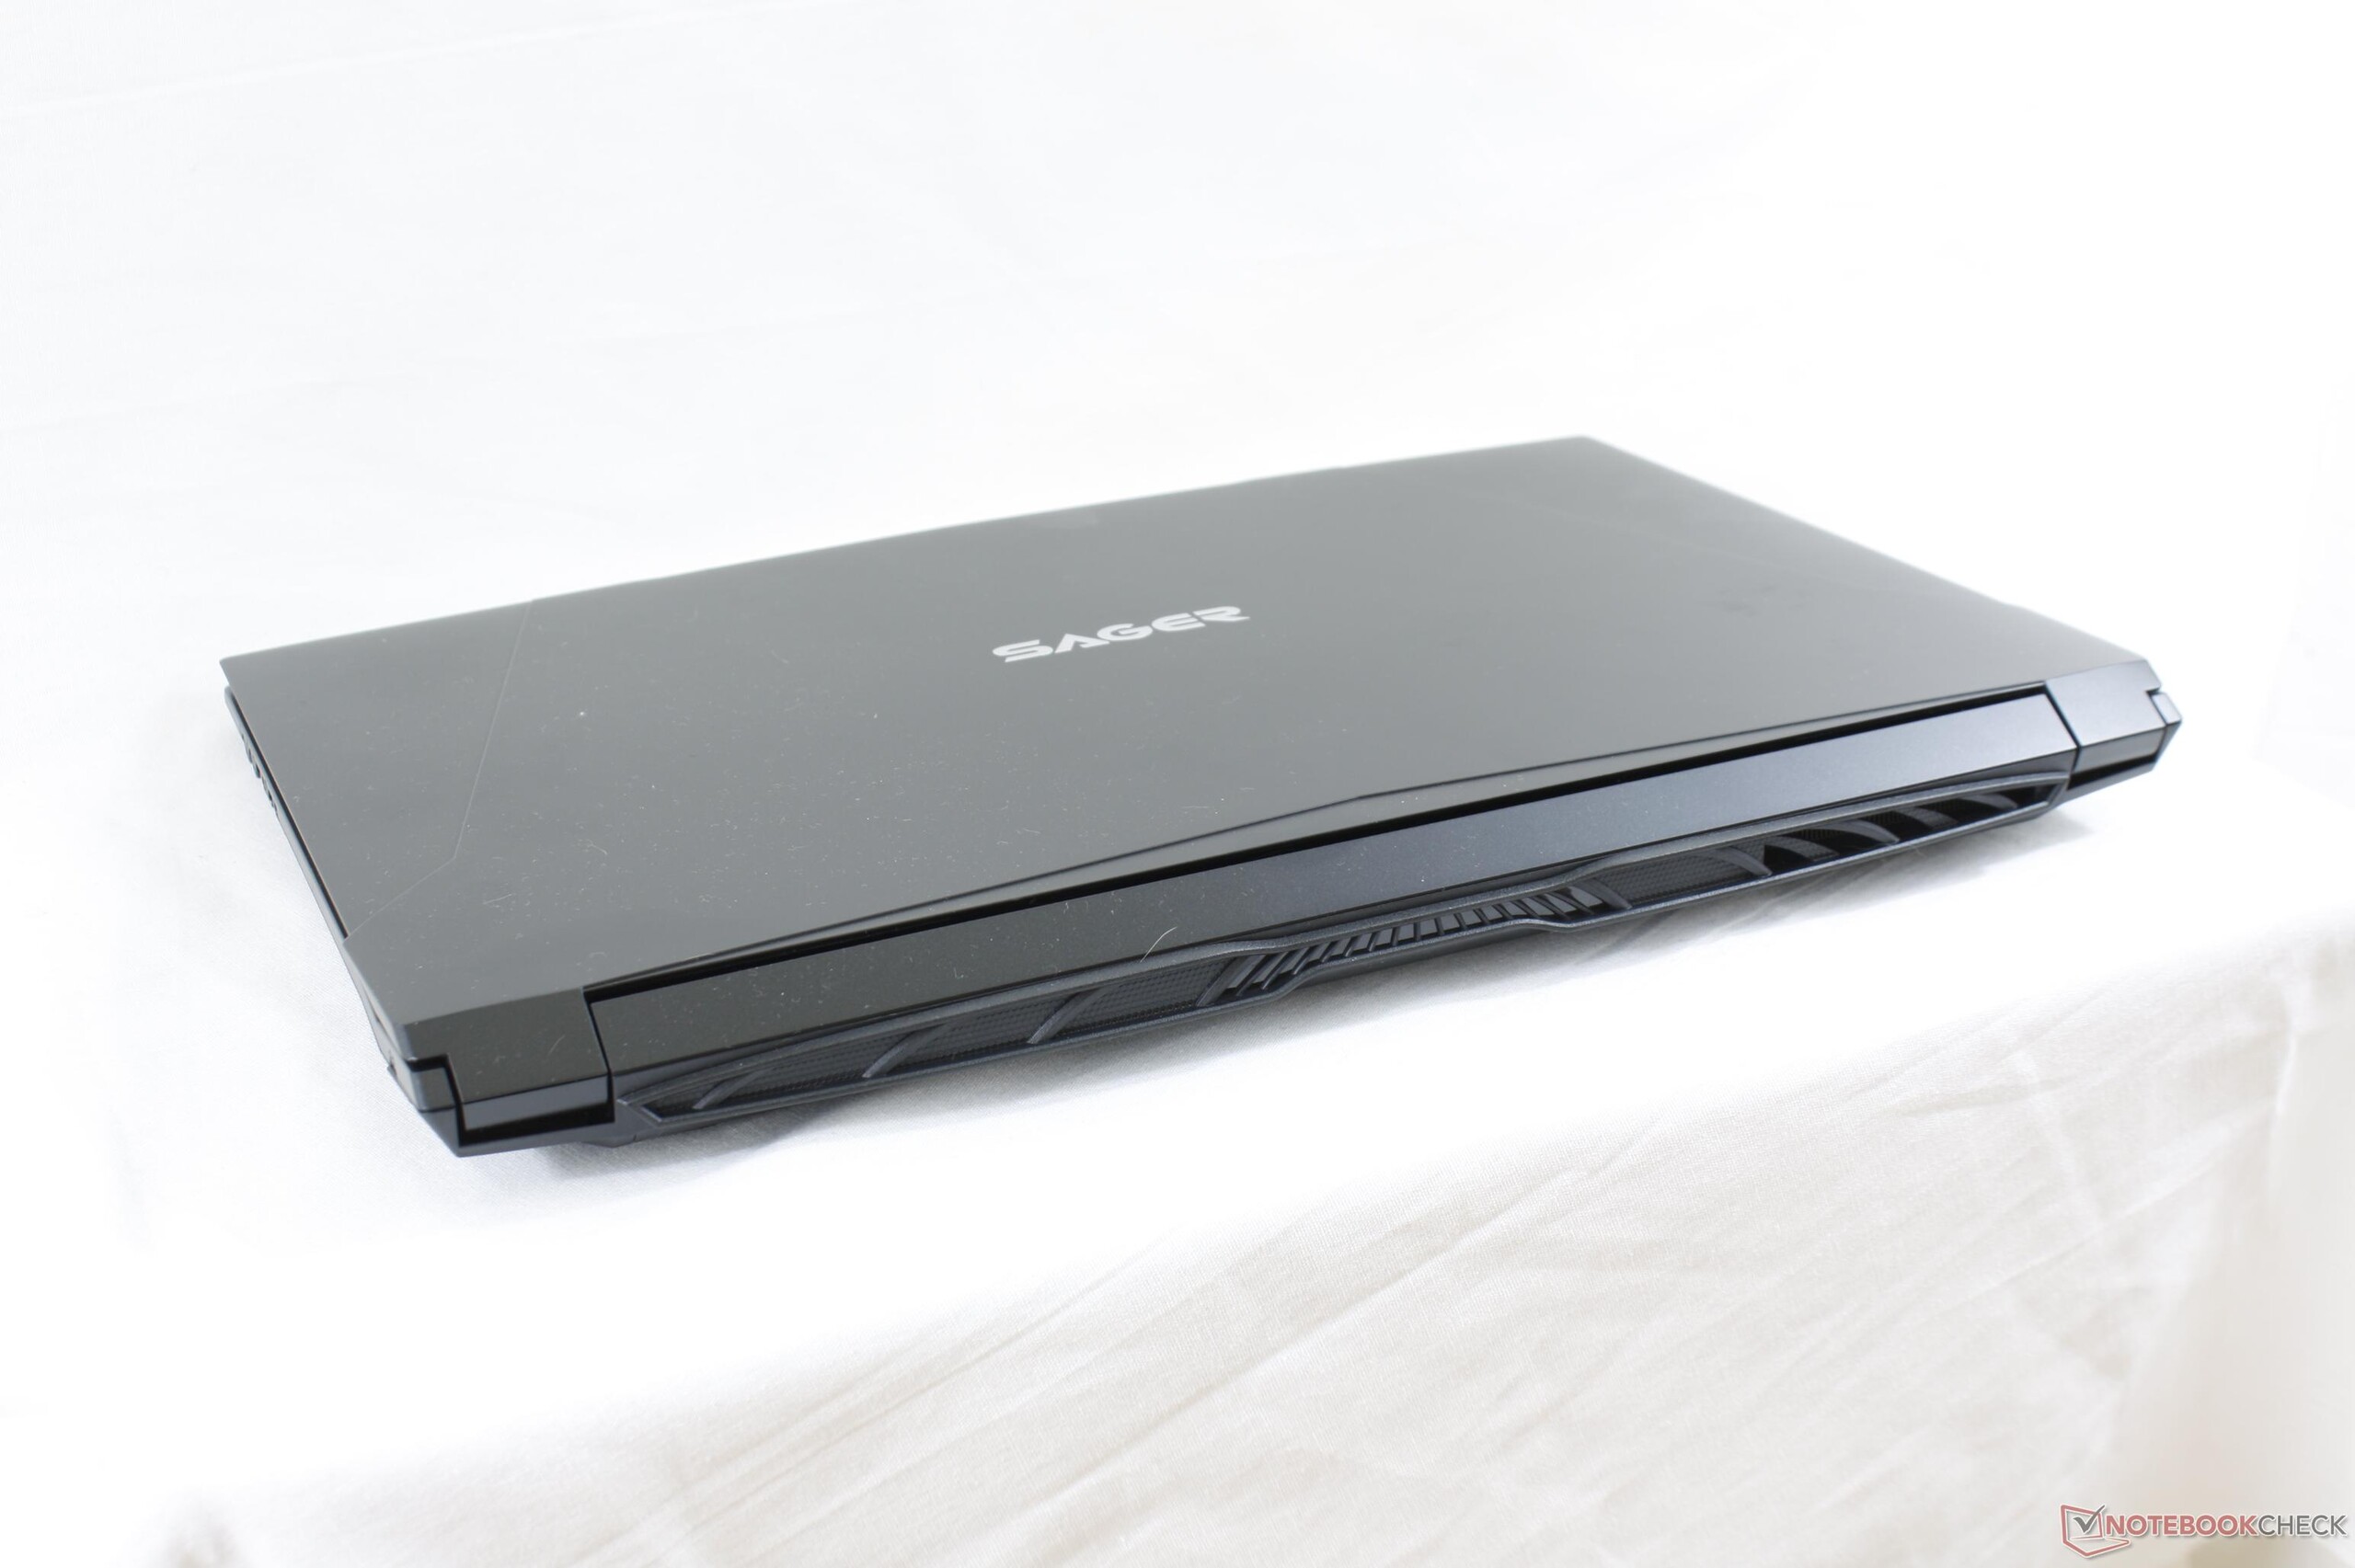
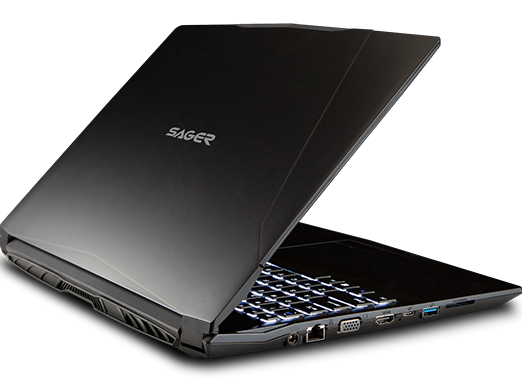
Sager NP5852 (Clevo N850HL, i7-7700HQ, MX150) Laptop rövid értékelés

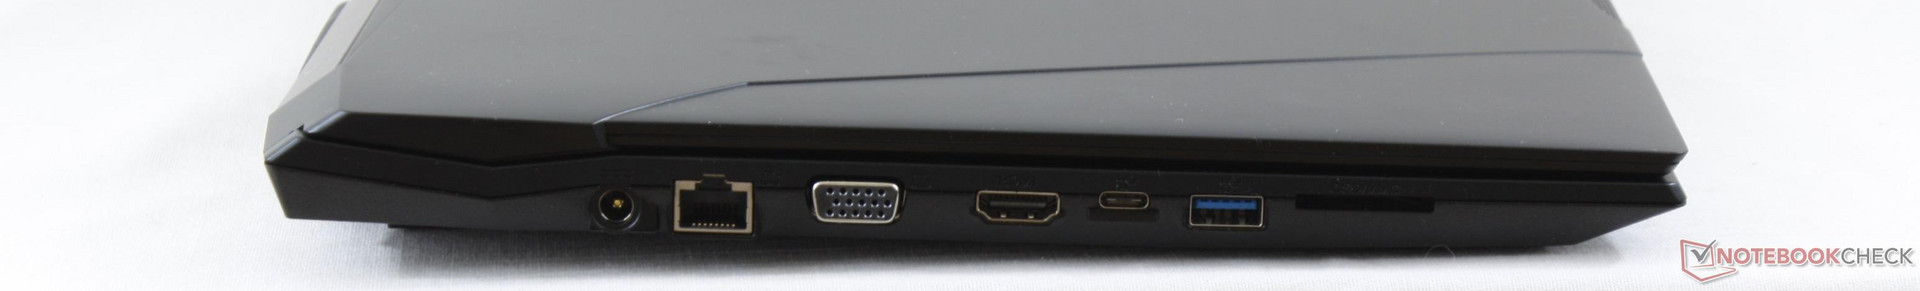
| SD Card Reader | |
| average JPG Copy Test (av. of 3 runs) | |
| Eurocom Tornado F5 Killer Edition | |
| Gigabyte Sabre 15G | |
| Sager NP5852 | |
| MSI GS63VR 7RF-228US | |
| maximum AS SSD Seq Read Test (1GB) | |
| Eurocom Tornado F5 Killer Edition | |
| Gigabyte Sabre 15G | |
| Sager NP5852 | |
| MSI GS63VR 7RF-228US | |
| Networking | |
| iperf3 transmit AX12 | |
| MSI GS63VR 7RF-228US | |
| Gigabyte Sabre 15G | |
| Sager NP5852 | |
| iperf3 receive AX12 | |
| MSI GS63VR 7RF-228US | |
| Gigabyte Sabre 15G | |
| Sager NP5852 | |
| |||||||||||||||||||||||||
Fényerő megoszlás: 88 %
Centrumban: 303.9 cd/m²
Kontraszt: 691:1 (Fekete: 0.44 cd/m²)
ΔE ColorChecker Calman: 7.3 | ∀{0.5-29.43 Ø4.73}
ΔE Greyscale Calman: 6.6 | ∀{0.09-98 Ø4.97}
56.5% sRGB (Argyll 1.6.3 3D)
36.4% AdobeRGB 1998 (Argyll 1.6.3 3D)
39.58% AdobeRGB 1998 (Argyll 3D)
56.8% sRGB (Argyll 3D)
38.19% Display P3 (Argyll 3D)
Gamma: 2.24
CCT: 7652 K
| Sager NP5852 ID: LGD0533, Name: LG Philips LP156WF6-SPK3, IPS, 15.6", 1920x1080 | Gigabyte Sabre 15G ID: LGD0533, Name: LG Display LP156WF6-SPK3, IPS, 15.6", 1920x1080 | Asus ZenBook Pro UX550VD CMN15E8 (N156HCE-EN1), IPS, 15.6", 1920x1080 | Acer Aspire 5 A515-51G-51RL AU Optronics B156HAN06.1, IPS, 15.6", 1920x1080 | Acer TravelMate P658-G2-MG-7327 LG Philips LP156WF6-SPP1, IPS, 15.6", 1920x1080 | Asus AsusPro P4540UQ-FY0056R LG Philips LP156WF6-SPB6, IPS, 15.6", 1920x1080 | |
|---|---|---|---|---|---|---|
| Display | 2% | 66% | 0% | 60% | 56% | |
| Display P3 Coverage (%) | 38.19 | 38.97 2% | 65.7 72% | 38.3 0% | 64.9 70% | 63.3 66% |
| sRGB Coverage (%) | 56.8 | 58.2 2% | 90.3 59% | 57.6 1% | 85.9 51% | 83.6 47% |
| AdobeRGB 1998 Coverage (%) | 39.58 | 40.3 2% | 65.9 66% | 39.57 0% | 62.8 59% | 61.1 54% |
| Response Times | 1% | -14% | -16% | -14% | -16% | |
| Response Time Grey 50% / Grey 80% * (ms) | 29.6 ? | 32 ? -8% | 38.8 ? -31% | 41 ? -39% | 38 ? -28% | 38 ? -28% |
| Response Time Black / White * (ms) | 28 ? | 25.6 ? 9% | 27.2 ? 3% | 26 ? 7% | 28 ? -0% | 29 ? -4% |
| PWM Frequency (Hz) | 20000 ? | 20000 ? | 25910 ? | 21000 ? | 21000 ? | |
| Screen | 2% | 37% | 27% | 32% | 35% | |
| Brightness middle (cd/m²) | 303.9 | 248.4 -18% | 335 10% | 235 -23% | 284 -7% | 276 -9% |
| Brightness (cd/m²) | 286 | 241 -16% | 313 9% | 236 -17% | 276 -3% | 283 -1% |
| Brightness Distribution (%) | 88 | 84 -5% | 83 -6% | 80 -9% | 82 -7% | 85 -3% |
| Black Level * (cd/m²) | 0.44 | 0.3 32% | 0.27 39% | 0.17 61% | 0.295 33% | 0.27 39% |
| Contrast (:1) | 691 | 828 20% | 1241 80% | 1382 100% | 963 39% | 1022 48% |
| Colorchecker dE 2000 * | 7.3 | 7.5 -3% | 4.7 36% | 4.69 36% | 4.07 44% | 3.92 46% |
| Colorchecker dE 2000 max. * | 27.3 | 25.2 8% | 8.1 70% | 7.9 71% | 10.52 61% | 9.13 67% |
| Greyscale dE 2000 * | 6.6 | 6.5 2% | 5.8 12% | 3.34 49% | 3.13 53% | 2.6 61% |
| Gamma | 2.24 98% | 2.19 100% | 2.06 107% | 2.63 84% | 2.41 91% | 2.53 87% |
| CCT | 7652 85% | 7852 83% | 6518 100% | 6801 96% | 7082 92% | 6561 99% |
| Color Space (Percent of AdobeRGB 1998) (%) | 36.4 | 37 2% | 58.7 61% | 36 -1% | 56 54% | 54.5 50% |
| Color Space (Percent of sRGB) (%) | 56.5 | 57.9 2% | 90.1 59% | 57 1% | 86 52% | 83.7 48% |
| Teljes átlag (program / beállítások) | 2% /
2% | 30% /
36% | 4% /
16% | 26% /
31% | 25% /
32% |
* ... a kisebb jobb
Megjelenítési válaszidők
| ↔ Válaszidő Fekete-fehér | ||
|---|---|---|
| 28 ms ... emelkedés és süllyedés ↘ kombinálva | ↗ 18 ms emelkedés | 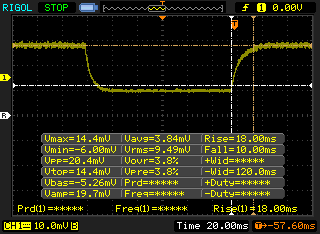 |
| ↘ 10 ms ősz | ||
| A képernyő viszonylag lassú reakciósebességet mutat tesztjeinkben, és túl lassú lehet a játékosok számára. Összehasonlításképpen, az összes tesztelt eszköz 0.1 (minimum) és 240 (maximum) ms között mozog. » 71 % of all devices are better. Ez azt jelenti, hogy a mért válaszidő rosszabb, mint az összes vizsgált eszköz átlaga (19.9 ms). | ||
| ↔ Válaszidő 50% szürke és 80% szürke között | ||
| 29.6 ms ... emelkedés és süllyedés ↘ kombinálva | ↗ 14.8 ms emelkedés | 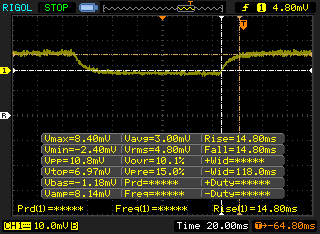 |
| ↘ 14.8 ms ősz | ||
| A képernyő viszonylag lassú reakciósebességet mutat tesztjeinkben, és túl lassú lehet a játékosok számára. Összehasonlításképpen, az összes tesztelt eszköz 0.165 (minimum) és 636 (maximum) ms között mozog. » 40 % of all devices are better. Ez azt jelenti, hogy a mért válaszidő hasonló az összes vizsgált eszköz átlagához (31.1 ms). | ||
Képernyő villogása / PWM (impulzusszélesség-moduláció)
| Képernyő villogása / PWM észlelve | 20000 Hz | ≤ 99 % fényerő beállítása | 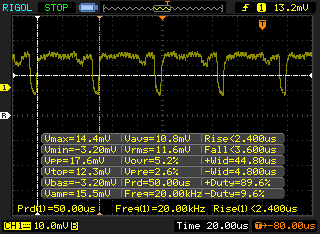 |
A kijelző háttérvilágítása 20000 Hz-en villog (a legrosszabb esetben, pl. PWM használatával) Villódzás észlelve a 99 % vagy annál kisebb fényerő-beállításnál. E fényerő-beállítás felett nem lehet villogás vagy PWM. A 20000 Hz frekvenciája meglehetősen magas, így a legtöbb PWM-re érzékeny felhasználó nem észlel semmilyen villogást. Összehasonlításképpen: az összes tesztelt eszköz 52 %-a nem használja a PWM-et a kijelző elsötétítésére. Ha PWM-et észleltek, akkor átlagosan 7801 (minimum: 5 - maximum: 343500) Hz-t mértek. | |||
| wPrime 2.10 - 1024m | |
| Dell Inspiron 15 7000 7567 Gaming (Core i5-7300HQ, GTX 1050) | |
| Lenovo Legion Y920-17IKB | |
| Lenovo IdeaPad Y50 | |
| Eurocom Q5 | |
| Sager NP5852 | |
| Gigabyte P55 V4 | |
* ... a kisebb jobb
| PCMark 8 | |
| Home Score Accelerated v2 | |
| Lenovo Legion Y920-17IKB | |
| Sager NP5852 | |
| Acer Aspire 5 A515-51G-51RL | |
| Gigabyte Sabre 15G | |
| Acer Aspire F5-771G-50RD | |
| Work Score Accelerated v2 | |
| Lenovo Legion Y920-17IKB | |
| Gigabyte Sabre 15G | |
| Sager NP5852 | |
| Acer Aspire 5 A515-51G-51RL | |
| Acer Aspire F5-771G-50RD | |
| Creative Score Accelerated v2 | |
| Lenovo Legion Y920-17IKB | |
| Sager NP5852 | |
| Acer Aspire 5 A515-51G-51RL | |
| Gigabyte Sabre 15G | |
| PCMark 8 Home Score Accelerated v2 | 3742 pontok | |
| PCMark 8 Creative Score Accelerated v2 | 4741 pontok | |
| PCMark 8 Work Score Accelerated v2 | 5011 pontok | |
| PCMark 10 Score | 3939 pontok | |
Segítség | ||
| Sager NP5852 Western Digital WD Blue PC SSD WDS250G1B0B | Gigabyte Sabre 15G Liteonit CV3-8D128 | Asus ZenBook Pro UX550VD Samsung PM961 NVMe MZVLW512HMJP | Acer Aspire 5 A515-51G-51RL Kingston RBUSNS8180DS3128GH | Acer TravelMate P658-G2-MG-7327 Liteonit CV3-8D512 | Asus AsusPro P4540UQ-FY0056R SK Hynix HFS256G39TND-N210A | |
|---|---|---|---|---|---|---|
| AS SSD | -14% | 215% | -60% | 11% | -34% | |
| Copy Game MB/s (MB/s) | 263.6 | 323.5 23% | 889 237% | 214.6 -19% | 410.4 56% | 168.2 -36% |
| Copy Program MB/s (MB/s) | 191.1 | 195.3 2% | 336.4 76% | 71.1 -63% | 266.9 40% | 123.4 -35% |
| Copy ISO MB/s (MB/s) | 337.5 | 446.8 32% | 1678 397% | 296.7 -12% | 491.5 46% | 266.9 -21% |
| Score Total (Points) | 1027 | 752 -27% | 3731 263% | 1043 2% | 982 -4% | 977 -5% |
| Score Write (Points) | 335 | 234 -30% | 1158 246% | 405 21% | 400 19% | 316 -6% |
| Score Read (Points) | 453 | 337 -26% | 1727 281% | 414 -9% | 379 -16% | 442 -2% |
| Access Time Write * (ms) | 0.054 | 0.073 -35% | 0.028 48% | 0.42 -678% | 0.067 -24% | 0.224 -315% |
| Access Time Read * (ms) | 0.092 | 0.141 -53% | 0.031 66% | 0.191 -108% | 0.068 26% | 0.084 9% |
| 4K-64 Write (MB/s) | 231.4 | 132.2 -43% | 870 276% | 309.5 34% | 293.5 27% | 233.6 1% |
| 4K-64 Read (MB/s) | 372.9 | 257 -31% | 1430 283% | 328.4 -12% | 301.6 -19% | 364.5 -2% |
| 4K Write (MB/s) | 57.5 | 53.8 -6% | 133.2 132% | 52.5 -9% | 58 1% | 63.5 10% |
| 4K Read (MB/s) | 30.12 | 28.3 -6% | 54 79% | 38.73 29% | 27.05 -10% | 27.19 -10% |
| Seq Write (MB/s) | 457.1 | 479.8 5% | 1540 237% | 425 -7% | 488.7 7% | 190.8 -58% |
| Seq Read (MB/s) | 497.6 | 516 4% | 2429 388% | 471.7 -5% | 501 1% | 502 1% |
* ... a kisebb jobb

| 3DMark | |
| 1280x720 Cloud Gate Standard Graphics | |
| Gigabyte Sabre 15G | |
| XFX RX-460P4DFG5 Double Dissipation 4 GB | |
| Gigabyte P55K v5 | |
| Ibuypower Chimera CX-9 | |
| Acer Aspire E5-575G-549D | |
| Desktop PC Intel Xeon E5 2680v4 Zotac GT 1030 | |
| Sager NP5852 | |
| Asus N552VX-FY103T | |
| Acer Aspire 5 A515-51G-51RL | |
| Lenovo IdeaPad 520s-14IKB 80X200C1GE | |
| Apple MacBook Pro 13 2017 | |
| MSI GL62M 7RD-077 | |
| 1920x1080 Fire Strike Graphics | |
| Gigabyte Sabre 15G | |
| XFX RX-460P4DFG5 Double Dissipation 4 GB | |
| Gigabyte P55K v5 | |
| Ibuypower Chimera CX-9 | |
| Sager NP5852 | |
| Desktop PC Intel Xeon E5 2680v4 Zotac GT 1030 | |
| Acer Aspire 5 A515-51G-51RL | |
| Acer Aspire E5-575G-549D | |
| Asus N552VX-FY103T | |
| Lenovo IdeaPad 520s-14IKB 80X200C1GE | |
| Apple MacBook Pro 13 2017 | |
| MSI GL62M 7RD-077 | |
| 3DMark 11 | |
| 1280x720 Performance GPU | |
| XFX RX-460P4DFG5 Double Dissipation 4 GB | |
| Gigabyte Sabre 15G | |
| Gigabyte P55K v5 | |
| Ibuypower Chimera CX-9 | |
| Desktop PC Intel Xeon E5 2680v4 Zotac GT 1030 | |
| Sager NP5852 | |
| Acer Aspire 5 A515-51G-51RL | |
| Asus N552VX-FY103T | |
| Acer Aspire E5-575G-549D | |
| Lenovo IdeaPad 520s-14IKB 80X200C1GE | |
| Apple MacBook Pro 13 2017 | |
| MSI GL62M 7RD-077 | |
| 1280x720 Performance Combined | |
| XFX RX-460P4DFG5 Double Dissipation 4 GB | |
| Gigabyte P55K v5 | |
| Gigabyte Sabre 15G | |
| Ibuypower Chimera CX-9 | |
| Sager NP5852 | |
| Desktop PC Intel Xeon E5 2680v4 Zotac GT 1030 | |
| Acer Aspire 5 A515-51G-51RL | |
| Acer Aspire E5-575G-549D | |
| Asus N552VX-FY103T | |
| Lenovo IdeaPad 520s-14IKB 80X200C1GE | |
| Apple MacBook Pro 13 2017 | |
| MSI GL62M 7RD-077 | |
| 3DMark 11 Performance | 4906 pontok | |
| 3DMark Ice Storm Standard Score | 72119 pontok | |
| 3DMark Cloud Gate Standard Score | 15501 pontok | |
| 3DMark Fire Strike Score | 3353 pontok | |
| 3DMark Fire Strike Extreme Score | 1709 pontok | |
Segítség | ||
| BioShock Infinite - 1920x1080 Ultra Preset, DX11 (DDOF) | |
| Gigabyte Sabre 15G | |
| MSI GL72 6QF | |
| Desktop PC Intel Xeon E5 2680v4 Zotac GT 1030 | |
| Sager NP5852 | |
| Acer Aspire 5 A515-51G-51RL | |
| Medion Erazer P6661 MD 99873 | |
| Samsung Notebook 9 NP900X5N-X01US | |
| Apple MacBook Pro 13 2017 Touchbar i5 | |
| Rise of the Tomb Raider - 1920x1080 Very High Preset AA:FX AF:16x | |
| Gigabyte Sabre 15G | |
| MSI GL72 6QF | |
| Desktop PC Intel Xeon E5 2680v4 Zotac GT 1030 | |
| Sager NP5852 | |
| Acer Aspire 5 A515-51G-51RL | |
| Medion Erazer P6661 MD 99873 | |
| Overwatch - 1920x1080 Epic (Render Scale 100 %) AA:SM AF:16x | |
| Gigabyte Sabre 15G | |
| Sager NP5852 | |
| Desktop PC Intel Xeon E5 2680v4 Zotac GT 1030 | |
| Apple MacBook Pro 13 2017 Touchbar i5 | |
| alacsony | közepes | magas | ultra | |
|---|---|---|---|---|
| Guild Wars 2 (2012) | 95.2 | 51 | 21.2 | |
| StarCraft II: Heart of the Swarm (2013) | 66 | |||
| BioShock Infinite (2013) | 202.9 | 113.8 | 95.4 | 34.9 |
| Metro: Last Light (2013) | 97.4 | 84.6 | 49.8 | 25.6 |
| Thief (2014) | 79.2 | 51.9 | 44.1 | 23.2 |
| The Witcher 3 (2015) | 69 | 42 | 23.5 | 12.6 |
| Batman: Arkham Knight (2015) | 57 | 49 | 22 | 8 |
| Fallout 4 (2015) | 45.8 | 25 | 19.8 | |
| Rise of the Tomb Raider (2016) | 78.4 | 44.6 | 24.5 | 19.2 |
| Ashes of the Singularity (2016) | 35.1 | 20.7 | 17.1 | |
| Overwatch (2016) | 168 | 54.4 | 34.4 | |
| Mafia 3 (2016) | 31.2 | 21.9 | 14 | |
| Prey (2017) | 50.6 | 40 | 34 | |
| Dirt 4 (2017) | 52.9 | 39 | 23.7 | |
| F1 2017 (2017) | 83 | 41 | 32 | 20 |
Zajszint
| Üresjárat |
| 28.7 / 28.7 / 29.3 dB(A) |
| Terhelés |
| 41.6 / 53.7 dB(A) |
 | ||
30 dB csendes 40 dB(A) hallható 50 dB(A) hangos |
||
min: | ||
| Sager NP5852 GeForce MX150, i7-7700HQ, Western Digital WD Blue PC SSD WDS250G1B0B | Gigabyte Sabre 15G GeForce GTX 1050 Mobile, i7-7700HQ, Liteonit CV3-8D128 | Asus ZenBook Pro UX550VD GeForce GTX 1050 Mobile, i7-7700HQ, Samsung PM961 NVMe MZVLW512HMJP | Acer Aspire 5 A515-51G-51RL GeForce MX150, i5-7200U, Kingston RBUSNS8180DS3128GH | Acer TravelMate P658-G2-MG-7327 GeForce 940MX, i7-7500U, Liteonit CV3-8D512 | Asus AsusPro P4540UQ-FY0056R GeForce 940MX, i5-7200U, SK Hynix HFS256G39TND-N210A | |
|---|---|---|---|---|---|---|
| Noise | -11% | 3% | 0% | 4% | 4% | |
| off / környezet * (dB) | 28.3 | 28.2 -0% | 29.4 -4% | 30.1 -6% | 30 -6% | 30.3 -7% |
| Idle Minimum * (dB) | 28.7 | 33 -15% | 29.4 -2% | 30.1 -5% | 30 -5% | 30.3 -6% |
| Idle Average * (dB) | 28.7 | 33.3 -16% | 29.9 -4% | 30.2 -5% | 30 -5% | 30.3 -6% |
| Idle Maximum * (dB) | 29.3 | 34.7 -18% | 29.9 -2% | 30.5 -4% | 30 -2% | 30.3 -3% |
| Load Average * (dB) | 41.6 | 44.5 -7% | 38.3 8% | 41.1 1% | 37.3 10% | 35.4 15% |
| Witcher 3 ultra * (dB) | 39.8 | 49.2 -24% | 39.8 -0% | 40.4 -2% | ||
| Load Maximum * (dB) | 53.7 | 52.8 2% | 39.6 26% | 41.2 23% | 38 29% | 37.2 31% |
* ... a kisebb jobb
(-) A felső oldalon a maximális hőmérséklet 46.8 °C / 116 F, összehasonlítva a 40.4 °C / 105 F átlagával , 21.2 és 68.8 °C között a Gaming osztálynál.
(±) Az alsó maximum 40.8 °C / 105 F-ig melegszik fel, összehasonlítva a 43.2 °C / 110 F átlagával
(+) Üresjáratban a felső oldal átlagos hőmérséklete 26.6 °C / 80 F, összehasonlítva a 33.9 °C / ### eszközátlaggal class_avg_f### F.
(±) A The Witcher 3 játék során a felső oldal átlaghőmérséklete 34.3 °C / 94 F, összehasonlítva a 33.9 °C / ## eszközátlaggal #class_avg_f### F.
(+) A csuklótámasz és az érintőpad eléri a bőr maximális hőmérsékletét (34.8 °C / 94.6 F), ezért nem forrók.
(-) A hasonló eszközök csuklótámasz területének átlagos hőmérséklete 28.8 °C / 83.8 F volt (-6 °C / -10.8 F).
Sager NP5852 hangelemzés
(-) | nem túl hangos hangszórók (67.3 dB)
Basszus 100 - 315 Hz
(-) | szinte nincs basszus – átlagosan 17.5%-kal alacsonyabb a mediánnál
(±) | a basszus linearitása átlagos (10.9% delta az előző frekvenciához)
Közepes 400-2000 Hz
(±) | magasabb középértékek – átlagosan 7.8%-kal magasabb, mint a medián
(-) | a középpontok nem lineárisak (18% delta az előző gyakorisághoz)
Maximum 2-16 kHz
(±) | magasabb csúcsok – átlagosan 5.9%-kal magasabb, mint a medián
(-) | a csúcsok nem lineárisak (19.8% delta az előző frekvenciához képest)
Összességében 100 - 16.000 Hz
(-) | az összhang nem lineáris (41.9% eltérés a mediánhoz képest)
Ugyanazon osztályhoz képest
» 99%Ebben az osztályban az összes tesztelt eszköz %-a jobb volt, 0% hasonló, 0%-kal rosszabb
» A legjobb delta értéke 6%, az átlag 18%, a legrosszabb 132% volt
Az összes tesztelt eszközzel összehasonlítva
» 95% az összes tesztelt eszköz jobb volt, 0% hasonló, 4%-kal rosszabb
» A legjobb delta értéke 4%, az átlag 24%, a legrosszabb 134% volt
Apple MacBook 12 (Early 2016) 1.1 GHz hangelemzés
(+) | a hangszórók viszonylag hangosan tudnak játszani (83.6 dB)
Basszus 100 - 315 Hz
(±) | csökkentett basszus – átlagosan 11.3%-kal alacsonyabb, mint a medián
(±) | a basszus linearitása átlagos (14.2% delta az előző frekvenciához)
Közepes 400-2000 Hz
(+) | kiegyensúlyozott középpontok – csak 2.4% választja el a mediántól
(+) | a középpontok lineárisak (5.5% delta az előző frekvenciához)
Maximum 2-16 kHz
(+) | kiegyensúlyozott csúcsok – csak 2% választja el a mediántól
(+) | a csúcsok lineárisak (4.5% delta az előző frekvenciához képest)
Összességében 100 - 16.000 Hz
(+) | általános hangzás lineáris (10.2% eltérés a mediánhoz képest)
Ugyanazon osztályhoz képest
» 7%Ebben az osztályban az összes tesztelt eszköz %-a jobb volt, 2% hasonló, 91%-kal rosszabb
» A legjobb delta értéke 5%, az átlag 18%, a legrosszabb 53% volt
Az összes tesztelt eszközzel összehasonlítva
» 5% az összes tesztelt eszköz jobb volt, 1% hasonló, 94%-kal rosszabb
» A legjobb delta értéke 4%, az átlag 24%, a legrosszabb 134% volt
| Kikapcsolt állapot / Készenlét | |
| Üresjárat | |
| Terhelés |
|
Kulcs:
min: | |
| Sager NP5852 i7-7700HQ, GeForce MX150, Western Digital WD Blue PC SSD WDS250G1B0B, IPS, 1920x1080, 15.6" | Gigabyte Sabre 15G i7-7700HQ, GeForce GTX 1050 Mobile, Liteonit CV3-8D128, IPS, 1920x1080, 15.6" | Acer Aspire 5 A515-51G-51RL i5-7200U, GeForce MX150, Kingston RBUSNS8180DS3128GH, IPS, 1920x1080, 15.6" | Acer TravelMate P658-G2-MG-7327 i7-7500U, GeForce 940MX, Liteonit CV3-8D512, IPS, 1920x1080, 15.6" | Asus N552VX-FY103T 6700HQ, GeForce GTX 950M, Toshiba MQ02ABD100H, AH-IPS, 1920x1080, 15.6" | HP Pavilion 15 UHD T9Y85AV 6700HQ, GeForce GTX 960M, SanDisk Z400s SD8SNAT-128G, IPS, 3840x2160, 15.6" | Lenovo ThinkPad T470p-20J7S00000 i7-7700HQ, GeForce 940MX, Samsung PM961 NVMe MZVLW512HMJP, IPS, 2560x1440, 14" | |
|---|---|---|---|---|---|---|---|
| Power Consumption | -16% | 35% | 29% | -5% | -24% | 25% | |
| Idle Minimum * (Watt) | 9.2 | 8 13% | 2.9 68% | 3.9 58% | 7 24% | 8.3 10% | 3.8 59% |
| Idle Average * (Watt) | 11.2 | 10.9 3% | 5.9 47% | 7.9 29% | 10.9 3% | 14.8 -32% | 6.5 42% |
| Idle Maximum * (Watt) | 11.3 | 11 3% | 6.4 43% | 11.3 -0% | 12.9 -14% | 16.8 -49% | 7.2 36% |
| Load Average * (Watt) | 71.3 | 76.7 -8% | 54 24% | 47 34% | 72 -1% | 71 -0% | 62.5 12% |
| Witcher 3 ultra * (Watt) | 54.8 | 94.9 -73% | 51 7% | ||||
| Load Maximum * (Watt) | 80.1 | 106.4 -33% | 66 18% | 62 23% | 109 -36% | 119.2 -49% | 99.6 -24% |
* ... a kisebb jobb
| Sager NP5852 i7-7700HQ, GeForce MX150, 62 Wh | Gigabyte Sabre 15G i7-7700HQ, GeForce GTX 1050 Mobile, 47 Wh | Asus ZenBook Pro UX550VD i7-7700HQ, GeForce GTX 1050 Mobile, 73 Wh | Acer Aspire 5 A515-51G-51RL i5-7200U, GeForce MX150, 48 Wh | Acer TravelMate P658-G2-MG-7327 i7-7500U, GeForce 940MX, 55 Wh | Acer Aspire F5-771G-50RD i5-7200U, GeForce GTX 950M, 40 Wh | |
|---|---|---|---|---|---|---|
| Akkumulátor üzemidő | -20% | 41% | 73% | 42% | -21% | |
| Reader / Idle (h) | 8.3 | 8.2 -1% | 17.7 113% | 20.9 152% | 7.2 -13% | |
| WiFi v1.3 (h) | 5.9 | 4.4 -25% | 8.9 51% | 8.6 46% | 8.4 42% | 4.5 -24% |
| Load (h) | 2 | 1.3 -35% | 1.2 -40% | 2.4 20% | 1.5 -25% | |
| Witcher 3 ultra (h) | 1.1 |
Pro
Kontra

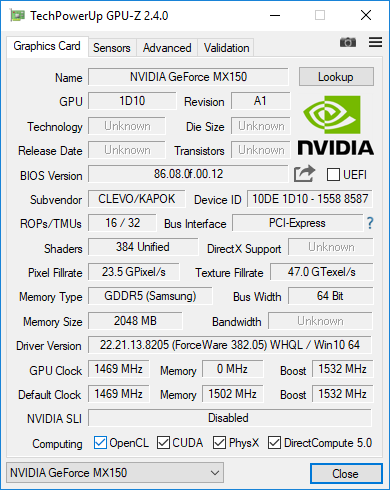
A teljesítmény terén az MX150 játékos potenciálja lenyűgöző, ha a Sabre 15-höz (GTX 1050) képest mutatott 40%-kal kisebb fogyasztását és csak 40-45 %-kal kisebb sebességét vesszük figyelembe. A hőmérséklete és zaja is jelentősen alacsonyabb, míg suli vagy munka után kellemes játékképességet kínál. Meglepő, de a korábbi GTX 860M vagy GTX 950M gaming notebook szintjén mozog belépő szintű Pascal GPU-jával.
Fő problémáink a NP5852-vel nem is annyira a teljesítményhez kapcsolódnak, hanem az árához és házához. Először is, a 800 USD kezdőár igen közel van a Sabre 15, Samsung Odyssey, vagy éppen a Pavilion 15 Power árához, és azokban gyorsabb, GTX 1050 videokártya van. A potenciális vásárlóknak csak 100-200 dollárral kell többet kipengetniük egy nagyon nagy GPU erőbeli ugrásért, amennyiben a játék kiemelt fontosságú szempont. Másodszor, a ház meglehetősen nagy a belépő szintű MX150-nek. A fenti vetélytársak nem jelentősen nagyobbak, vagy vastagabbak, mint a Sager, amelynek egy kisebb, ultrabook-jellegű ház elegendő lett volna. Az MX150 párosítása egy Intel U-osztállyal ugyan valamivel csökkentette volna a játékteljesítményt - amint az az Aspire 5 A515-tel történő összehasonlításkor látszott is -, de a sokkal kisebb tömeg, és nagyobb hordozhatóság valószínűleg ellensúlyozta volna a hátrányokat a legtöbb hétvégi gamer számára.
A Sager NP5852 egy remek iskolai, hétvégi gamer gép. Pár hónapot érdemes várni, amikorra a piacon több MX150 GPU-s gép lesz, kisebb és vékonyabb kivitelben. A NP5852 ára addigra távolabb ereszkedhet a jelenlegi olcsó GTX 1050-es notebookoktól, amivel már ajánlható készülék lesz.
Ez az eredeti értékelés rövidített változata. A teljes, angol nyelvű cikk itt olvasható.
Sager NP5852
- 09/21/2017 v6 (old)
Allen Ngo
Price comparison
