Apple MacBook Pro 13 (Mid 2017, i5, Touch Bar) rövid értékelés
| |||||||||||||||||||||||||
Fényerő megoszlás: 88 %
Centrumban: 502 cd/m²
Kontraszt: 1148:1 (Fekete: 0.48 cd/m²)
ΔE ColorChecker Calman: 0.8 | ∀{0.5-29.43 Ø4.72}
ΔE Greyscale Calman: 1 | ∀{0.09-98 Ø4.97}
86.5% AdobeRGB 1998 (Argyll 3D)
100% sRGB (Argyll 3D)
98.6% Display P3 (Argyll 3D)
Gamma: 2.16
CCT: 6672 K
| Apple MacBook Pro 13 2017 Touchbar i5 APPA034, , 2560x1600, 13.3" | Apple MacBook Pro 13 2016 (2.9 GHz) APPA033, , 2560x1600, 13.3" | Apple MacBook Pro 13 2016 APPA034, , 2560x1600, 13.3" | Dell XPS 13 9360 QHD+ i5 Sharp SHP144A, , 3200x1800, 13.3" | Lenovo ThinkPad X1 Carbon 2017-20HQS03P00 B140HAN03_1, , 1920x1080, 14" | |
|---|---|---|---|---|---|
| Display | 1% | -1% | -22% | -27% | |
| Display P3 Coverage (%) | 98.6 | 99.2 1% | 97.1 -2% | 64.6 -34% | 61.4 -38% |
| sRGB Coverage (%) | 100 | 99.9 0% | 99.8 0% | 91.6 -8% | 85.9 -14% |
| AdobeRGB 1998 Coverage (%) | 86.5 | 87.6 1% | 86.7 0% | 66.5 -23% | 62.4 -28% |
| Response Times | -28% | -26% | 21% | 10% | |
| Response Time Grey 50% / Grey 80% * (ms) | 48 ? | 47.2 ? 2% | 47.2 ? 2% | 31 ? 35% | 41.6 ? 13% |
| Response Time Black / White * (ms) | 33.6 ? | 53 ? -58% | 51.6 ? -54% | 31.2 ? 7% | 31.6 ? 6% |
| PWM Frequency (Hz) | 119000 ? | ||||
| Screen | -35% | -38% | -129% | -210% | |
| Brightness middle (cd/m²) | 551 | 569 3% | 600 9% | 444 -19% | 311 -44% |
| Brightness (cd/m²) | 514 | 542 5% | 564 10% | 393 -24% | 288 -44% |
| Brightness Distribution (%) | 88 | 90 2% | 89 1% | 82 -7% | 85 -3% |
| Black Level * (cd/m²) | 0.48 | 0.56 -17% | 0.57 -19% | 0.33 31% | 0.24 50% |
| Contrast (:1) | 1148 | 1016 -11% | 1053 -8% | 1345 17% | 1296 13% |
| Colorchecker dE 2000 * | 0.8 | 1.4 -75% | 1.5 -88% | 4 -400% | 5.5 -588% |
| Colorchecker dE 2000 max. * | 1.4 | 2.9 -107% | 2.9 -107% | 7.7 -450% | 9 -543% |
| Greyscale dE 2000 * | 1 | 1.8 -80% | 2 -100% | 2.83 -183% | 6.2 -520% |
| Gamma | 2.16 102% | 2.16 102% | 2.27 97% | 2.05 107% | 2.02 109% |
| CCT | 6672 97% | 6877 95% | 6855 95% | 6963 93% | 5950 109% |
| Color Space (Percent of AdobeRGB 1998) (%) | 78.4 | 77 | 59.3 | 55.96 | |
| Color Space (Percent of sRGB) (%) | 99.3 | 92 | 91.4 | 85.77 | |
| Teljes átlag (program / beállítások) | -21% /
-26% | -22% /
-27% | -43% /
-81% | -76% /
-134% |
* ... a kisebb jobb
| Cinebench R15 | |
| CPU Single 64Bit | |
| Acer Predator 17 G9-793-70PJ | |
| Dell XPS 13 9360 FHD i7 Iris | |
| Lenovo ThinkPad X1 Carbon 2017-20HQS03P00 | |
| Apple MacBook Pro 13 2017 Touchbar i5 | |
| Apple MacBook Pro 13 2016 (2.9 GHz) | |
| CPU Multi 64Bit | |
| Acer Predator 17 G9-793-70PJ | |
| Apple MacBook Pro 13 2017 Touchbar i5 | |
| Lenovo ThinkPad X1 Carbon 2017-20HQS03P00 | |
| Apple MacBook Pro 13 2016 (2.9 GHz) | |
| Dell XPS 13 9360 FHD i7 Iris | |
| PCMark 8 | |
| Home Score Accelerated v2 | |
| Lenovo ThinkPad X1 Carbon 2017-20HQS03P00 | |
| Dell XPS 13 9360 FHD i7 Iris | |
| Apple MacBook Pro 13 2017 Touchbar i5 | |
| Apple MacBook Pro 13 2016 (2.9 GHz) | |
| Apple MacBook Pro 13 2016 | |
| Work Score Accelerated v2 | |
| Lenovo ThinkPad X1 Carbon 2017-20HQS03P00 | |
| Dell XPS 13 9360 FHD i7 Iris | |
| Apple MacBook Pro 13 2016 (2.9 GHz) | |
| Apple MacBook Pro 13 2017 Touchbar i5 | |
| Apple MacBook Pro 13 2016 | |
| PCMark 8 Home Score Accelerated v2 | 3829 pontok | |
| PCMark 8 Creative Score Accelerated v2 | 5188 pontok | |
| PCMark 8 Work Score Accelerated v2 | 4081 pontok | |
| PCMark 10 Score | 3427 pontok | |
Segítség | ||
| Apple MacBook Pro 13 2017 Touchbar i5 Apple SSD AP0256 | Apple MacBook Pro 13 2016 (2.9 GHz) Apple SSD AP0256 | Apple MacBook Pro 13 2016 Apple SSD AP0256 | Lenovo ThinkPad X1 Carbon 2017-20HQS03P00 Samsung PM961 NVMe MZVLW512HMJP | Dell XPS 13 9360 QHD+ i5 Toshiba NVMe THNSN5256GPUK | |
|---|---|---|---|---|---|
| CrystalDiskMark 3.0 | 42% | 36% | 263% | 148% | |
| Read Seq (MB/s) | 1540 | 1662 8% | 1345 -13% | 1827 19% | 1168 -24% |
| Write Seq (MB/s) | 1353 | 1336 -1% | 1320 -2% | 1383 2% | 329 -76% |
| Read 512 (MB/s) | 926 | 1183 28% | 831 -10% | 814 -12% | 1015 10% |
| Write 512 (MB/s) | 698 | 1481 112% | 1486 113% | 1098 57% | 307 -56% |
| Read 4k (MB/s) | 9.92 | 16.1 62% | 31.68 219% | 61 515% | 33 233% |
| Write 4k (MB/s) | 10.74 | 23.5 119% | 11.02 3% | 172.2 1503% | 132 1129% |
| Read 4k QD32 (MB/s) | 618 | 657 6% | 533 -14% | 601 -3% | 525 -15% |
| Write 4k QD32 (MB/s) | 403.8 | 419 4% | 362 -10% | 495.6 23% | 325 -20% |
| AS SSD | 21% | -2% | 181% | -68% | |
| Seq Read (MB/s) | 2327 | 2405 3% | 2275 -2% | 2434 5% | 1412 -39% |
| Seq Write (MB/s) | 1364 | 1499 10% | 1435 5% | 1506 10% | 46 -97% |
| 4K Read (MB/s) | 12.7 | 18.8 48% | 13.3 5% | 56.8 347% | |
| 4K Write (MB/s) | 19.3 | 26.1 35% | 15.4 -20% | 151.1 683% | |
| 4K-64 Read (MB/s) | 852 | 894 5% | 904 6% | 1022 20% | |
| 4K-64 Write (MB/s) | 419 | 448 7% | 417 0% | 905 116% | |
| Access Time Read * (ms) | 0.26 | 0.156 40% | 0.288 -11% | 0.028 89% | |
| Access Time Write * (ms) | 0.027 | ||||
| Teljes átlag (program / beállítások) | 32% /
32% | 17% /
18% | 222% /
225% | 40% /
105% |
* ... a kisebb jobb

| 3DMark 11 - 1280x720 Performance GPU | |
| Apple MacBook Pro 15 2016 (2.6 GHz, 450) | |
| Apple MacBook Pro 13 2017 Touchbar i5 | |
| Apple MacBook Pro 13 2016 (2.9 GHz) | |
| Apple MacBook Pro 13 2016 | |
| Dell XPS 13 9360 FHD i7 Iris | |
| Lenovo ThinkPad X1 Carbon 2017-20HQS03P00 | |
| 3DMark | |
| 1280x720 Cloud Gate Standard Graphics | |
| Apple MacBook Pro 15 2016 (2.6 GHz, 450) | |
| Apple MacBook Pro 13 2016 (2.9 GHz) | |
| Apple MacBook Pro 13 2017 Touchbar i5 | |
| Dell XPS 13 9360 FHD i7 Iris | |
| Apple MacBook Pro 13 2016 | |
| Lenovo ThinkPad X1 Carbon 2017-20HQS03P00 | |
| 1920x1080 Fire Strike Graphics | |
| Apple MacBook Pro 15 2016 (2.6 GHz, 450) | |
| Apple MacBook Pro 13 2017 Touchbar i5 | |
| Apple MacBook Pro 13 2016 (2.9 GHz) | |
| Apple MacBook Pro 13 2016 | |
| Dell XPS 13 9360 FHD i7 Iris | |
| Lenovo ThinkPad X1 Carbon 2017-20HQS03P00 | |
| 3DMark 06 Standard Score | 15175 pontok | |
| 3DMark 11 Performance | 2924 pontok | |
| 3DMark Cloud Gate Standard Score | 8403 pontok | |
| 3DMark Fire Strike Score | 1586 pontok | |
| 3DMark Time Spy Score | 623 pontok | |
Segítség | ||
(±) A felső oldalon a maximális hőmérséklet 43 °C / 109 F, összehasonlítva a 35.9 °C / 97 F átlagával , 21.4 és 59 °C között a Subnotebook osztálynál.
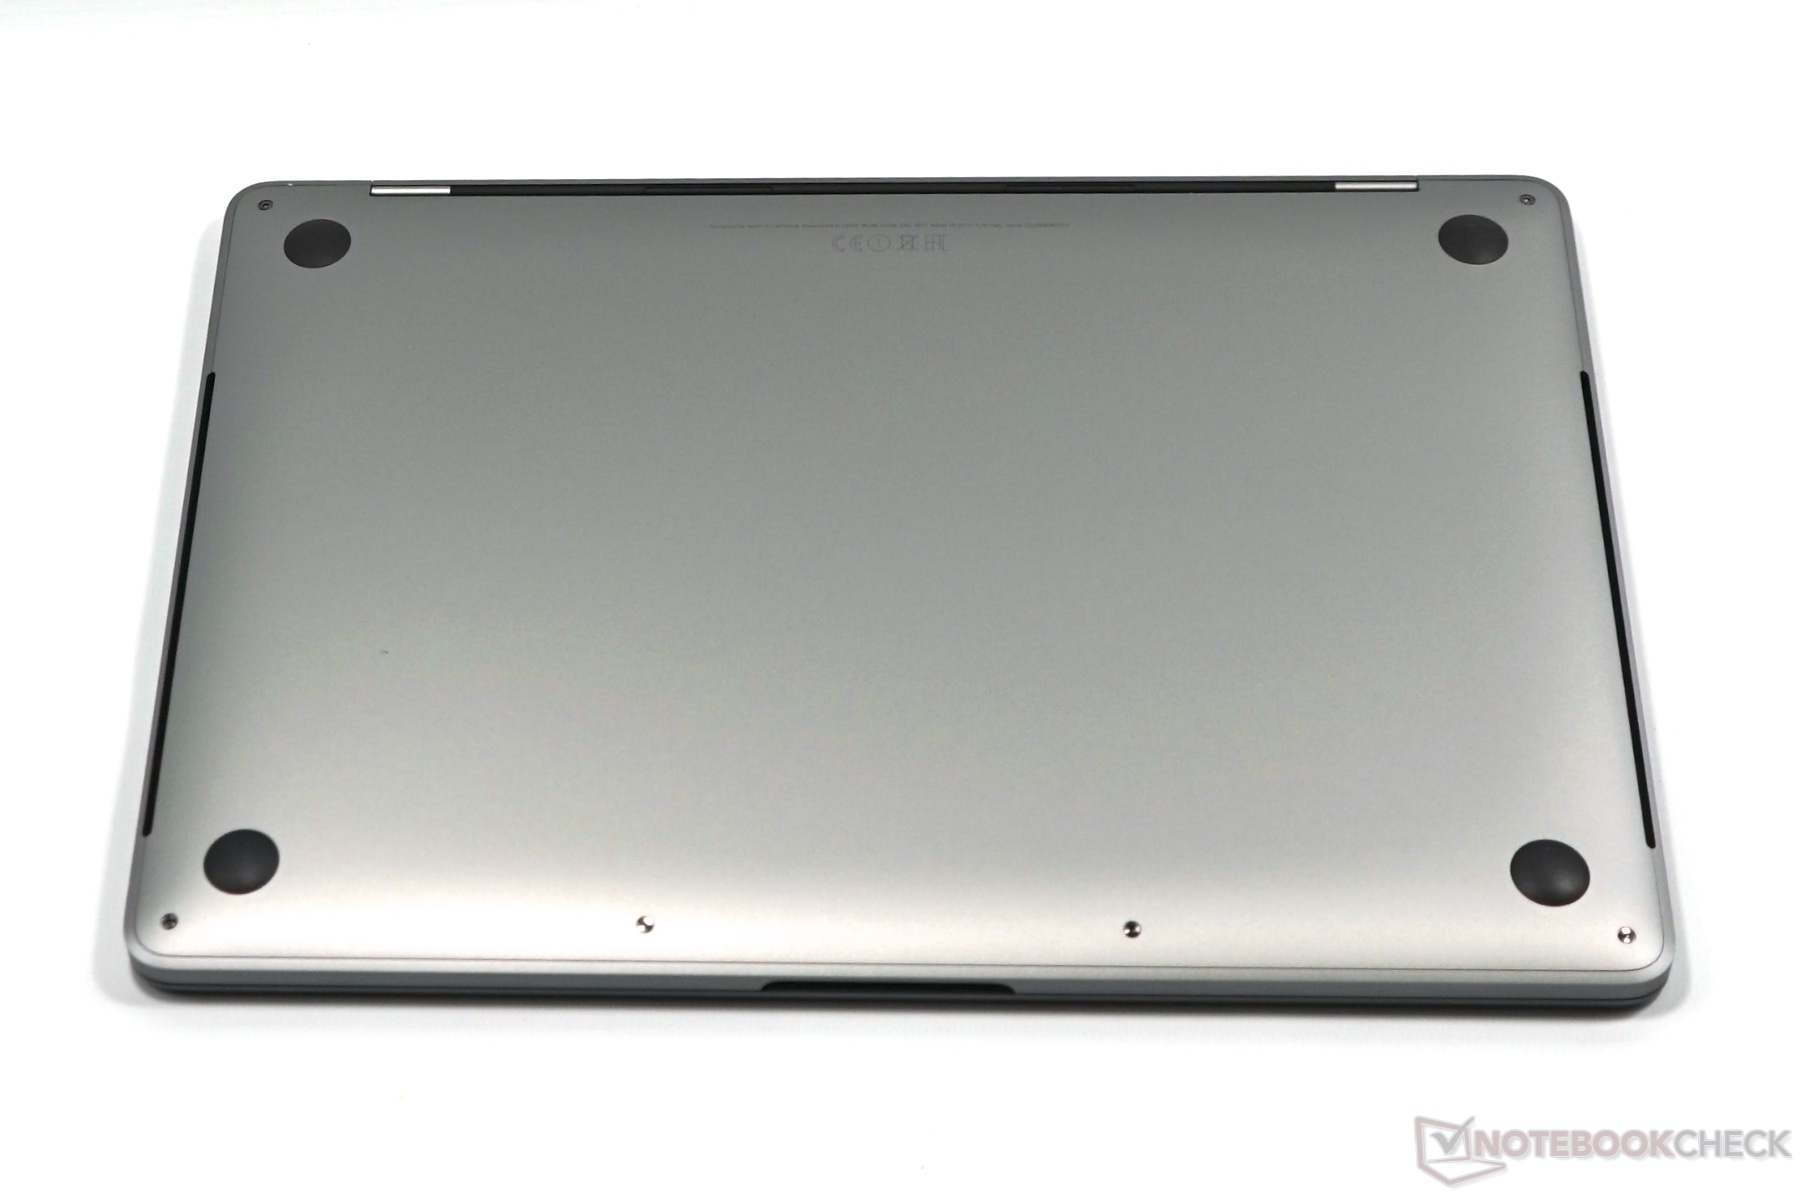
(+) Az alsó maximum 39 °C / 102 F-ig melegszik fel, összehasonlítva a 39.2 °C / 103 F átlagával
(+) Üresjáratban a felső oldal átlagos hőmérséklete 23.7 °C / 75 F, összehasonlítva a 30.8 °C / ### eszközátlaggal class_avg_f### F.
(±) A The Witcher 3 játék során a felső oldal átlaghőmérséklete 35.6 °C / 96 F, összehasonlítva a 30.8 °C / ## eszközátlaggal #class_avg_f### F.
(+) A csuklótámasz és az érintőpad hűvösebb, mint a bőr hőmérséklete, maximum 31 °C / 87.8 F, ezért hűvös tapintású.
(-) A hasonló eszközök csuklótámasz területének átlagos hőmérséklete 28.2 °C / 82.8 F volt (-2.8 °C / -5 F).
| Apple MacBook Pro 13 2017 Touchbar i5 Iris Plus Graphics 650, i5-7267U, Apple SSD AP0256 | Apple MacBook Pro 13 2016 (2.9 GHz) Iris Graphics 550, 6267U, Apple SSD AP0256 | Apple MacBook Pro 13 2016 Iris Graphics 540, 6360U, Apple SSD AP0256 | Lenovo ThinkPad X1 Carbon 2017-20HQS03P00 HD Graphics 620, i7-7500U, Samsung PM961 NVMe MZVLW512HMJP | Dell XPS 13 9360 QHD+ i5 HD Graphics 620, i5-7200U, Toshiba NVMe THNSN5256GPUK | |
|---|---|---|---|---|---|
| Heat | -2% | -4% | -5% | -11% | |
| Maximum Upper Side * (°C) | 43 | 45 -5% | 42 2% | 48 -12% | 40 7% |
| Maximum Bottom * (°C) | 39 | 39 -0% | 41 -5% | 47.2 -21% | 42 -8% |
| Idle Upper Side * (°C) | 25 | 26 -4% | 26 -4% | 23.5 6% | 28 -12% |
| Idle Bottom * (°C) | 24 | 24 -0% | 26 -8% | 22.6 6% | 31 -29% |
* ... a kisebb jobb
| Apple MacBook Pro 13 2017 Touchbar i5 i5-7267U, Iris Plus Graphics 650, 49.2 Wh | Apple MacBook Pro 13 2016 (2.9 GHz) 6267U, Iris Graphics 550, 49.2 Wh | Apple MacBook Pro 13 2016 6360U, Iris Graphics 540, 54 Wh | Lenovo ThinkPad X1 Carbon 2017-20HQS03P00 i7-7500U, HD Graphics 620, 57 Wh | Dell XPS 13 9360 QHD+ i5 i5-7200U, HD Graphics 620, 60 Wh | |
|---|---|---|---|---|---|
| Akkumulátor üzemidő | |||||
| WiFi v1.3 (h) | 8.7 | 9.4 8% | 11.4 31% | 8.3 -5% | 8.8 1% |
Gyakorlatilag bemásolhatnánk ide a tavalyi modell verdiktjét, annyira nem sok változott az új kiadásban. A Kaby Lake-es processzor kicsit gyorsabb, de a GPU teljesítménye nem lett jobb. Az energiahatékonyság kérdése érdekes, mert a nagyobb MacBook Pro 15 dedikált (és sokkal gyorsabb) GPU-jával sem fogyaszt többet játék közben. Esetleg az Apple a következő MBP 13 kiadásokban is használhatna dedikált videokártyát majd.
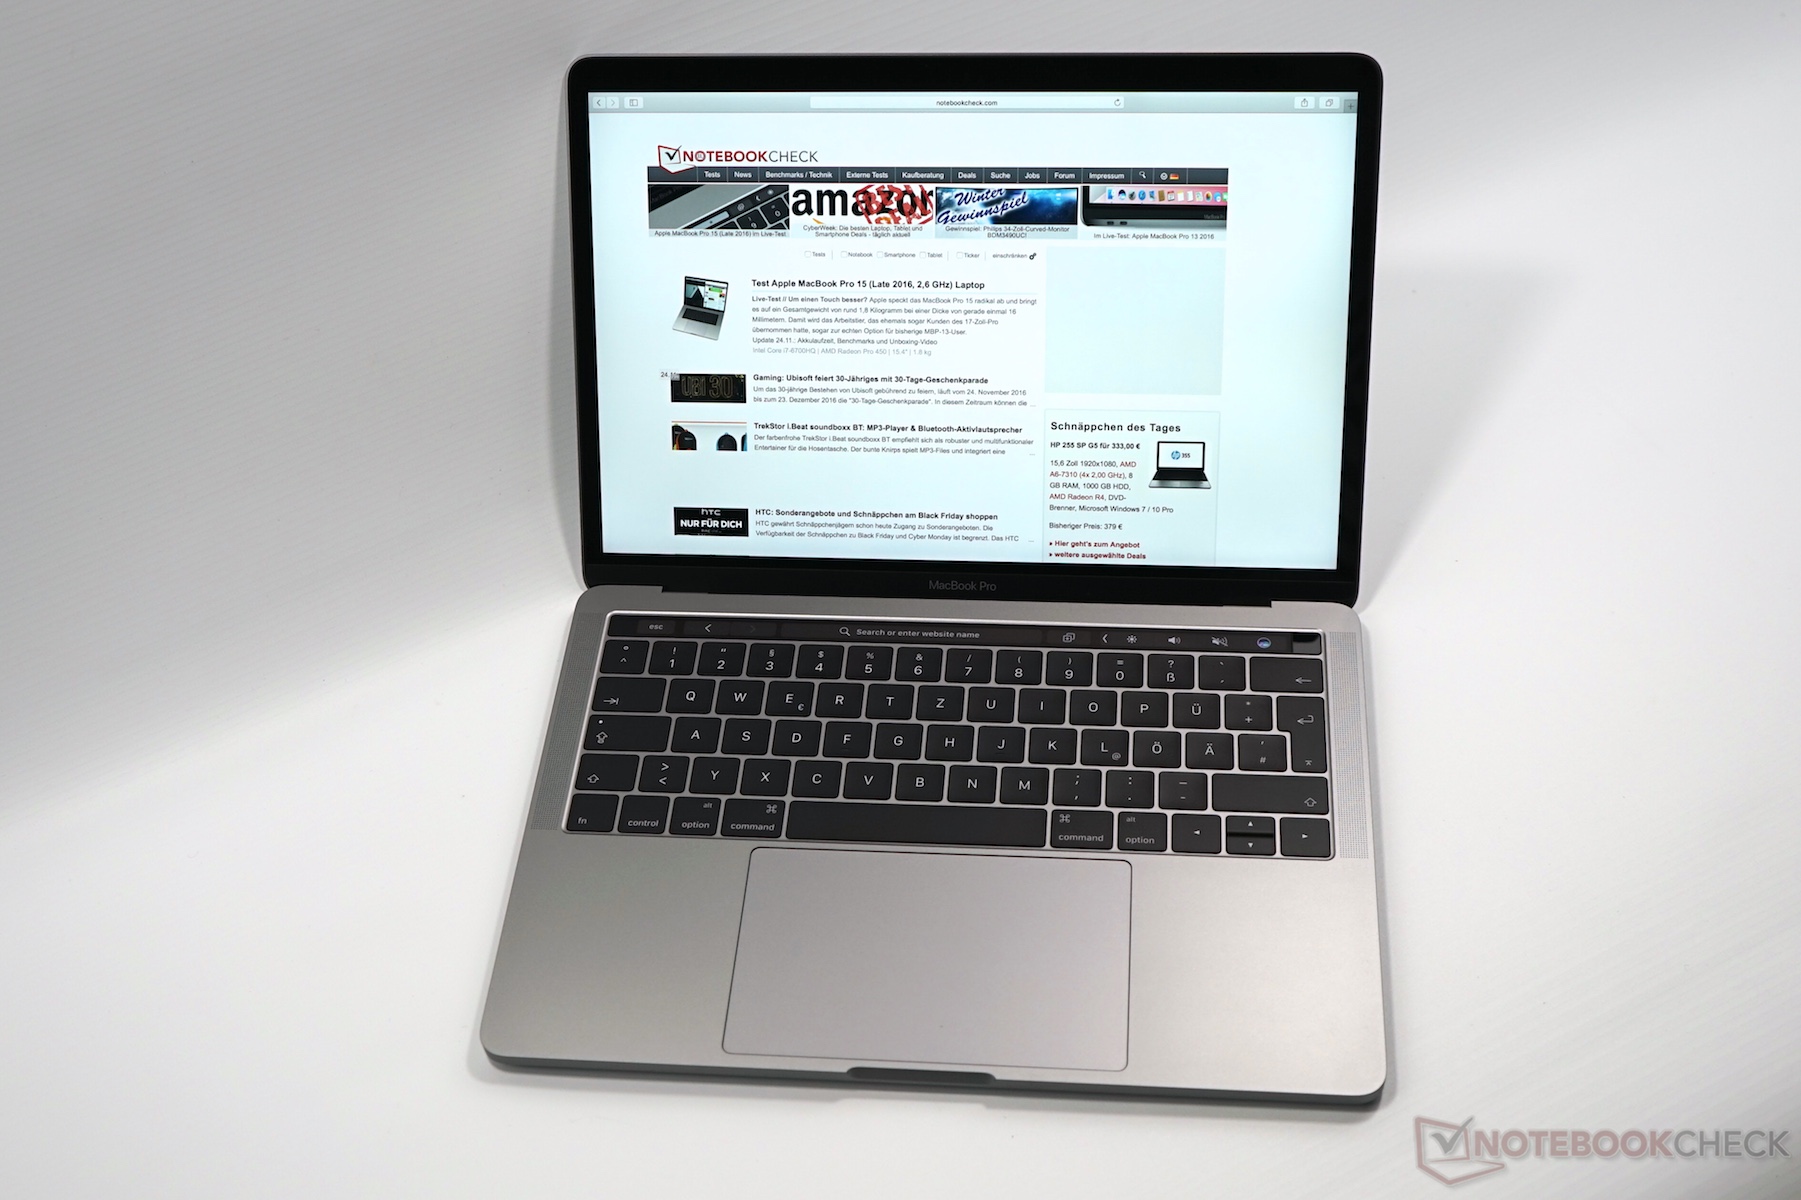
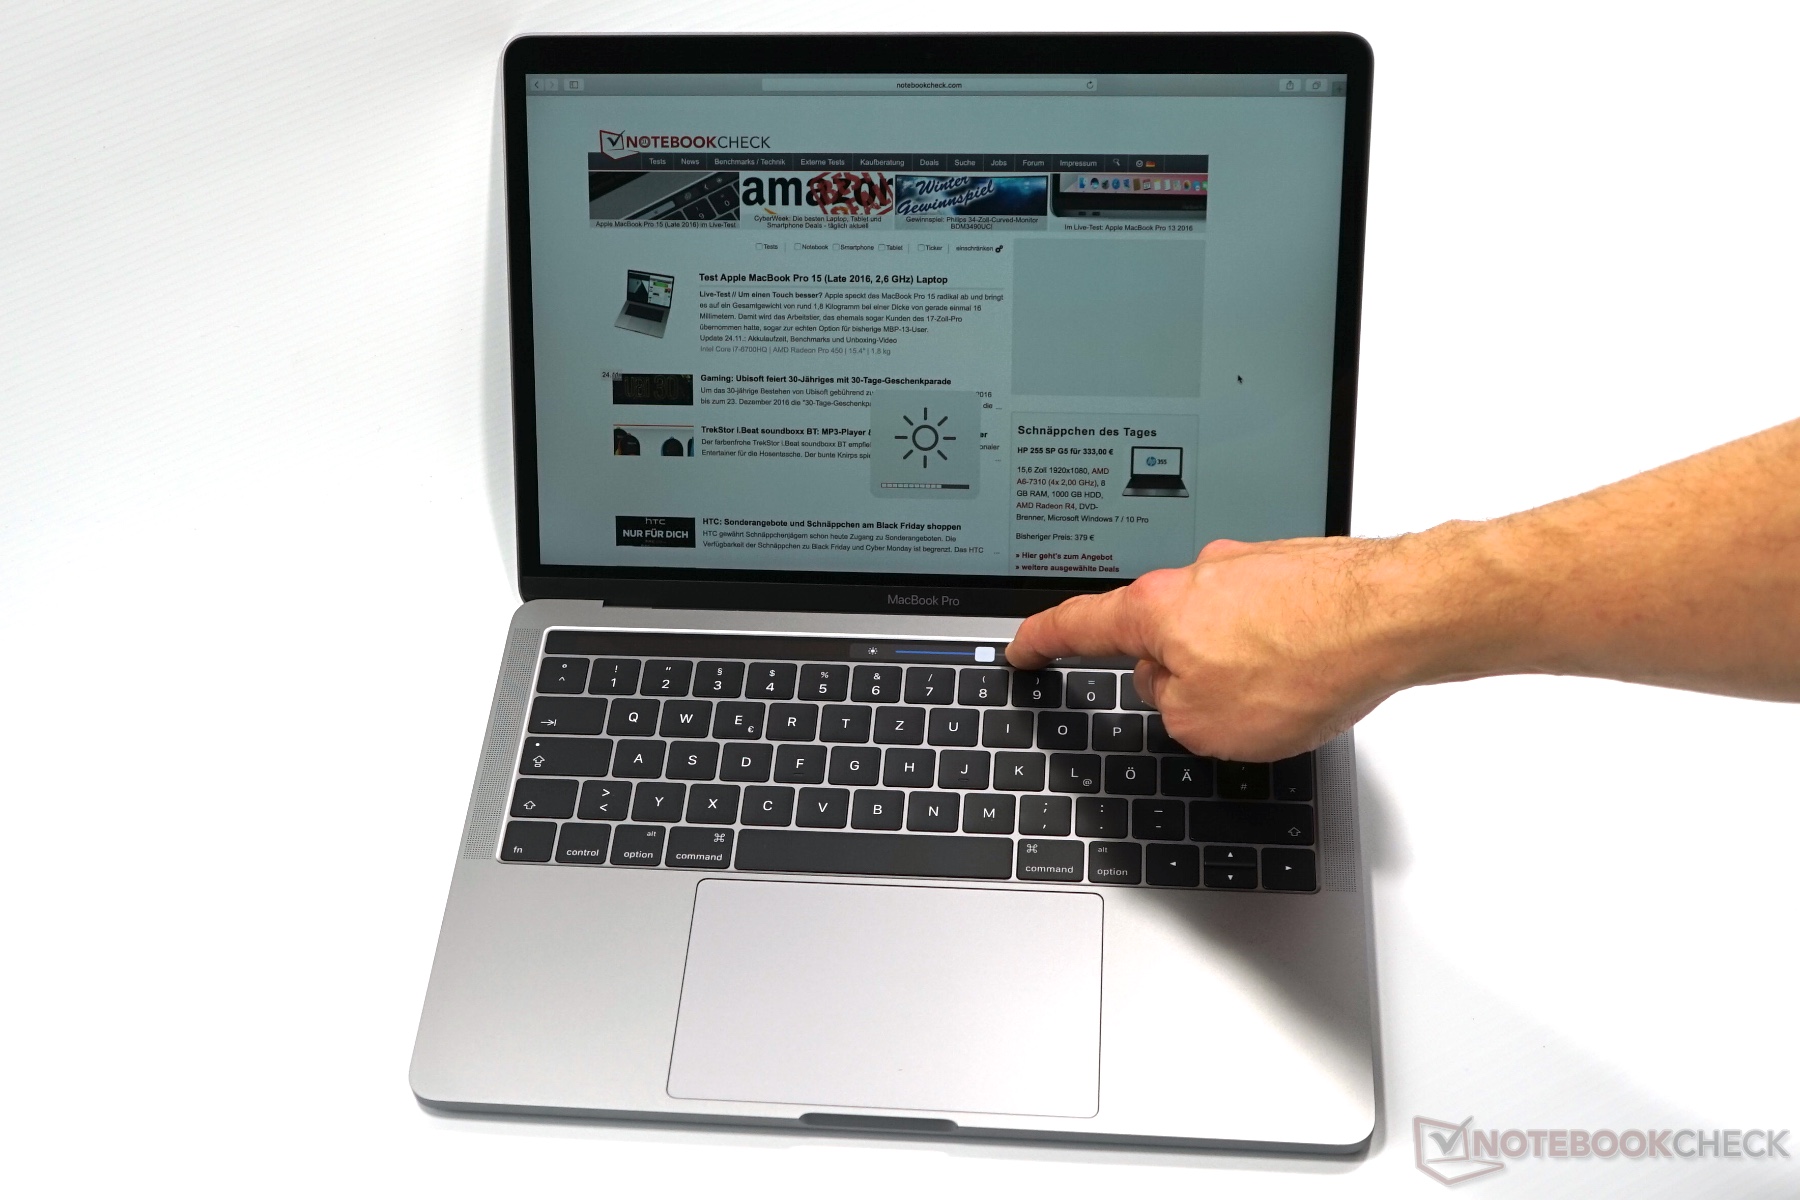
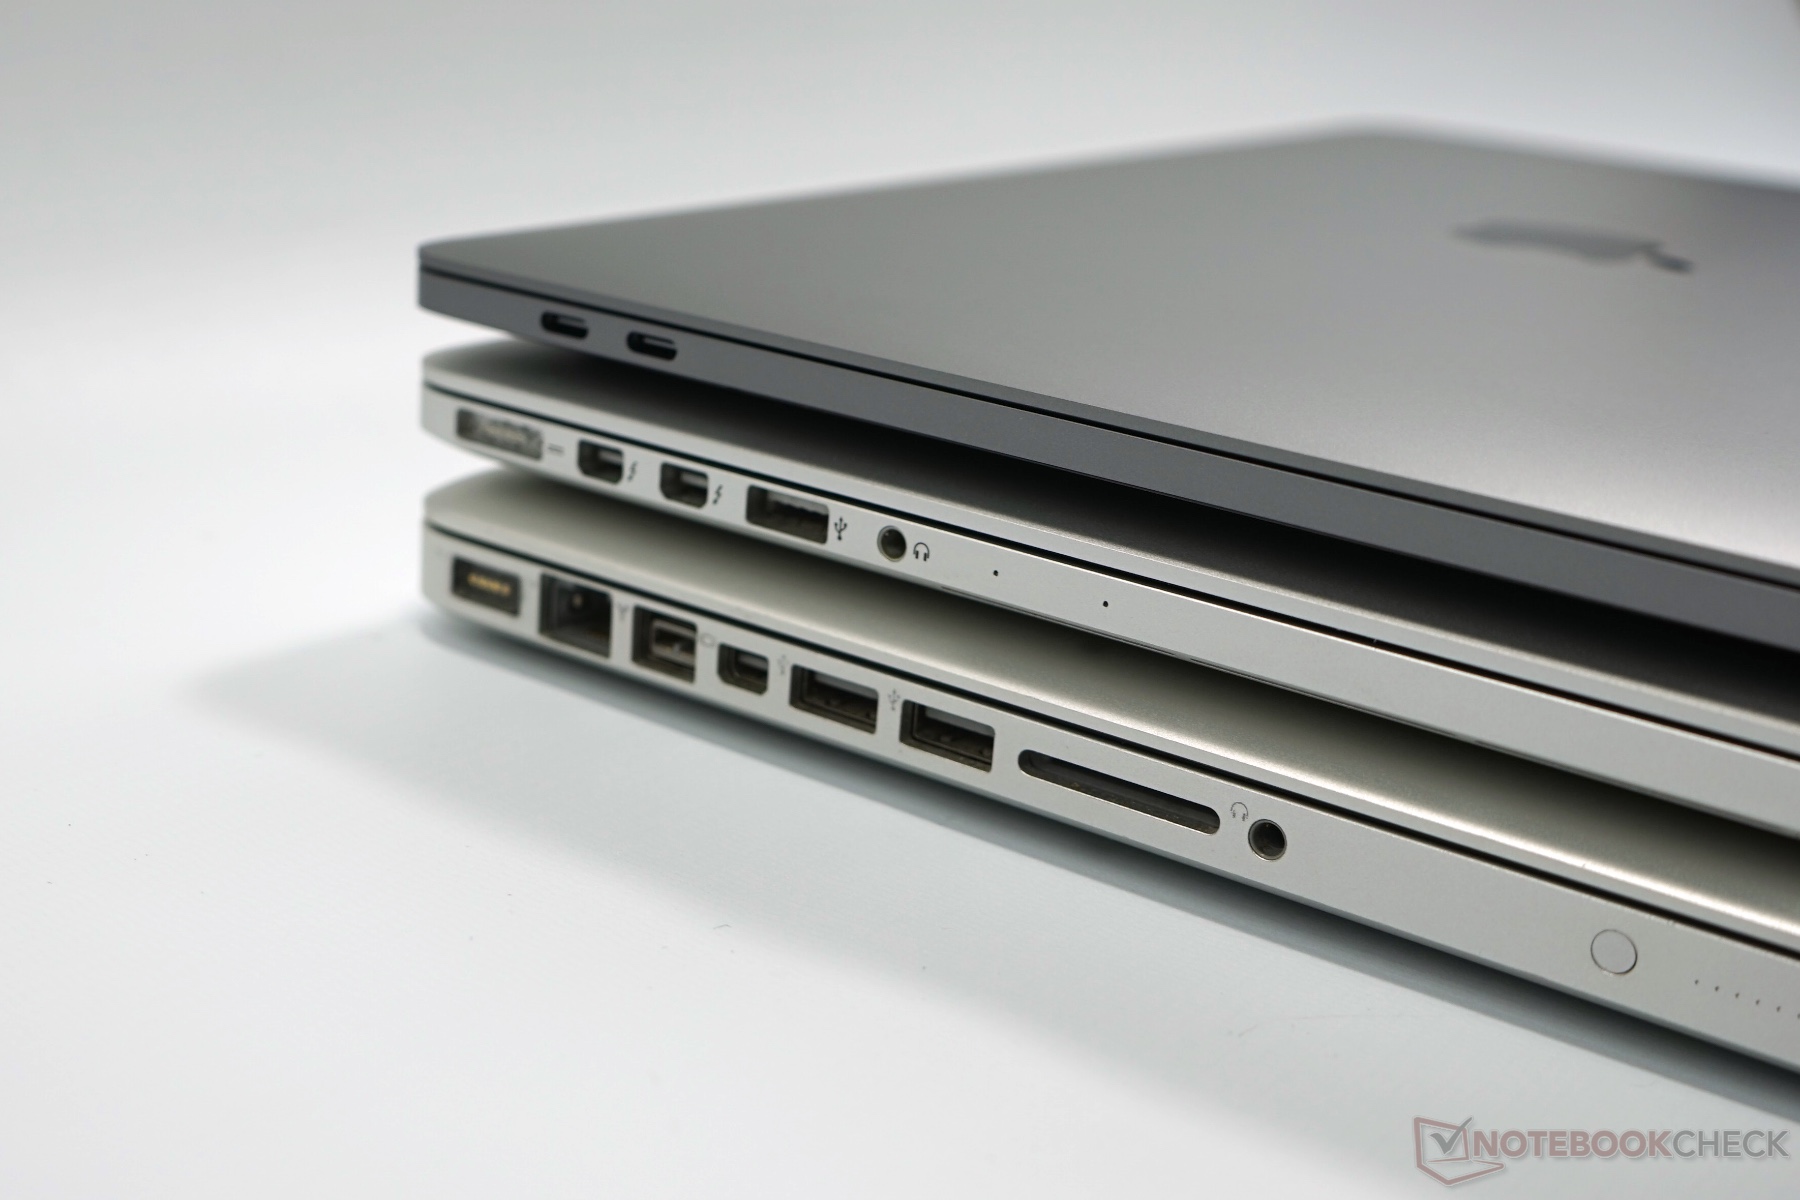
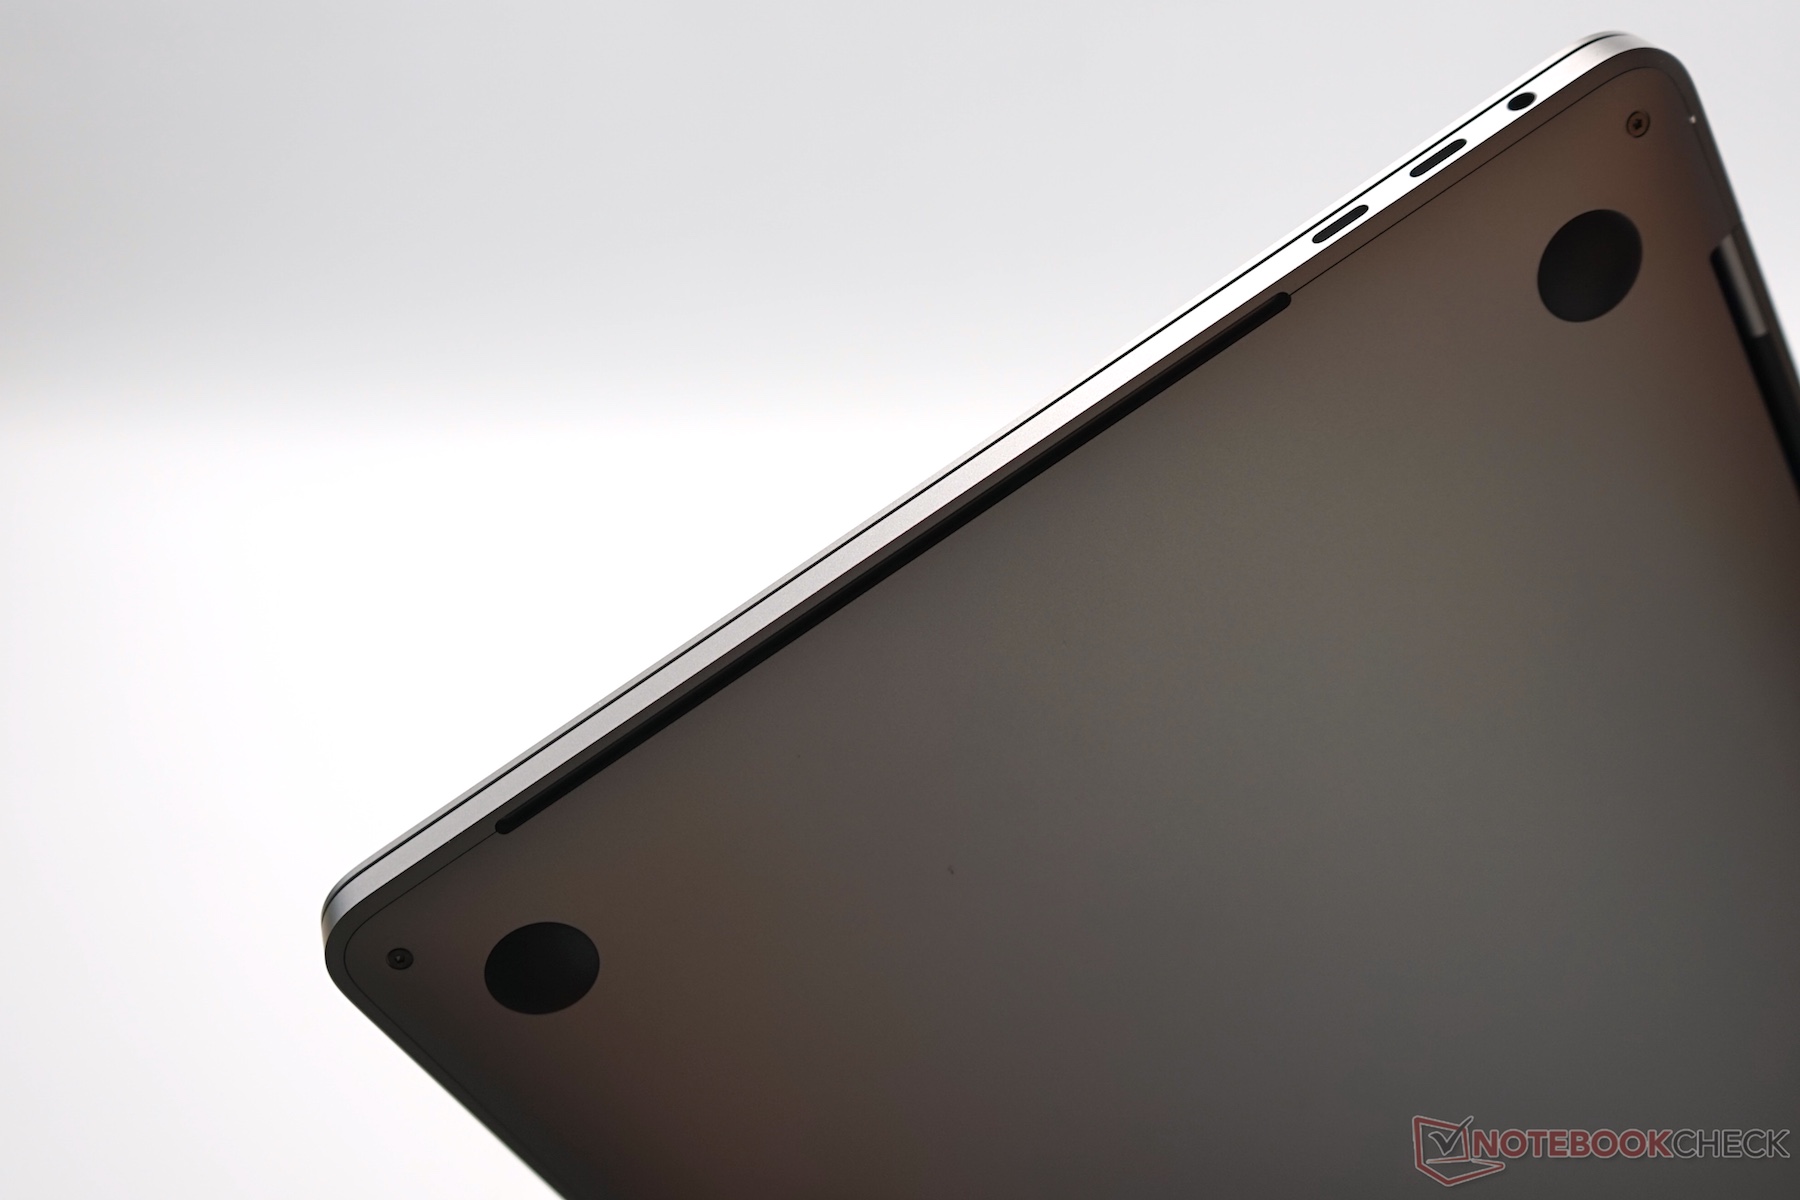
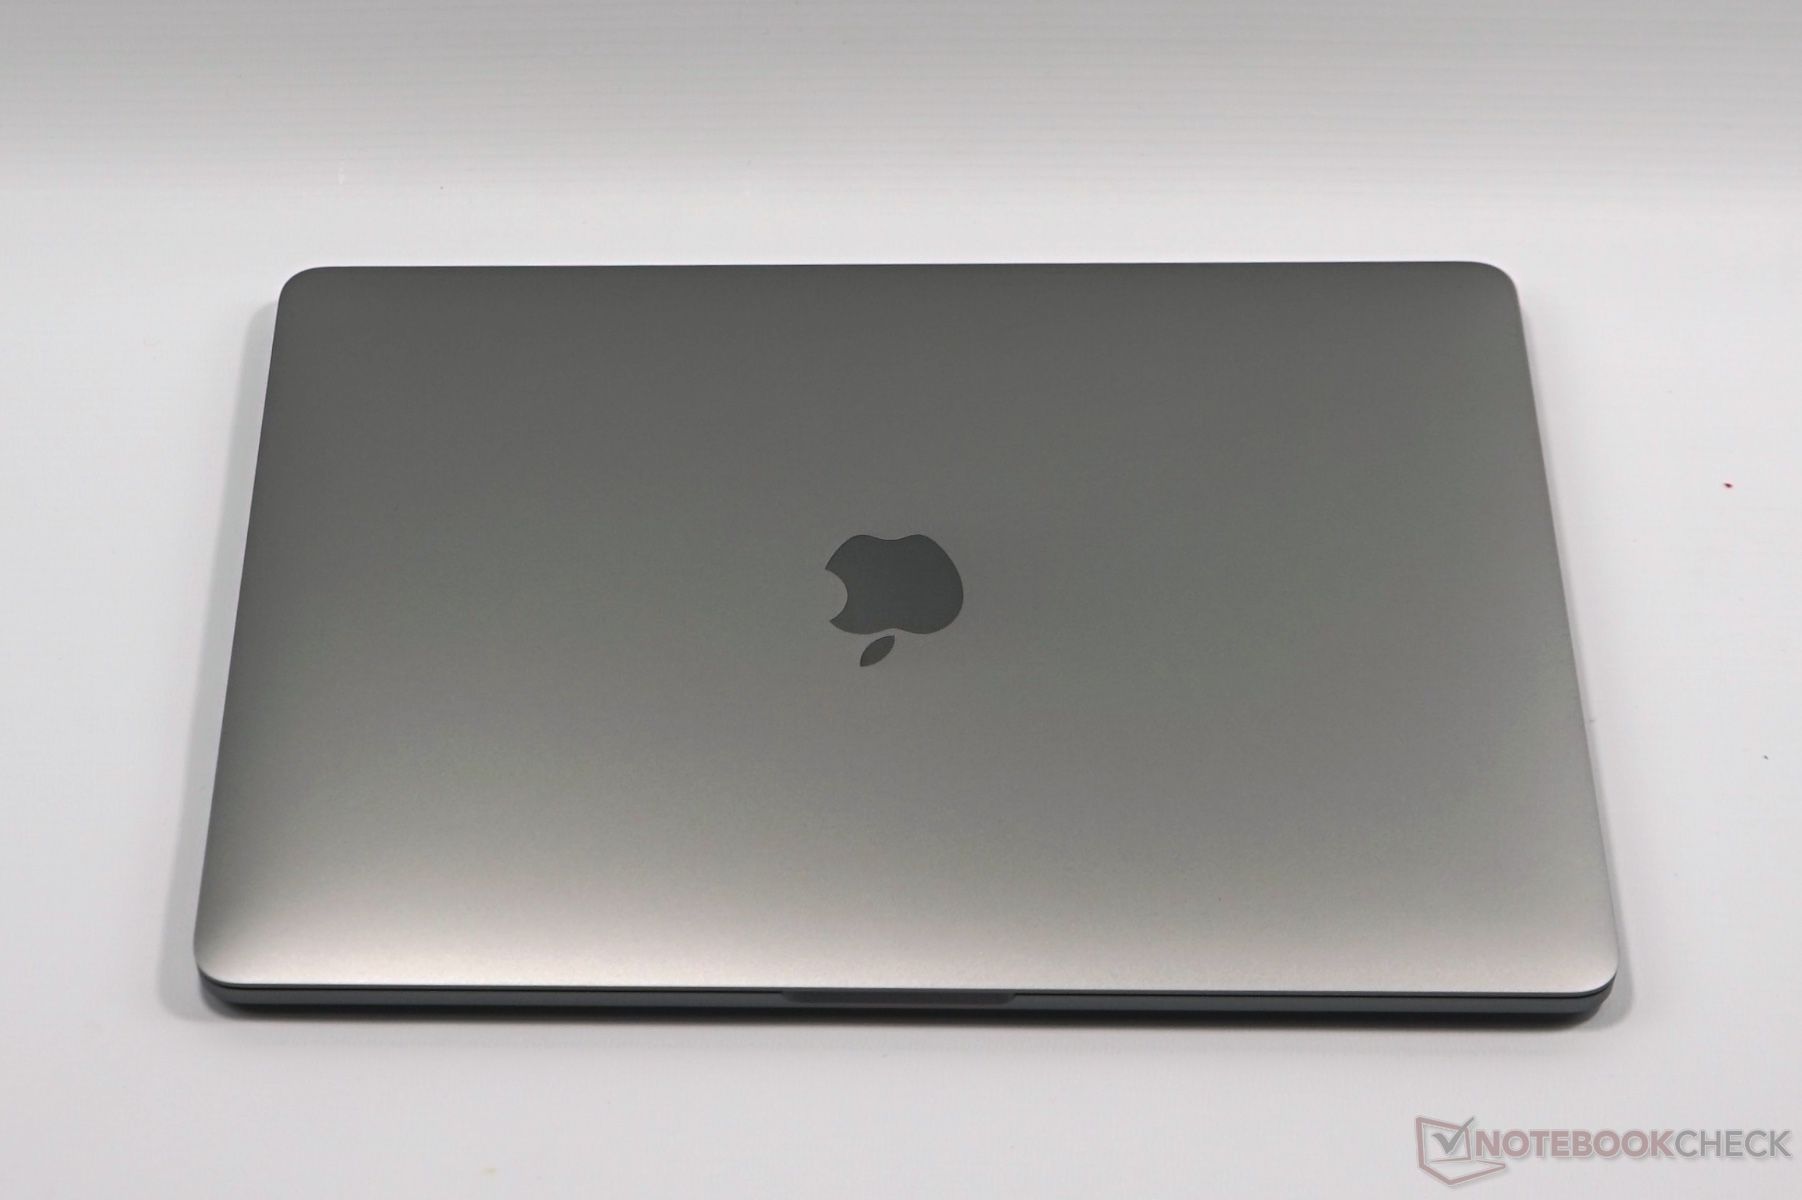
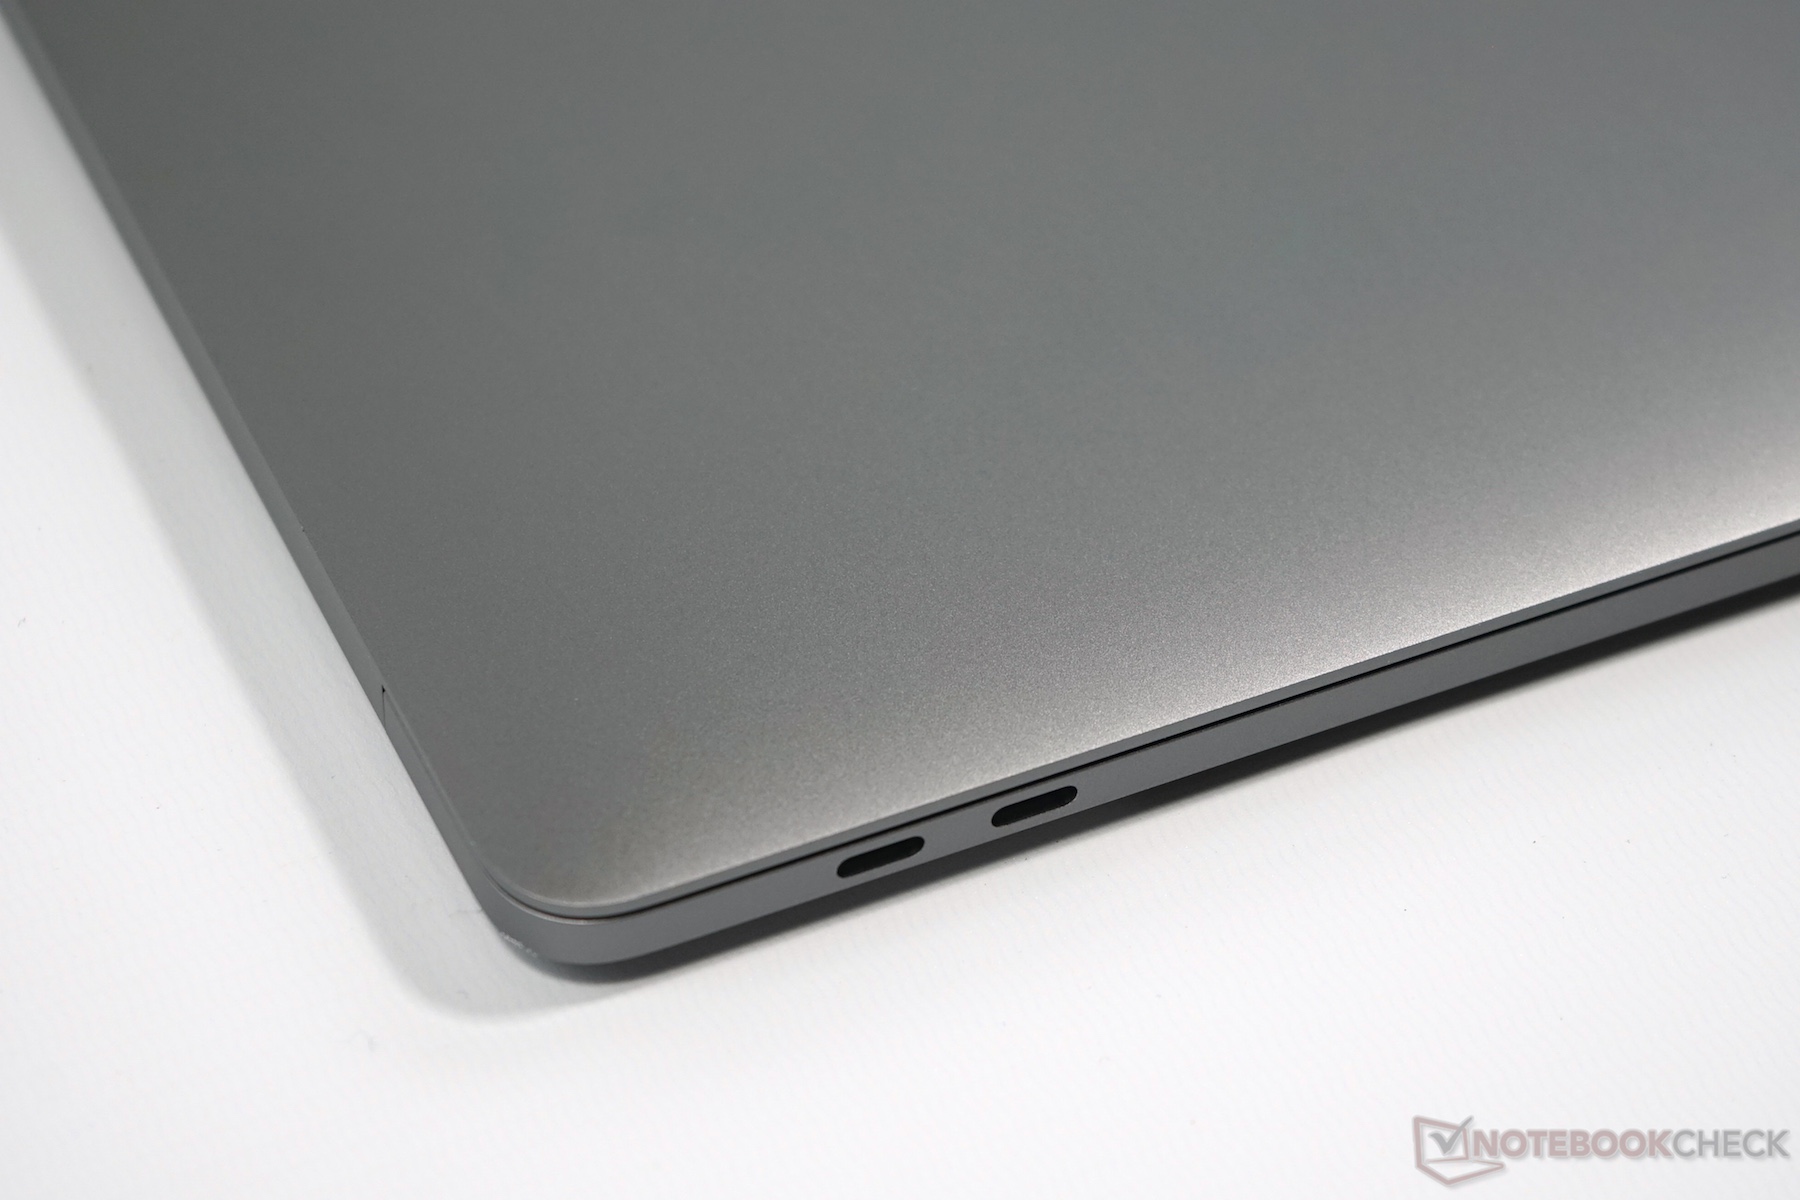
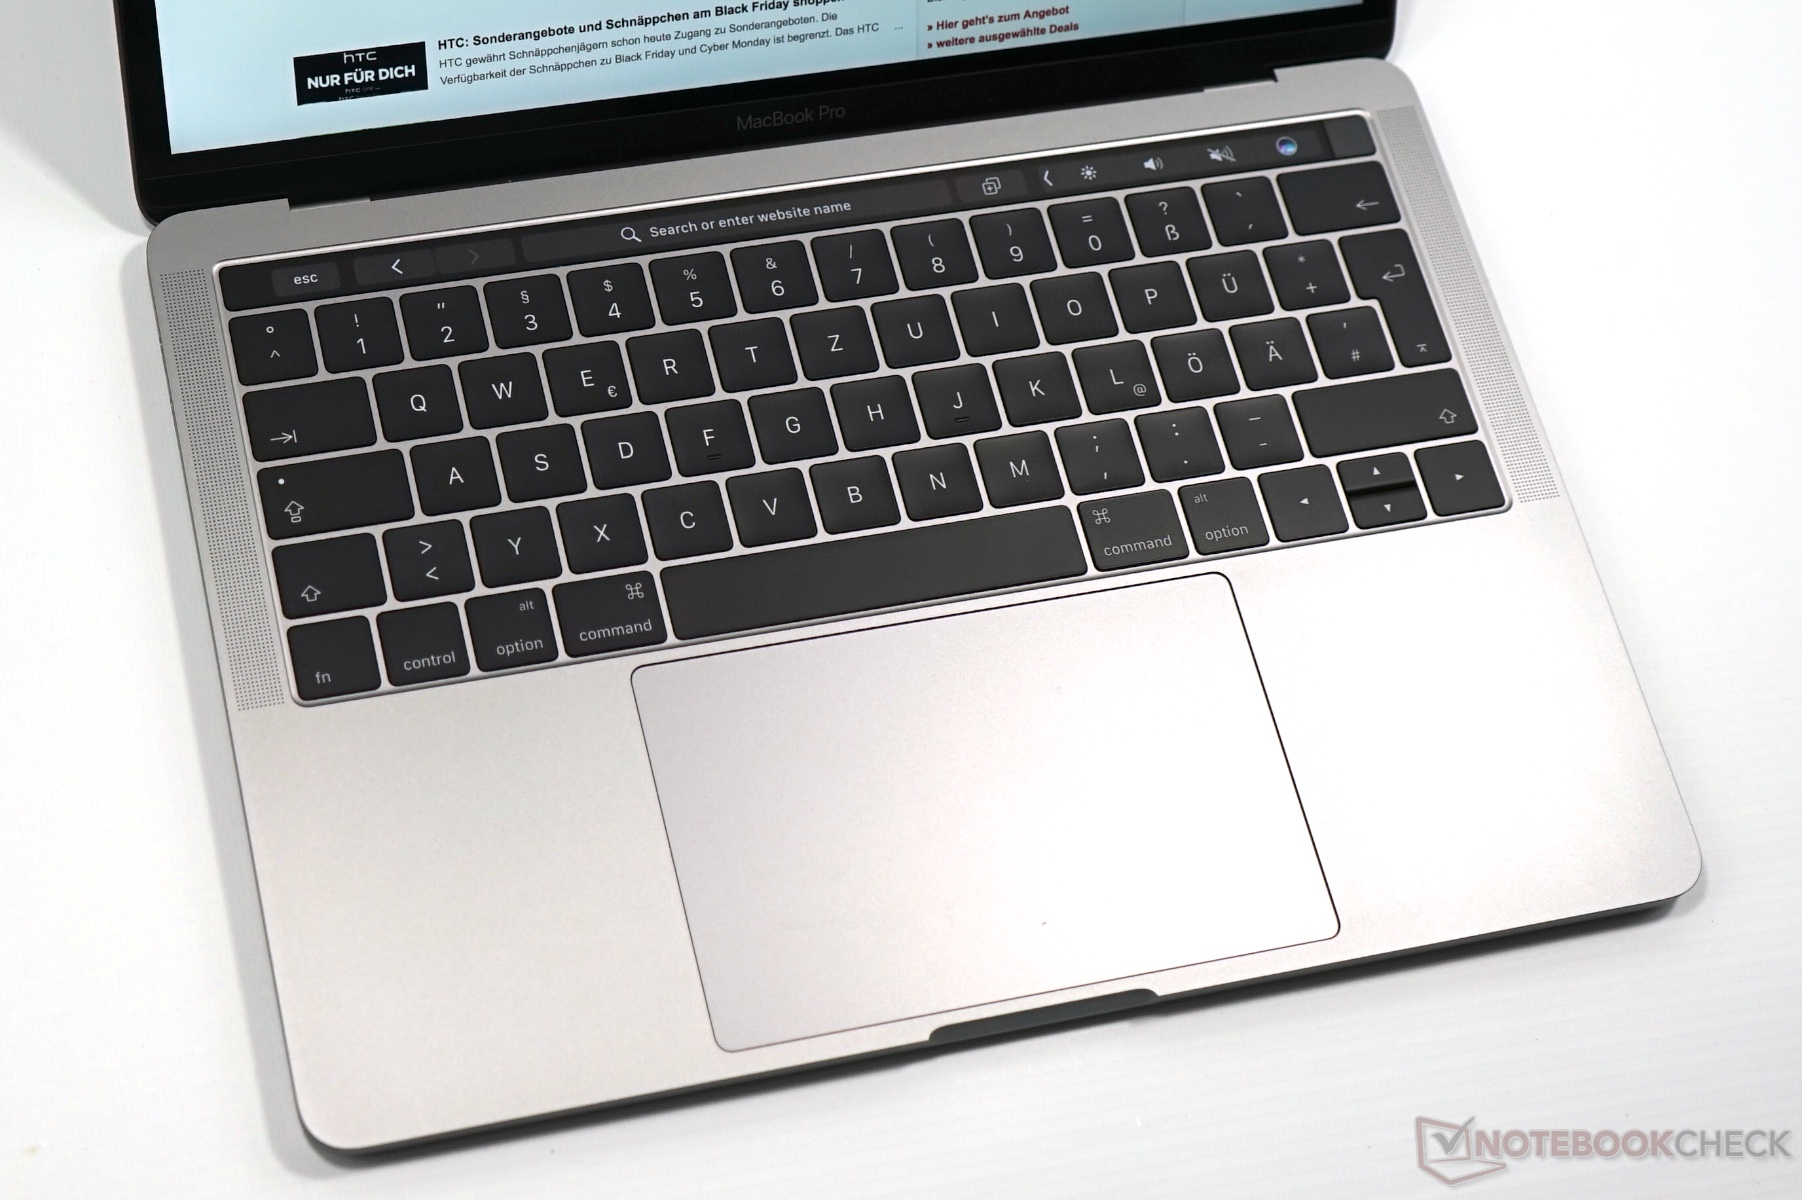
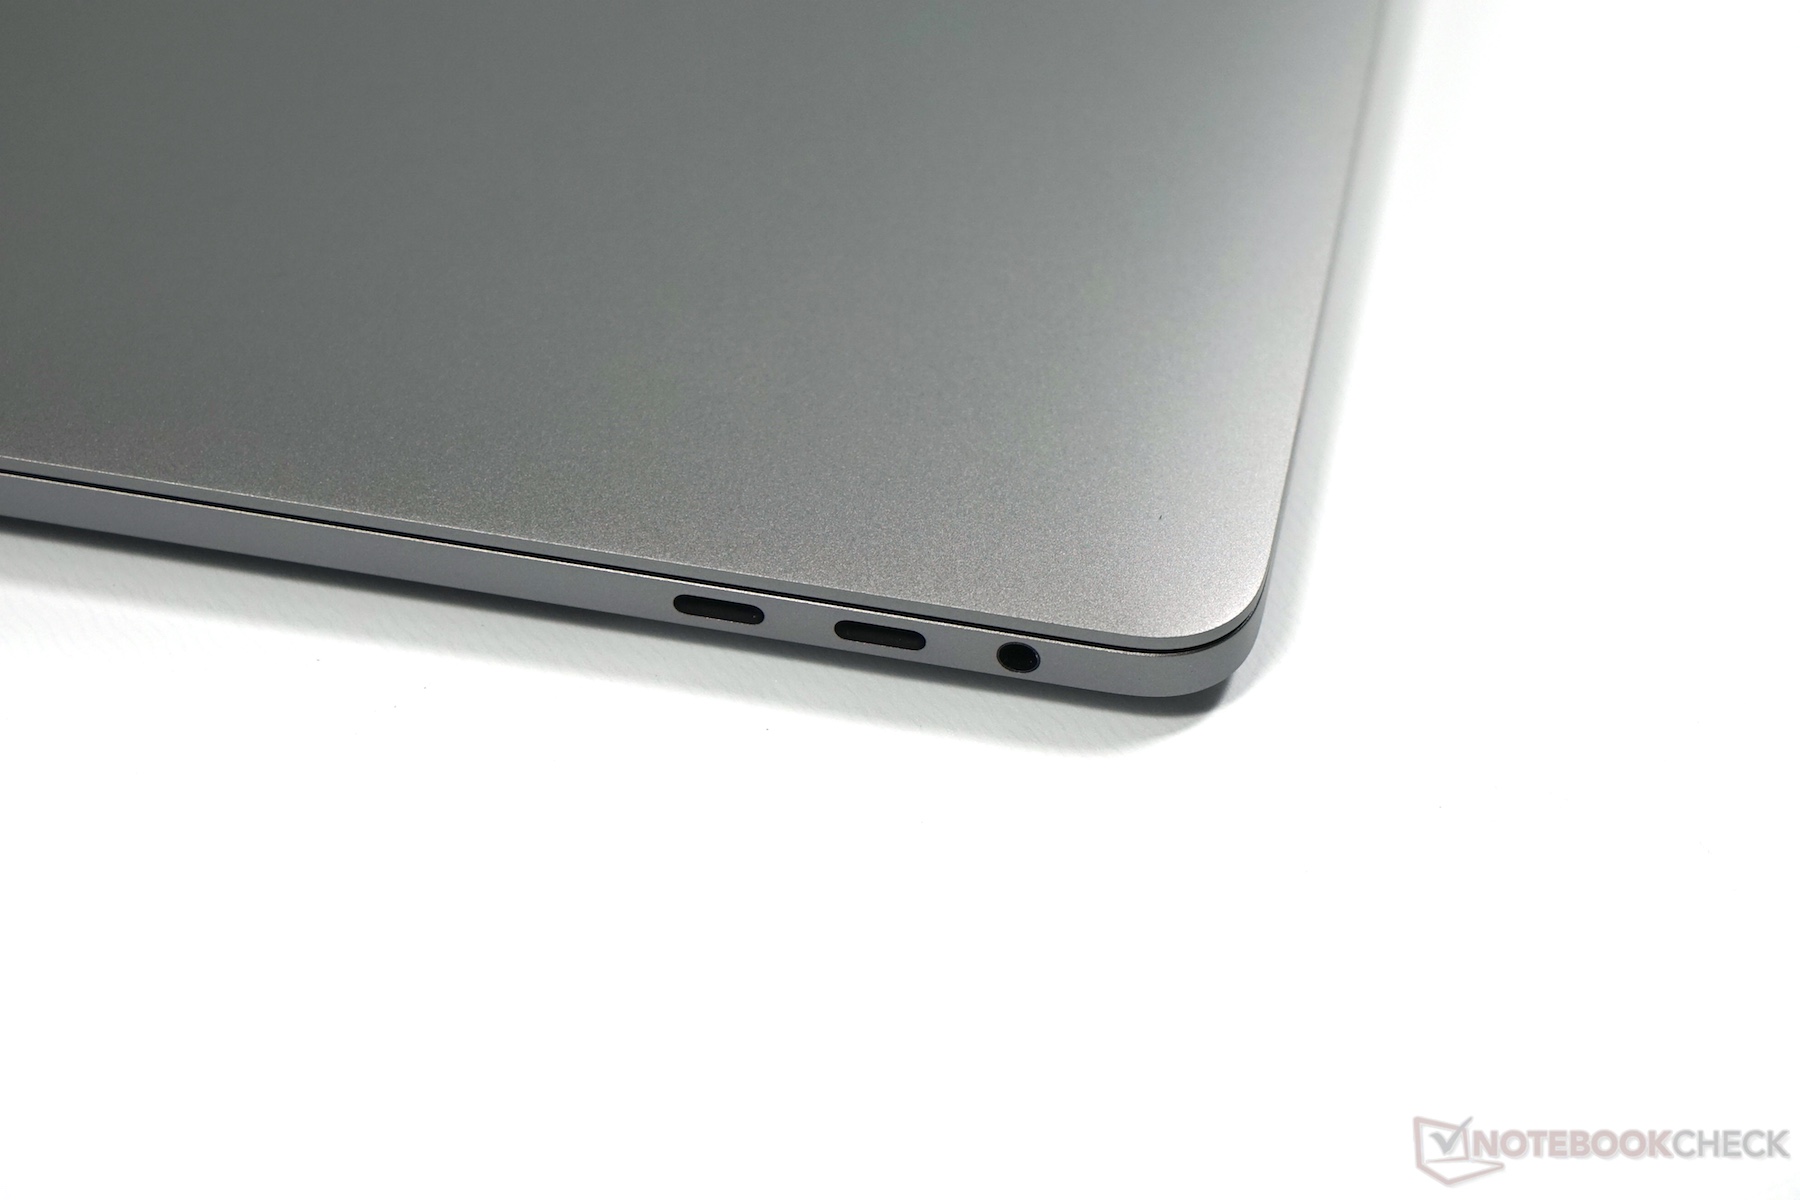
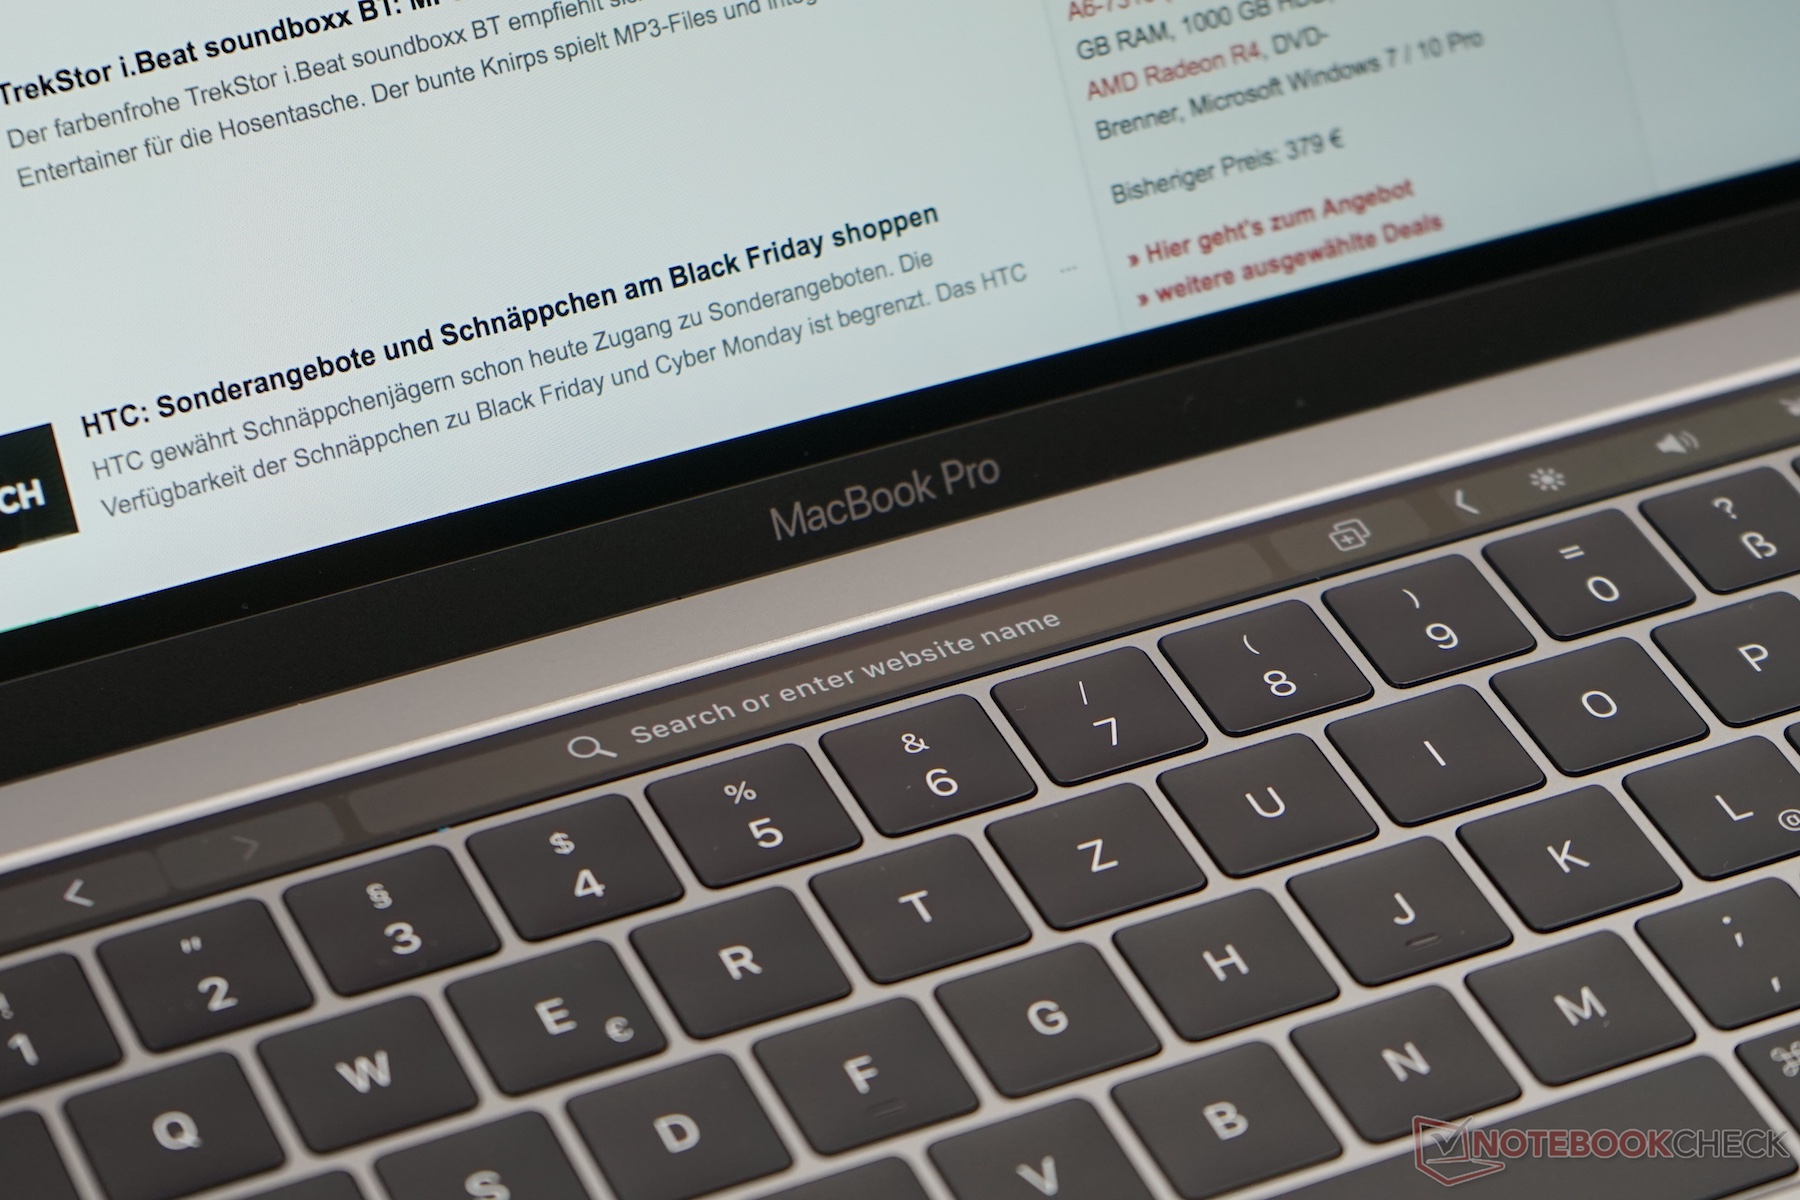
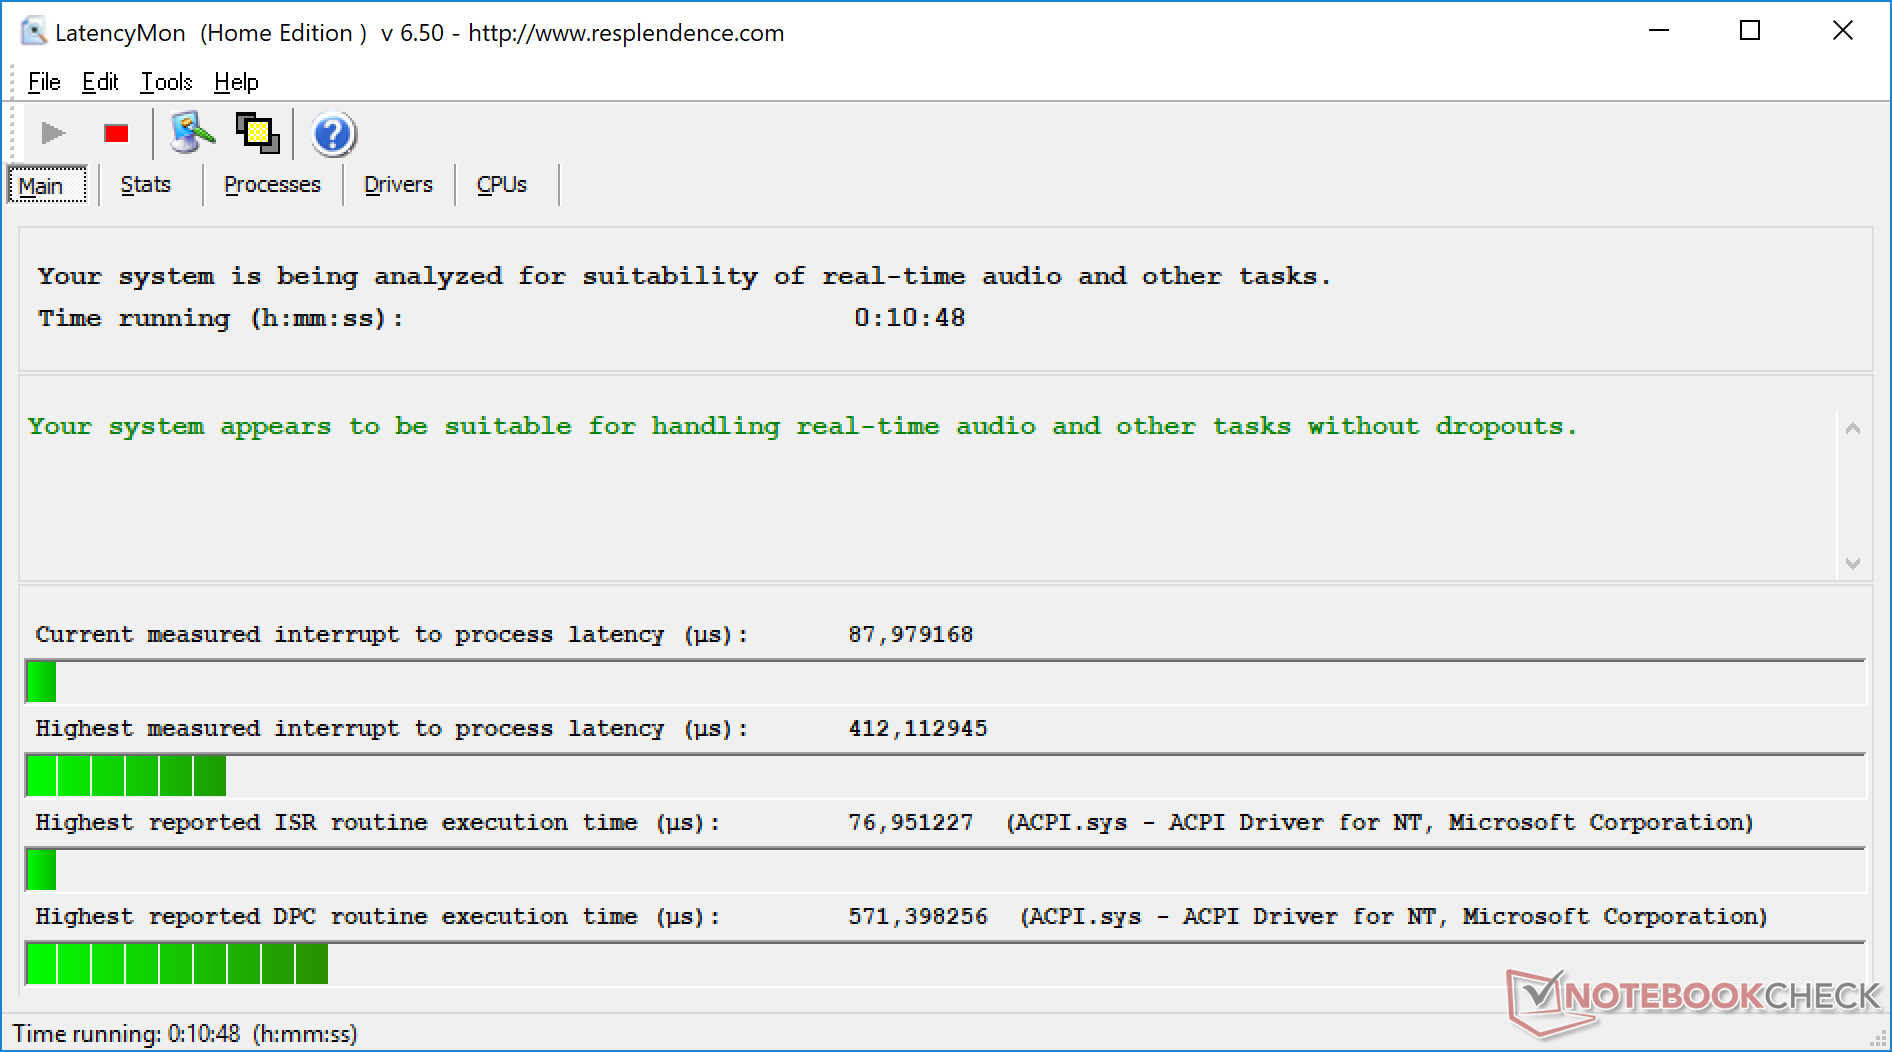
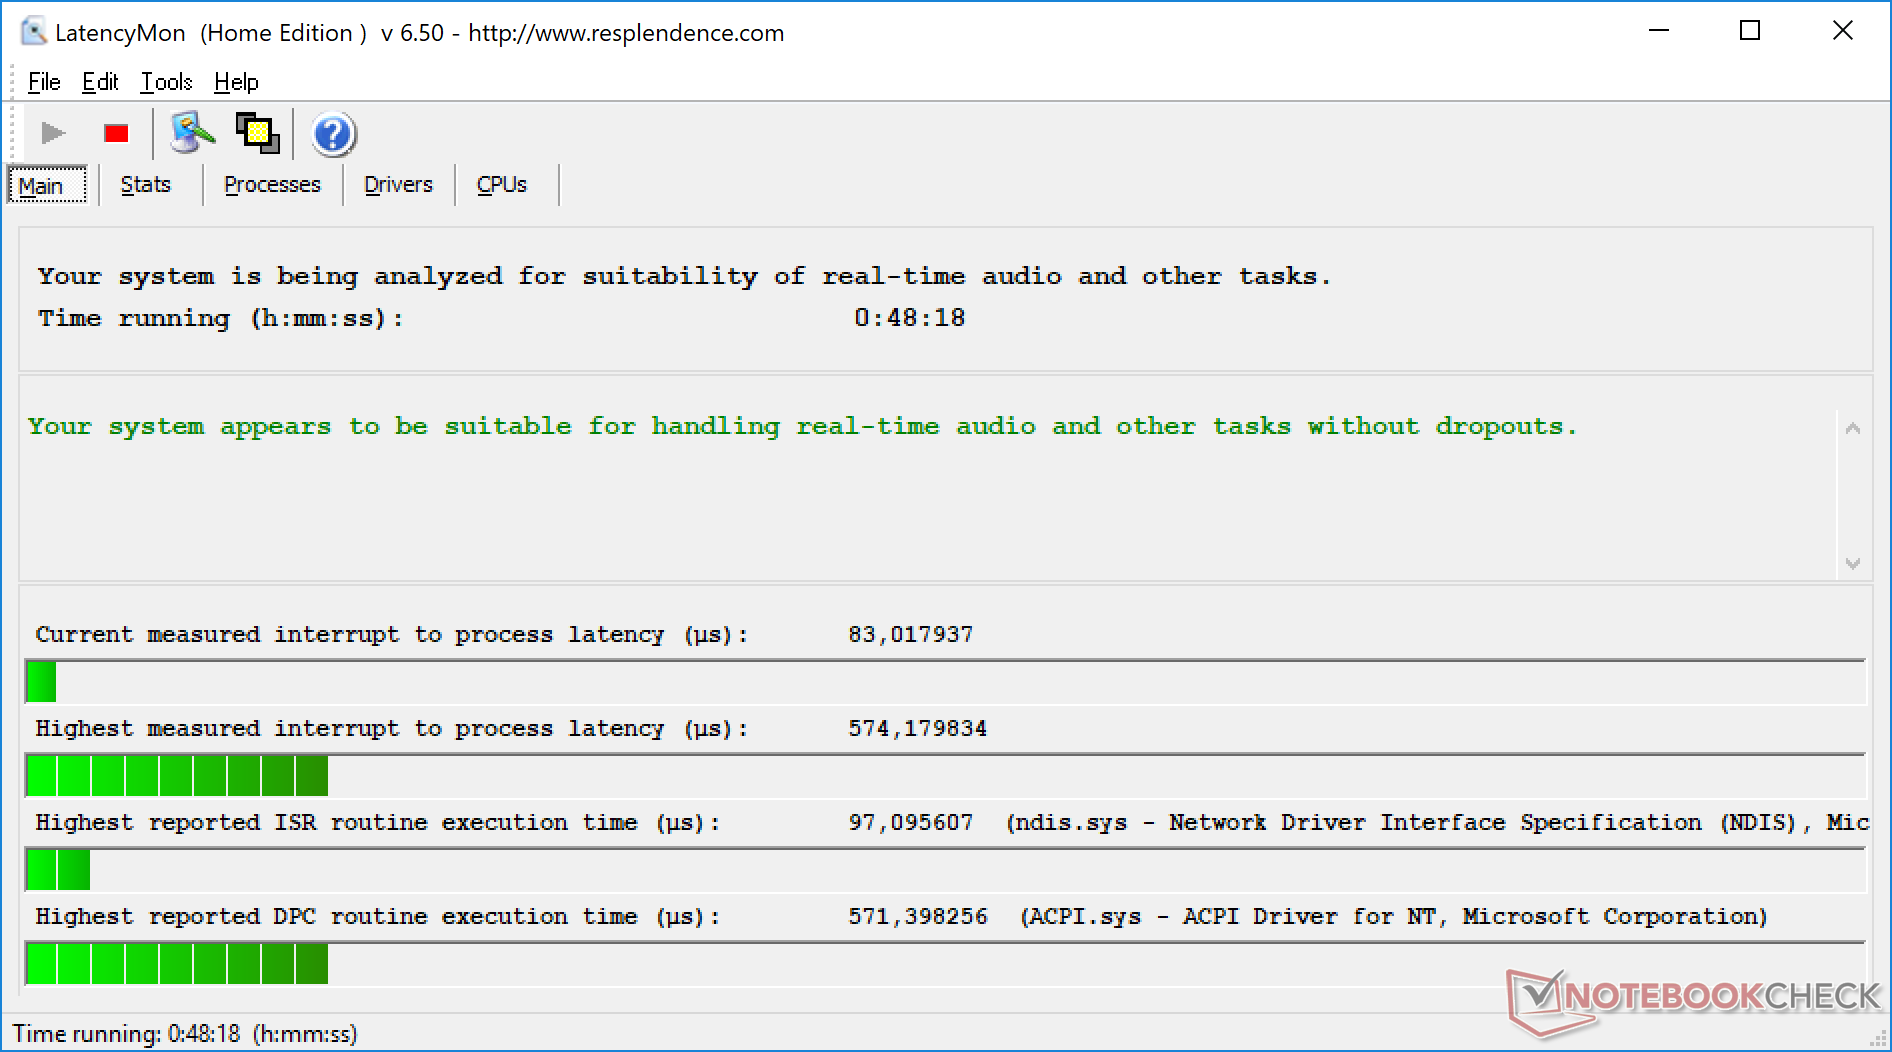
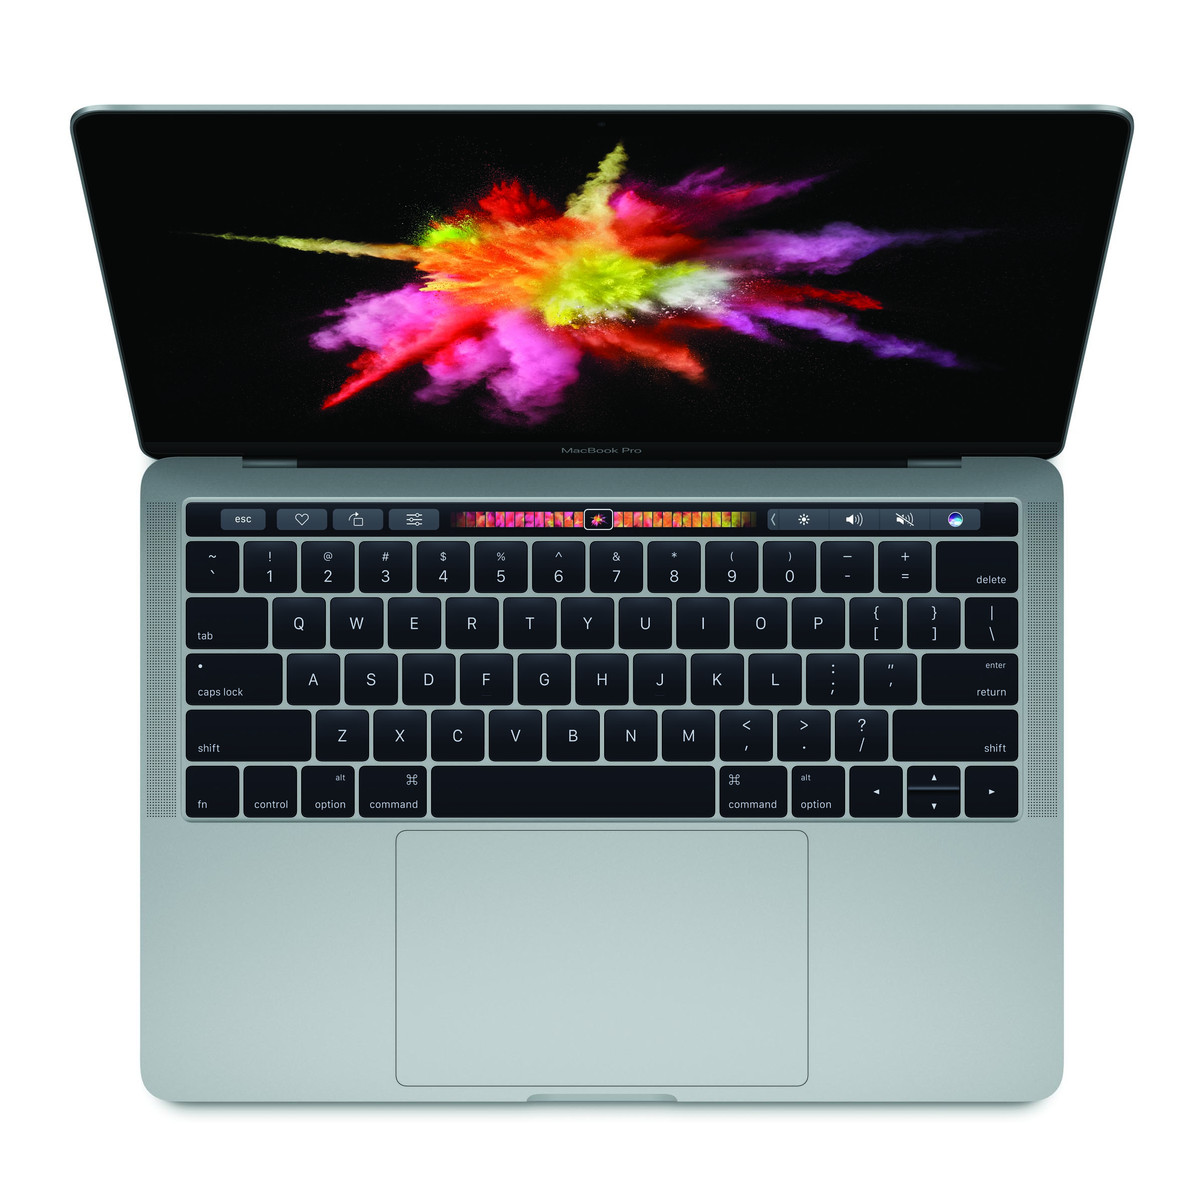
A MacBook Pro 13 még mindig nagyon jó, bár igen drága subnotebook. A ház és a kijelző a legjobbak között van, a ventilátorok nagyon csendesek, a teljesítmény teljesen stabil. A precíz, de sekély billentyűzetet azért szokni kell, és több mindenhez adapterre lesz szükség. A TouchBar még mindig a szoftveres támogatástól függ, de a legtöbbek számára csak egy olyan kütyü lesz, amely néha még bonyolultabbá is teszi az életet. A 2.4 GHz-es Wi-Fi probléma még mindig észlelhető. Emiatt, az előző modellhez hasonlóan 2%-ot levonunk a végső értékelésből.
Meglepve tapasztaltuk az üzemidő csökkenését, főleg, mivel a Kaby Lake chipek elvileg takarékosabbak. Talán az új GPU-kra fér rá némi optimalizálás az Apple részéről, amelyre talán az új High Sierra OS-sel kerül sor.
Ez az eredeti értékelés rövidített változata. A teljes, angol nyelvű cikk itt olvasható.
Price comparison
