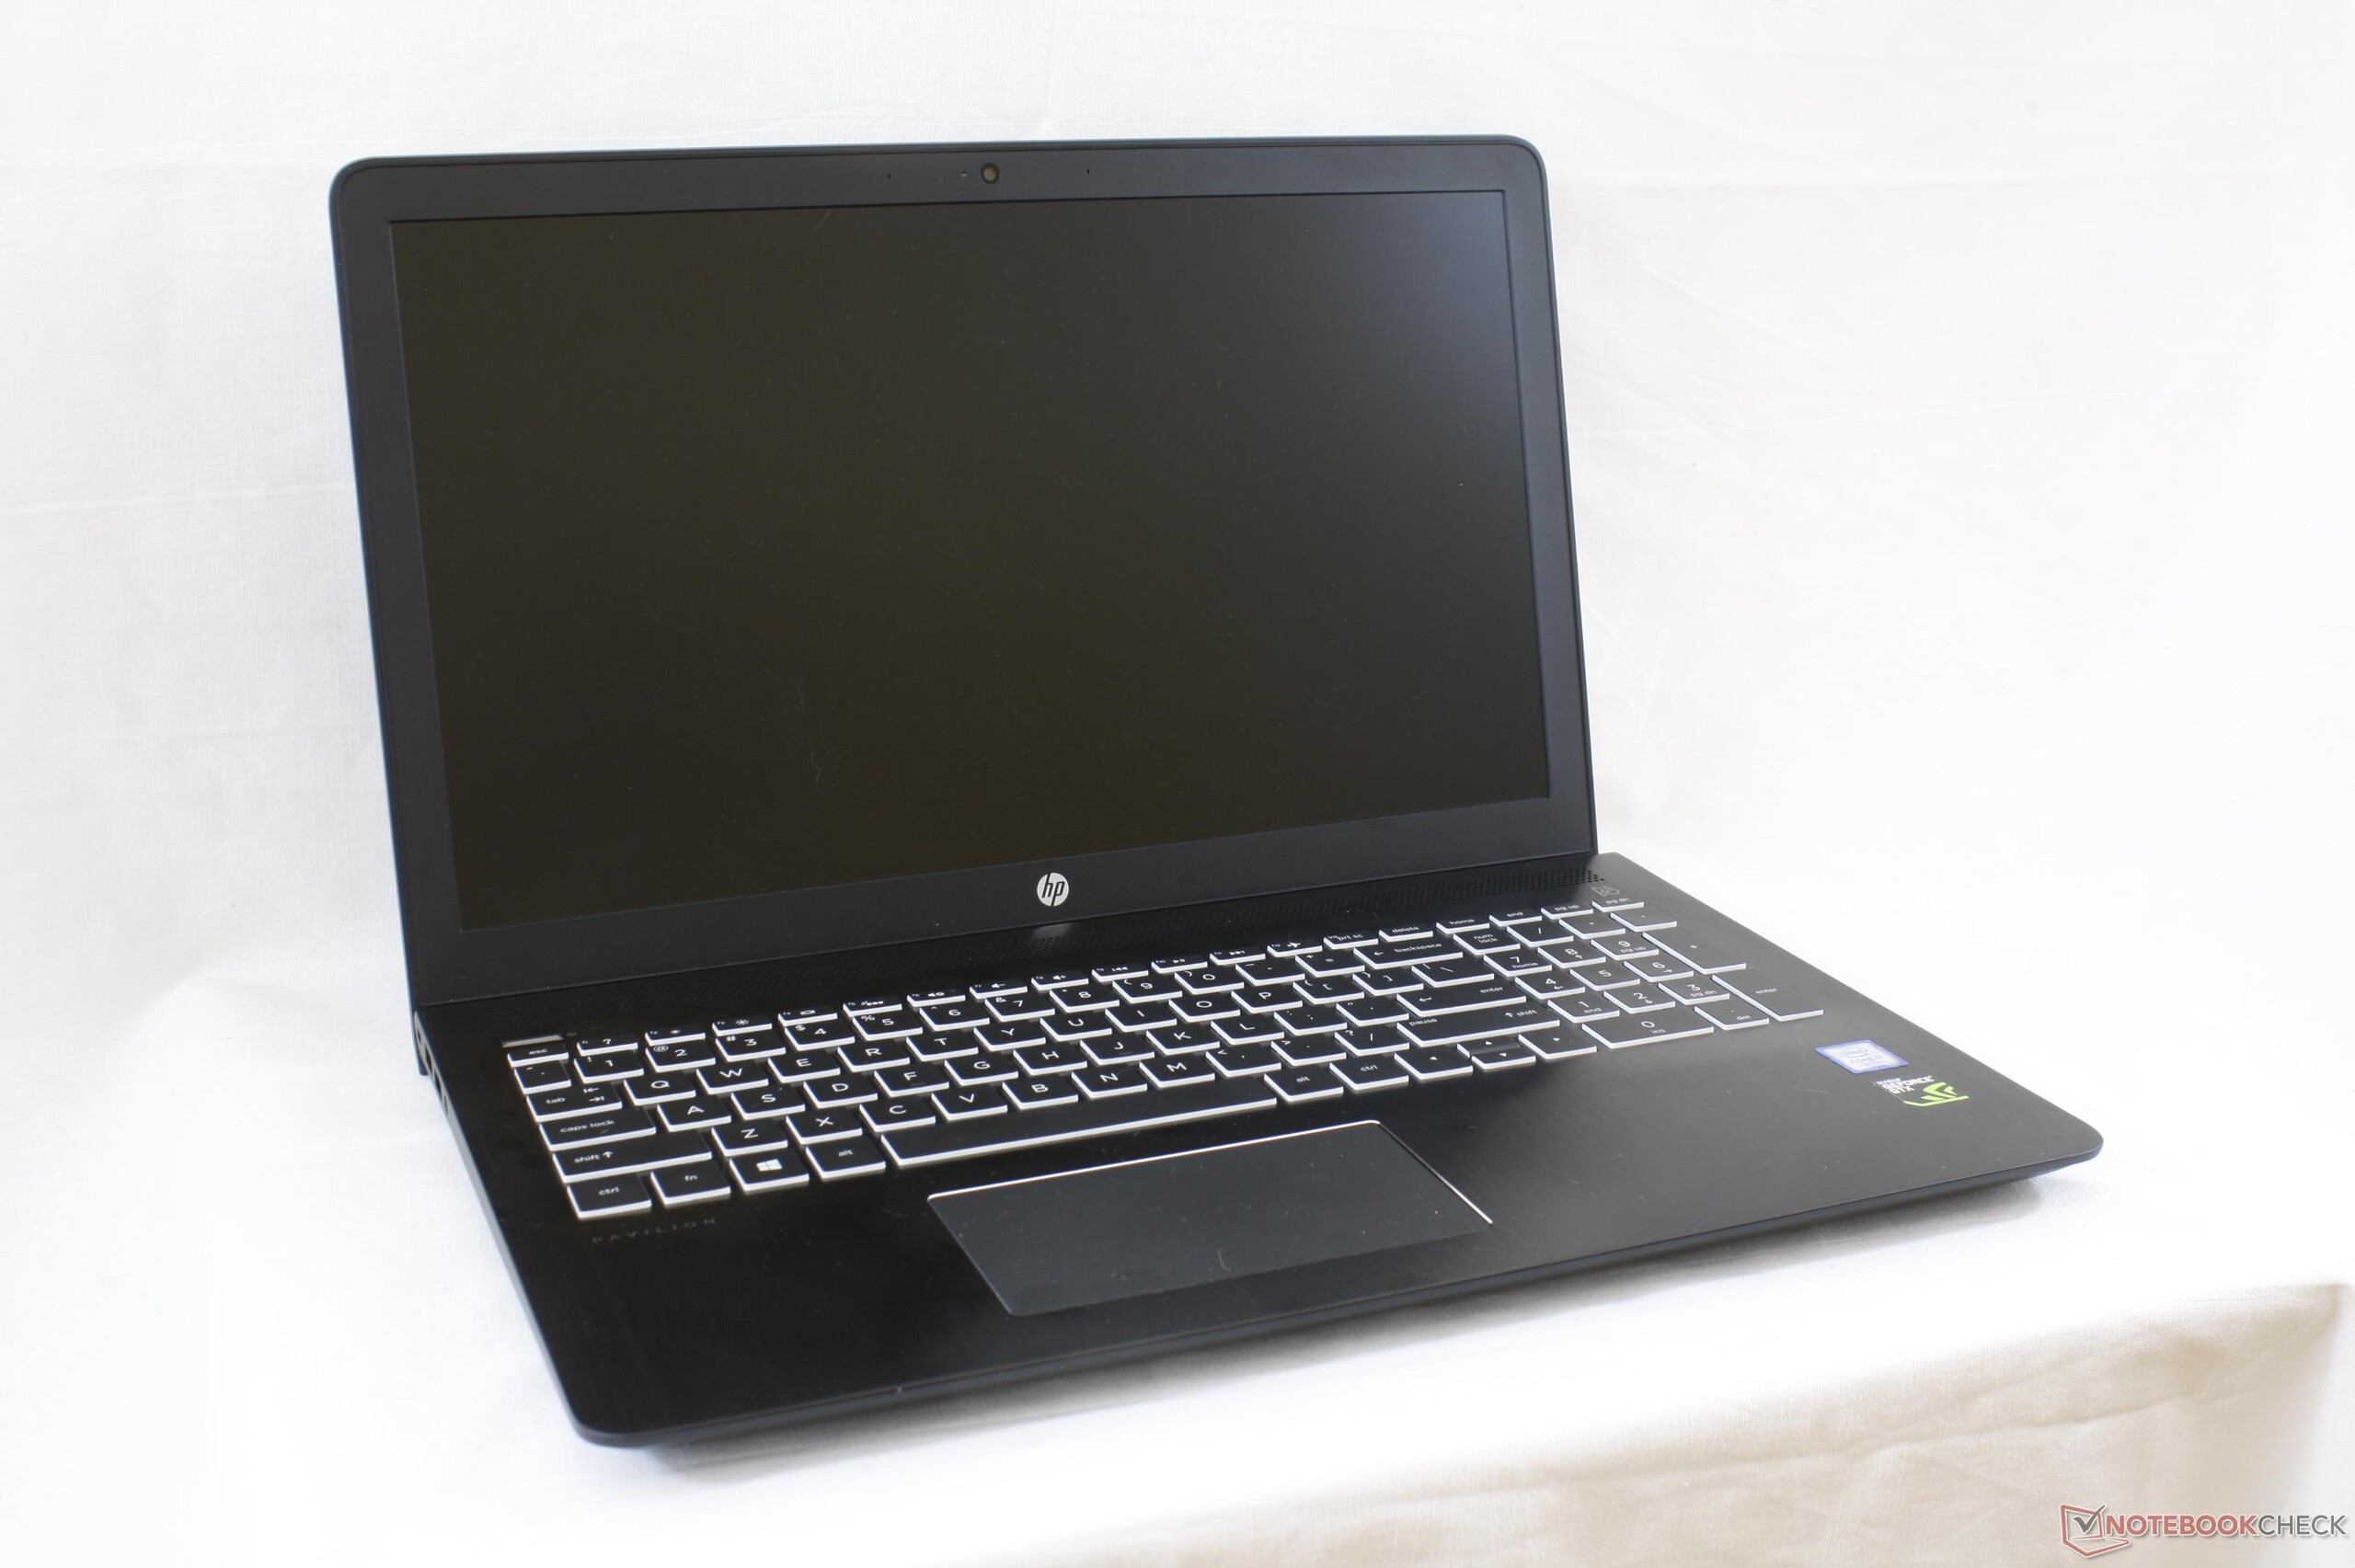
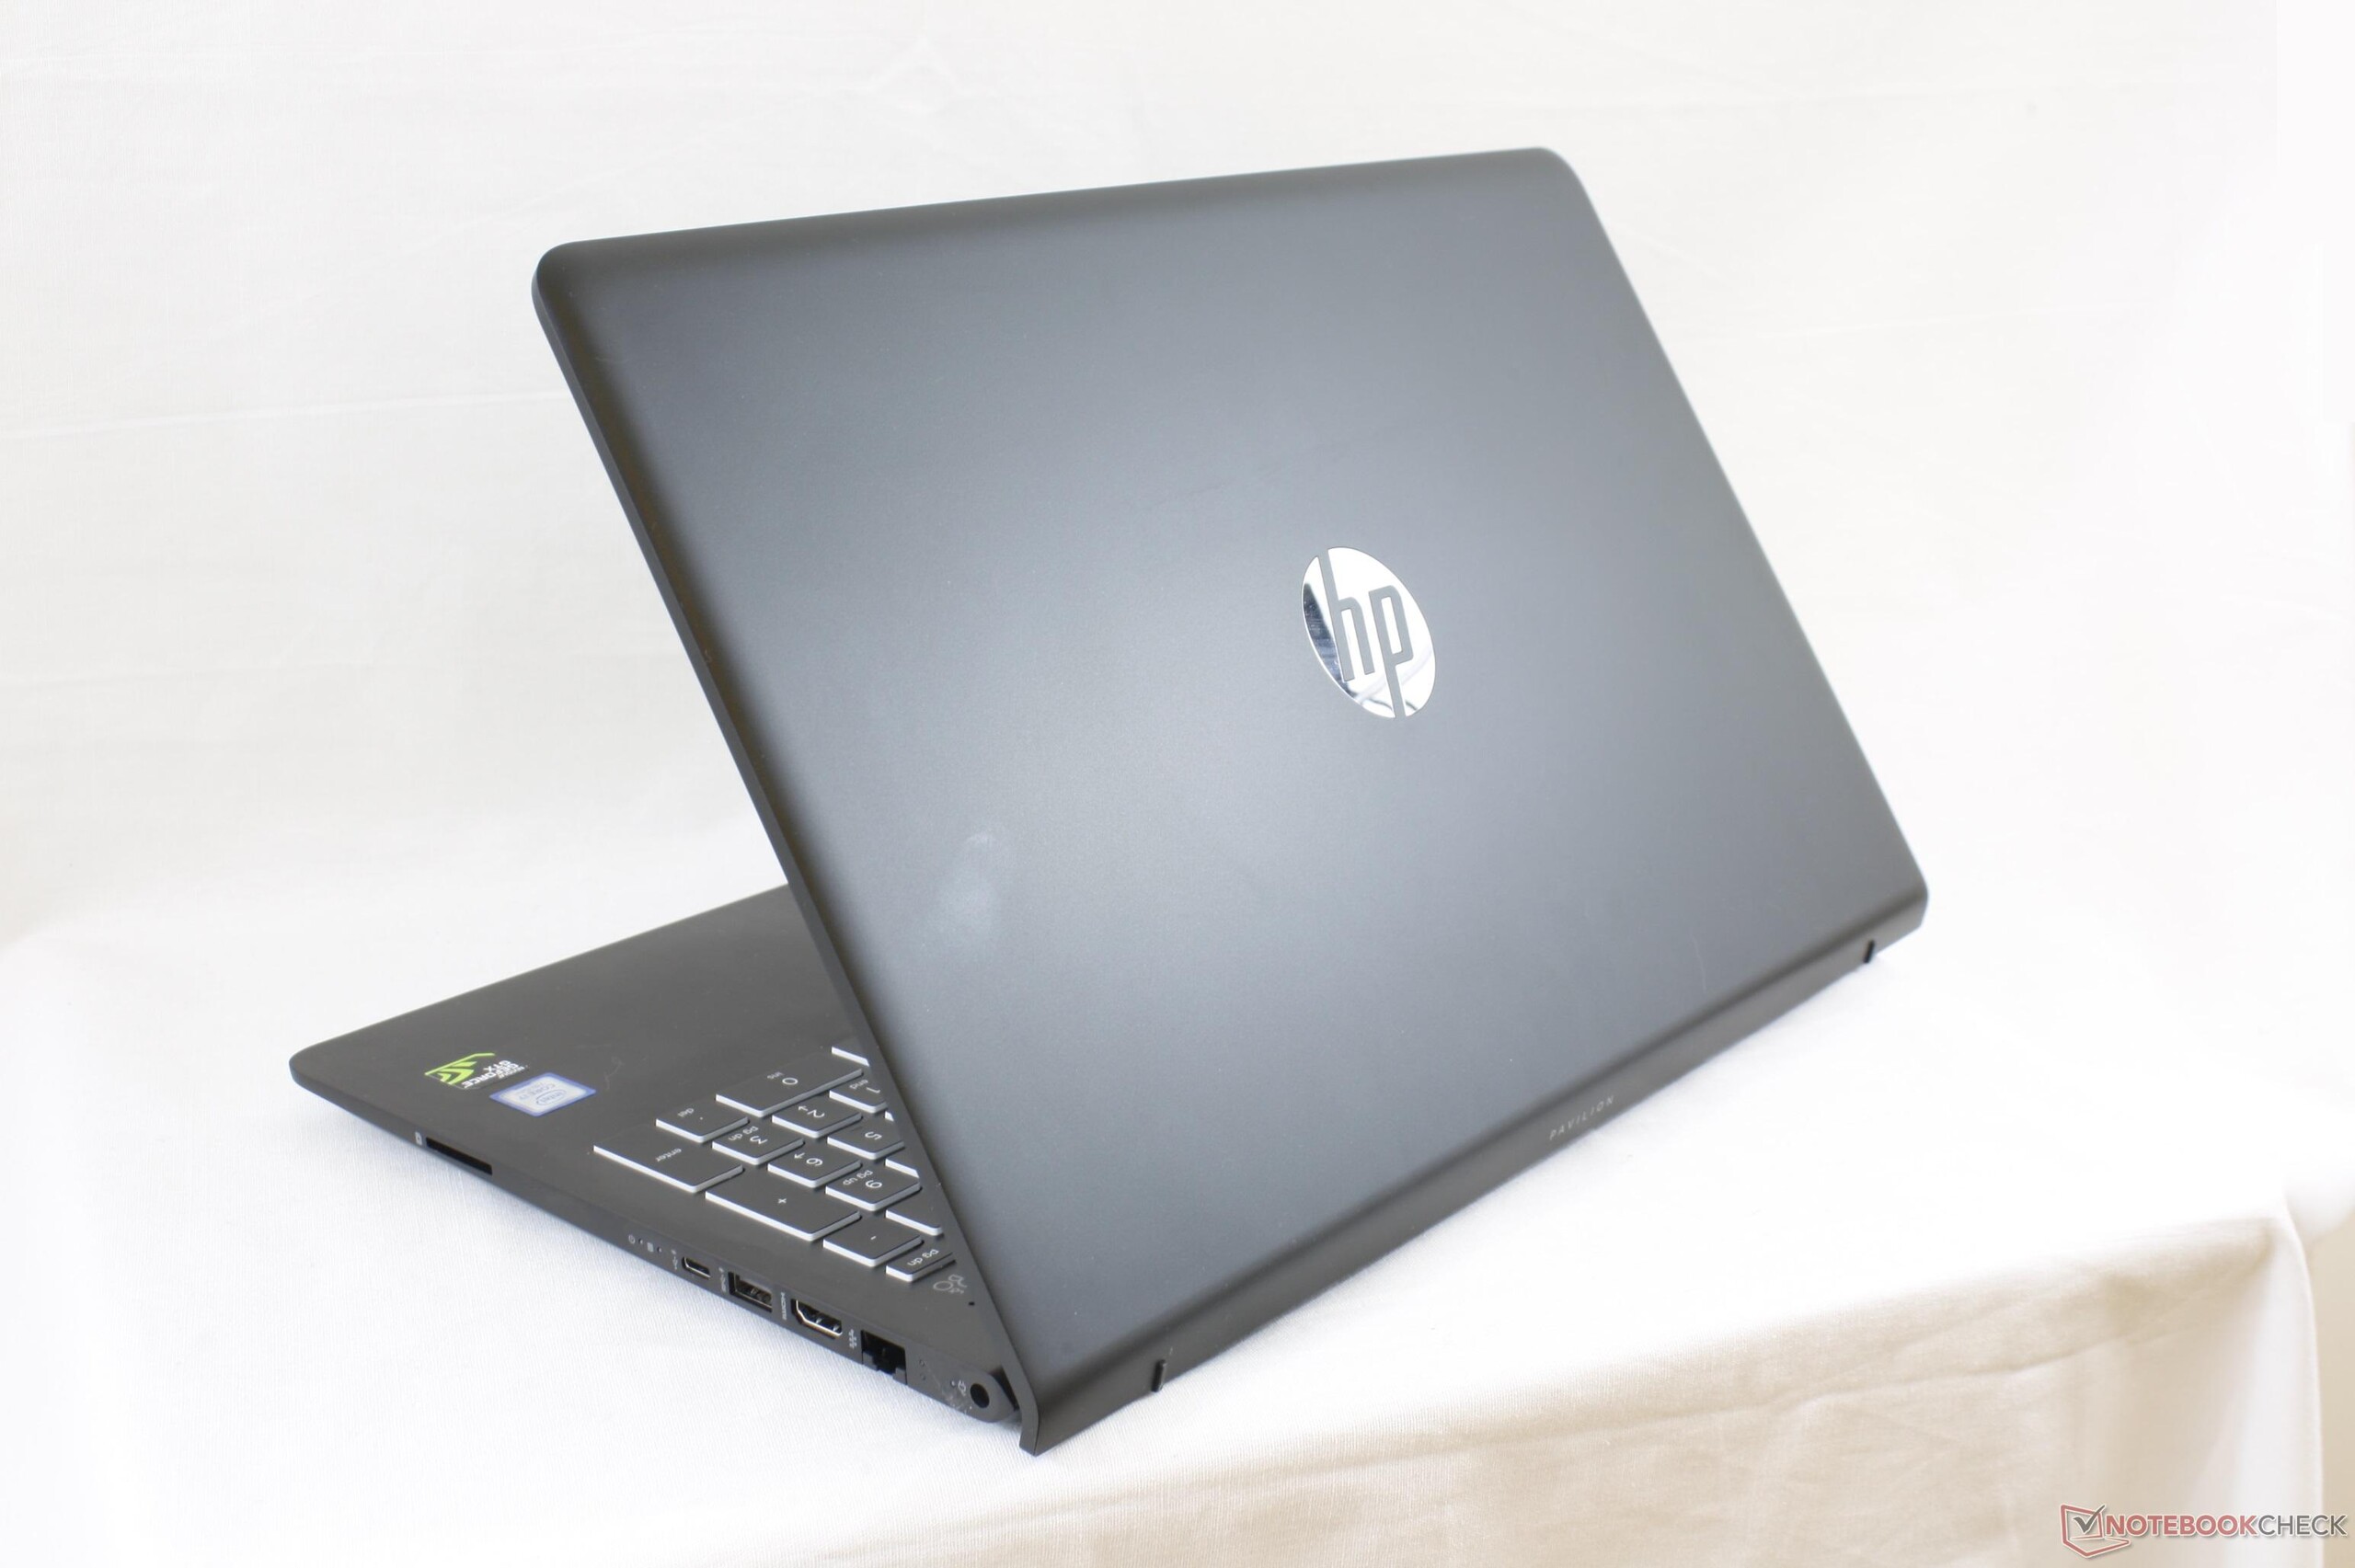
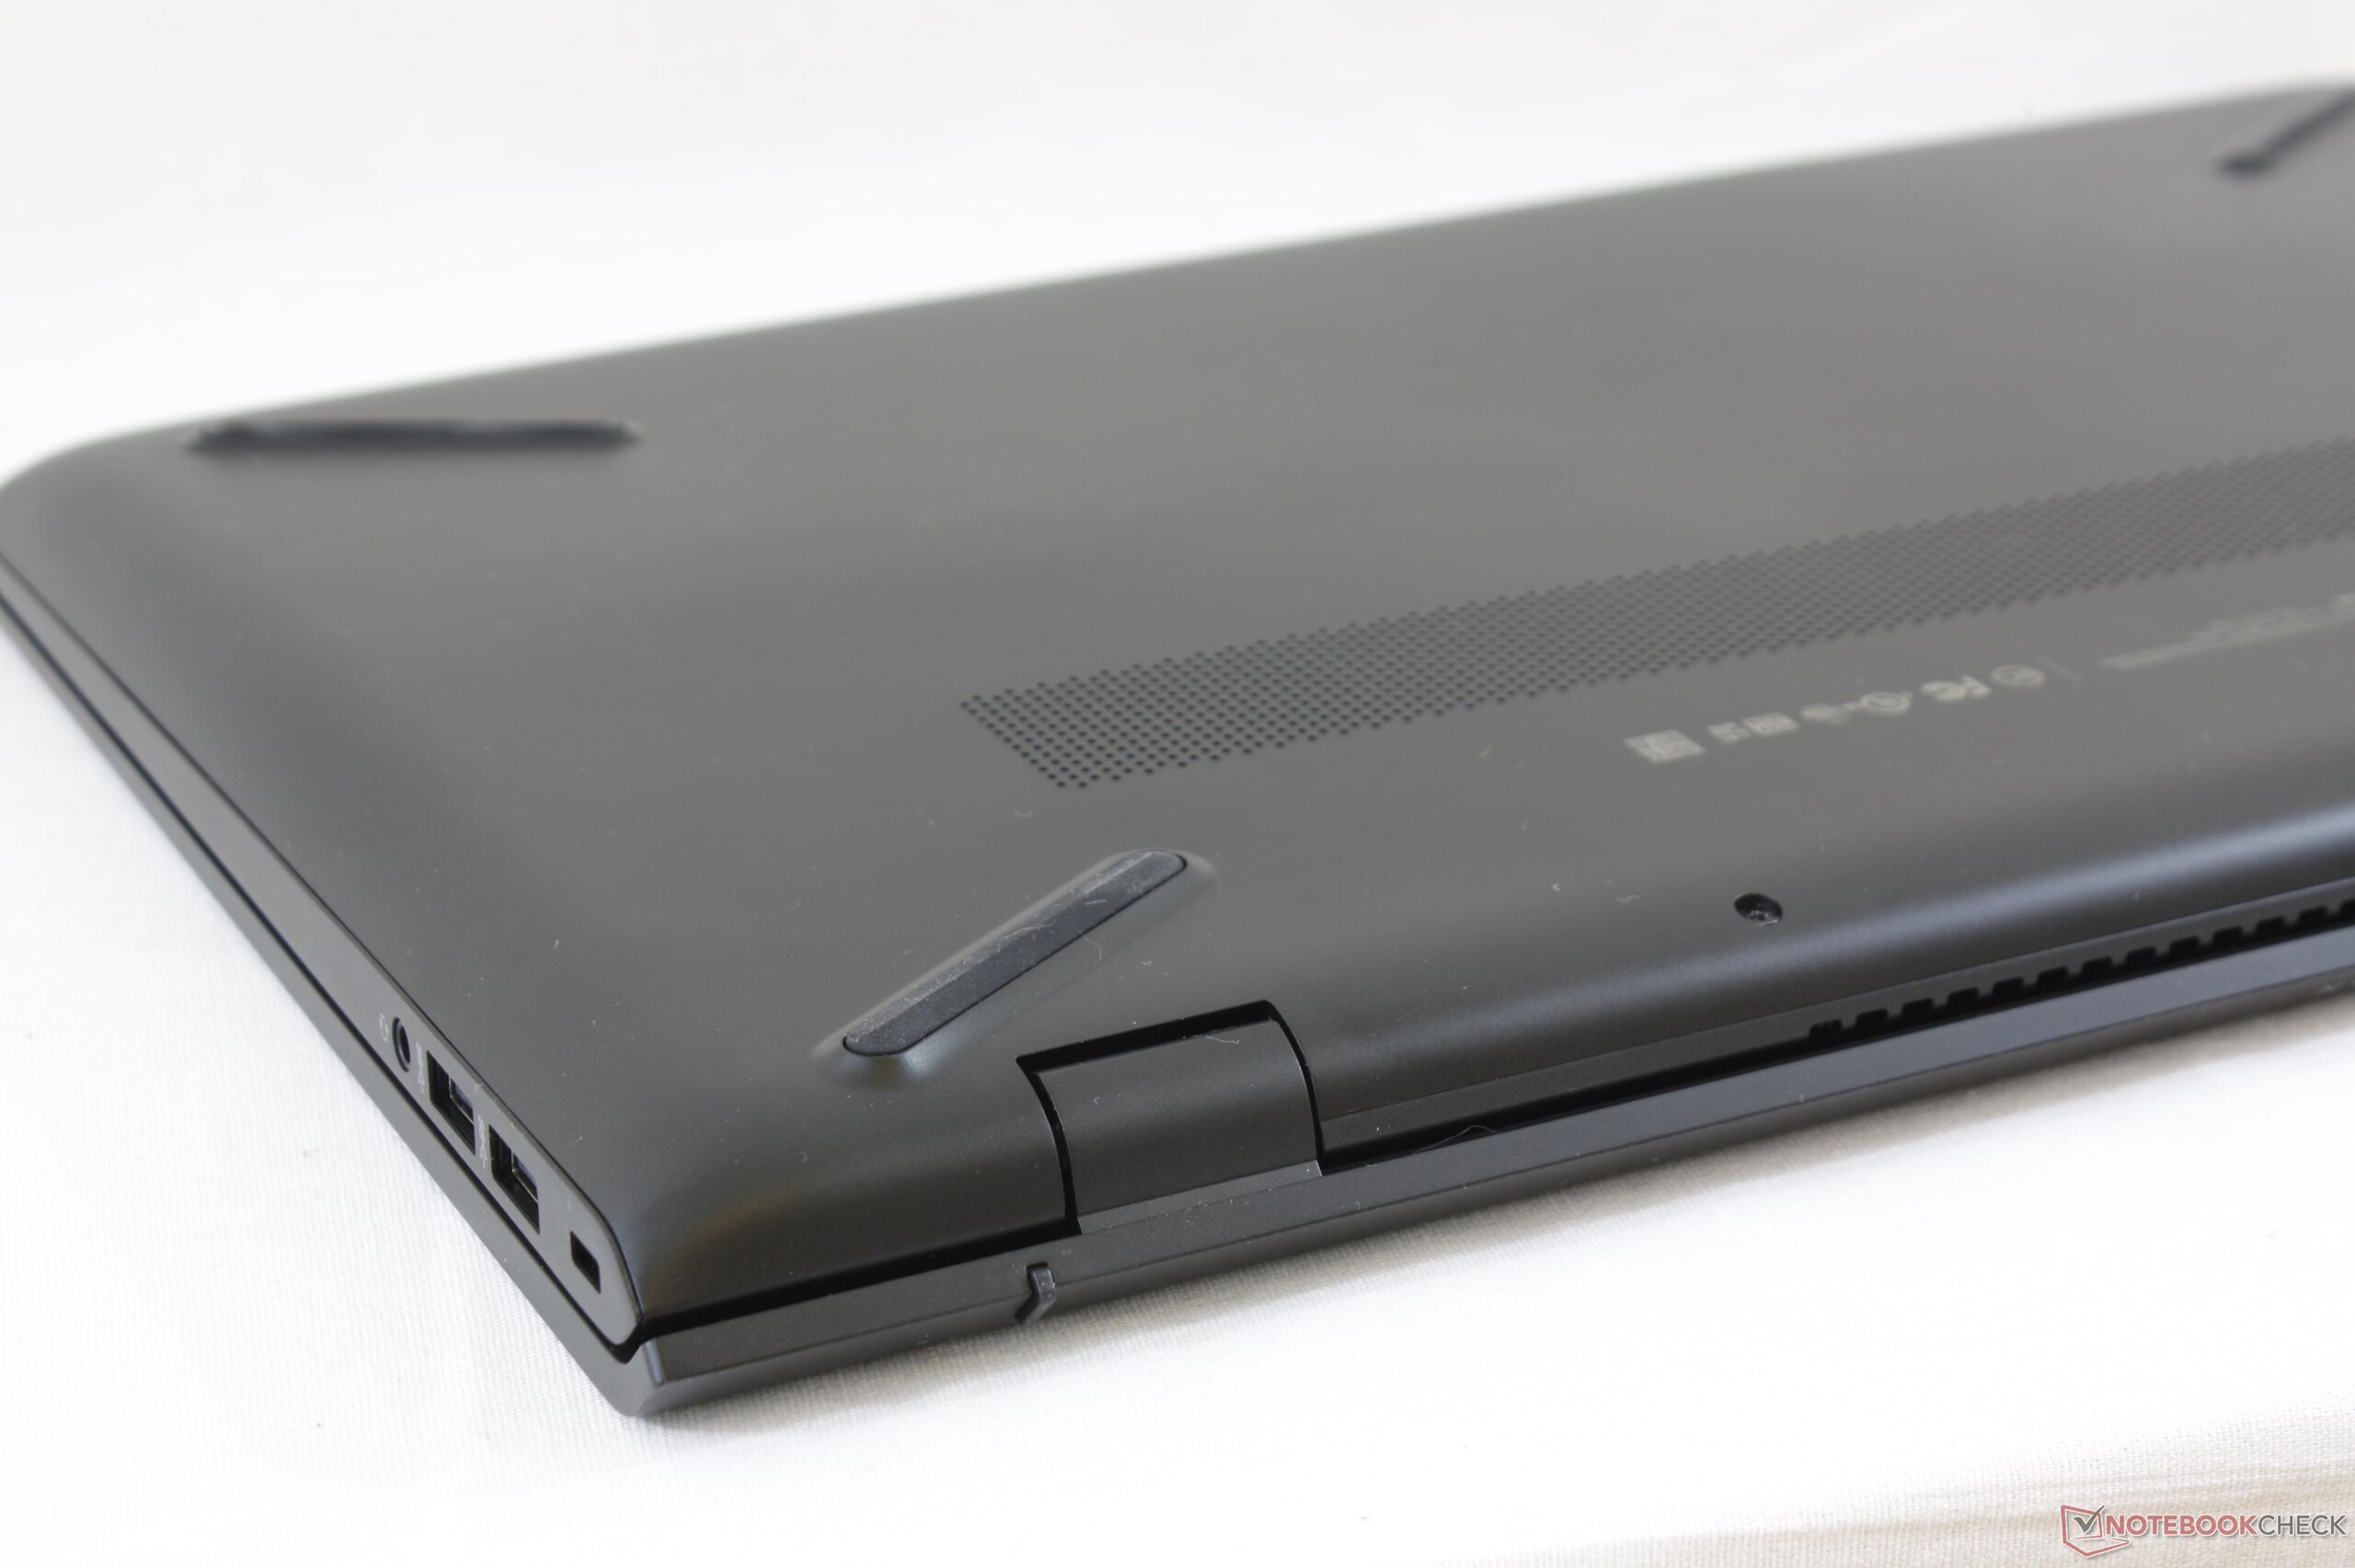
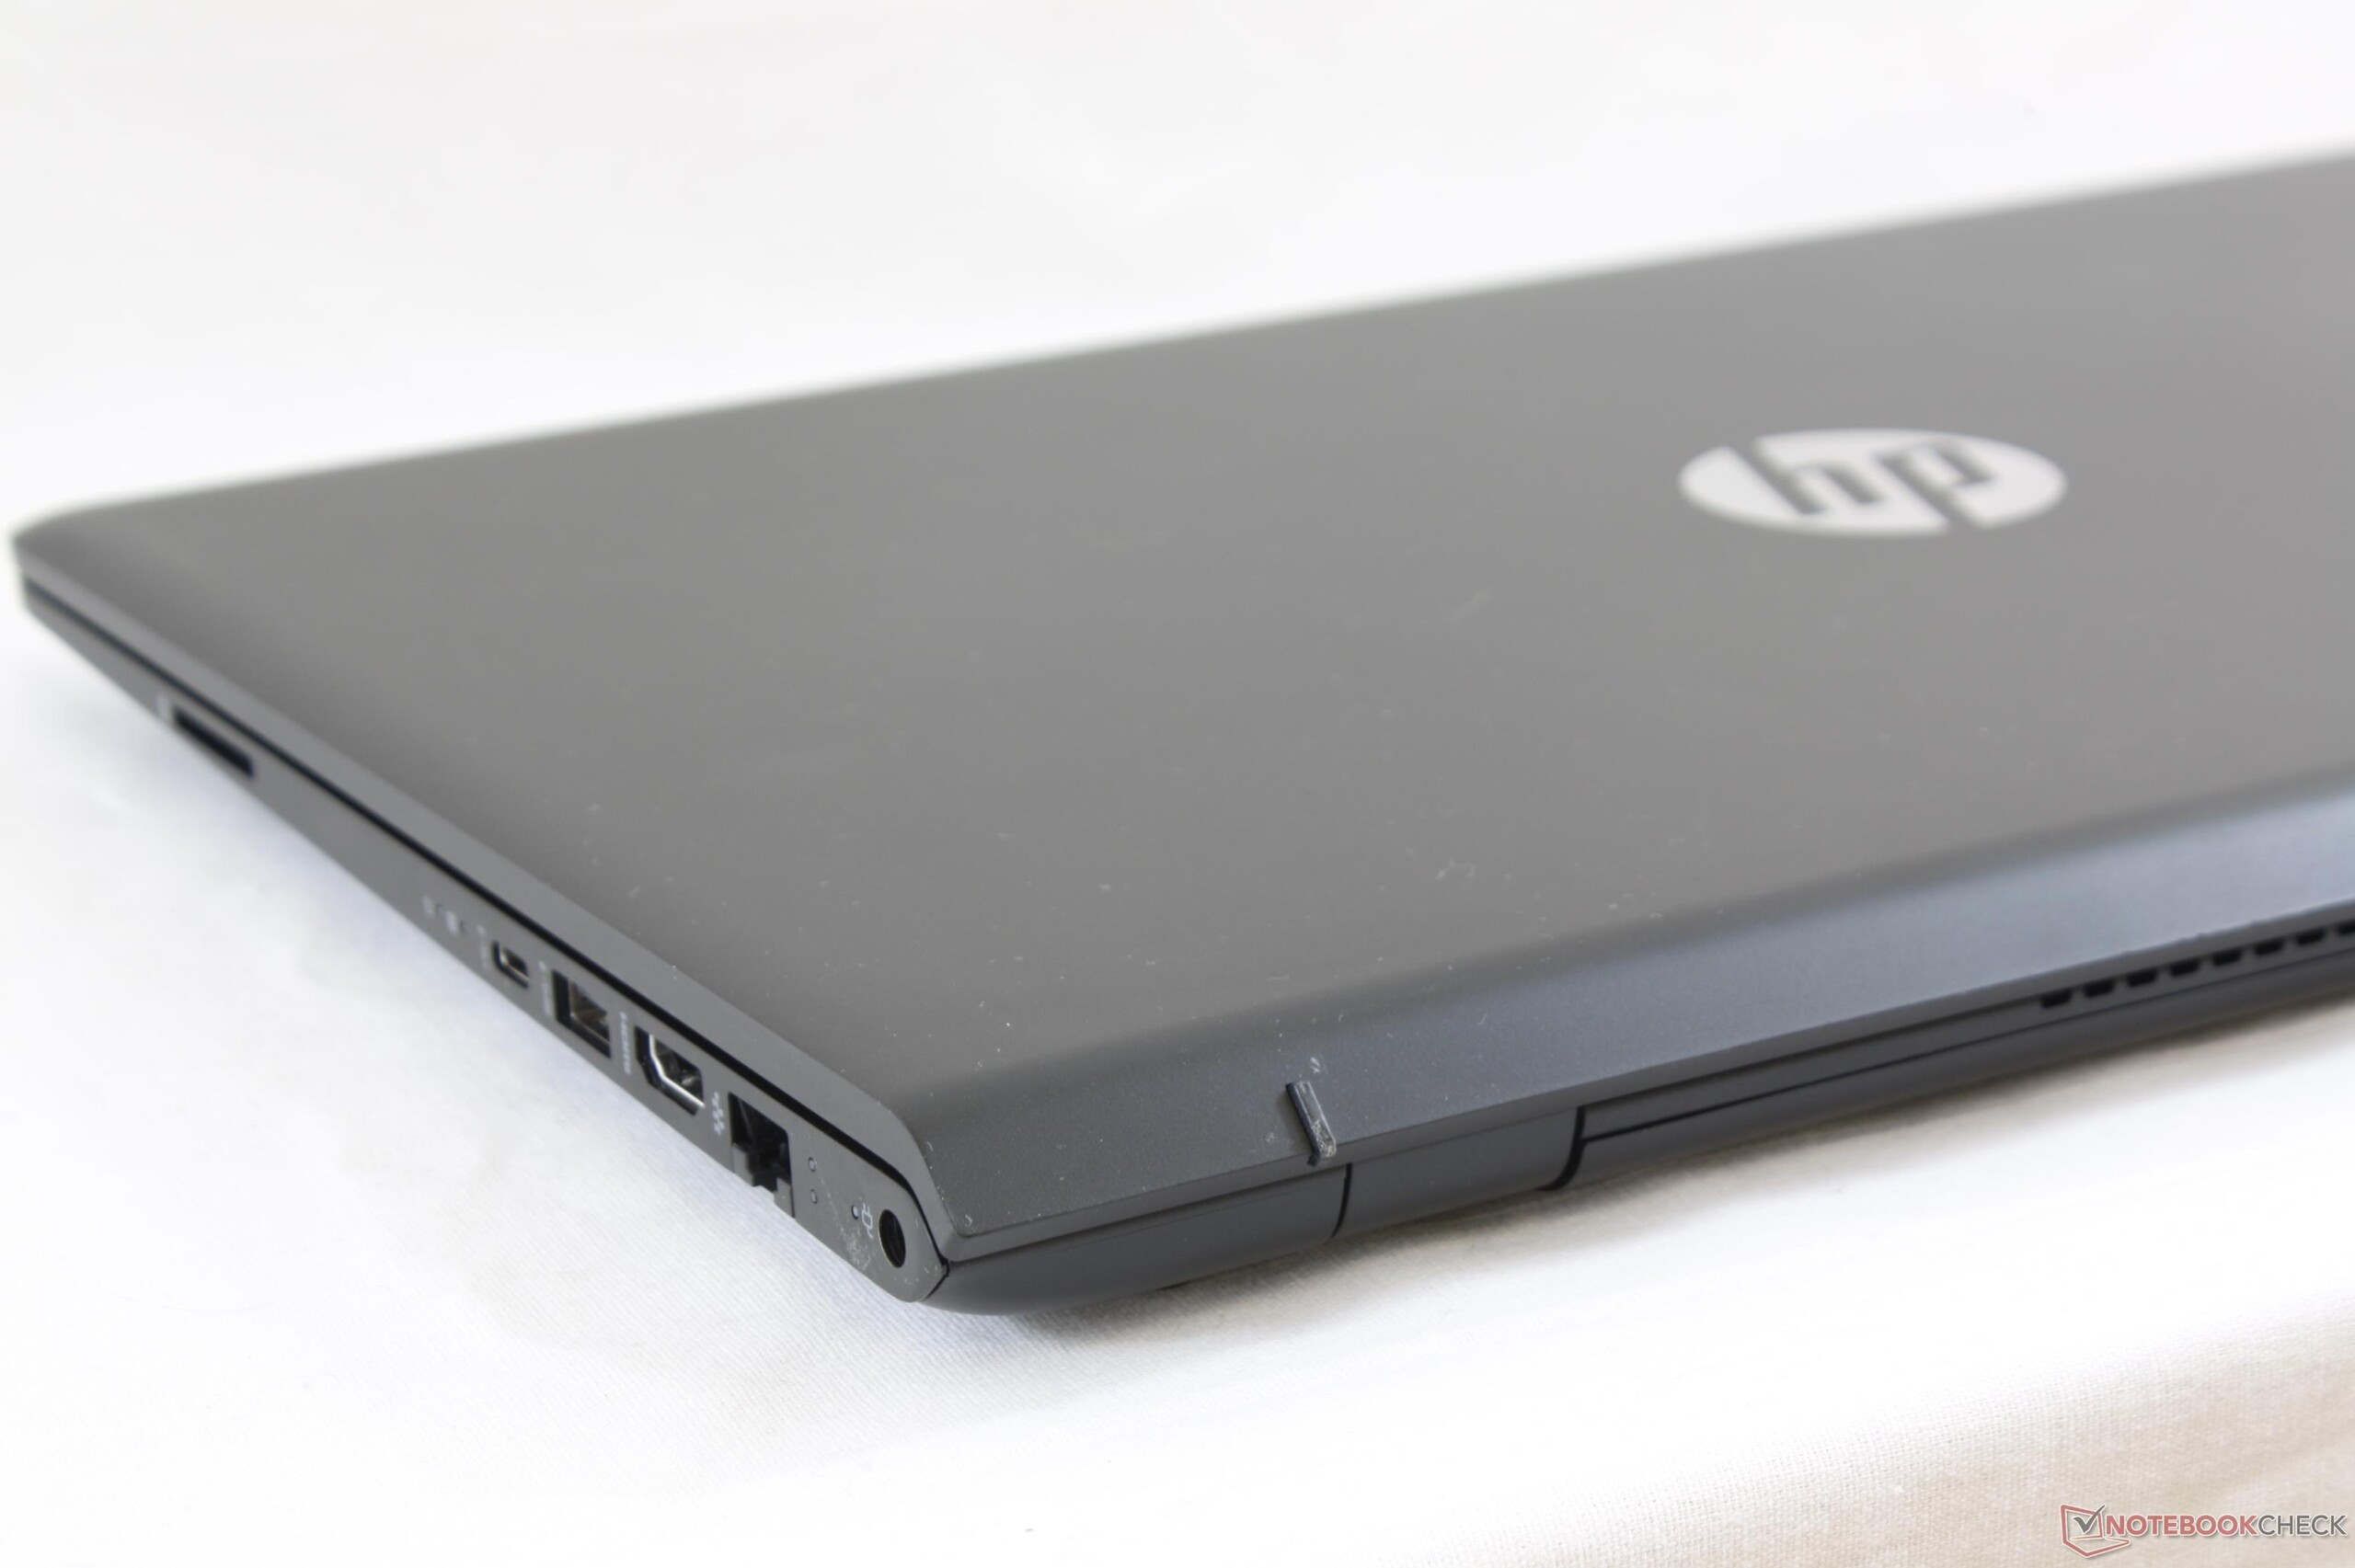
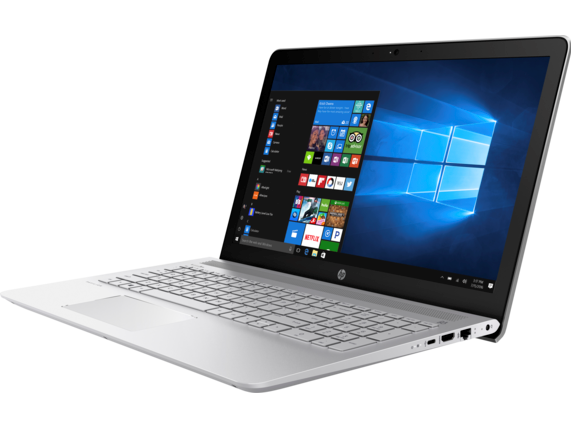
HP Pavilion 15 Power (i7-7700HQ, GTX 1050) Laptop rövid értékelés

| SD Card Reader | |
| average JPG Copy Test (av. of 3 runs) | |
| HP Pavilion 15 Power 1GK62AV | |
| Lenovo Legion Y520-15IKBN-80WK001KUS | |
| Samsung Odyssey NP800G5M-X01US | |
| maximum AS SSD Seq Read Test (1GB) | |
| Lenovo Legion Y520-15IKBN-80WK001KUS | |
| HP Pavilion 15 Power 1GK62AV | |
| Samsung Odyssey NP800G5M-X01US | |
| Networking | |
| iperf3 transmit AX12 | |
| Lenovo Yoga 720-15IKB-80X7 | |
| HP Pavilion 15 Power 1GK62AV | |
| Samsung Odyssey NP800G5M-X01US | |
| iperf3 receive AX12 | |
| Lenovo Yoga 720-15IKB-80X7 | |
| HP Pavilion 15 Power 1GK62AV | |
| Samsung Odyssey NP800G5M-X01US | |
| |||||||||||||||||||||||||
Fényerő megoszlás: 81 %
Centrumban: 256.6 cd/m²
Kontraszt: 1351:1 (Fekete: 0.19 cd/m²)
ΔE ColorChecker Calman: 5 | ∀{0.5-29.43 Ø4.71}
ΔE Greyscale Calman: 2.7 | ∀{0.09-98 Ø4.96}
57.7% sRGB (Argyll 1.6.3 3D)
36.7% AdobeRGB 1998 (Argyll 1.6.3 3D)
40.03% AdobeRGB 1998 (Argyll 3D)
57.9% sRGB (Argyll 3D)
38.81% Display P3 (Argyll 3D)
Gamma: 2.32
CCT: 6599 K
| HP Pavilion 15 Power 1GK62AV ID: AU Optronics AUO41ED, IPS, 15.6", 1920x1080 | Lenovo Yoga 720-15IKB-80X7 Chi Mei CMN N156HCE-EN1, IPS, 15.6", 1920x1080 | Lenovo Legion Y520-15IKBN-80WK001KUS LP156WF6-SPK3, IPS, 15.6", 1920x1080 | Acer Aspire VX15 VX5-591G-589S BOE CQ NV156HFM-N42, IPS, 15.6", 1920x1080 | Samsung Odyssey NP800G5M-X01US IPS, 15.6", 1920x1080 | HP Pavilion 15t-X7P42AV AU Optronics AUO41ED, IPS, 15.6", 1920x1080 | |
|---|---|---|---|---|---|---|
| Display | 63% | 4% | 22% | -2% | ||
| Display P3 Coverage (%) | 38.81 | 65 67% | 40.56 5% | 47.11 21% | 38.03 -2% | |
| sRGB Coverage (%) | 57.9 | 90.8 57% | 59.4 3% | 70.4 22% | 56.5 -2% | |
| AdobeRGB 1998 Coverage (%) | 40.03 | 65.8 64% | 41.9 5% | 48.71 22% | 39.29 -2% | |
| Response Times | 15% | -41% | -20% | -10% | -6% | |
| Response Time Grey 50% / Grey 80% * (ms) | 38.8 ? | 29.6 ? 24% | 58.8 ? -52% | 46 ? -19% | 38.8 ? -0% | 44.4 ? -14% |
| Response Time Black / White * (ms) | 28 ? | 26.4 ? 6% | 36 ? -29% | 34 ? -21% | 33.6 ? -20% | 27.2 ? 3% |
| PWM Frequency (Hz) | 25510 ? | 21550 ? | 20000 ? | 19230 ? | ||
| Screen | 2% | -29% | 2% | -28% | -31% | |
| Brightness middle (cd/m²) | 256.6 | 300.9 17% | 239 -7% | 277 8% | 255.9 0% | 209.7 -18% |
| Brightness (cd/m²) | 243 | 285 17% | 244 0% | 268 10% | 249 2% | 193 -21% |
| Brightness Distribution (%) | 81 | 92 14% | 88 9% | 91 12% | 90 11% | 75 -7% |
| Black Level * (cd/m²) | 0.19 | 0.24 -26% | 0.35 -84% | 0.26 -37% | 0.48 -153% | 0.19 -0% |
| Contrast (:1) | 1351 | 1254 -7% | 683 -49% | 1065 -21% | 533 -61% | 1104 -18% |
| Colorchecker dE 2000 * | 5 | 5 -0% | 7.3 -46% | 5.05 -1% | 5.9 -18% | 7.8 -56% |
| Colorchecker dE 2000 max. * | 20.1 | 10.2 49% | 24.7 -23% | 8.93 56% | 18.9 6% | 24.1 -20% |
| Greyscale dE 2000 * | 2.7 | 7 -159% | 4.9 -81% | 2.97 -10% | 5.6 -107% | 7.3 -170% |
| Gamma | 2.32 95% | 2.34 94% | 2.19 100% | 2.39 92% | 2.21 100% | 2.39 92% |
| CCT | 6599 98% | 6578 99% | 7332 89% | 6466 101% | 7250 90% | 5771 113% |
| Color Space (Percent of AdobeRGB 1998) (%) | 36.7 | 59 61% | 35 -5% | 38 4% | 44.8 22% | 39.3 7% |
| Color Space (Percent of sRGB) (%) | 57.7 | 90 56% | 55 -5% | 59 2% | 70.1 21% | 56.5 -2% |
| Teljes átlag (program / beállítások) | 27% /
16% | -35% /
-31% | -5% /
-0% | -5% /
-15% | -13% /
-21% |
* ... a kisebb jobb
Megjelenítési válaszidők
| ↔ Válaszidő Fekete-fehér | ||
|---|---|---|
| 28 ms ... emelkedés és süllyedés ↘ kombinálva | ↗ 16.4 ms emelkedés | 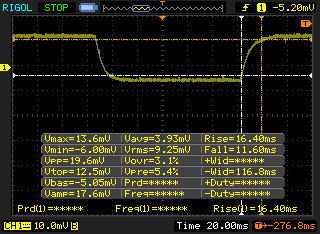 |
| ↘ 11.6 ms ősz | ||
| A képernyő viszonylag lassú reakciósebességet mutat tesztjeinkben, és túl lassú lehet a játékosok számára. Összehasonlításképpen, az összes tesztelt eszköz 0.1 (minimum) és 240 (maximum) ms között mozog. » 71 % of all devices are better. Ez azt jelenti, hogy a mért válaszidő rosszabb, mint az összes vizsgált eszköz átlaga (19.8 ms). | ||
| ↔ Válaszidő 50% szürke és 80% szürke között | ||
| 38.8 ms ... emelkedés és süllyedés ↘ kombinálva | ↗ 20 ms emelkedés | 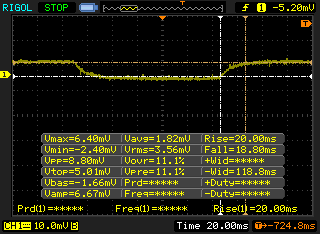 |
| ↘ 18.8 ms ősz | ||
| A képernyő lassú reakciósebességet mutat tesztjeinkben, és nem lesz kielégítő a játékosok számára. Összehasonlításképpen, az összes tesztelt eszköz 0.165 (minimum) és 636 (maximum) ms között mozog. » 58 % of all devices are better. Ez azt jelenti, hogy a mért válaszidő rosszabb, mint az összes vizsgált eszköz átlaga (31 ms). | ||
Képernyő villogása / PWM (impulzusszélesség-moduláció)
| Képernyő villogása / PWM nem érzékelhető | 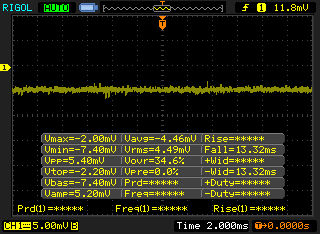 | ||
Összehasonlításképpen: az összes tesztelt eszköz 52 %-a nem használja a PWM-et a kijelző elsötétítésére. Ha PWM-et észleltek, akkor átlagosan 7754 (minimum: 5 - maximum: 343500) Hz-t mértek. | |||
| wPrime 2.10 - 1024m | |
| Lenovo IdeaPad Y50 | |
| HP Pavilion 15 Power 1GK62AV | |
| MSI GP62-2QEi781FD | |
| Eurocom Tornado F5 | |
* ... a kisebb jobb
| PCMark 8 | |
| Home Score Accelerated v2 | |
| HP Pavilion 15 Power 1GK62AV | |
| Samsung Odyssey NP800G5M-X01US | |
| Lenovo Yoga 720-15IKB-80X7 | |
| Work Score Accelerated v2 | |
| Samsung Odyssey NP800G5M-X01US | |
| HP Pavilion 15 Power 1GK62AV | |
| Lenovo Yoga 720-15IKB-80X7 | |
| Creative Score Accelerated v2 | |
| Samsung Odyssey NP800G5M-X01US | |
| HP Pavilion 15 Power 1GK62AV | |
| Lenovo Yoga 720-15IKB-80X7 | |
| PCMark 8 Home Score Accelerated v2 | 4042 pontok | |
| PCMark 8 Creative Score Accelerated v2 | 5328 pontok | |
| PCMark 8 Work Score Accelerated v2 | 4964 pontok | |
Segítség | ||
| HP Pavilion 15 Power 1GK62AV SK Hynix HFS256G39TND-N210A | Lenovo Yoga 720-15IKB-80X7 Samsung PM961 MZVLW256HEHP | Lenovo Legion Y520-15IKBN-80WK001KUS Samsung PM961 MZVLW256HEHP | Acer Aspire VX15 VX5-591G-589S Hynix HFS128G39TND | Samsung Odyssey NP800G5M-X01US Samsung PM961 NVMe MZVLW128HEGR | |
|---|---|---|---|---|---|
| AS SSD | -103% | 289% | 1% | 145% | |
| Copy Game MB/s (MB/s) | 204.3 | 1115 446% | 157.6 -23% | 240.5 18% | |
| Copy Program MB/s (MB/s) | 176.6 | 502 184% | 111.1 -37% | 299.5 70% | |
| Copy ISO MB/s (MB/s) | 297.3 | 1912 543% | 195 -34% | 1560 425% | |
| Score Total (Points) | 828 | 942 14% | 2617 216% | 882 7% | 1592 92% |
| Score Write (Points) | 210 | 48 -77% | 807 284% | 218 4% | 376 79% |
| Score Read (Points) | 416 | 646 55% | 1232 196% | 444 7% | 852 105% |
| Access Time Write * (ms) | 0.252 | 4.15 -1547% | 0.027 89% | 0.261 -4% | 0.031 88% |
| Access Time Read * (ms) | 0.12 | 0.08 33% | 0.065 46% | 0.077 36% | 0.066 45% |
| 4K-64 Write (MB/s) | 130.7 | 15.3 -88% | 529 305% | 113.9 -13% | 176.4 35% |
| 4K-64 Read (MB/s) | 338.8 | 371.6 10% | 919 171% | 361.4 7% | 564 66% |
| 4K Write (MB/s) | 66.5 | 1.2 -98% | 139.4 110% | 90.8 37% | 124.1 87% |
| 4K Read (MB/s) | 25.83 | 47.1 82% | 48.57 88% | 32.29 25% | 44.75 73% |
| Seq Write (MB/s) | 132.3 | 311.7 136% | 1392 952% | 130.2 -2% | 752 468% |
| Seq Read (MB/s) | 509 | 2277 347% | 2649 420% | 507 0% | 2433 378% |
* ... a kisebb jobb

| 3DMark 11 Performance | 7467 pontok | |
| 3DMark Ice Storm Standard Score | 114747 pontok | |
| 3DMark Cloud Gate Standard Score | 20367 pontok | |
| 3DMark Fire Strike Score | 5451 pontok | |
| 3DMark Fire Strike Extreme Score | 2630 pontok | |
Segítség | ||
| Rise of the Tomb Raider - 1920x1080 Very High Preset AA:FX AF:16x | |
| Aorus x3 Plus v7 | |
| Asus Strix GL502VT-DS74 | |
| MSI GeForce GTX 1050 Ti | |
| Zotac GeForce GTX 1050 2GB | |
| HP Pavilion 15 Power 1GK62AV | |
| HP Omen 15-ax007ng | |
| HP Pavilion 17 FHD V3A33AV | |
| Asus N752VX-GC131T | |
| alacsony | közepes | magas | ultra | |
|---|---|---|---|---|
| Guild Wars 2 (2012) | 43.3 | |||
| StarCraft II: Heart of the Swarm (2013) | 114 | |||
| BioShock Infinite (2013) | 63.1 | |||
| Metro: Last Light (2013) | 78.9 | 43.6 | ||
| Thief (2014) | 73.8 | 41.4 | ||
| The Witcher 3 (2015) | 69 | 40.2 | 21 | |
| Batman: Arkham Knight (2015) | 89 | 78 | 44 | |
| Metal Gear Solid V (2015) | 60 | 60 | 60 | 48.2 |
| Dota 2 Reborn (2015) | 94.9 | |||
| Fallout 4 (2015) | 41.8 | 33.7 | ||
| Rise of the Tomb Raider (2016) | 38.4 | 32.9 | ||
| Ashes of the Singularity (2016) | 54.3 | 38.7 | 33.8 | |
| Doom (2016) | 103.6 | 81.5 | 38.4 | 35.3 |
| Overwatch (2016) | 92.2 | 55.5 | ||
| Mafia 3 (2016) | 40.6 | 27.8 | ||
| Prey (2017) | 144 | 83.3 | 60.7 | 49.9 |
Zajszint
| Üresjárat |
| 32.1 / 32.2 / 32.2 dB(A) |
| Terhelés |
| 43.3 / 49.6 dB(A) |
 | ||
30 dB csendes 40 dB(A) hallható 50 dB(A) hangos |
||
min: | ||
| HP Pavilion 15 Power 1GK62AV GeForce GTX 1050 Mobile, i7-7700HQ, SK Hynix HFS256G39TND-N210A | Lenovo Yoga 720-15IKB-80X7 GeForce GTX 1050 Mobile, i7-7700HQ, Samsung PM961 MZVLW256HEHP | Lenovo Legion Y520-15IKBN-80WK001KUS GeForce GTX 1050 Ti Mobile, i7-7700HQ, Samsung PM961 MZVLW256HEHP | Samsung Odyssey NP800G5M-X01US GeForce GTX 1050 Mobile, i7-7700HQ, Samsung PM961 NVMe MZVLW128HEGR | HP Pavilion 15t-bc200 X7P44AV GeForce GTX 1050 Mobile, i7-7700HQ, Intel SSD 600p SSDPEKKW256G7 | |
|---|---|---|---|---|---|
| Noise | 9% | 7% | 3% | 1% | |
| off / környezet * (dB) | 27.8 | 28.2 -1% | 27.7 -0% | 28.1 -1% | 28.9 -4% |
| Idle Minimum * (dB) | 32.1 | 28.2 12% | 30.5 5% | 28.1 12% | 32.3 -1% |
| Idle Average * (dB) | 32.2 | 28.2 12% | 30.5 5% | 29.1 10% | 32.3 -0% |
| Idle Maximum * (dB) | 32.2 | 28.2 12% | 30.6 5% | 29.1 10% | 32.3 -0% |
| Load Average * (dB) | 43.3 | 39 10% | 40 8% | 49.2 -14% | 43.2 -0% |
| Witcher 3 ultra * (dB) | 45 | 40 11% | |||
| Load Maximum * (dB) | 49.6 | 46.3 7% | 42.6 14% | 49.2 1% | 45.2 9% |
* ... a kisebb jobb
(±) A felső oldalon a maximális hőmérséklet 44.6 °C / 112 F, összehasonlítva a 36.8 °C / 98 F átlagával , 21 és 71 °C között a Multimedia osztálynál.
(-) Az alsó maximum 60 °C / 140 F-ig melegszik fel, összehasonlítva a 39.1 °C / 102 F átlagával
(+) Üresjáratban a felső oldal átlagos hőmérséklete 26.2 °C / 79 F, összehasonlítva a 31.3 °C / ### eszközátlaggal class_avg_f### F.
(±) A The Witcher 3 játék során a felső oldal átlaghőmérséklete 34.4 °C / 94 F, összehasonlítva a 31.3 °C / ## eszközátlaggal #class_avg_f### F.
(-) A csuklótámasz és az érintőpad tapintásra nagyon felforrósodhat, maximum 41 °C / 105.8 F.
(-) A hasonló eszközök csuklótámasz területének átlagos hőmérséklete 28.7 °C / 83.7 F volt (-12.3 °C / -22.1 F).
HP Pavilion 15 Power 1GK62AV hangelemzés
(-) | nem túl hangos hangszórók (68.5 dB)
Basszus 100 - 315 Hz
(-) | szinte nincs basszus – átlagosan 17.7%-kal alacsonyabb a mediánnál
(±) | a basszus linearitása átlagos (13.4% delta az előző frekvenciához)
Közepes 400-2000 Hz
(+) | kiegyensúlyozott középpontok – csak 4.2% választja el a mediántól
(±) | a középpontok linearitása átlagos (8.8% delta az előző gyakorisághoz)
Maximum 2-16 kHz
(+) | kiegyensúlyozott csúcsok – csak 3.5% választja el a mediántól
(±) | a csúcsok linearitása átlagos (11.6% delta az előző gyakorisághoz)
Összességében 100 - 16.000 Hz
(±) | az általános hang linearitása átlagos (26.8% eltérés a mediánhoz képest)
Ugyanazon osztályhoz képest
» 92%Ebben az osztályban az összes tesztelt eszköz %-a jobb volt, 2% hasonló, 6%-kal rosszabb
» A legjobb delta értéke 5%, az átlag 17%, a legrosszabb 45% volt
Az összes tesztelt eszközzel összehasonlítva
» 82% az összes tesztelt eszköz jobb volt, 4% hasonló, 14%-kal rosszabb
» A legjobb delta értéke 4%, az átlag 23%, a legrosszabb 134% volt
Apple MacBook 12 (Early 2016) 1.1 GHz hangelemzés
(+) | a hangszórók viszonylag hangosan tudnak játszani (83.6 dB)
Basszus 100 - 315 Hz
(±) | csökkentett basszus – átlagosan 11.3%-kal alacsonyabb, mint a medián
(±) | a basszus linearitása átlagos (14.2% delta az előző frekvenciához)
Közepes 400-2000 Hz
(+) | kiegyensúlyozott középpontok – csak 2.4% választja el a mediántól
(+) | a középpontok lineárisak (5.5% delta az előző frekvenciához)
Maximum 2-16 kHz
(+) | kiegyensúlyozott csúcsok – csak 2% választja el a mediántól
(+) | a csúcsok lineárisak (4.5% delta az előző frekvenciához képest)
Összességében 100 - 16.000 Hz
(+) | általános hangzás lineáris (10.2% eltérés a mediánhoz képest)
Ugyanazon osztályhoz képest
» 7%Ebben az osztályban az összes tesztelt eszköz %-a jobb volt, 2% hasonló, 90%-kal rosszabb
» A legjobb delta értéke 5%, az átlag 18%, a legrosszabb 53% volt
Az összes tesztelt eszközzel összehasonlítva
» 5% az összes tesztelt eszköz jobb volt, 1% hasonló, 94%-kal rosszabb
» A legjobb delta értéke 4%, az átlag 23%, a legrosszabb 134% volt
| Kikapcsolt állapot / Készenlét | |
| Üresjárat | |
| Terhelés |
|
Kulcs:
min: | |
| HP Pavilion 15 Power 1GK62AV i7-7700HQ, GeForce GTX 1050 Mobile, SK Hynix HFS256G39TND-N210A, IPS, 1920x1080, 15.6" | Samsung Odyssey NP800G5M-X01US i7-7700HQ, GeForce GTX 1050 Mobile, Samsung PM961 NVMe MZVLW128HEGR, IPS, 1920x1080, 15.6" | Lenovo Legion Y520-15IKBN-80WK001KUS i7-7700HQ, GeForce GTX 1050 Ti Mobile, Samsung PM961 MZVLW256HEHP, IPS, 1920x1080, 15.6" | Asus Strix GL502VT-DS74 6700HQ, GeForce GTX 970M, Lite-On CV1-8B128, IPS, 1920x1080, 15.6" | HP Pavilion 17 FHD V3A33AV 6700HQ, GeForce GTX 960M, SanDisk Z400s SD8SNAT-128G, IPS, 1920x1080, 17.3" | |
|---|---|---|---|---|---|
| Power Consumption | 7% | 4% | -30% | 12% | |
| Idle Minimum * (Watt) | 9.4 | 6.7 29% | 8.5 10% | 11.1 -18% | 5.3 44% |
| Idle Average * (Watt) | 9.7 | 8.9 8% | 9.1 6% | 14.1 -45% | 10.6 -9% |
| Idle Maximum * (Watt) | 16.8 | 10.8 36% | 9.7 42% | 18.4 -10% | 11.8 30% |
| Load Average * (Watt) | 76.5 | 81.8 -7% | 79.9 -4% | 96.5 -26% | 70.9 7% |
| Witcher 3 ultra * (Watt) | 86.5 | 92.2 -7% | 97.7 -13% | ||
| Load Maximum * (Watt) | 105.6 | 122.7 -16% | 121.5 -15% | 159.5 -51% | 119.8 -13% |
* ... a kisebb jobb
| HP Pavilion 15 Power 1GK62AV i7-7700HQ, GeForce GTX 1050 Mobile, 70 Wh | Lenovo Yoga 720-15IKB-80X7 i7-7700HQ, GeForce GTX 1050 Mobile, 72 Wh | Lenovo Legion Y520-15IKBN-80WK001KUS i7-7700HQ, GeForce GTX 1050 Ti Mobile, 45 Wh | Acer Aspire VX15 VX5-591G-589S i5-7300HQ, GeForce GTX 1050 Mobile, 52.5 Wh | Samsung Odyssey NP800G5M-X01US i7-7700HQ, GeForce GTX 1050 Mobile, 43 Wh | HP Pavilion 15t-X7P42AV i7-7700HQ, GeForce GTX 1050 Mobile, 63.3 Wh | |
|---|---|---|---|---|---|---|
| Akkumulátor üzemidő | 0% | -51% | -31% | -37% | -5% | |
| Reader / Idle (h) | 16.2 | 17.8 10% | 8.5 -48% | 10.2 -37% | 16 -1% | |
| WiFi v1.3 (h) | 8 | 8.1 1% | 4 -50% | 5.5 -31% | 4.4 -45% | 6.5 -19% |
| Load (h) | 1.8 | 1.6 -11% | 0.8 -56% | 1.3 -28% | 1.9 6% |
Pro
Kontra

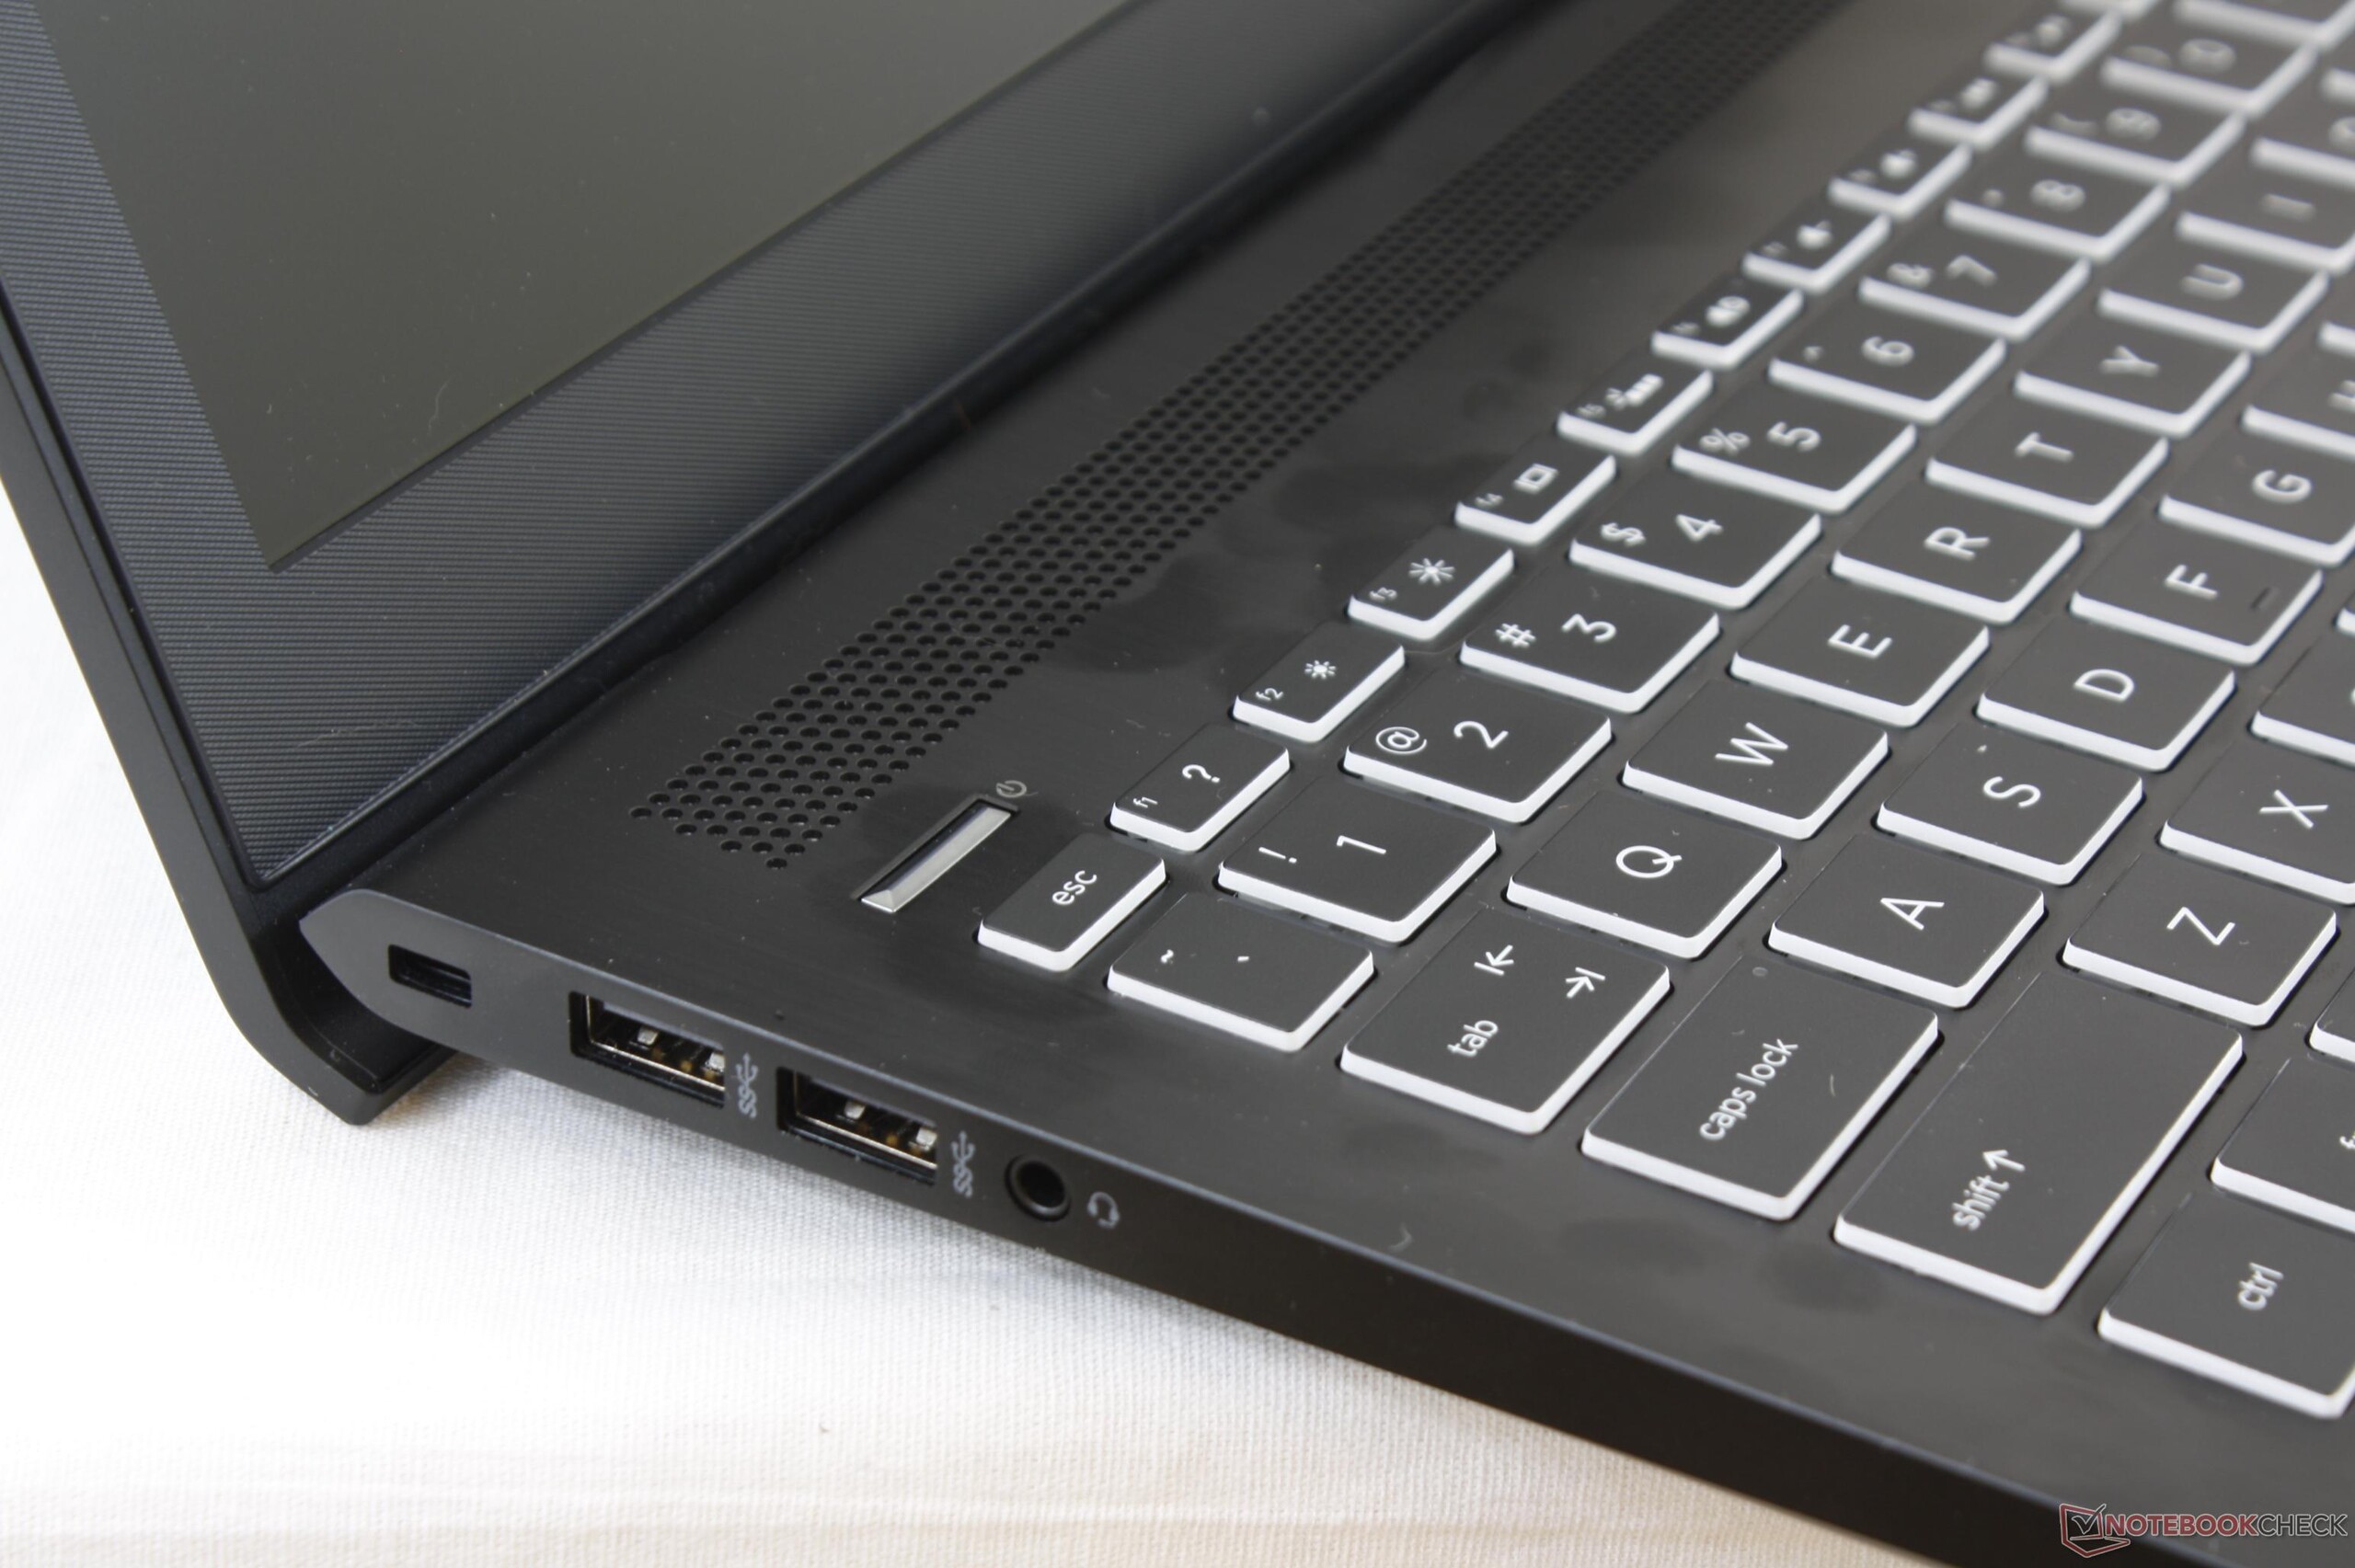
A Pavilion 15 Power erősebb, és sokkal inkább ajánlható notebook az alap Pavilion 15-höz képest, amennyiben a HQ CPU-k és Pascal-os videokártyák vonzóak. A ház jelentősen jobb lett, még a gépelés is kényelmesebb rajta, és a kijelző háttérfénye is erősebb, így összességében jobb érzés használni. Nem árt viszont tisztában lennünk azzal, hogy a kijelző nem annyira stabil, a karbantartása kényelmetlenebb, az sRGB lefedettsége kisebb, ami grafikus munkákhoz nem éppen jó választássá teszi.
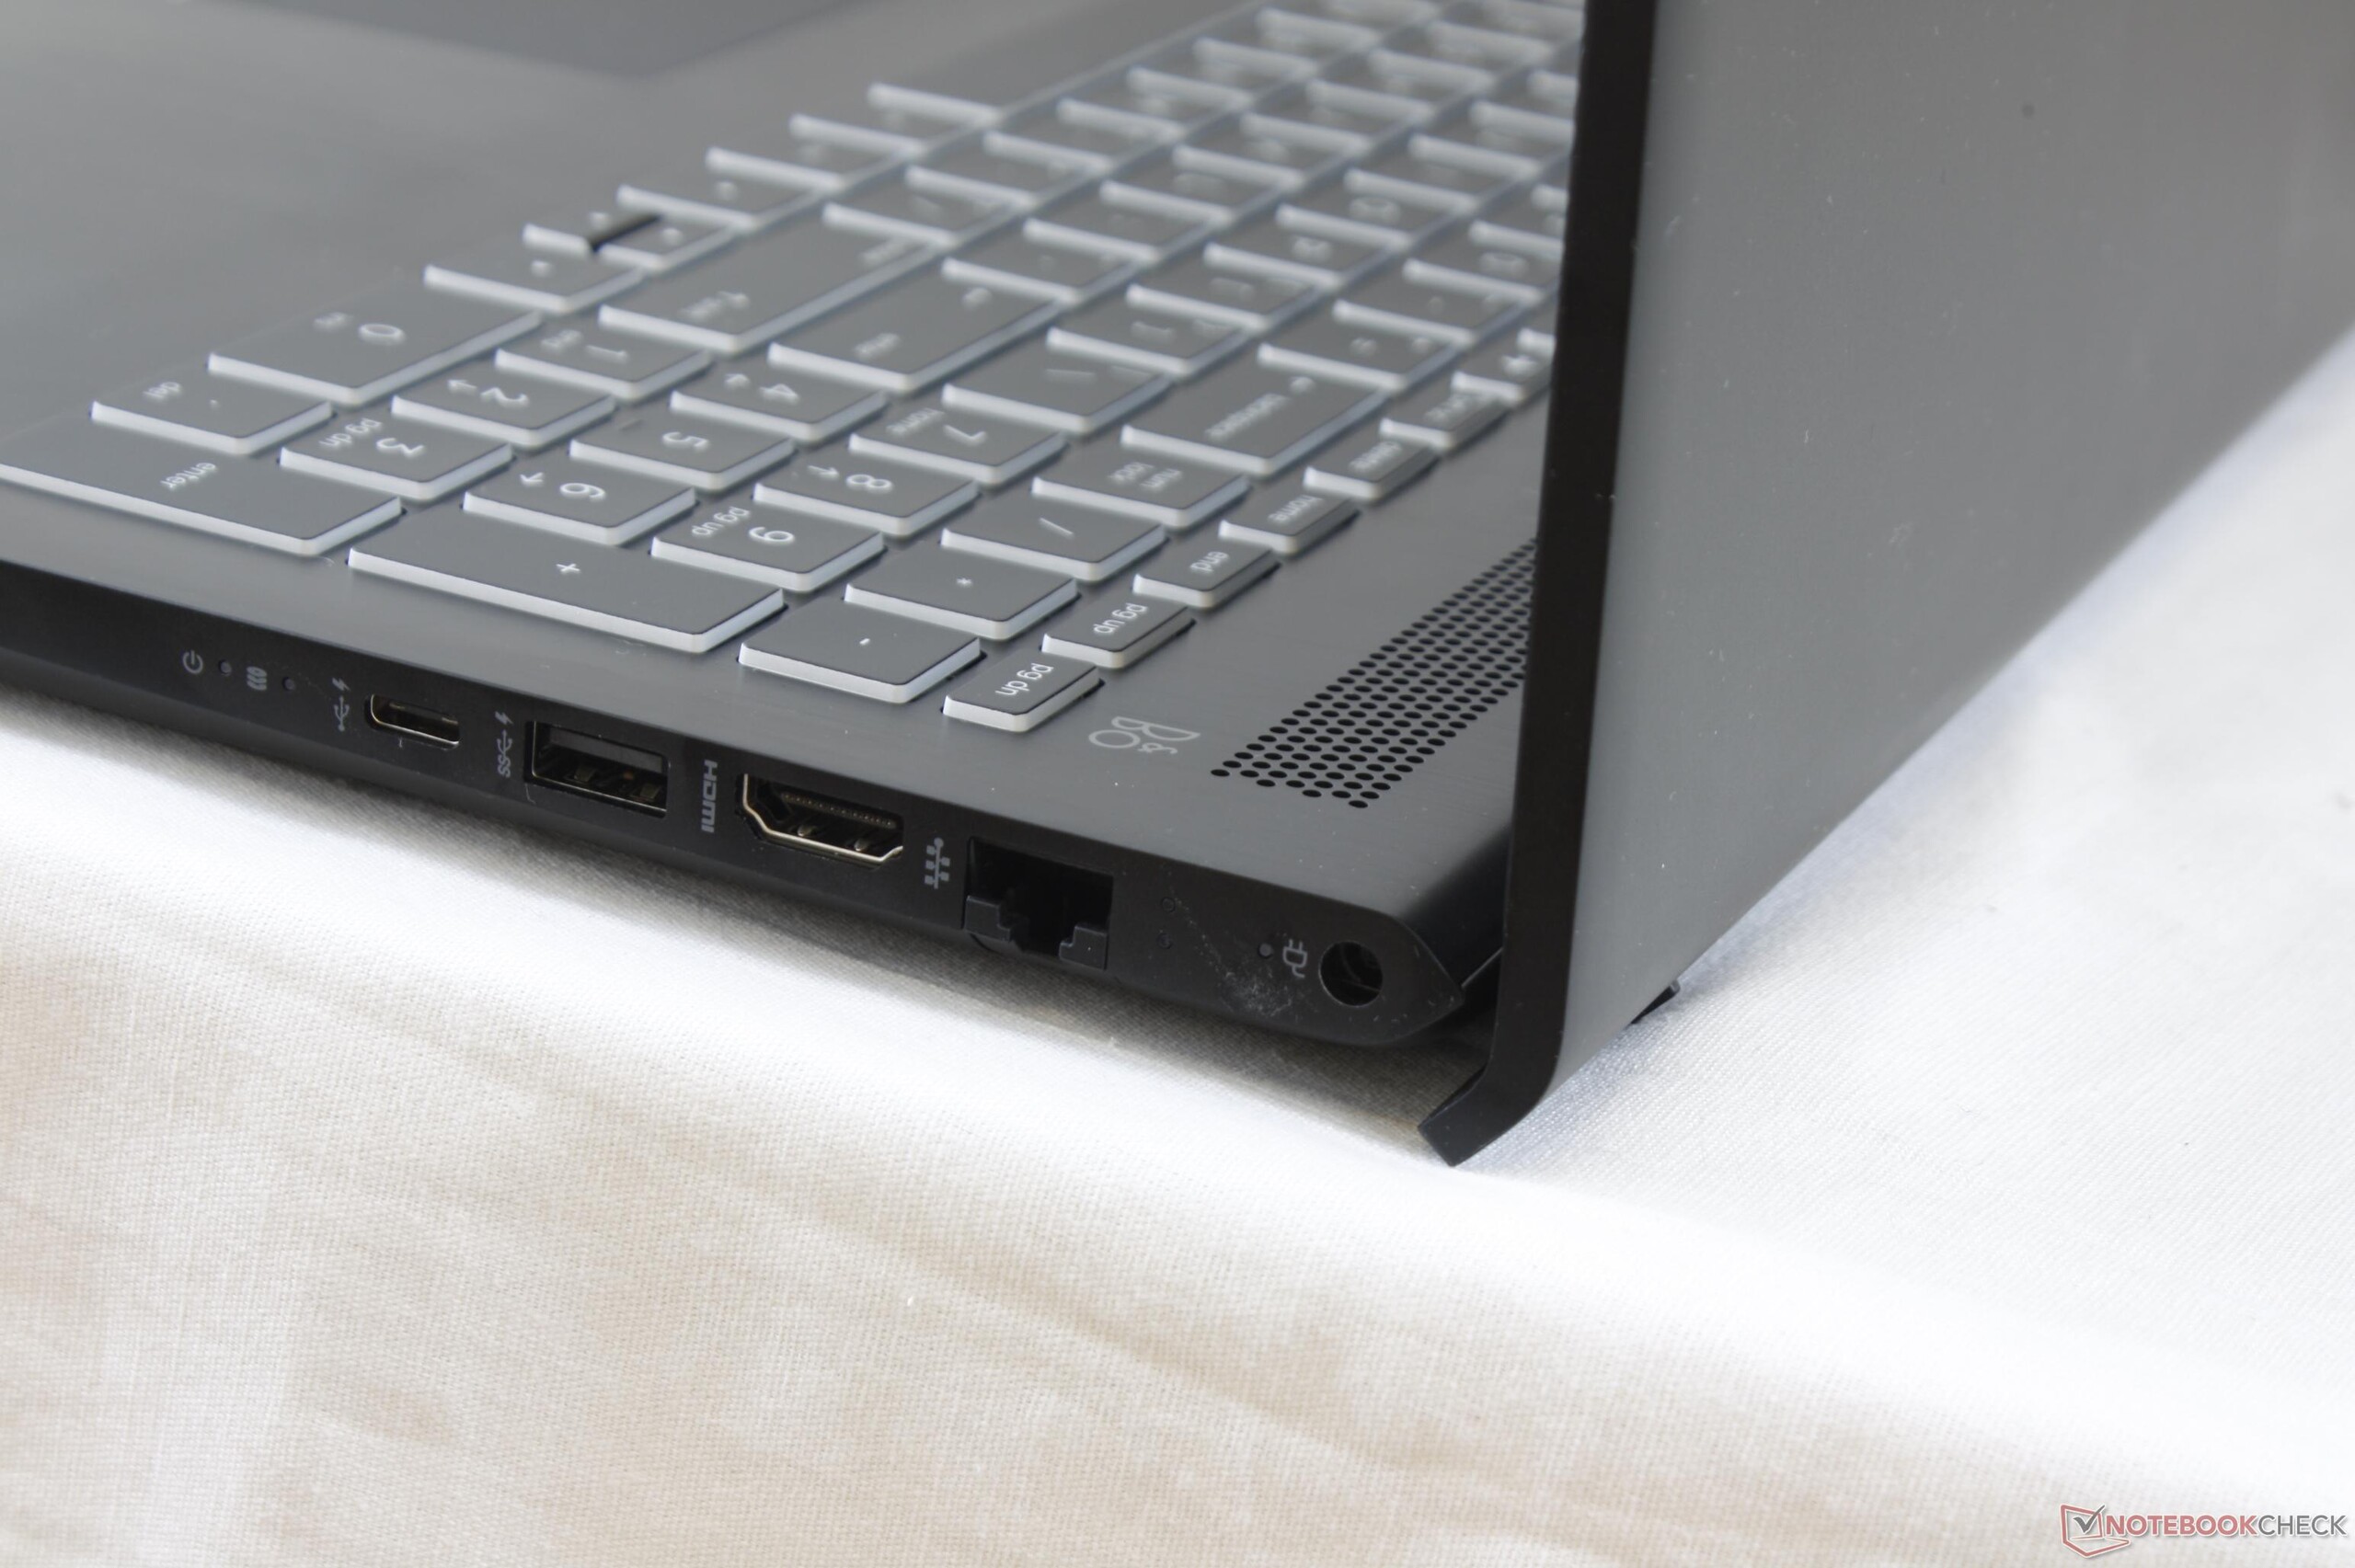
A Pavilion 15 Power fő problémája az árazása. Az XPS 15 9560 még mindig az etalon 15 inches notebook, és a két gépet hasonló konfigurációban (7700HQ, GTX 1050, FHD. 1 TB HDD, 8 GB RAM) összehasonlítva az XPS 15 ára jelenleg 1200 USD, a Pavilion 1040 USD-os árával szemben (HP.com, vagy 920 USD a Cukusa.com-on). Az extra 200-300 dollár viszont többszörösen megtérül, mivel a Dell egyértelműen megveri a Pavilion 15 Power-t hordozhatóság, csatlakozók, kijelző, karbantarthatóság és ház stabilitás terén is. Ugyan melegebb és némileg hangosabb is, de a hátrányainak felsorolásával sokkal hamarabb végzünk, mint az előnyökkel. Amennyiben a költségvetésünk szoros, úgy viszont egyértelműen a Pavilion 15 Power-t javasoljuk a régebbi Pavilion 15t-vel szemben.
Ez az eredeti értékelés rövidített változata. A teljes, angol nyelvű cikk itt olvasható.
HP Pavilion 15 Power 1GK62AV
- 07/03/2017 v6 (old)
Allen Ngo
Price comparison
