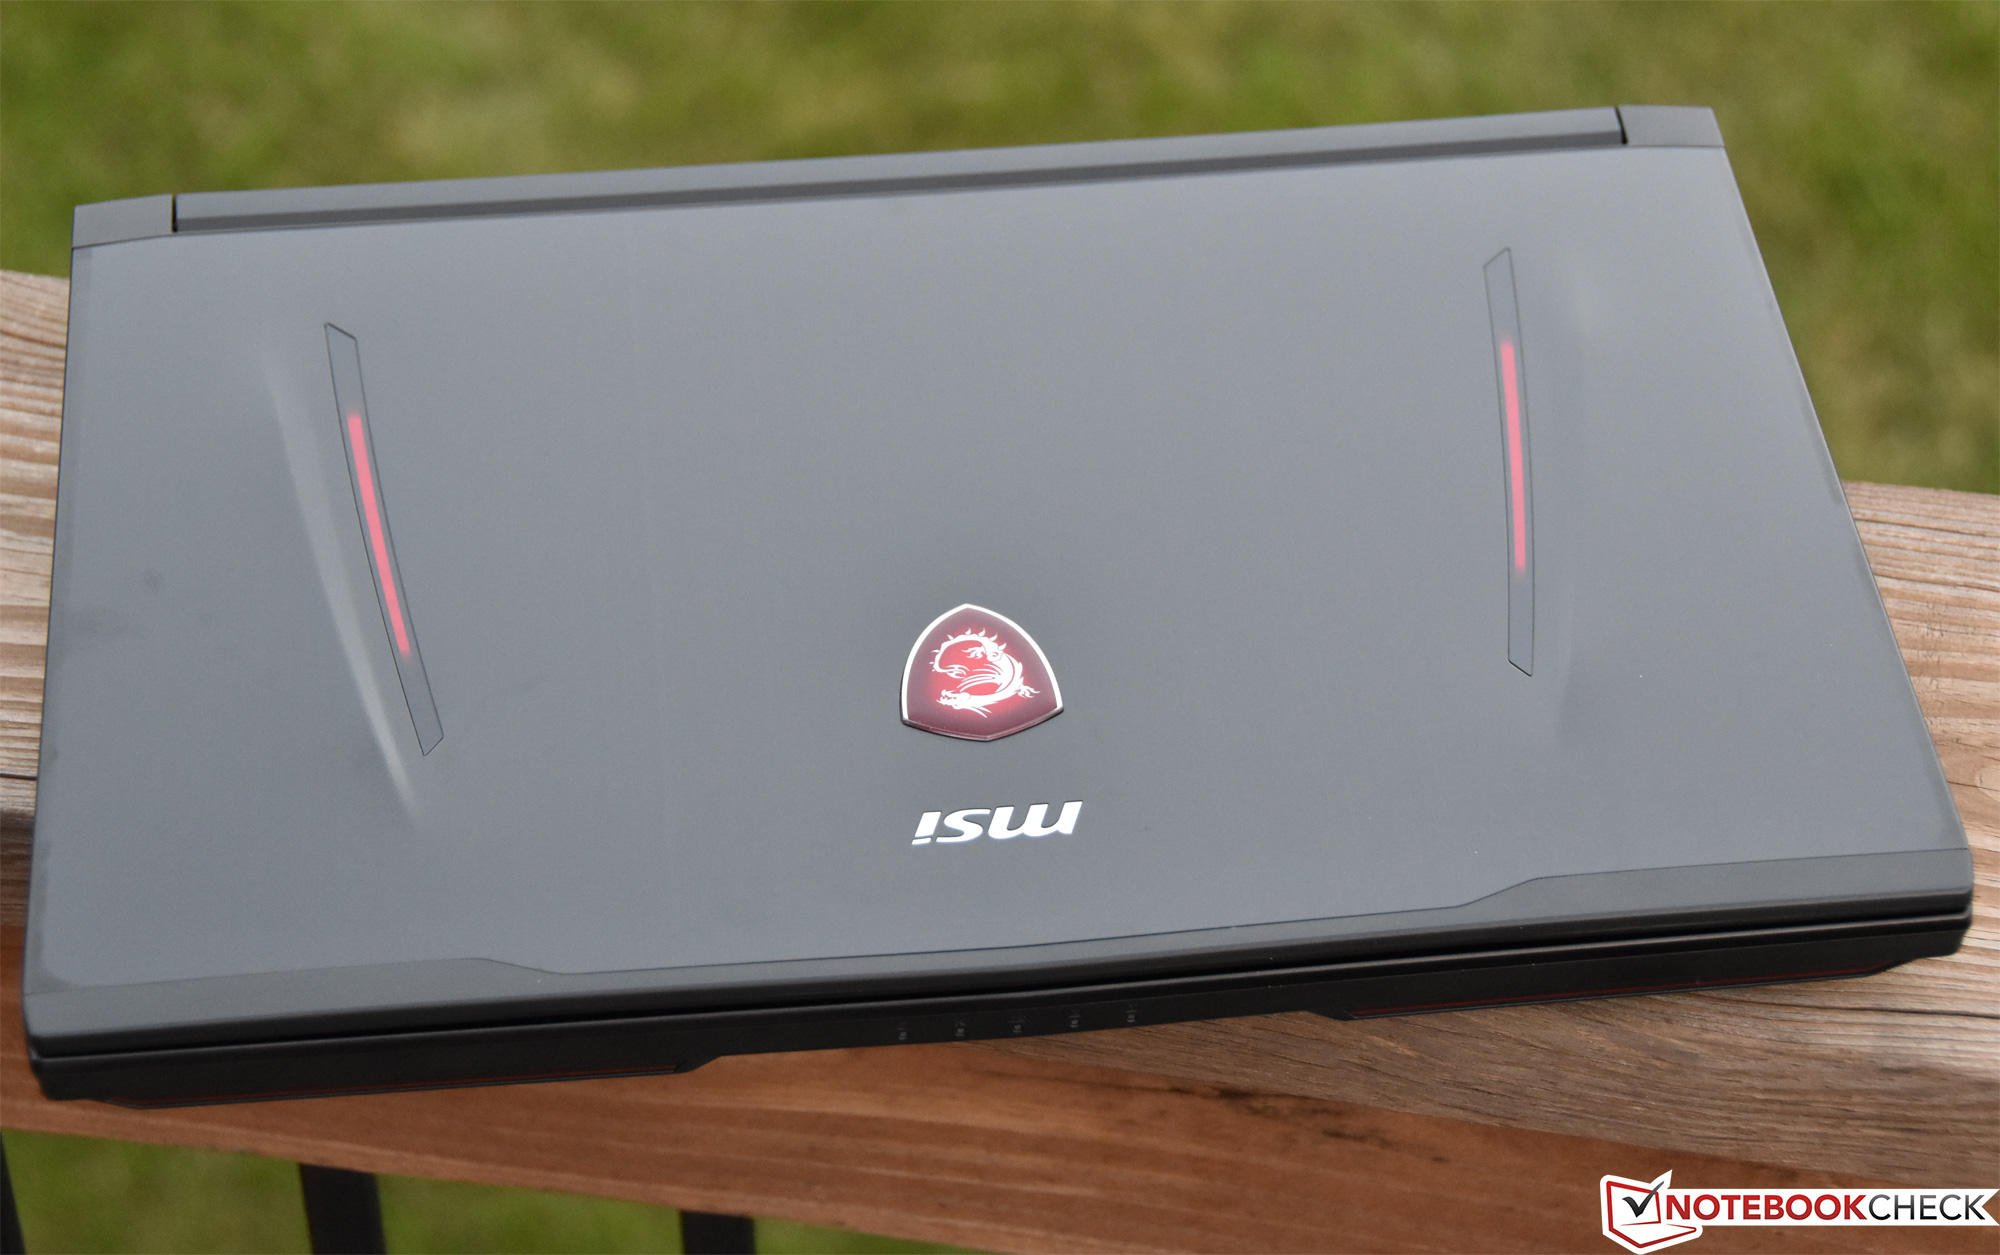
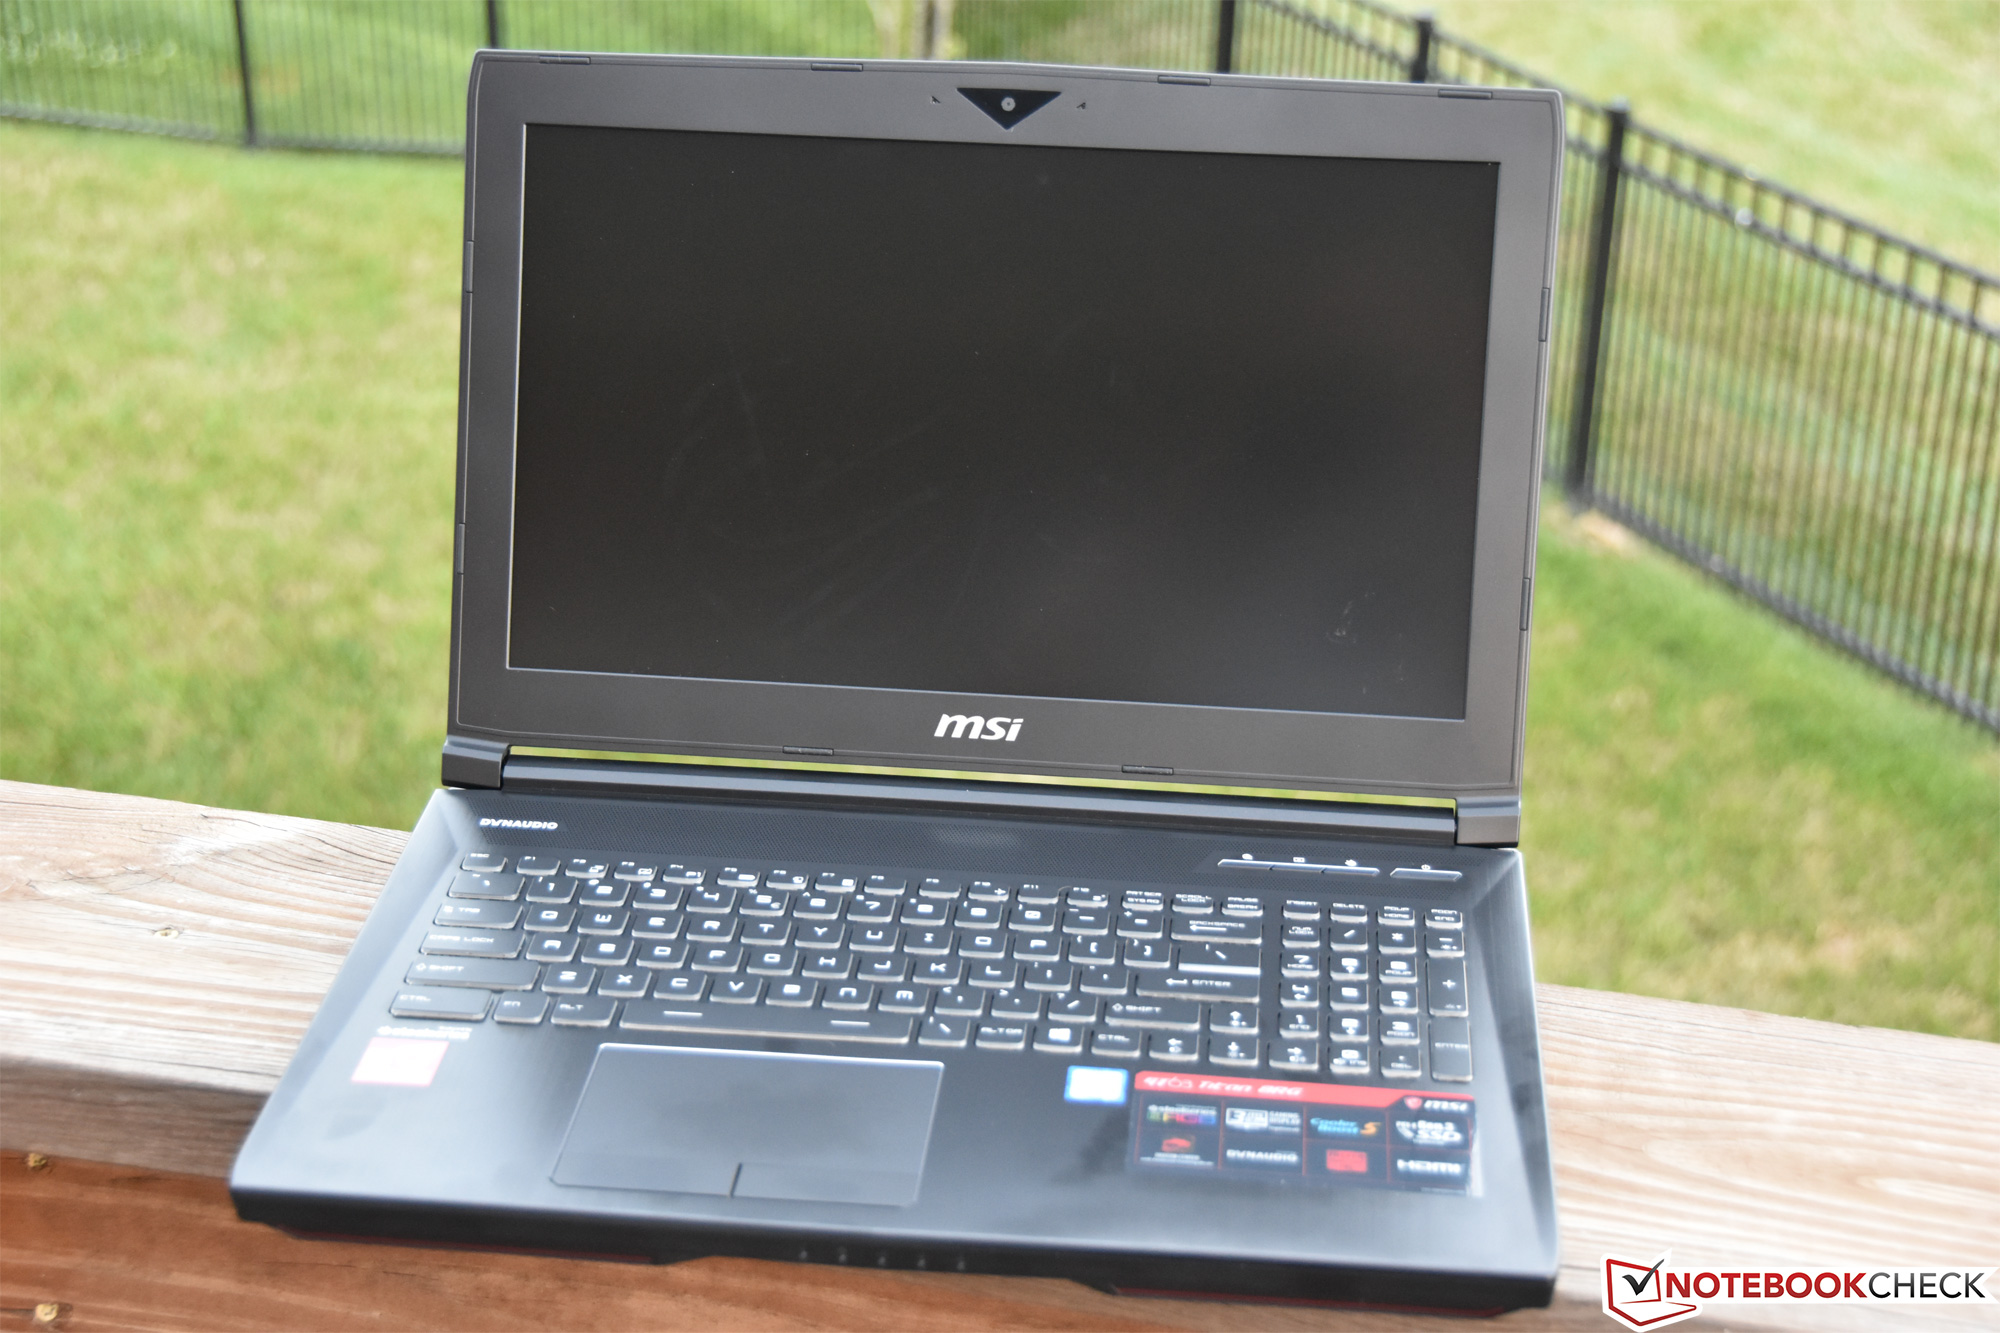
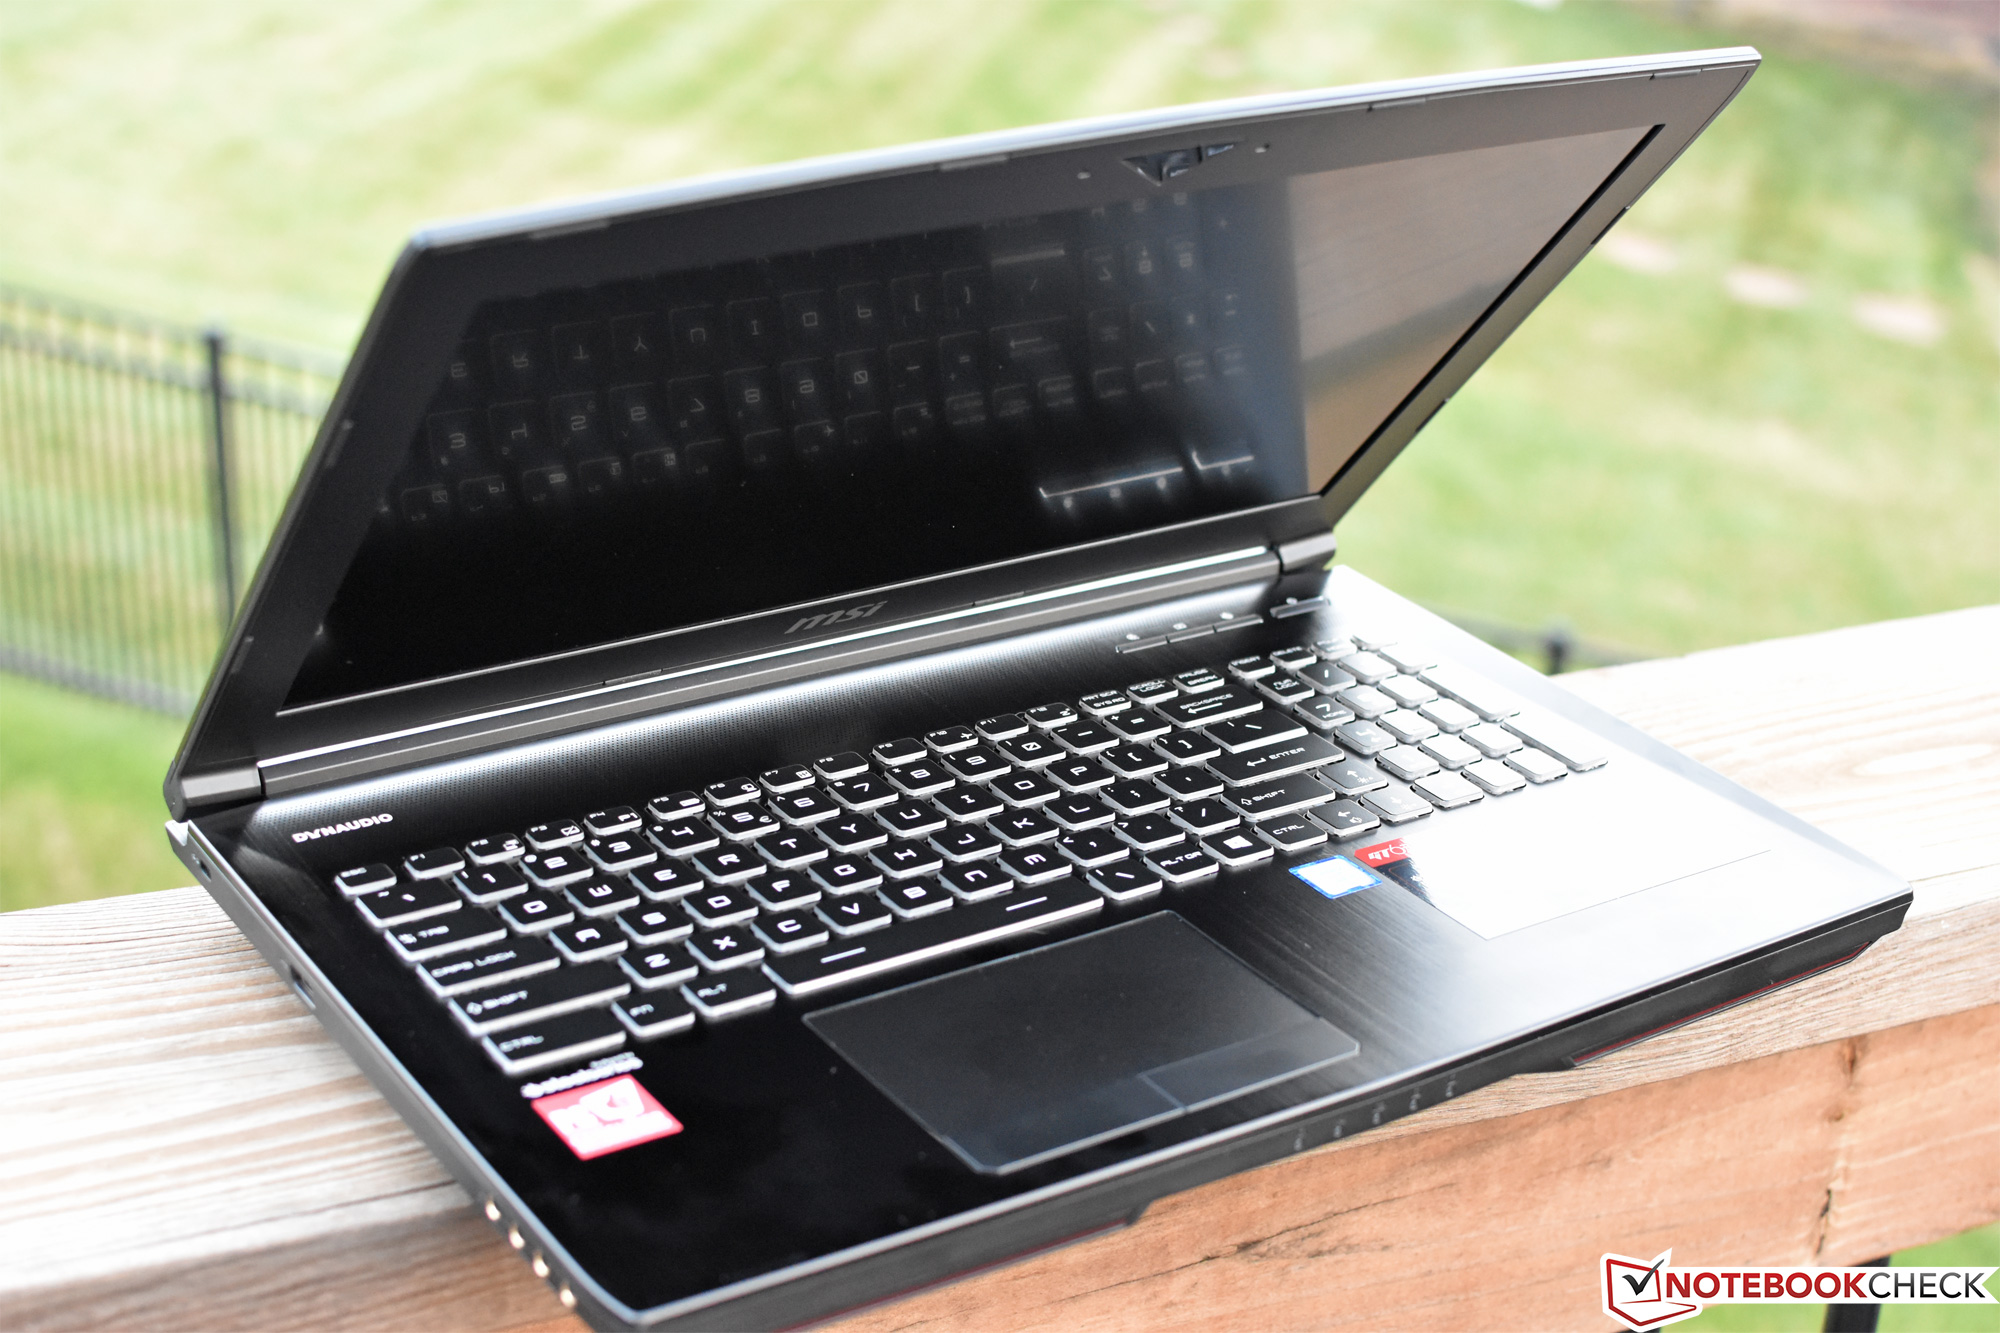
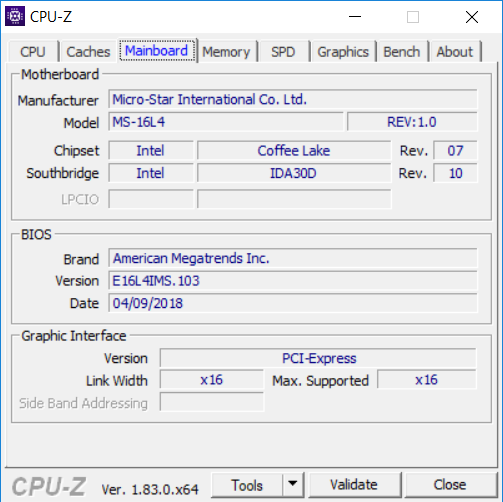
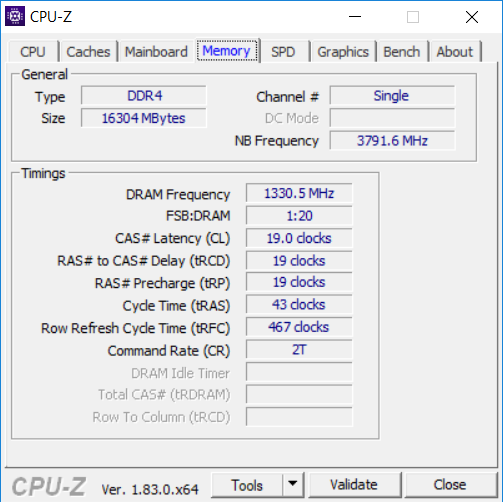
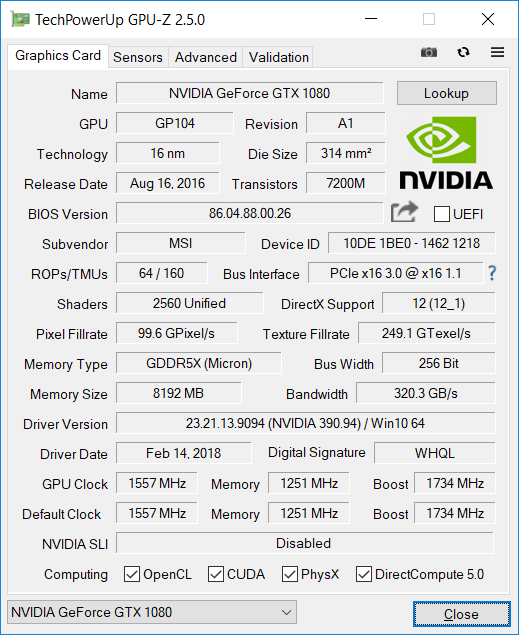
MSI GT63 Titan 8RG-046 (i7-8750H, GTX 1080, FHD) Laptop rövid értékelés


| SD Card Reader | |
| average JPG Copy Test (av. of 3 runs) | |
| Asus Chimera G703GI (Toshiba Exceria Pro SDXC 64 GB UHS-II) | |
| Az osztály átlaga Gaming (20.9 - 210, n=54, az elmúlt 2 évben) | |
| Lenovo Legion Y520-15IKBA-80WY001VGE (Toshiba Exceria Pro SDXC 64 GB UHS-II) | |
| Dell G5 15 5587 (Toshiba Exceria Pro SDXC 64 GB UHS-II) | |
| MSI GT63 Titan 8RG-046 (Toshiba Exceria Pro SDXC 64 GB UHS-II) | |
| maximum AS SSD Seq Read Test (1GB) | |
| Asus Chimera G703GI (Toshiba Exceria Pro SDXC 64 GB UHS-II) | |
| Az osztály átlaga Gaming (25.5 - 261, n=51, az elmúlt 2 évben) | |
| Lenovo Legion Y520-15IKBA-80WY001VGE (Toshiba Exceria Pro SDXC 64 GB UHS-II) | |
| Dell G5 15 5587 (Toshiba Exceria Pro SDXC 64 GB UHS-II) | |
| MSI GT63 Titan 8RG-046 (Toshiba Exceria Pro SDXC 64 GB UHS-II) | |
| |||||||||||||||||||||||||
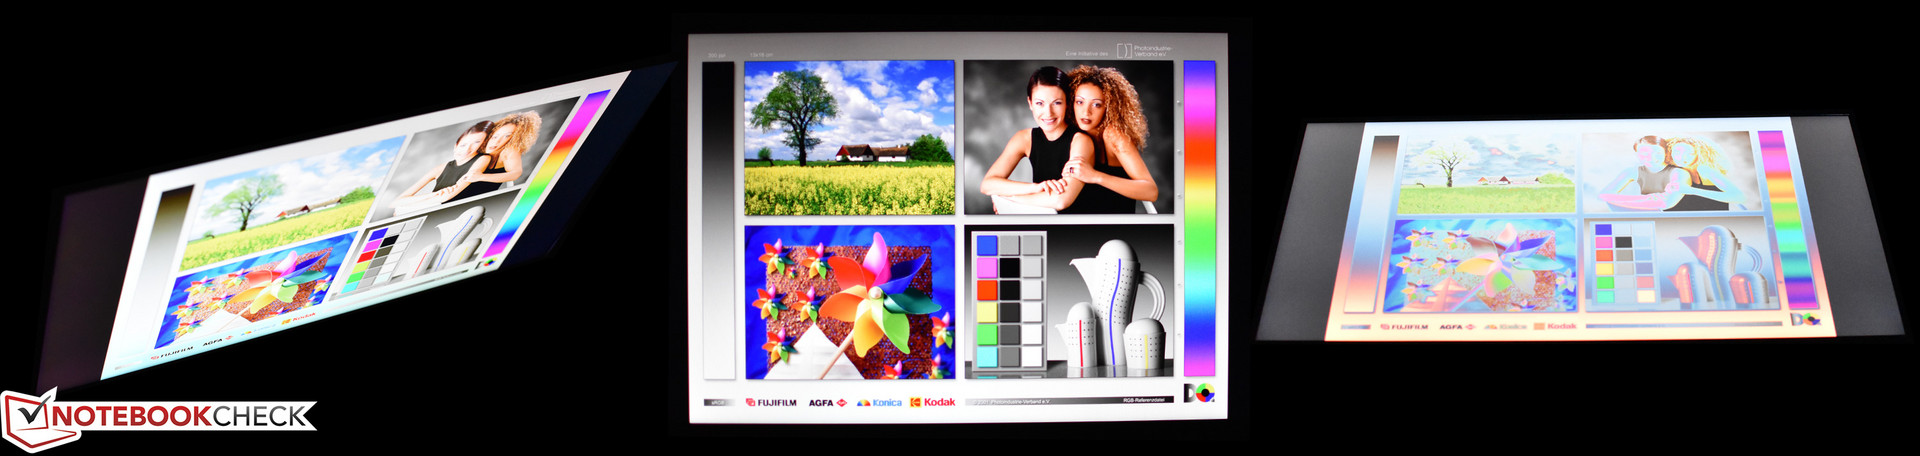
Fényerő megoszlás: 80 %
Centrumban: 307.1 cd/m²
Kontraszt: 830:1 (Fekete: 0.37 cd/m²)
ΔE ColorChecker Calman: 2.53 | ∀{0.5-29.43 Ø4.72}
calibrated: 2.82
ΔE Greyscale Calman: 1.7 | ∀{0.09-98 Ø4.97}
100% sRGB (Argyll 1.6.3 3D)
76% AdobeRGB 1998 (Argyll 1.6.3 3D)
85.7% AdobeRGB 1998 (Argyll 3D)
99.9% sRGB (Argyll 3D)
91.3% Display P3 (Argyll 3D)
Gamma: 2.194
CCT: 6893 K
| MSI GT63 Titan 8RG-046 N156HHE-GA1, TN, 15.6", 1920x1080 | Asus ROG GU501GM-BI7N8 AU Optronics AUO45ED, IPS, 15.6", 1920x1080 | Razer Blade 15 2018 LGD05C0, IPS, 15.6", 1920x1080 | Lenovo Legion Y520-15IKBA-80WY001VGE LG Philips LGD0533, IPS, 15.6", 1920x1080 | Alienware 15 R3 Max-Q LG Philips LP156WF6 (LGD049B), IPS, 15.6", 1920x1080 | Dell G5 15 5587 LGD053F, 156WF6, IPS, 15.6", 1920x1080 | Asus Chimera G703GI B173HAN03.2 (AUO329D), IPS, 17.3", 1920x1080 | Acer Predator Helios 500 PH517-51-79BY AUO_B173HAN03, IPS, 17.3", 1920x1080 | |
|---|---|---|---|---|---|---|---|---|
| Display | -22% | -20% | -50% | -25% | -52% | -19% | -20% | |
| Display P3 Coverage (%) | 91.3 | 63.4 -31% | 64.3 -30% | 39.53 -57% | 64.3 -30% | 38.13 -58% | 65.8 -28% | 64.4 -29% |
| sRGB Coverage (%) | 99.9 | 87.7 -12% | 93.7 -6% | 59.2 -41% | 82.9 -17% | 56.8 -43% | 92.6 -7% | 91.3 -9% |
| AdobeRGB 1998 Coverage (%) | 85.7 | 65.5 -24% | 40.86 -52% | 60.6 -29% | 39.47 -54% | 67 -22% | 65.6 -23% | |
| Response Times | -322% | -106% | -383% | -380% | -304% | -31% | -61% | |
| Response Time Grey 50% / Grey 80% * (ms) | 8.4 ? | 30.8 ? -267% | 17.2 ? -105% | 42 ? -400% | 40 ? -376% | 33 ? -293% | 6.4 ? 24% | 14 ? -67% |
| Response Time Black / White * (ms) | 5.8 ? | 27.6 ? -376% | 12 ? -107% | 27 ? -366% | 28 ? -383% | 24 ? -314% | 10.8 ? -86% | 9 ? -55% |
| PWM Frequency (Hz) | 25510 ? | 24900 ? | 21100 ? | |||||
| Screen | -21% | -3% | -68% | -38% | -69% | -2% | -47% | |
| Brightness middle (cd/m²) | 307.1 | 286.7 -7% | 290 -6% | 243 -21% | 306 0% | 229 -25% | 285 -7% | 335 9% |
| Brightness (cd/m²) | 276 | 281 2% | 281 2% | 231 -16% | 297 8% | 224 -19% | 275 0% | 300 9% |
| Brightness Distribution (%) | 80 | 92 15% | 82 2% | 87 9% | 89 11% | 87 9% | 82 2% | 82 2% |
| Black Level * (cd/m²) | 0.37 | 0.39 -5% | 0.3 19% | 0.24 35% | 0.28 24% | 0.28 24% | 0.22 41% | 0.7 -89% |
| Contrast (:1) | 830 | 735 -11% | 967 17% | 1013 22% | 1093 32% | 818 -1% | 1295 56% | 479 -42% |
| Colorchecker dE 2000 * | 2.53 | 4.17 -65% | 2.85 -13% | 6.36 -151% | 5.45 -115% | 6.1 -141% | 3.18 -26% | 4.99 -97% |
| Colorchecker dE 2000 max. * | 4.66 | 7.22 -55% | 6.27 -35% | 12.76 -174% | 9.45 -103% | 12.2 -162% | 5.99 -29% | 9.32 -100% |
| Colorchecker dE 2000 calibrated * | 2.82 | 1.39 51% | 6.51 -131% | 6.12 -117% | 1.73 39% | 1.93 32% | ||
| Greyscale dE 2000 * | 1.7 | 2.5 -47% | 2.4 -41% | 5.63 -231% | 4.9 -188% | 5.68 -234% | 2.93 -72% | 5.2 -206% |
| Gamma | 2.194 100% | 2.274 97% | 2.34 94% | 2.47 89% | 2.49 88% | 2.4 92% | 2.45 90% | 2.49 88% |
| CCT | 6893 94% | 6885 94% | 6718 97% | 7411 88% | 7062 92% | 6989 93% | 7165 91% | 7719 84% |
| Color Space (Percent of AdobeRGB 1998) (%) | 76 | 57 -25% | 60 -21% | 38 -50% | 54 -29% | 36 -53% | 60 -21% | 59 -22% |
| Color Space (Percent of sRGB) (%) | 100 | 87 -13% | 94 -6% | 59 -41% | 83 -17% | 57 -43% | 93 -7% | 91 -9% |
| Teljes átlag (program / beállítások) | -122% /
-64% | -43% /
-19% | -167% /
-104% | -148% /
-81% | -142% /
-95% | -17% /
-9% | -43% /
-44% |
* ... a kisebb jobb
Megjelenítési válaszidők
| ↔ Válaszidő Fekete-fehér | ||
|---|---|---|
| 5.8 ms ... emelkedés és süllyedés ↘ kombinálva | ↗ 4.4 ms emelkedés | 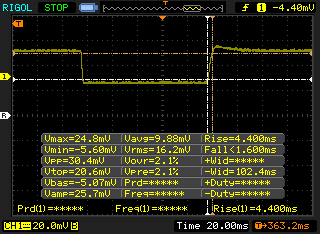 |
| ↘ 1.4 ms ősz | ||
| A képernyő tesztjeinkben nagyon gyors reakciósebességet mutatott, és nagyon jól használható gyors tempójú játékokhoz. Összehasonlításképpen, az összes tesztelt eszköz 0.1 (minimum) és 240 (maximum) ms között mozog. » 18 % of all devices are better. Ez azt jelenti, hogy a mért válaszidő jobb, mint az összes vizsgált eszköz átlaga (19.8 ms). | ||
| ↔ Válaszidő 50% szürke és 80% szürke között | ||
| 8.4 ms ... emelkedés és süllyedés ↘ kombinálva | ↗ 4.4 ms emelkedés | 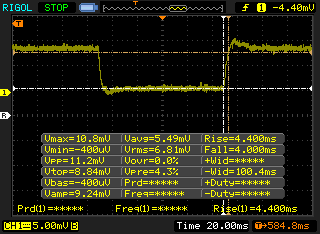 |
| ↘ 4 ms ősz | ||
| A képernyő gyors reakciósebességet mutat tesztjeinkben, és játékra is alkalmasnak kell lennie. Összehasonlításképpen, az összes tesztelt eszköz 0.165 (minimum) és 636 (maximum) ms között mozog. » 22 % of all devices are better. Ez azt jelenti, hogy a mért válaszidő jobb, mint az összes vizsgált eszköz átlaga (31 ms). | ||
Képernyő villogása / PWM (impulzusszélesség-moduláció)
| Képernyő villogása / PWM észlelve | 25510 Hz | ≤ 34 % fényerő beállítása | 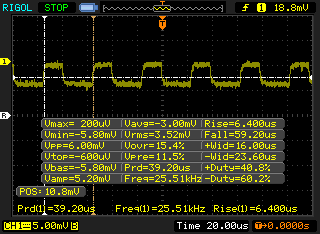 |
A kijelző háttérvilágítása 25510 Hz-en villog (a legrosszabb esetben, pl. PWM használatával) Villódzás észlelve a 34 % vagy annál kisebb fényerő-beállításnál. E fényerő-beállítás felett nem lehet villogás vagy PWM. A 25510 Hz frekvenciája meglehetősen magas, így a legtöbb PWM-re érzékeny felhasználó nem észlel semmilyen villogást. Összehasonlításképpen: az összes tesztelt eszköz 52 %-a nem használja a PWM-et a kijelző elsötétítésére. Ha PWM-et észleltek, akkor átlagosan 7772 (minimum: 5 - maximum: 343500) Hz-t mértek. | |||
| PCMark 8 Home Score Accelerated v2 | 5445 pontok | |
| PCMark 8 Work Score Accelerated v2 | 5574 pontok | |
| PCMark 10 Score | 5961 pontok | |
Segítség | ||
| MSI GT63 Titan 8RG-046 CUK Cyclone 500GB M.2 NVMe | Asus ROG GU501GM-BI7N8 Kingston RBUSNS8154P3128GJ | Razer Blade 15 2018 Samsung PM961 NVMe MZVLW512HMJP | Alienware 15 R3 Max-Q LiteOn CX2-8B256 | Asus Chimera G703GI 2x Intel 760p 512 GB + 1x Samsung SM961 512 GB (RAID) | Acer Predator Helios 500 PH517-51-79BY SK hynix SSD Canvas SC300 HFS256GD9MNE-6200A | |
|---|---|---|---|---|---|---|
| AS SSD | -96% | 18% | -12% | 67% | -28% | |
| Copy Game MB/s (MB/s) | 419.3 | 572 | 590 | |||
| Copy Program MB/s (MB/s) | 269.2 | 332 | 337 | |||
| Copy ISO MB/s (MB/s) | 773 | 1266 | 868 | |||
| Score Total (Points) | 3040 | 900 -70% | 3806 25% | 2328 -23% | 4843 59% | |
| Score Write (Points) | 902 | 345 -62% | 1450 61% | 894 -1% | 1855 106% | 812 -10% |
| Score Read (Points) | 1433 | 377 -74% | 1584 11% | 989 -31% | 1999 39% | 859 -40% |
| Access Time Write * (ms) | 0.042 | 0.058 -38% | 0.038 10% | 0.032 24% | 0.026 38% | 0.054 -29% |
| Access Time Read * (ms) | 0.05 | 0.278 -456% | 0.051 -2% | 0.063 -26% | 0.03 40% | |
| 4K-64 Write (MB/s) | 648 | 237 -63% | 1204 86% | 710 10% | 1303 101% | 647 0% |
| 4K-64 Read (MB/s) | 1144 | 270.3 -76% | 1300 14% | 741 -35% | 1453 27% | 723 -37% |
| 4K Write (MB/s) | 87.7 | 67.1 -23% | 93.6 7% | 119.3 36% | 141.3 61% | 80.7 -8% |
| 4K Read (MB/s) | 49.17 | 22.62 -54% | 46.45 -6% | 42.73 -13% | 57.4 17% | 38.57 -22% |
| Seq Write (MB/s) | 1665 | 404.7 -76% | 1521 -9% | 645 -61% | 4110 147% | 838 -50% |
| Seq Read (MB/s) | 2399 | 841 -65% | 2376 -1% | 2058 -14% | 4886 104% | 972 -59% |
* ... a kisebb jobb

| 3DMark 11 Performance | 19463 pontok | |
| 3DMark Cloud Gate Standard Score | 35776 pontok | |
| 3DMark Fire Strike Score | 17582 pontok | |
Segítség | ||
| Metro: Last Light | |
| 1024x768 Low (DX10) AF:4x (érték szerinti rendezés) | |
| MSI GT63 Titan 8RG-046 | |
| Átlagos NVIDIA GeForce GTX 1080 Mobile (n=1) | |
| 1366x768 Medium (DX10) AF:4x (érték szerinti rendezés) | |
| MSI GT63 Titan 8RG-046 | |
| Átlagos NVIDIA GeForce GTX 1080 Mobile (n=1) | |
| 1366x768 High (DX11) AF:16x (érték szerinti rendezés) | |
| MSI GT63 Titan 8RG-046 | |
| Átlagos NVIDIA GeForce GTX 1080 Mobile (n=1) | |
| 1920x1080 Very High (DX11) AF:16x (érték szerinti rendezés) | |
| MSI GT63 Titan 8RG-046 | |
| Dell Inspiron 15 7000 7577 4K | |
| Átlagos NVIDIA GeForce GTX 1080 Mobile (110.2 - 141.1, n=7) | |
| alacsony | közepes | magas | ultra | |
|---|---|---|---|---|
| BioShock Infinite (2013) | 309 | 270 | 259 | 169 |
| Metro: Last Light (2013) | 128 | 131 | 129 | 117 |
| The Witcher 3 (2015) | 72 | |||
| Rise of the Tomb Raider (2016) | 210 | 166 | 131 | 120 |
Zajszint
| Üresjárat |
| 31.4 / 31.4 / 32.2 dB(A) |
| Terhelés |
| 35.5 / 50.8 dB(A) |
 | ||
30 dB csendes 40 dB(A) hallható 50 dB(A) hangos |
||
min: | ||
| MSI GT63 Titan 8RG-046 GeForce GTX 1080 Mobile, i7-8750H, CUK Cyclone 500GB M.2 NVMe | Asus ROG GU501GM-BI7N8 GeForce GTX 1060 Mobile, i7-8750H, Kingston RBUSNS8154P3128GJ | Razer Blade 15 2018 GeForce GTX 1070 Max-Q, i7-8750H, Samsung PM961 NVMe MZVLW512HMJP | Alienware 15 R3 Max-Q GeForce GTX 1080 Max-Q, i7-7820HK, LiteOn CX2-8B256 | Dell G5 15 5587 GeForce GTX 1060 Max-Q, i5-8300H, SK hynix SC311 M.2 | Asus Chimera G703GI GeForce GTX 1080 Mobile, i9-8950HK, 2x Intel 760p 512 GB + 1x Samsung SM961 512 GB (RAID) | Acer Predator Helios 500 PH517-51-79BY GeForce GTX 1070 Mobile, i7-8750H, SK hynix SSD Canvas SC300 HFS256GD9MNE-6200A | |
|---|---|---|---|---|---|---|---|
| Noise | -5% | -5% | -7% | 2% | -14% | -4% | |
| off / környezet * (dB) | 28 | 28.6 -2% | 29 -4% | 29 -4% | 30.3 -8% | 29 -4% | 30.4 -9% |
| Idle Minimum * (dB) | 31.4 | 31.4 -0% | 29 8% | 32 -2% | 31.1 1% | 30 4% | 31.2 1% |
| Idle Average * (dB) | 31.4 | 31.4 -0% | 30 4% | 33 -5% | 31.1 1% | 34 -8% | 35.3 -12% |
| Idle Maximum * (dB) | 32.2 | 34.2 -6% | 38 -18% | 35 -9% | 34.2 -6% | 42 -30% | 35.3 -10% |
| Load Average * (dB) | 35.5 | 42.8 -21% | 46 -30% | 46 -30% | 34.9 2% | 53 -49% | 44.4 -25% |
| Witcher 3 ultra * (dB) | 47.6 | 50.9 -7% | 49 -3% | 48 -1% | 42.7 10% | 51 -7% | 41 14% |
| Load Maximum * (dB) | 50.8 | 50.9 -0% | 46 9% | 50 2% | 44 13% | 53 -4% | 45.2 11% |
* ... a kisebb jobb
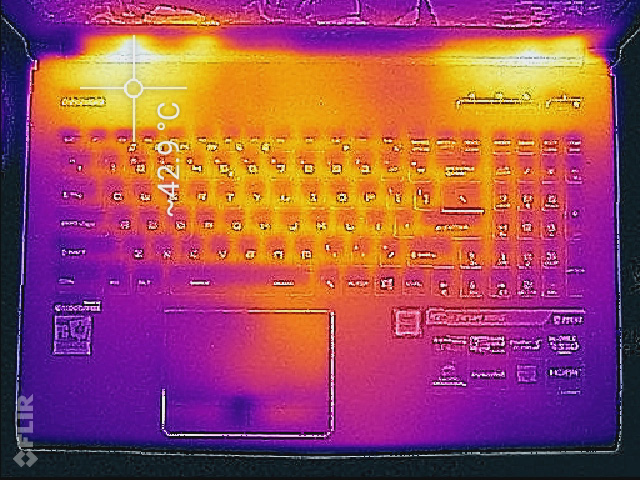
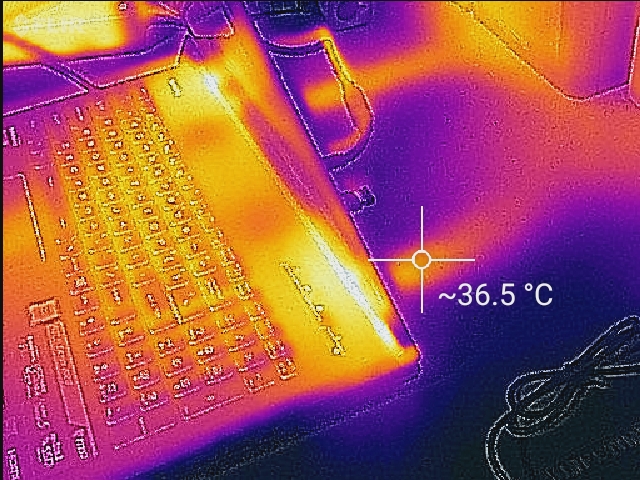
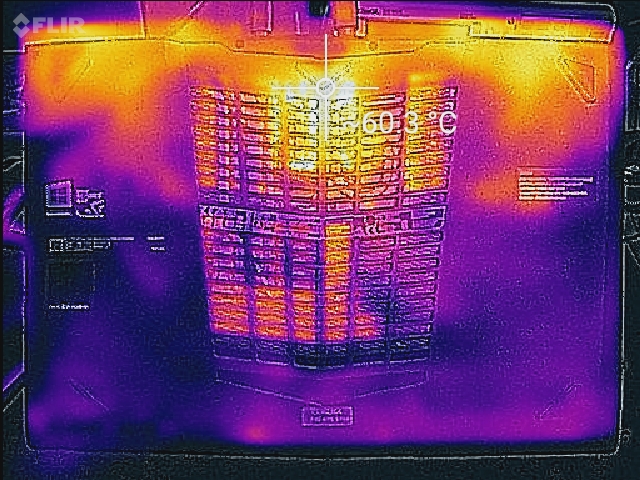
(±) A felső oldalon a maximális hőmérséklet 41.6 °C / 107 F, összehasonlítva a 40.4 °C / 105 F átlagával , 21.2 és 68.8 °C között a Gaming osztálynál.
(-) Az alsó maximum 54.8 °C / 131 F-ig melegszik fel, összehasonlítva a 43.2 °C / 110 F átlagával
(±) A csuklótámasz és az érintőpad tapintásra nagyon felforrósodhat, maximum 37 °C / 98.6 F.
(-) A hasonló eszközök csuklótámasz területének átlagos hőmérséklete 28.8 °C / 83.8 F volt (-8.2 °C / -14.8 F).
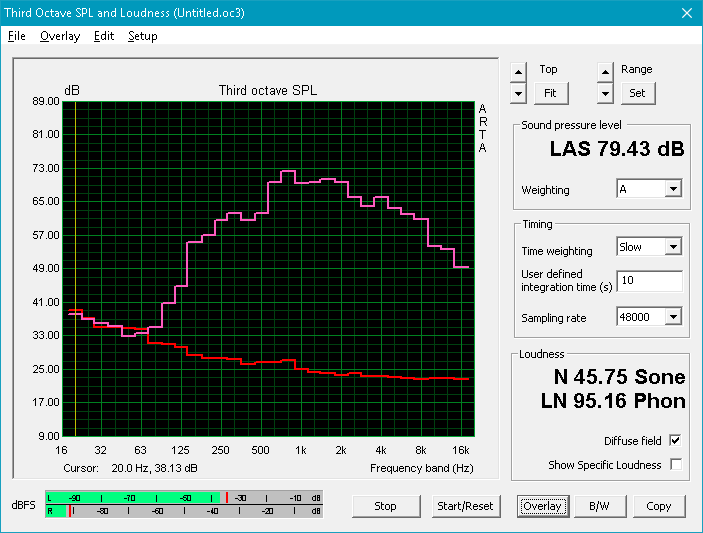
MSI GT63 Titan 8RG-046 hangelemzés
(±) | a hangszóró hangereje átlagos, de jó (79.4 dB)
Basszus 100 - 315 Hz
(±) | csökkentett basszus – átlagosan 8.7%-kal alacsonyabb, mint a medián
(±) | a basszus linearitása átlagos (12.1% delta az előző frekvenciához)
Közepes 400-2000 Hz
(±) | magasabb középértékek – átlagosan 6.2%-kal magasabb, mint a medián
(+) | a középpontok lineárisak (6% delta az előző frekvenciához)
Maximum 2-16 kHz
(+) | kiegyensúlyozott csúcsok – csak 2.9% választja el a mediántól
(±) | a csúcsok linearitása átlagos (7.3% delta az előző gyakorisághoz)
Összességében 100 - 16.000 Hz
(±) | az általános hang linearitása átlagos (18.7% eltérés a mediánhoz képest)
Ugyanazon osztályhoz képest
» 61%Ebben az osztályban az összes tesztelt eszköz %-a jobb volt, 8% hasonló, 30%-kal rosszabb
» A legjobb delta értéke 6%, az átlag 18%, a legrosszabb 132% volt
Az összes tesztelt eszközzel összehasonlítva
» 43% az összes tesztelt eszköz jobb volt, 8% hasonló, 50%-kal rosszabb
» A legjobb delta értéke 4%, az átlag 24%, a legrosszabb 134% volt
Asus Chimera G703GI hangelemzés
(+) | a hangszórók viszonylag hangosan tudnak játszani (89 dB)
Basszus 100 - 315 Hz
(±) | csökkentett basszus – átlagosan 8.9%-kal alacsonyabb, mint a medián
(+) | a basszus lineáris (6.4% delta az előző frekvenciához)
Közepes 400-2000 Hz
(+) | kiegyensúlyozott középpontok – csak 3.1% választja el a mediántól
(+) | a középpontok lineárisak (2.4% delta az előző frekvenciához)
Maximum 2-16 kHz
(+) | kiegyensúlyozott csúcsok – csak 4.4% választja el a mediántól
(+) | a csúcsok lineárisak (3.2% delta az előző frekvenciához képest)
Összességében 100 - 16.000 Hz
(+) | általános hangzás lineáris (11.8% eltérés a mediánhoz képest)
Ugyanazon osztályhoz képest
» 11%Ebben az osztályban az összes tesztelt eszköz %-a jobb volt, 4% hasonló, 85%-kal rosszabb
» A legjobb delta értéke 6%, az átlag 18%, a legrosszabb 132% volt
Az összes tesztelt eszközzel összehasonlítva
» 8% az összes tesztelt eszköz jobb volt, 3% hasonló, 89%-kal rosszabb
» A legjobb delta értéke 4%, az átlag 24%, a legrosszabb 134% volt
| Kikapcsolt állapot / Készenlét | |
| Üresjárat | |
| Terhelés |
|
Kulcs:
min: | |
| MSI GT63 Titan 8RG-046 i7-8750H, GeForce GTX 1080 Mobile, CUK Cyclone 500GB M.2 NVMe, TN, 1920x1080, 15.6" | Asus ROG GU501GM-BI7N8 i7-8750H, GeForce GTX 1060 Mobile, Kingston RBUSNS8154P3128GJ, IPS, 1920x1080, 15.6" | Razer Blade 15 2018 i7-8750H, GeForce GTX 1070 Max-Q, Samsung PM961 NVMe MZVLW512HMJP, IPS, 1920x1080, 15.6" | Alienware 15 R3 Max-Q i7-7820HK, GeForce GTX 1080 Max-Q, LiteOn CX2-8B256, IPS, 1920x1080, 15.6" | Dell G5 15 5587 i5-8300H, GeForce GTX 1060 Max-Q, SK hynix SC311 M.2, IPS, 1920x1080, 15.6" | Asus Chimera G703GI i9-8950HK, GeForce GTX 1080 Mobile, 2x Intel 760p 512 GB + 1x Samsung SM961 512 GB (RAID), IPS, 1920x1080, 17.3" | Acer Predator Helios 500 PH517-51-79BY i7-8750H, GeForce GTX 1070 Mobile, SK hynix SSD Canvas SC300 HFS256GD9MNE-6200A, IPS, 1920x1080, 17.3" | |
|---|---|---|---|---|---|---|---|
| Power Consumption | 31% | 30% | 12% | 53% | -33% | 0% | |
| Idle Minimum * (Watt) | 26.4 | 12.35 53% | 14 47% | 22 17% | 4.9 81% | 29 -10% | 20.4 23% |
| Idle Average * (Watt) | 30 | 19.98 33% | 17 43% | 26 13% | 8.5 72% | 37 -23% | 26.5 12% |
| Idle Maximum * (Watt) | 30.6 | 25.44 17% | 21 31% | 33 -8% | 9.1 70% | 46 -50% | 37 -21% |
| Load Average * (Watt) | 90.4 | 94.28 -4% | 95 -5% | 86 5% | 90.7 -0% | 156 -73% | 129 -43% |
| Witcher 3 ultra * (Watt) | 255.6 | 132.9 48% | 141 45% | 159 38% | 110 57% | 252 1% | 186 27% |
| Load Maximum * (Watt) | 224.4 | 140.63 37% | 179 20% | 215 4% | 144 36% | 314 -40% | 216 4% |
* ... a kisebb jobb
| MSI GT63 Titan 8RG-046 i7-8750H, GeForce GTX 1080 Mobile, 75.24 Wh | Asus ROG GU501GM-BI7N8 i7-8750H, GeForce GTX 1060 Mobile, 55 Wh | Razer Blade 15 2018 i7-8750H, GeForce GTX 1070 Max-Q, 80 Wh | Alienware 15 R3 Max-Q i7-7820HK, GeForce GTX 1080 Max-Q, 99 Wh | Dell G5 15 5587 i5-8300H, GeForce GTX 1060 Max-Q, 56 Wh | Asus Chimera G703GI i9-8950HK, GeForce GTX 1080 Mobile, 71 Wh | Acer Predator Helios 500 PH517-51-79BY i7-8750H, GeForce GTX 1070 Mobile, 72 Wh | |
|---|---|---|---|---|---|---|---|
| Akkumulátor üzemidő | 25% | 69% | 69% | 103% | -31% | -9% | |
| WiFi v1.3 (h) | 3.2 | 4 25% | 5.4 69% | 5.4 69% | 6.5 103% | 2.2 -31% | 2.9 -9% |
| Reader / Idle (h) | 4.5 | 6.4 | 7.1 | 11.8 | 2.8 | 4.2 | |
| Load (h) | 0.8 | 1.2 | 1.9 | 2.2 | 0.9 | 1.5 | |
| Witcher 3 ultra (h) | 1.1 |
Pro
Kontra


Nyers játékteljesítmény terén az MSI GT63 Titan 8RG tudja, amit kell. Ugyan a design nem változott, de a gép sebessége csak jobb lett azóta, hogy pár éve teszteltük a GT62VR-t. A hőmenedzsmentje is jelentősen jobb az elődjéénél, a grafikus teljesítménye pedig abszolút kitűnő. Igen, nagy, igen, nehéz, némileg zajos is - ugyanakkor ez egy klasszikus asztali gép helyettesítő.
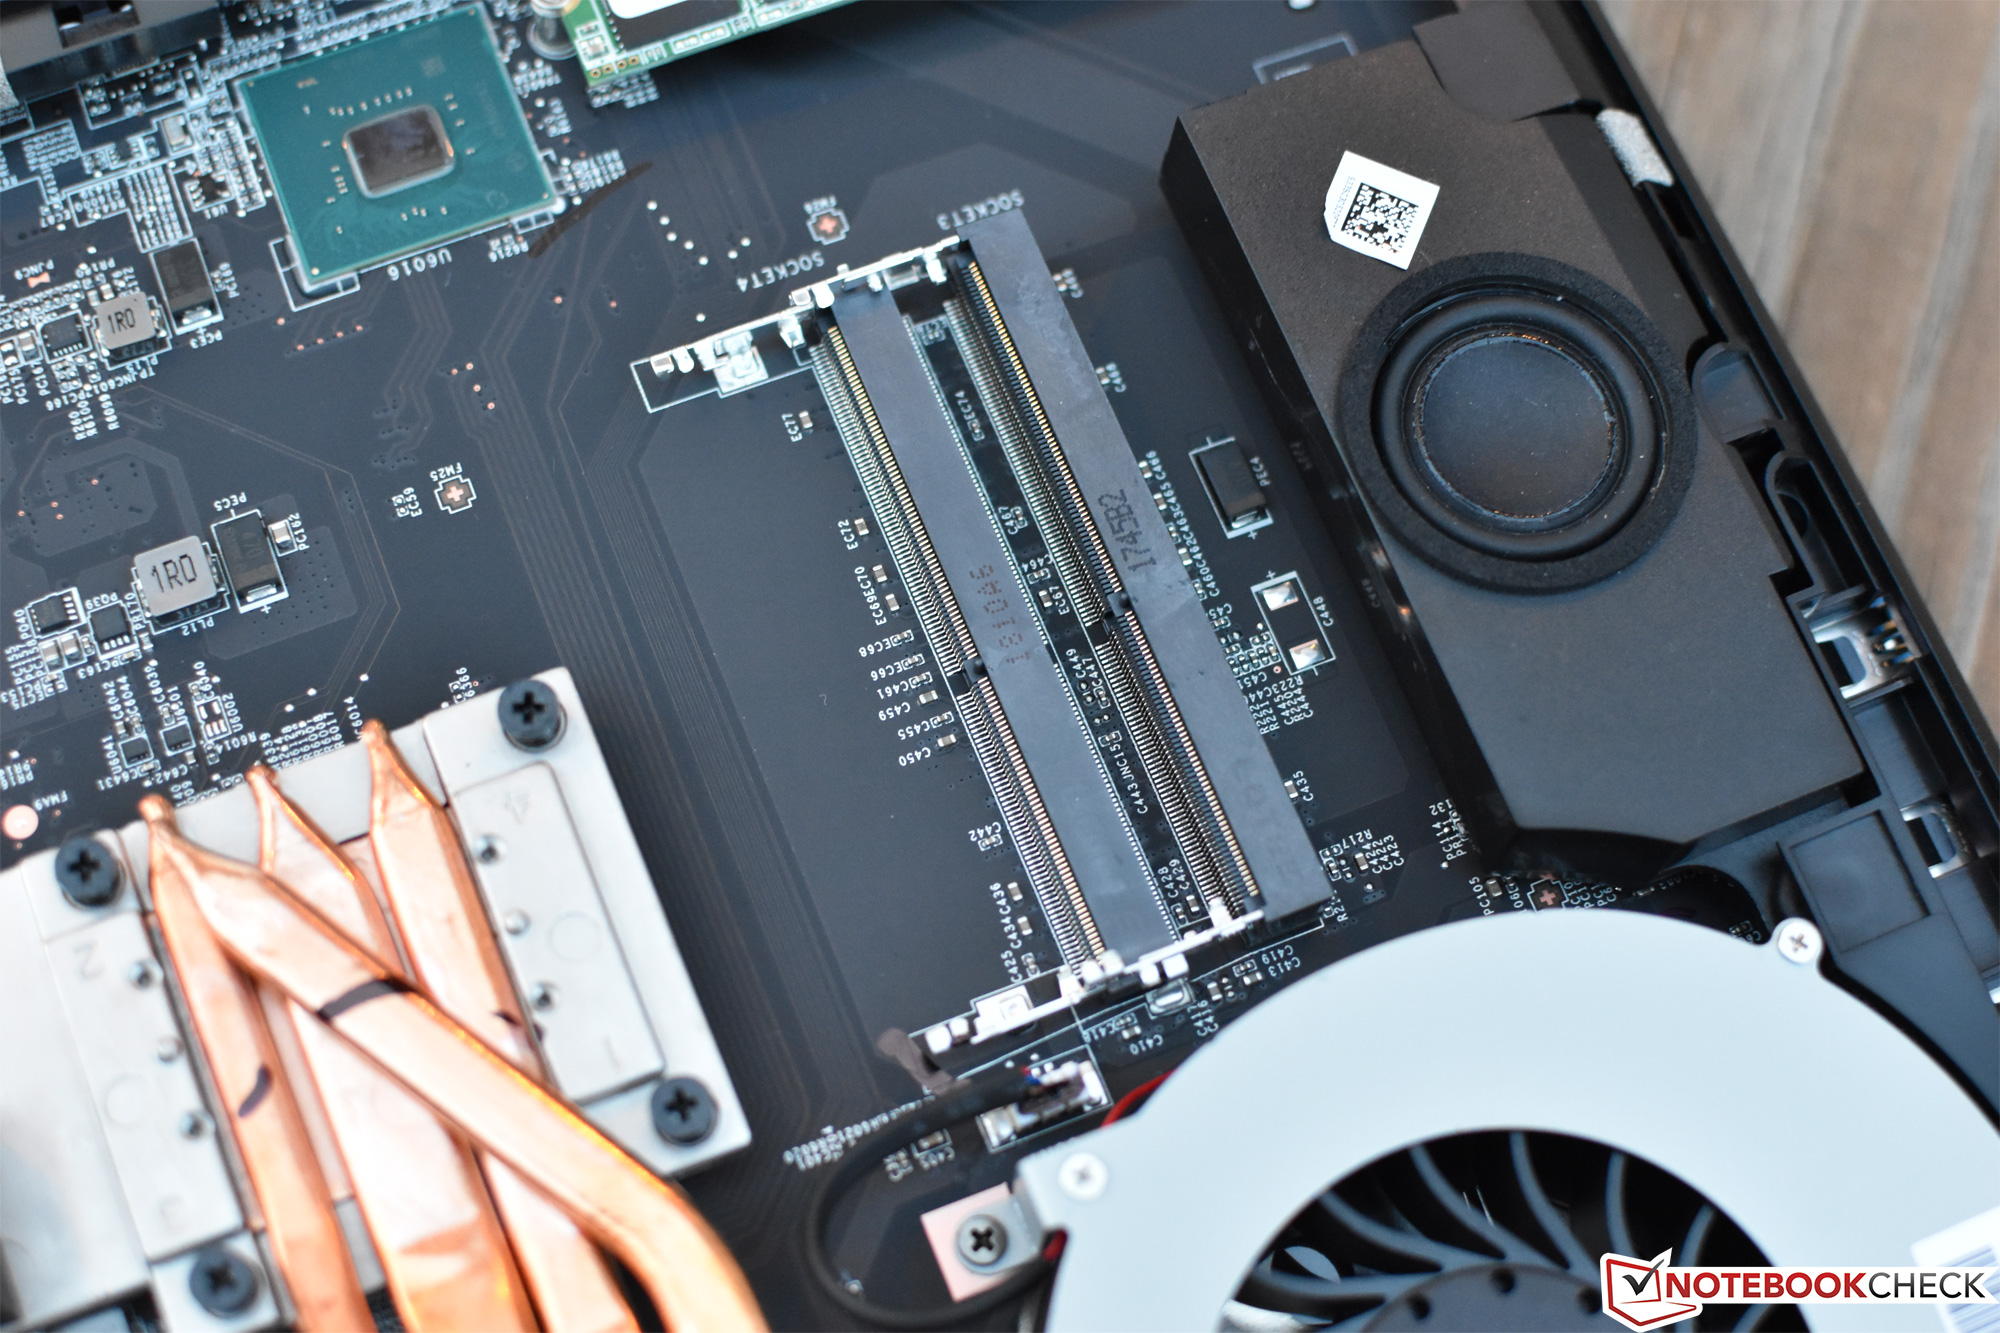
A fentieken kívül csak pár jelentősebb panaszunk van. Ideális esetben nem csak egy M.2 slotnak kellene helyet kapni egy ekkora gépnek, ebben a kategóriában, hogy lehetőség nyíljon RAID-es opciókra, vagy éppen csak három külön háttértár beépítésére is. A touchpad gombjai hangosak és irritálók (főleg a bal gomb a tesztpéldány esetében). Ami pedig csak apróbb kényelmetlenség, az a főbb csatlakozók egy részének a gép hátuljára pakolása, mivel ez időnként kisebb akrobatikai mutatványokat követel meg a felhasználótól.
Igen, nagy, igen, nehéz, némileg zajos is - ugyanakkor az MSI GT63 Titan 8RG egy klasszikus asztali gép helyettesítő.
Megéri ezért a 2639 dolláros készülékért rohanni a számos rivális helyett? Összehasonlításképpen - bár még nem nyílt alkalmunk az Alienware 15 R4 alapos tesztelésére - az R3 nem egy, hanem három M.2 SSD slotot kapott (ebből kettő teljes méretű 2280-as), és bár a felületi hőmérséklete általában magasabb, összességében egy remekül kiegyensúlyozott gép. Az Asus ROG Chimera és az Acer Predator Helios 500 szintén két M.2 helyet, és remek teljesítményt kínál, de annyira nem érik meg, mint a GT63. Akik szívesen áldoznak némi teljesítményt a hordozhatóságért, azoknak ott a trendi karcsú gamerek közül az MSI GS65, az ASUS ROG GU501GM, vagy a Razer Blade 15, mindegyik saját előnyökkel és hátrányokkal. Végül pedig azok számára, akiknek kisebb költségvetésből kell gazdálkodniuk, a Dell Inspiron 15 7000 (és az újabb Dell G5 15), és a Lenovo Y500 széria lehet a megfelelő kezdőpont.
Ez az eredeti értékelés rövidített változata. A teljes, angol nyelvű cikk itt olvasható.
MSI GT63 Titan 8RG-046
- 07/02/2018 v6 (old)
Steve Schardein
Price comparison
