Dell G5 15 5587 (i5-8300H, GTX 1060 Max-Q, SSD, IPS) Laptop rövid értékelés

| SD Card Reader | |
| average JPG Copy Test (av. of 3 runs) | |
| Az osztály átlaga Gaming (20.9 - 210, n=54, az elmúlt 2 évben) | |
| PC Zentrum Proteus V (Toshiba Exceria Pro SDXC 64 GB UHS-II) | |
| Asus FX503VM-EH73 (Toshiba Exceria Pro SDXC 64 GB UHS-II) | |
| Acer Predator Helios 300 PH317-52-51M6 (Toshiba Exceria Pro SDXC 64 GB UHS-II) | |
| Dell Inspiron 15 7000 7577 (Toshiba Exceria Pro SDXC 64 GB UHS-II) | |
| Acer Nitro 5 Spin NP515-51-86CX (Toshiba Exceria Pro SDXC 64 GB UHS-II) | |
| Dell G5 15 5587 (Toshiba Exceria Pro SDXC 64 GB UHS-II) | |
| Dell Inspiron 15 7000 7577 (Toshiba Exceria Pro SDXC 64 GB UHS-II) | |
| maximum AS SSD Seq Read Test (1GB) | |
| Az osztály átlaga Gaming (25.5 - 261, n=51, az elmúlt 2 évben) | |
| PC Zentrum Proteus V (Toshiba Exceria Pro SDXC 64 GB UHS-II) | |
| Asus FX503VM-EH73 (Toshiba Exceria Pro SDXC 64 GB UHS-II) | |
| Acer Predator Helios 300 PH317-52-51M6 (Toshiba Exceria Pro SDXC 64 GB UHS-II) | |
| Dell G5 15 5587 (Toshiba Exceria Pro SDXC 64 GB UHS-II) | |
| Dell Inspiron 15 7000 7577 (Toshiba Exceria Pro SDXC 64 GB UHS-II) | |
| Dell Inspiron 15 7000 7577 (Toshiba Exceria Pro SDXC 64 GB UHS-II) | |
| Acer Nitro 5 Spin NP515-51-86CX (Toshiba Exceria Pro SDXC 64 GB UHS-II) | |
| |||||||||||||||||||||||||
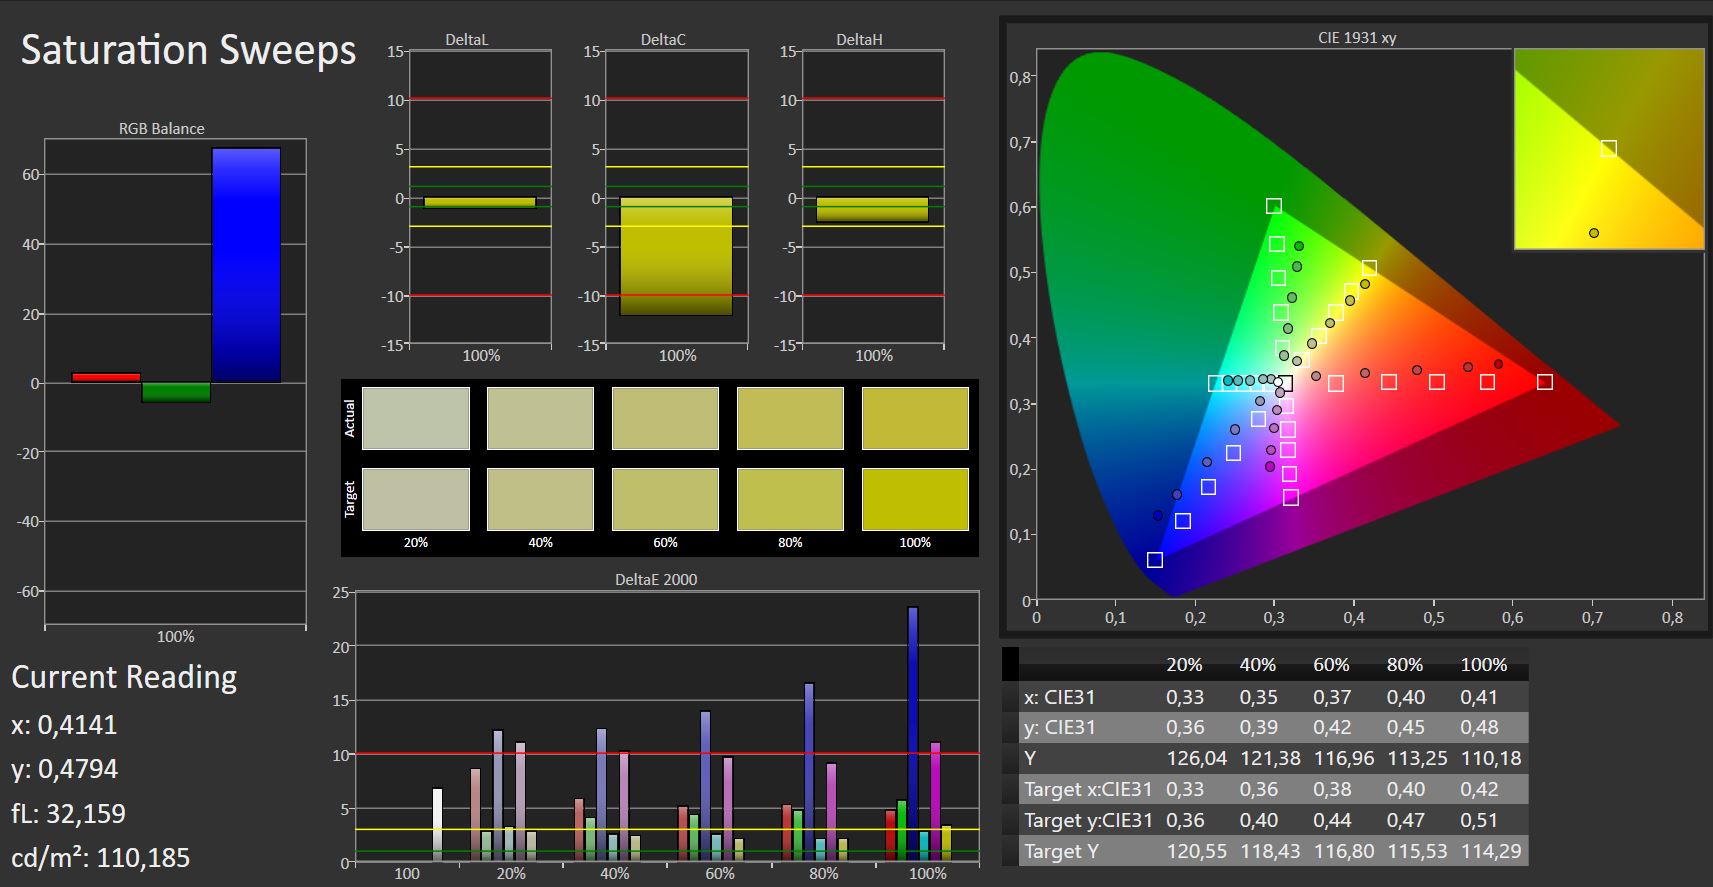
Fényerő megoszlás: 87 %
Centrumban: 229 cd/m²
Kontraszt: 818:1 (Fekete: 0.28 cd/m²)
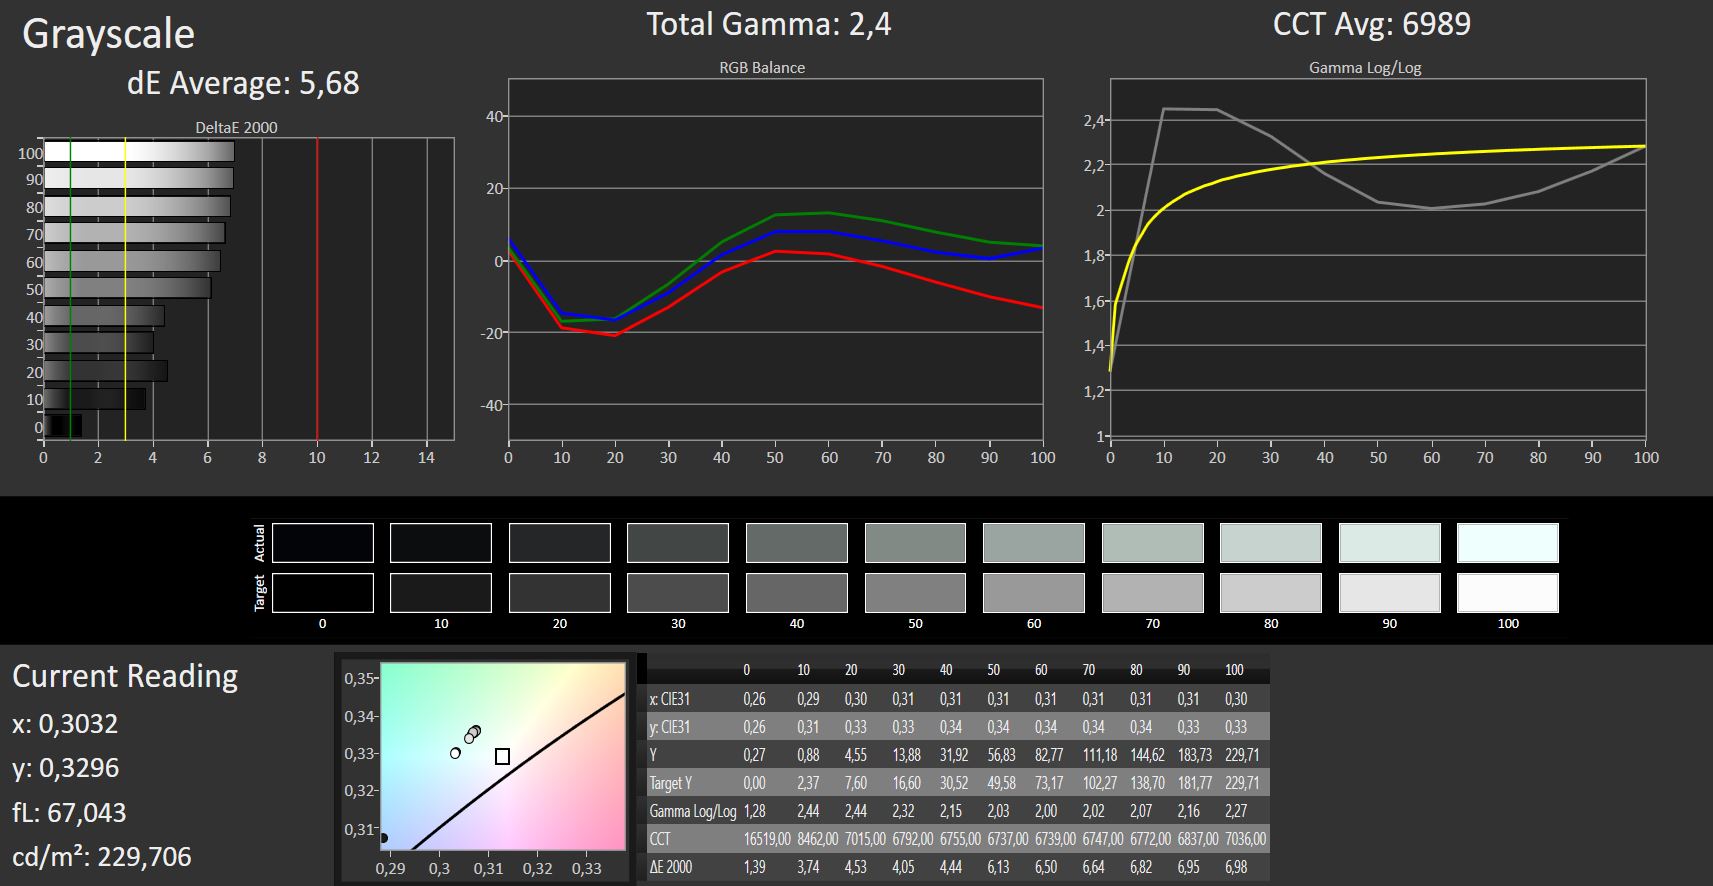
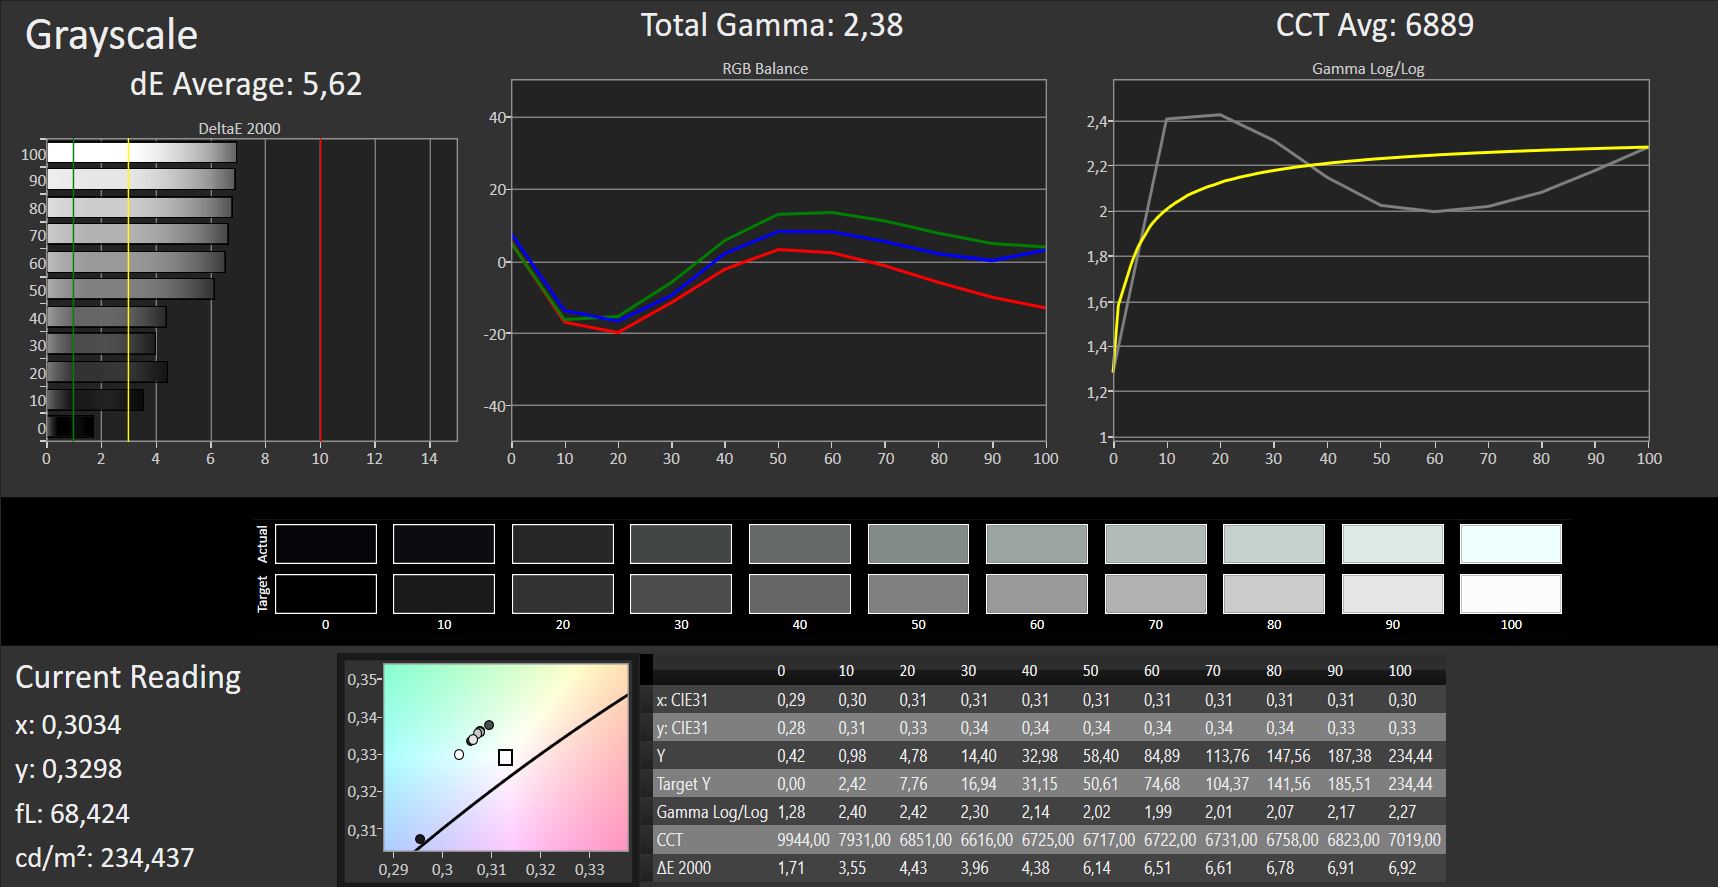
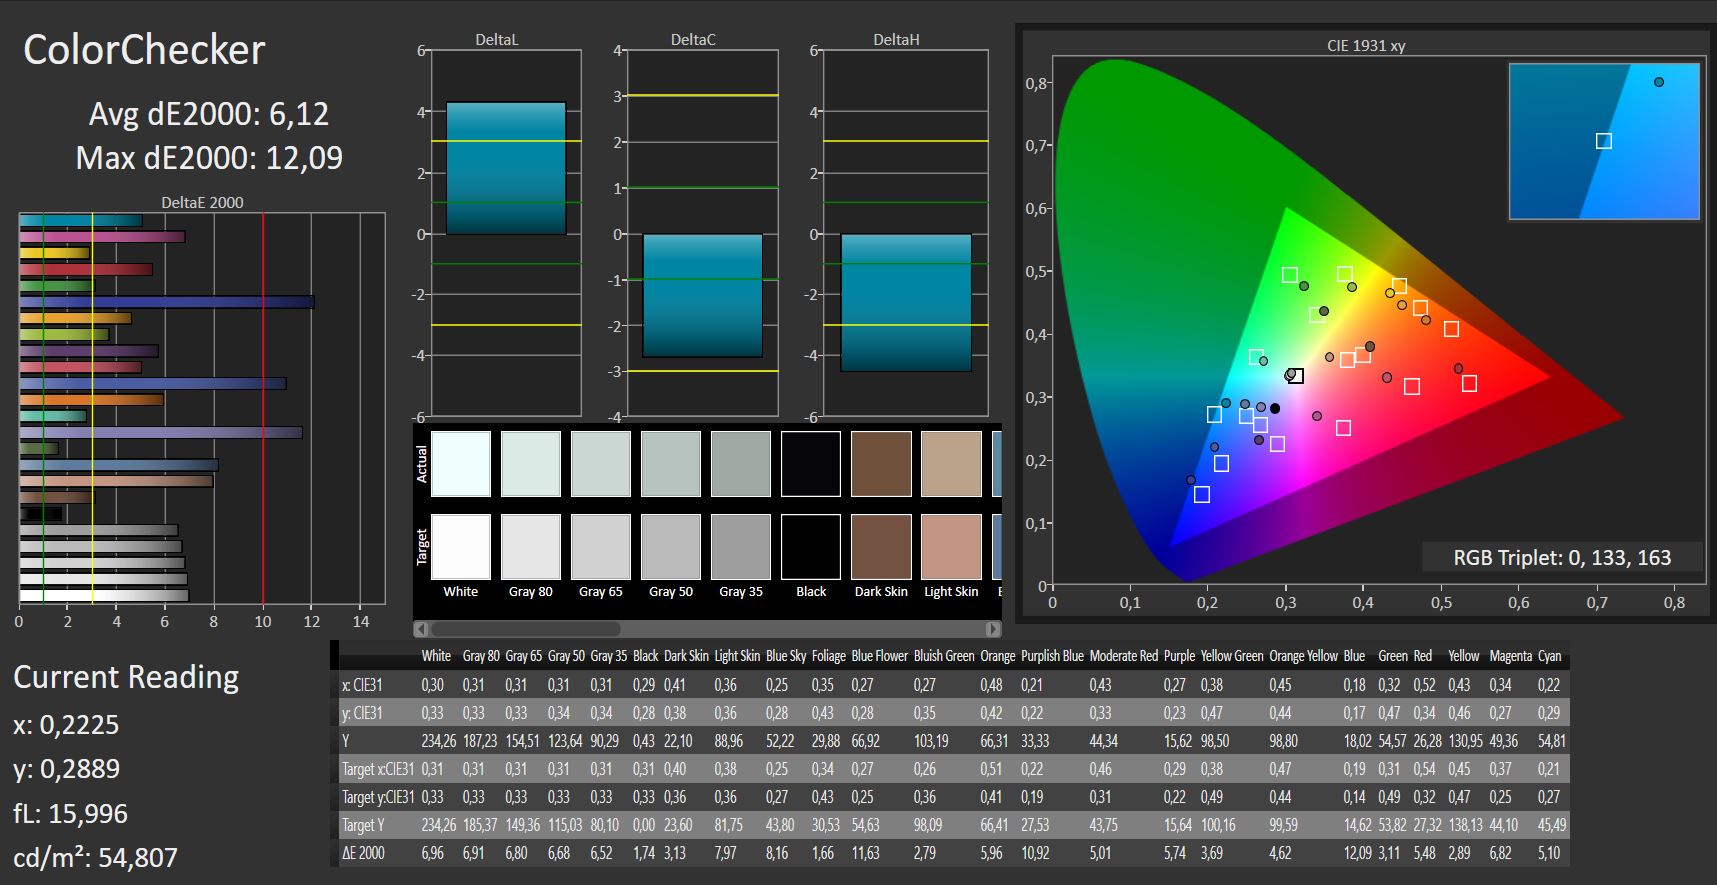
ΔE ColorChecker Calman: 6.1 | ∀{0.5-29.43 Ø4.73}
calibrated: 6.12
ΔE Greyscale Calman: 5.68 | ∀{0.09-98 Ø4.97}
57% sRGB (Argyll 1.6.3 3D)
36% AdobeRGB 1998 (Argyll 1.6.3 3D)
39.47% AdobeRGB 1998 (Argyll 3D)
56.8% sRGB (Argyll 3D)
38.13% Display P3 (Argyll 3D)
Gamma: 2.4
CCT: 6989 K
| Dell G5 15 5587 LGD053F, 156WF6, 1920x1080, 15.6" | Dell Inspiron 15 7000 7577 ID: LG Philips LGD053F, Name: 156WF6, Dell P/N: 4XK13, 1920x1080, 15.6" | Dell Inspiron 15 7000 7577 ID: LG Philips LGD053F, Name: 156WF6, Dell P/N: 4XK13, 1920x1080, 15.6" | PC Zentrum Proteus V BOEhydis NV156FHM-N42 (BOE06C6), 1920x1080, 15.6" | Asus FX503VM-EH73 AU Optronics B156HAN06.1, 1920x1080, 15.6" | Acer Nitro 5 Spin NP515-51-86CX Chi Mei CMN15D7, 1920x1080, 15.6" | Acer Predator Helios 300 PH317-52-51M6 LG Philips LP173WF4-SPF5 (LGD056D), 1920x1080, 17.3" | |
|---|---|---|---|---|---|---|---|
| Display | 6% | -3% | 2% | -2% | 67% | 63% | |
| Display P3 Coverage (%) | 38.13 | 40.4 6% | 37.07 -3% | 39.13 3% | 37.48 -2% | 64.9 70% | 67.1 76% |
| sRGB Coverage (%) | 56.8 | 60.5 7% | 55.6 -2% | 58 2% | 56.3 -1% | 92.6 63% | 86.1 52% |
| AdobeRGB 1998 Coverage (%) | 39.47 | 41.77 6% | 38.32 -3% | 40.42 2% | 38.72 -2% | 66.3 68% | 63 60% |
| Response Times | -21% | -12% | -63% | -22% | -9% | -1% | |
| Response Time Grey 50% / Grey 80% * (ms) | 33 ? | 41 ? -24% | 35.6 ? -8% | 52.8 ? -60% | 36.8 ? -12% | 36 ? -9% | 36 ? -9% |
| Response Time Black / White * (ms) | 24 ? | 28 ? -17% | 27.6 ? -15% | 39.6 ? -65% | 31.6 ? -32% | 26 ? -8% | 22 ? 8% |
| PWM Frequency (Hz) | 21930 ? | 122000 ? | |||||
| Screen | 19% | -2% | 21% | 1% | 25% | 23% | |
| Brightness middle (cd/m²) | 229 | 257 12% | 235.4 3% | 242 6% | 235.9 3% | 345 51% | 365 59% |
| Brightness (cd/m²) | 224 | 229 2% | 223 0% | 235 5% | 235 5% | 332 48% | 341 52% |
| Brightness Distribution (%) | 87 | 84 -3% | 91 5% | 85 -2% | 91 5% | 92 6% | 89 2% |
| Black Level * (cd/m²) | 0.28 | 0.17 39% | 0.28 -0% | 0.21 25% | 0.27 4% | 0.28 -0% | 0.32 -14% |
| Contrast (:1) | 818 | 1512 85% | 841 3% | 1152 41% | 874 7% | 1232 51% | 1141 39% |
| Colorchecker dE 2000 * | 6.1 | 5.34 12% | 5.6 8% | 4.27 30% | 4.81 21% | 5.85 4% | 6.51 -7% |
| Colorchecker dE 2000 max. * | 12.2 | 9.99 18% | 20.3 -66% | 7.09 42% | 21.55 -77% | 11.87 3% | 12.32 -1% |
| Colorchecker dE 2000 calibrated * | 6.12 | 2.9 53% | |||||
| Greyscale dE 2000 * | 5.68 | 4.82 15% | 3.6 37% | 2.17 62% | 3.1 45% | 8.11 -43% | 7.65 -35% |
| Gamma | 2.4 92% | 2.46 89% | 2.23 99% | 2.38 92% | 2.31 95% | 2.48 89% | 2.64 83% |
| CCT | 6989 93% | 6587 99% | 7214 90% | 6912 94% | 6984 93% | 6741 96% | 8066 81% |
| Color Space (Percent of AdobeRGB 1998) (%) | 36 | 38 6% | 35.2 -2% | 37 3% | 36 0% | 60 67% | 56 56% |
| Color Space (Percent of sRGB) (%) | 57 | 60 5% | 55.4 -3% | 58 2% | 56 -2% | 93 63% | 86 51% |
| Teljes átlag (program / beállítások) | 1% /
11% | -6% /
-3% | -13% /
6% | -8% /
-3% | 28% /
29% | 28% /
28% |
* ... a kisebb jobb


Megjelenítési válaszidők
| ↔ Válaszidő Fekete-fehér | ||
|---|---|---|
| 24 ms ... emelkedés és süllyedés ↘ kombinálva | ↗ 14 ms emelkedés | 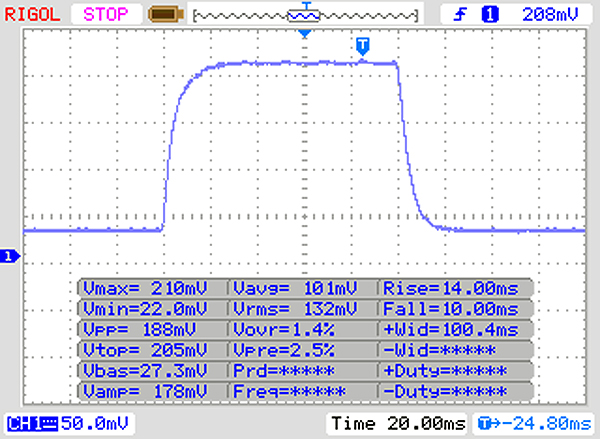 |
| ↘ 10 ms ősz | ||
| A képernyő jó reakciósebességet mutat tesztjeinkben, de túl lassú lehet a versenyképes játékosok számára. Összehasonlításképpen, az összes tesztelt eszköz 0.1 (minimum) és 240 (maximum) ms között mozog. » 54 % of all devices are better. Ez azt jelenti, hogy a mért válaszidő rosszabb, mint az összes vizsgált eszköz átlaga (19.9 ms). | ||
| ↔ Válaszidő 50% szürke és 80% szürke között | ||
| 33 ms ... emelkedés és süllyedés ↘ kombinálva | ↗ 16 ms emelkedés | 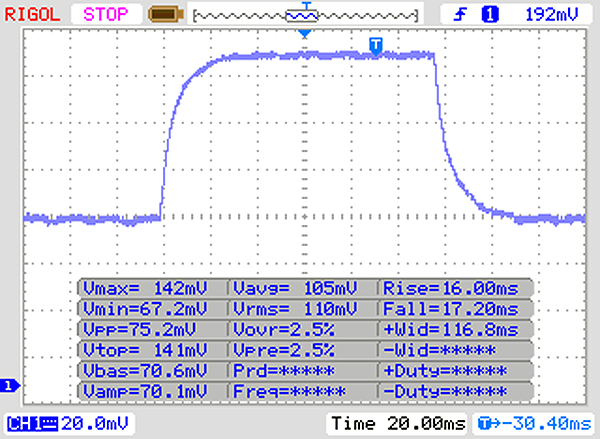 |
| ↘ 17 ms ősz | ||
| A képernyő lassú reakciósebességet mutat tesztjeinkben, és nem lesz kielégítő a játékosok számára. Összehasonlításképpen, az összes tesztelt eszköz 0.165 (minimum) és 636 (maximum) ms között mozog. » 45 % of all devices are better. Ez azt jelenti, hogy a mért válaszidő hasonló az összes vizsgált eszköz átlagához (31.1 ms). | ||
Képernyő villogása / PWM (impulzusszélesség-moduláció)
| Képernyő villogása / PWM nem érzékelhető | 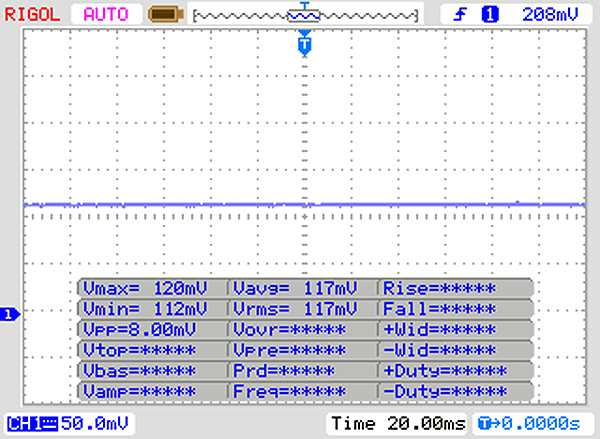 | ||
Összehasonlításképpen: az összes tesztelt eszköz 52 %-a nem használja a PWM-et a kijelző elsötétítésére. Ha PWM-et észleltek, akkor átlagosan 7794 (minimum: 5 - maximum: 343500) Hz-t mértek. | |||
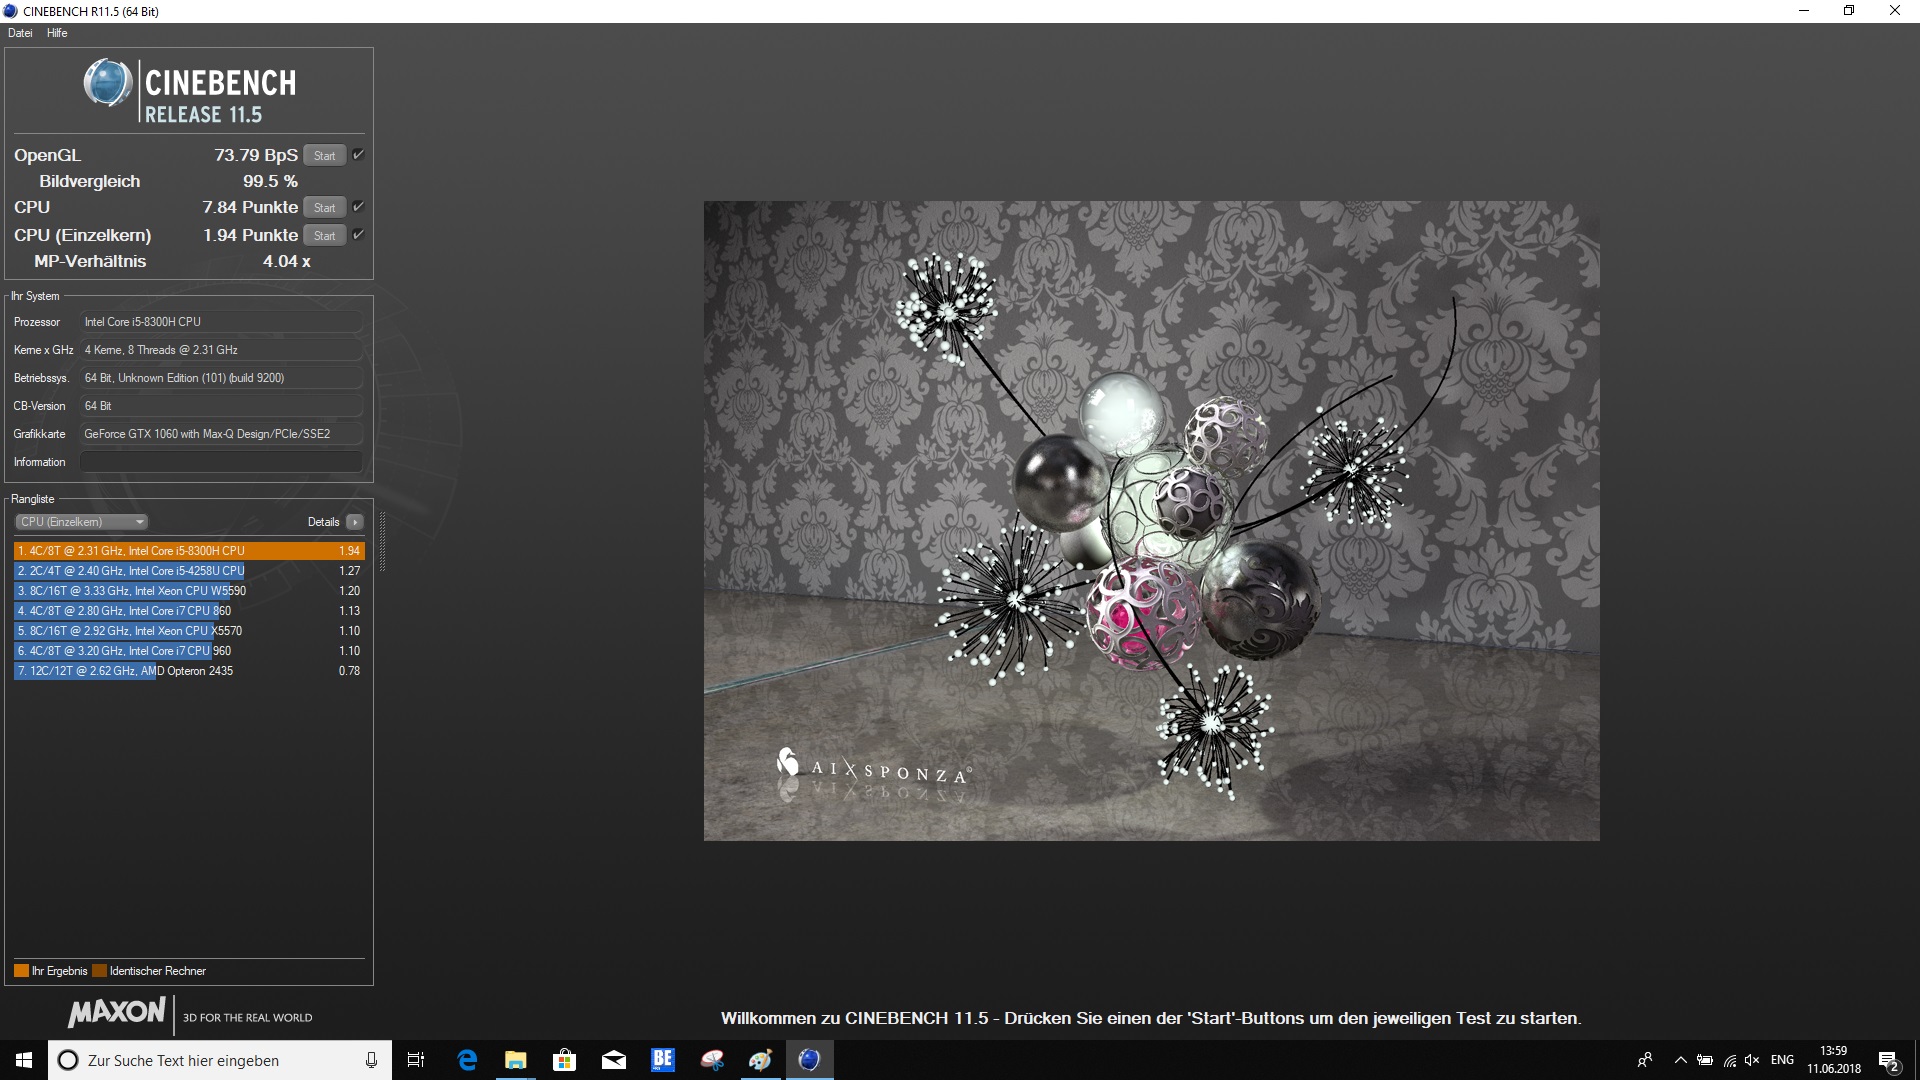
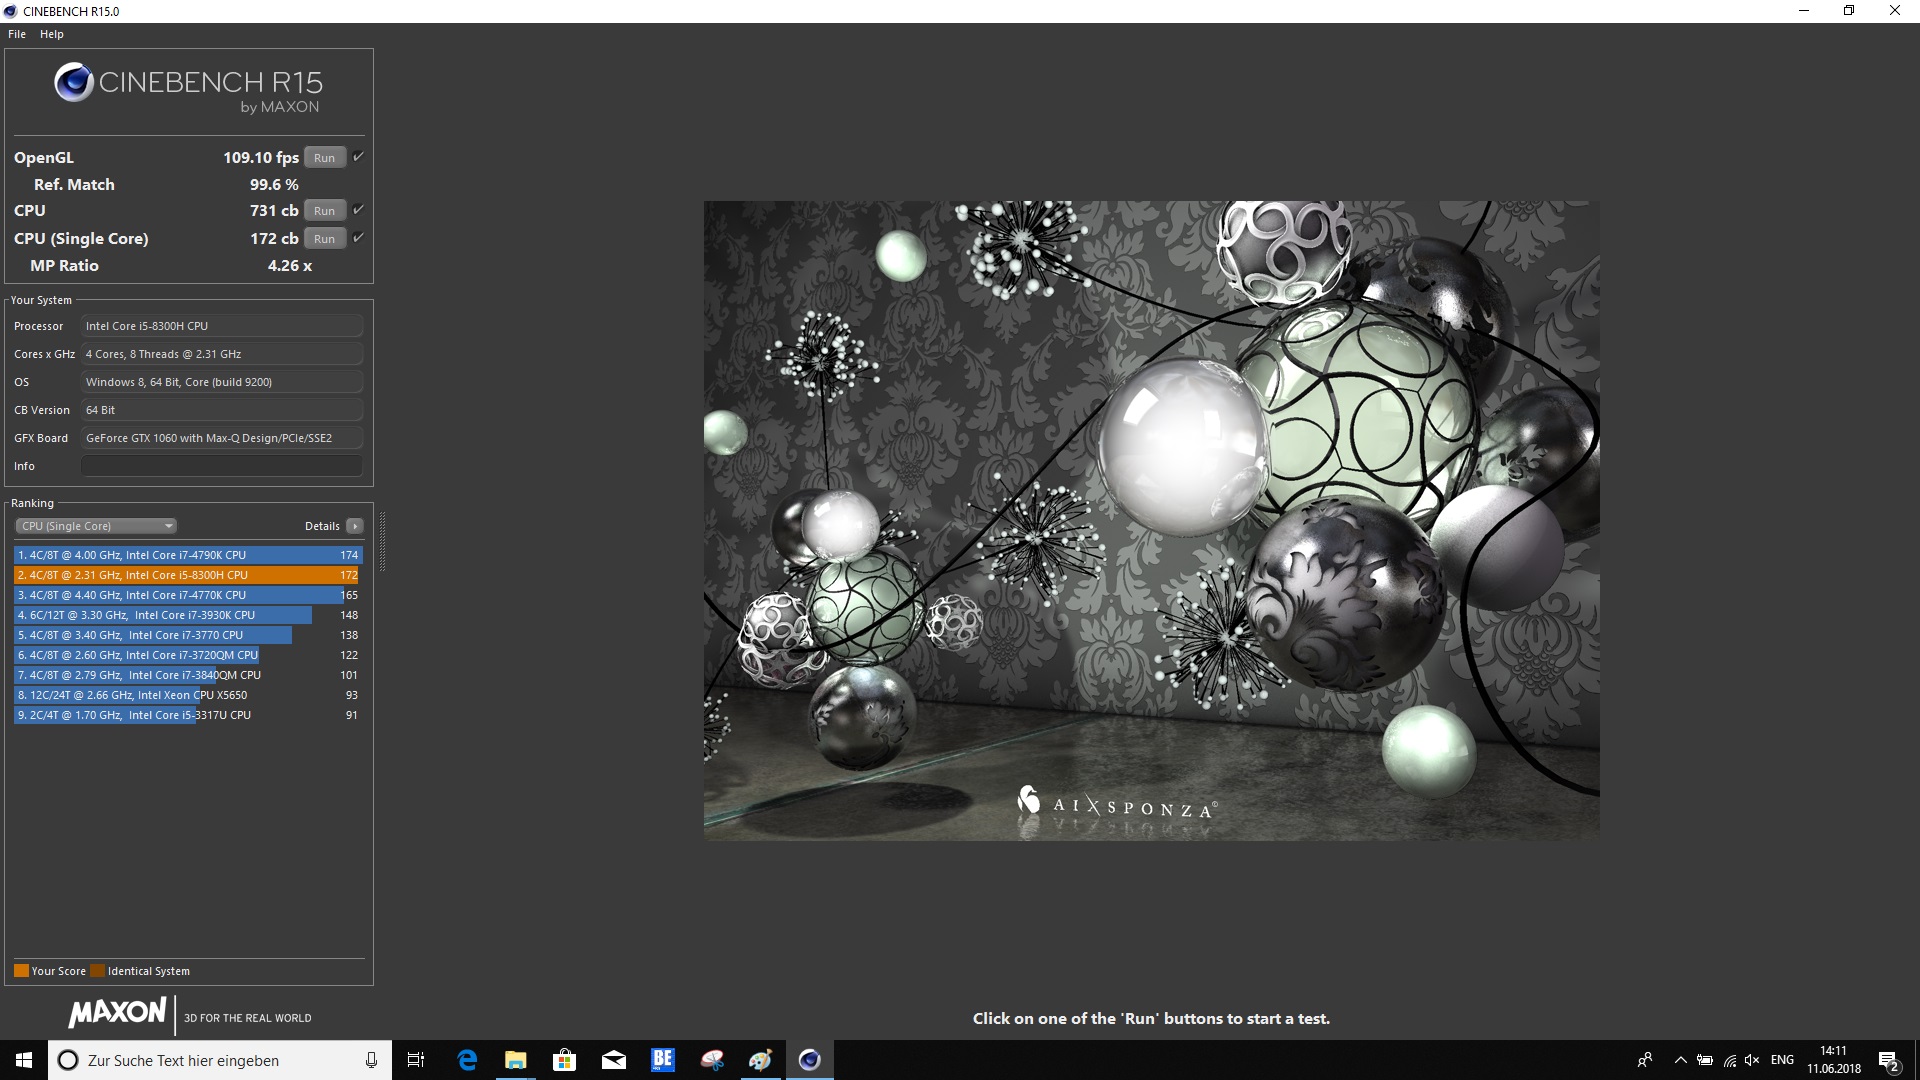
| Cinebench R10 | |
| Rendering Single CPUs 64Bit | |
| Az osztály átlaga Gaming (17067 - 17085, n=2, az elmúlt 2 évben) | |
| Dell G5 15 5587 | |
| Átlagos Intel Core i5-8300H (8277 - 8506, n=2) | |
| Dell Inspiron 15 7000 7577 | |
| Rendering Multiple CPUs 64Bit | |
| Az osztály átlaga Gaming (14159 - 144628, n=2, az elmúlt 2 évben) | |
| Átlagos Intel Core i5-8300H (28616 - 32021, n=2) | |
| Dell G5 15 5587 | |
| Dell Inspiron 15 7000 7577 | |
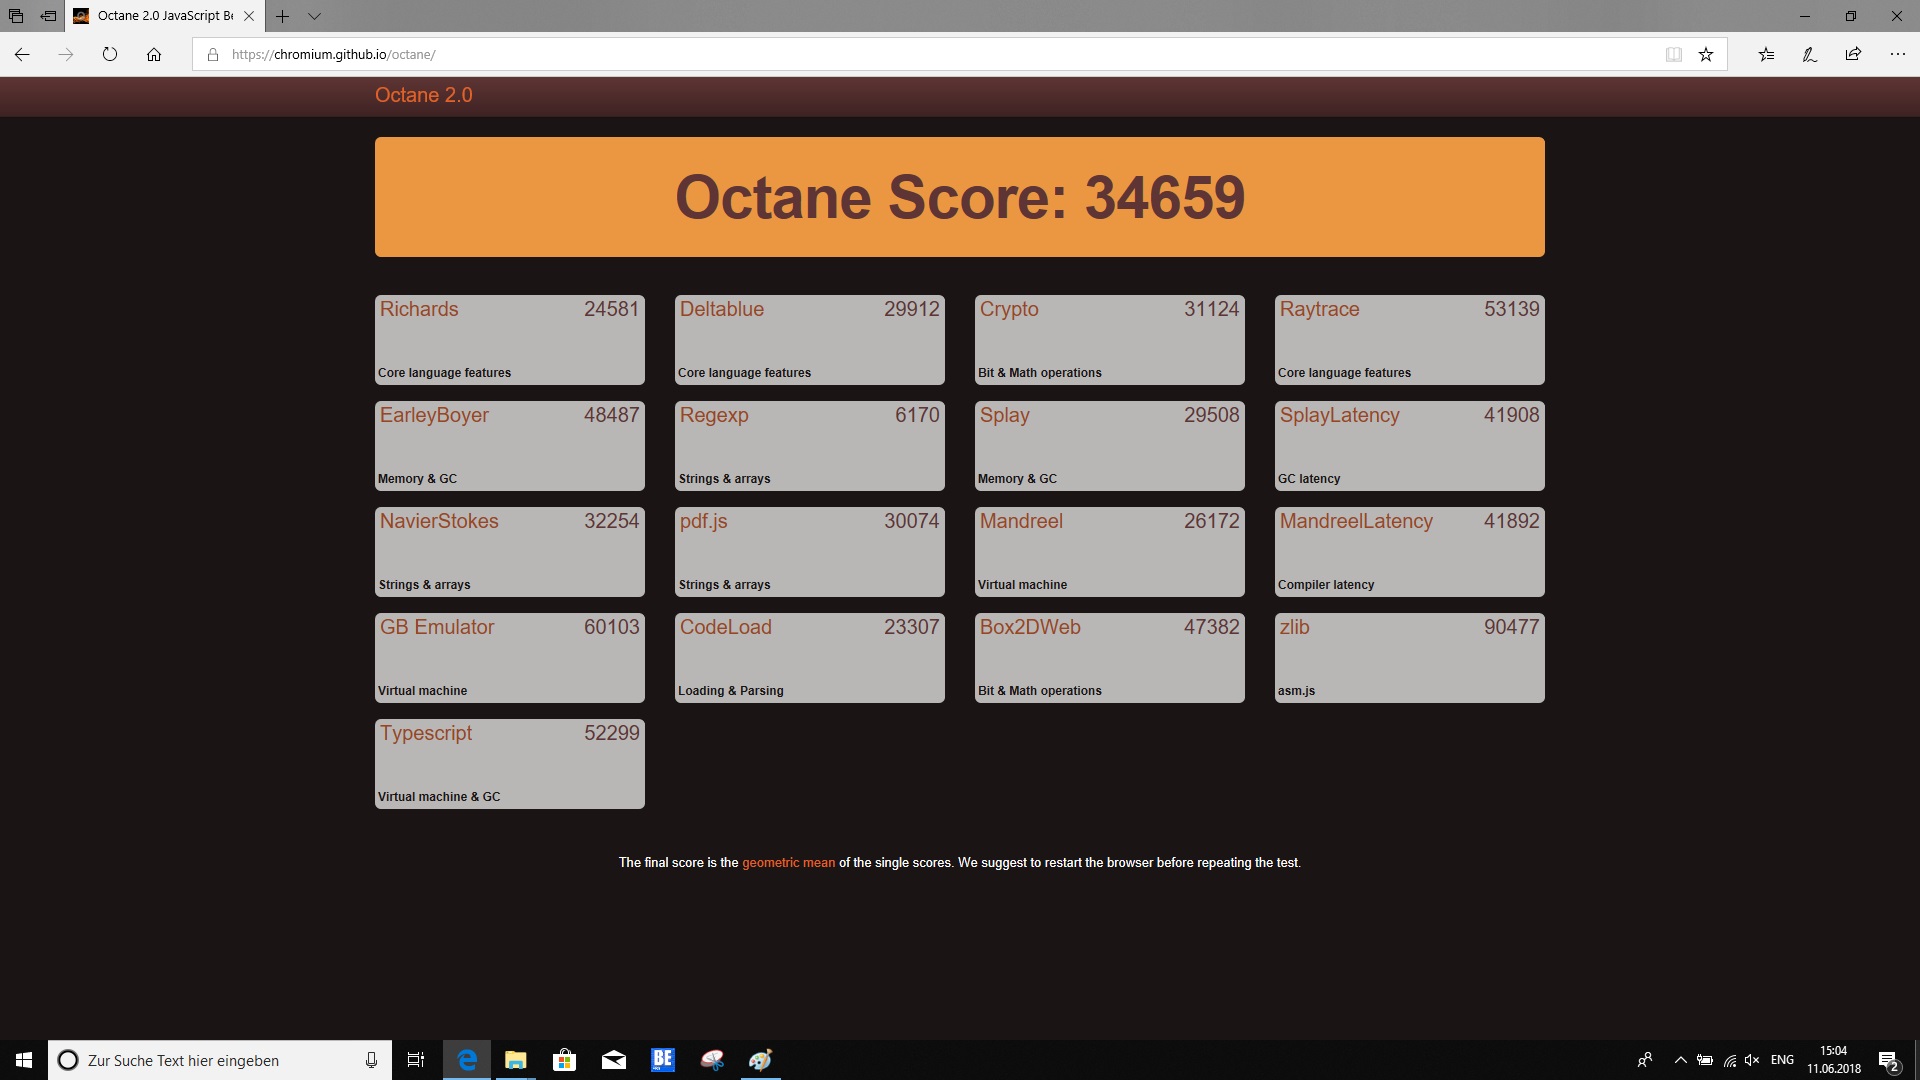
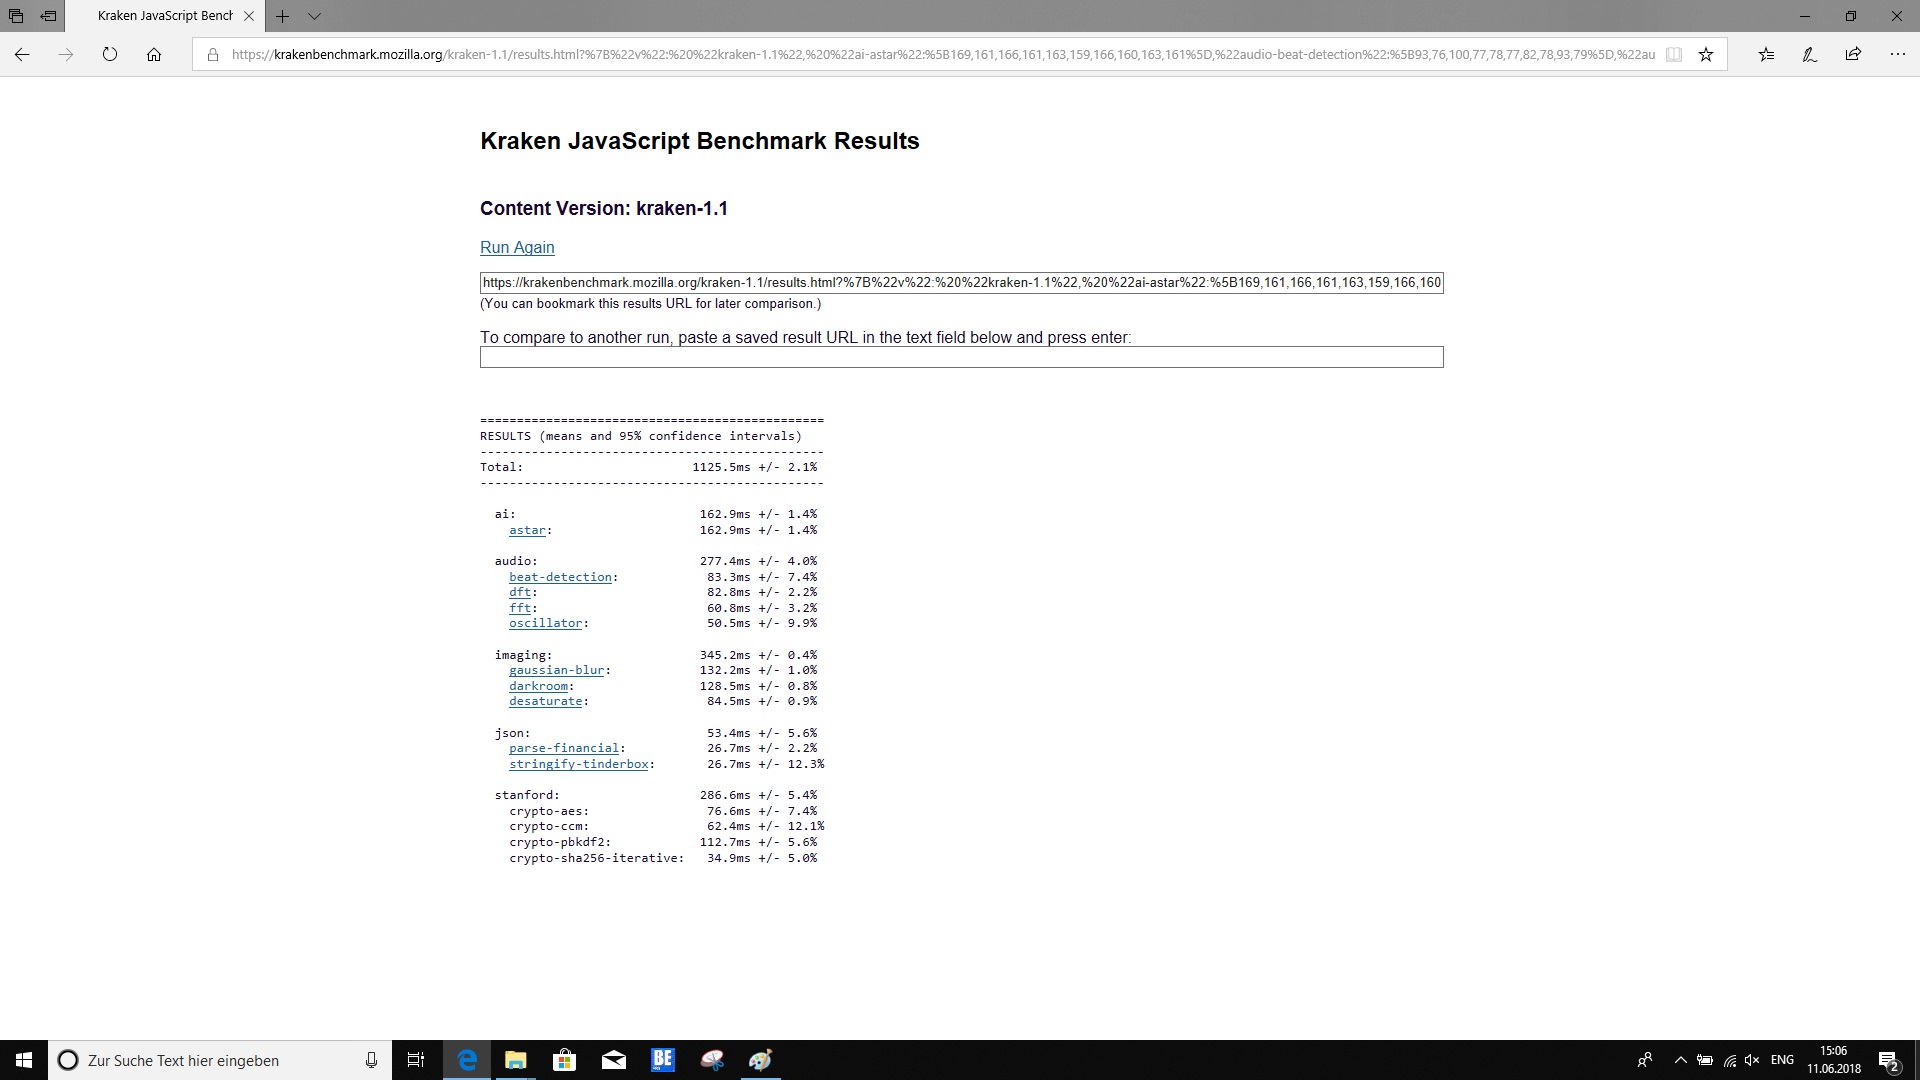
| Octane V2 - Total Score | |
| Az osztály átlaga Gaming (87588 - 139447, n=30, az elmúlt 2 évben) | |
| Dell G5 15 5587 | |
| Átlagos Intel Core i5-8300H (30806 - 34659, n=10) | |
| Dell Inspiron 15 7000 7577 | |
| Asus FX503VM-EH73 | |
* ... a kisebb jobb
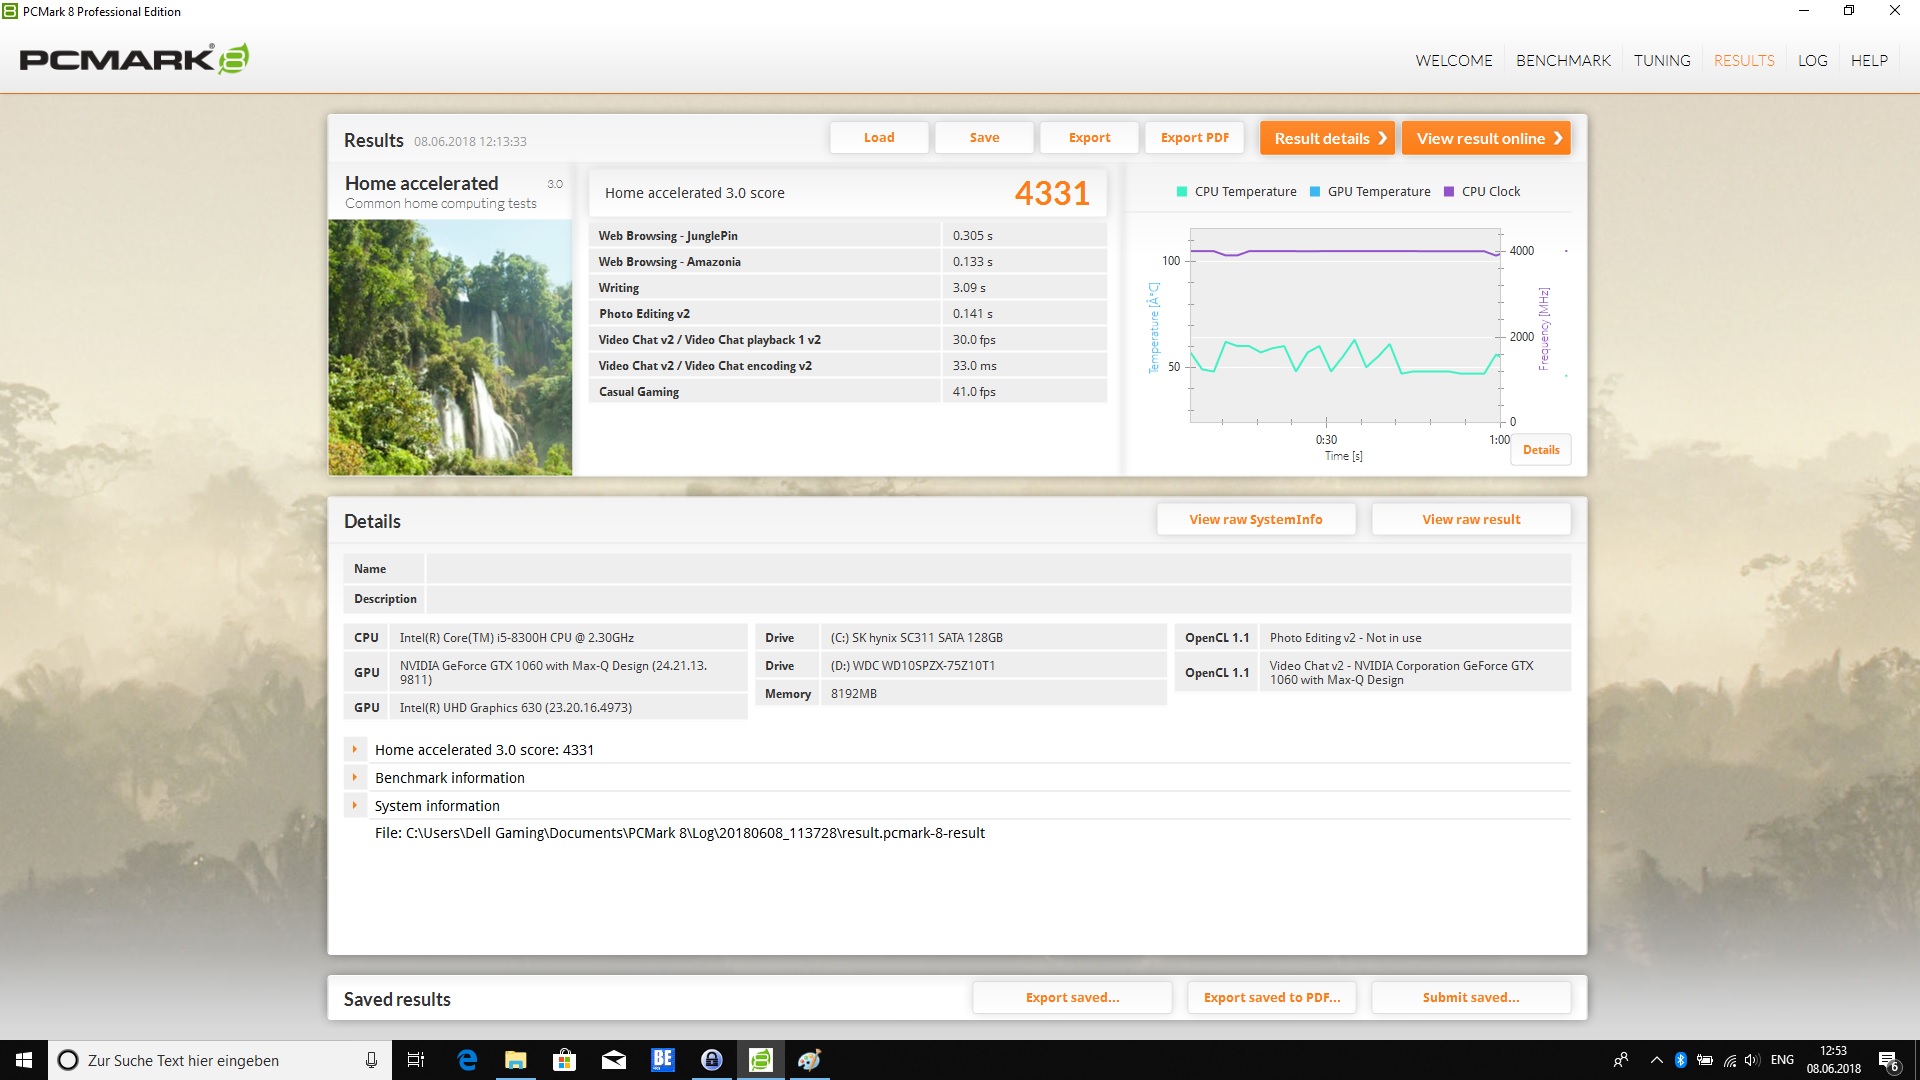
| PCMark 8 Home Score Accelerated v2 | 4331 pontok | |
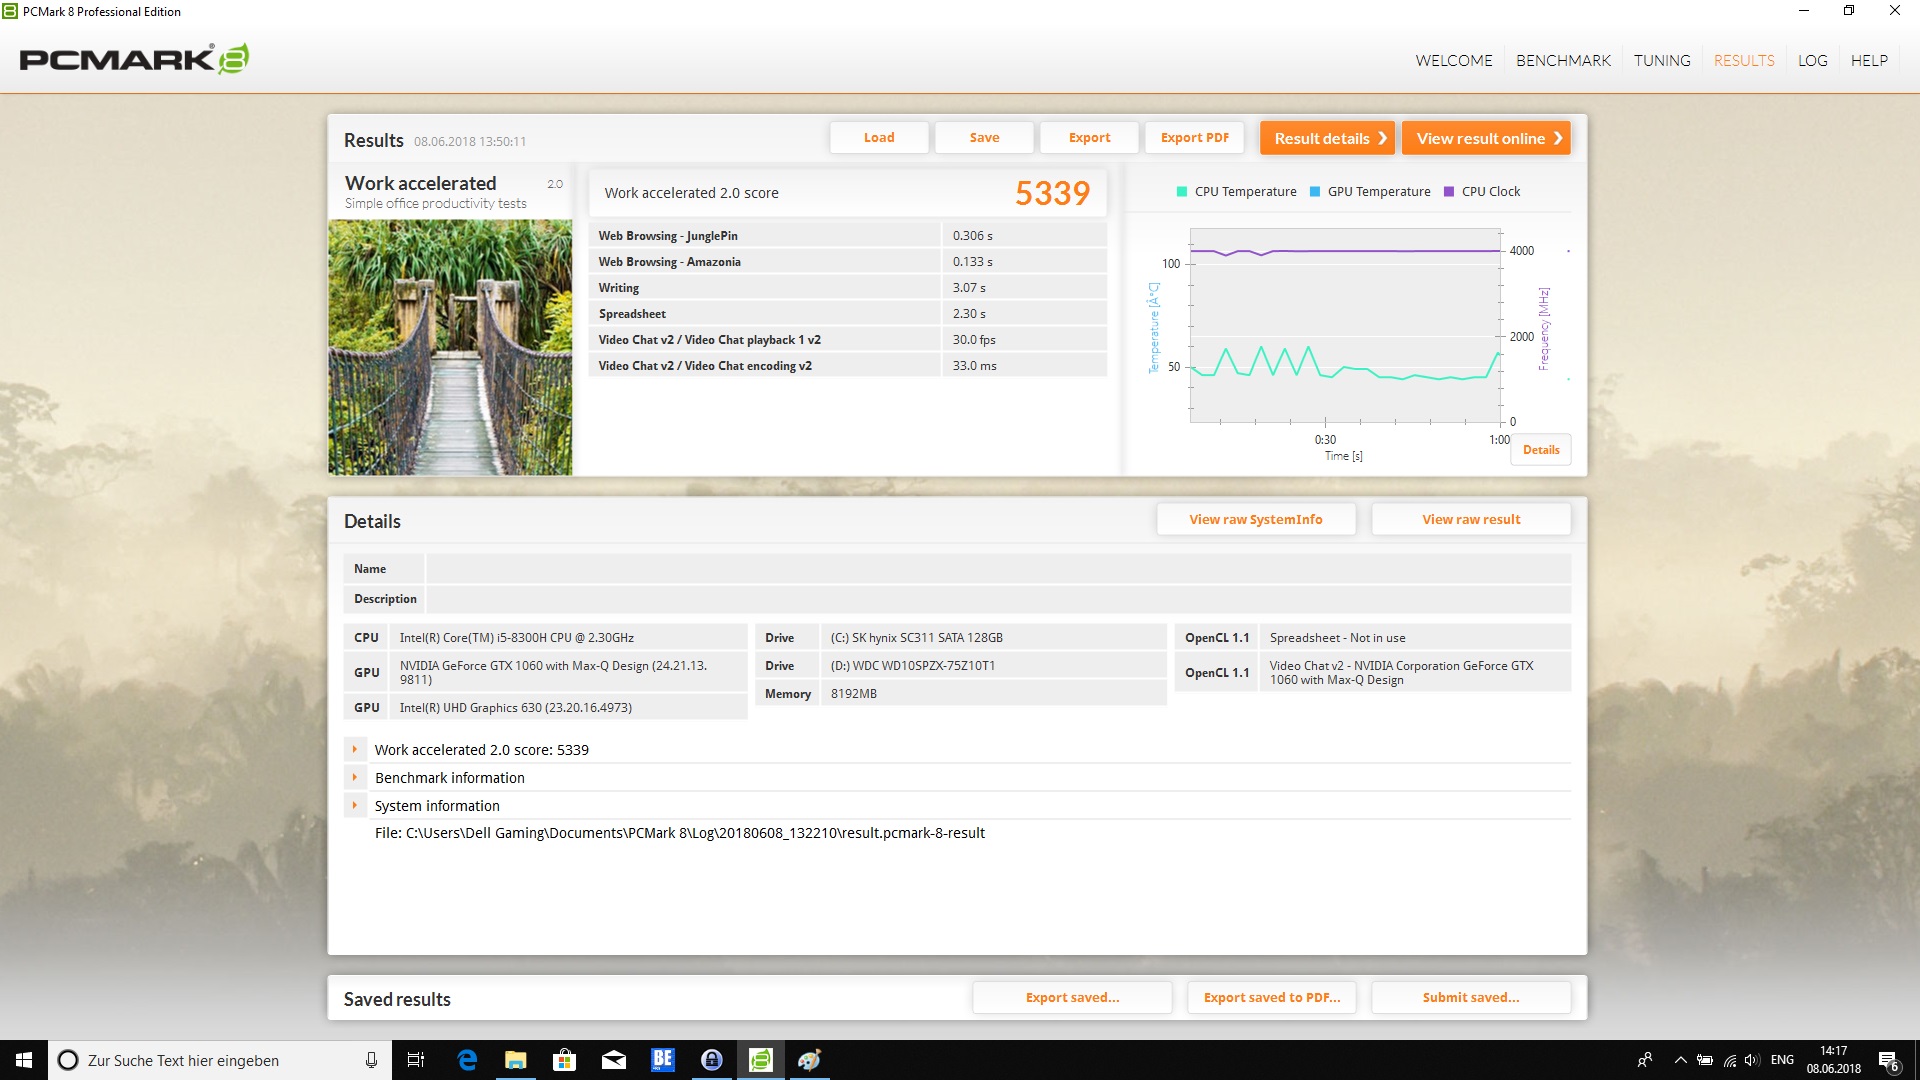
| PCMark 8 Work Score Accelerated v2 | 5339 pontok | |
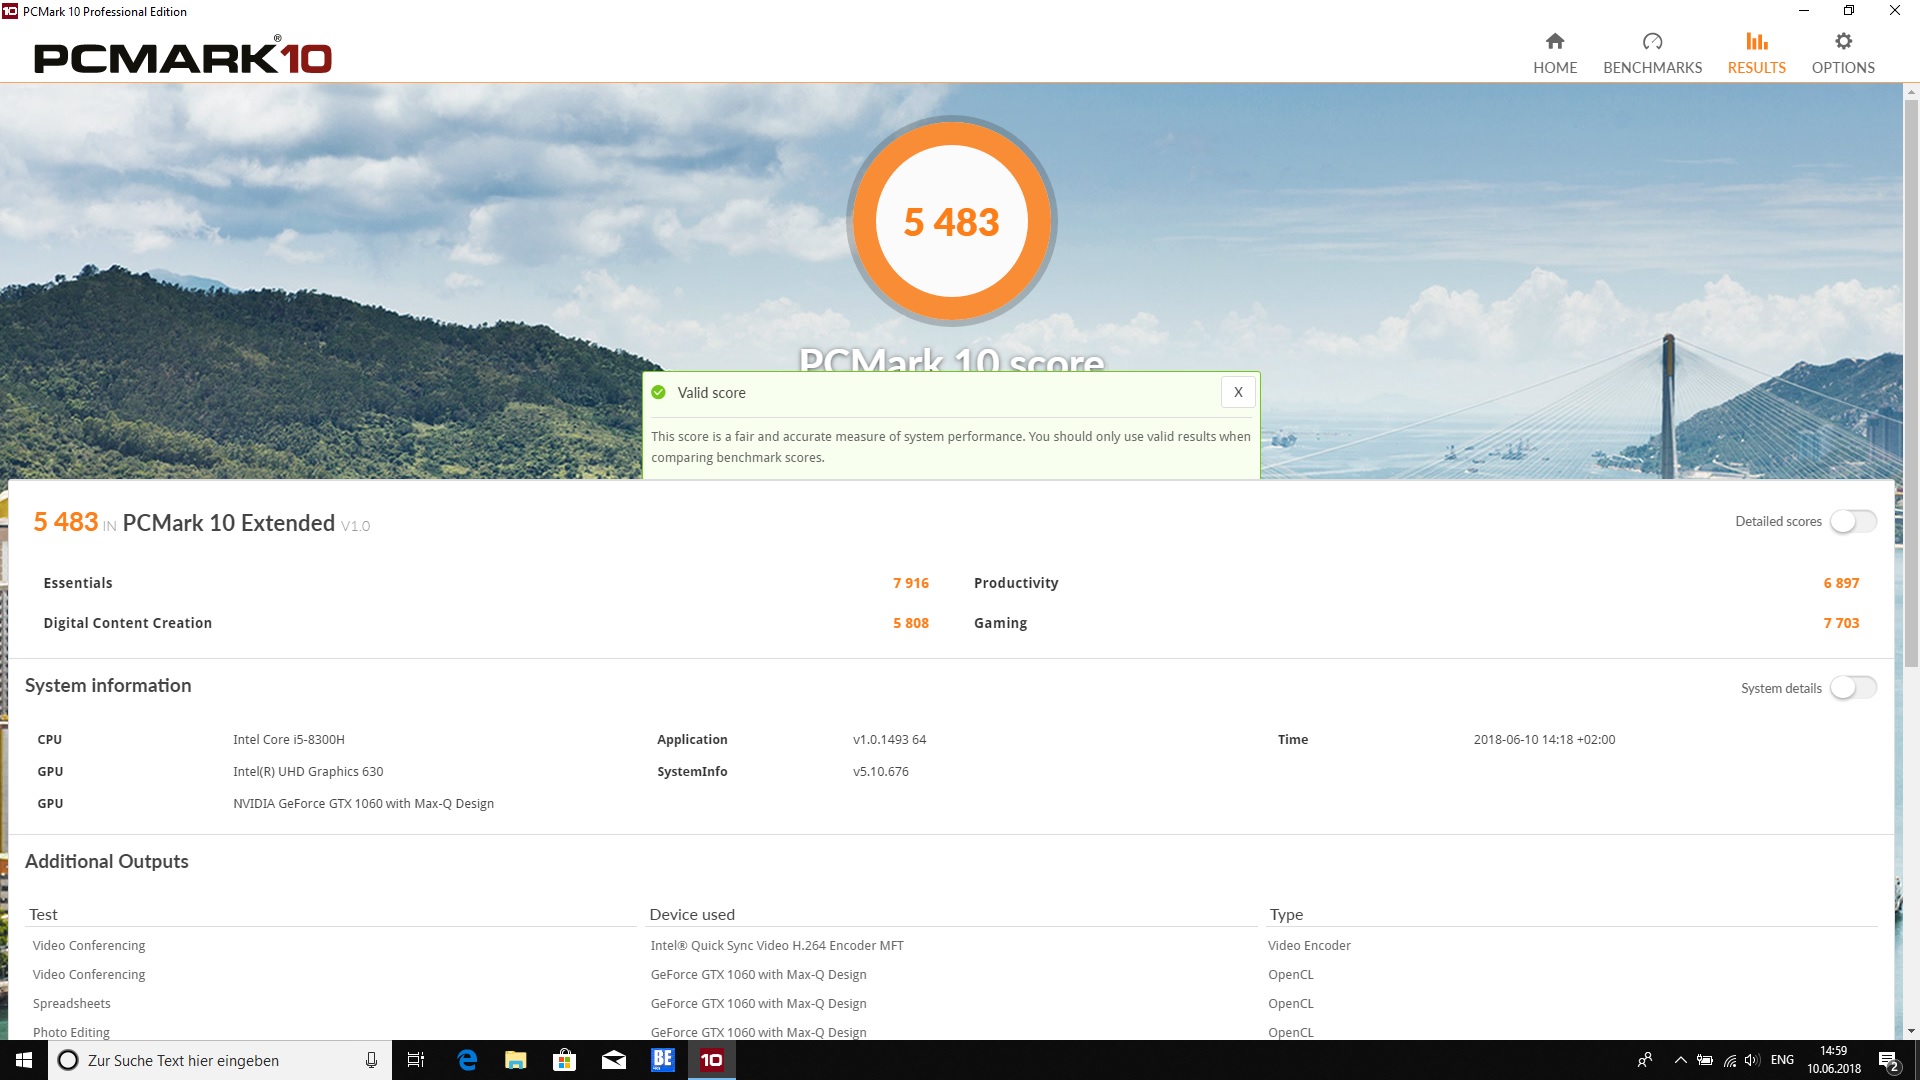
| PCMark 10 Score | 5483 pontok | |
Segítség | ||
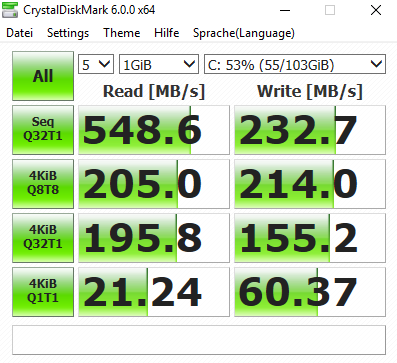
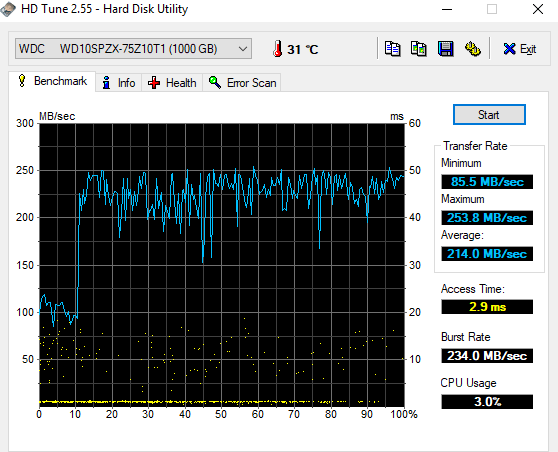
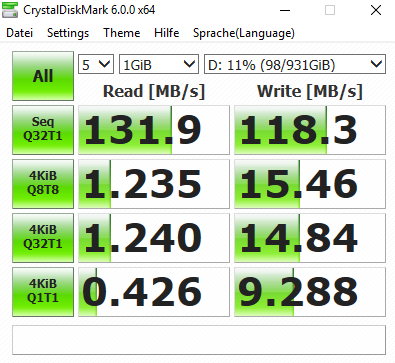
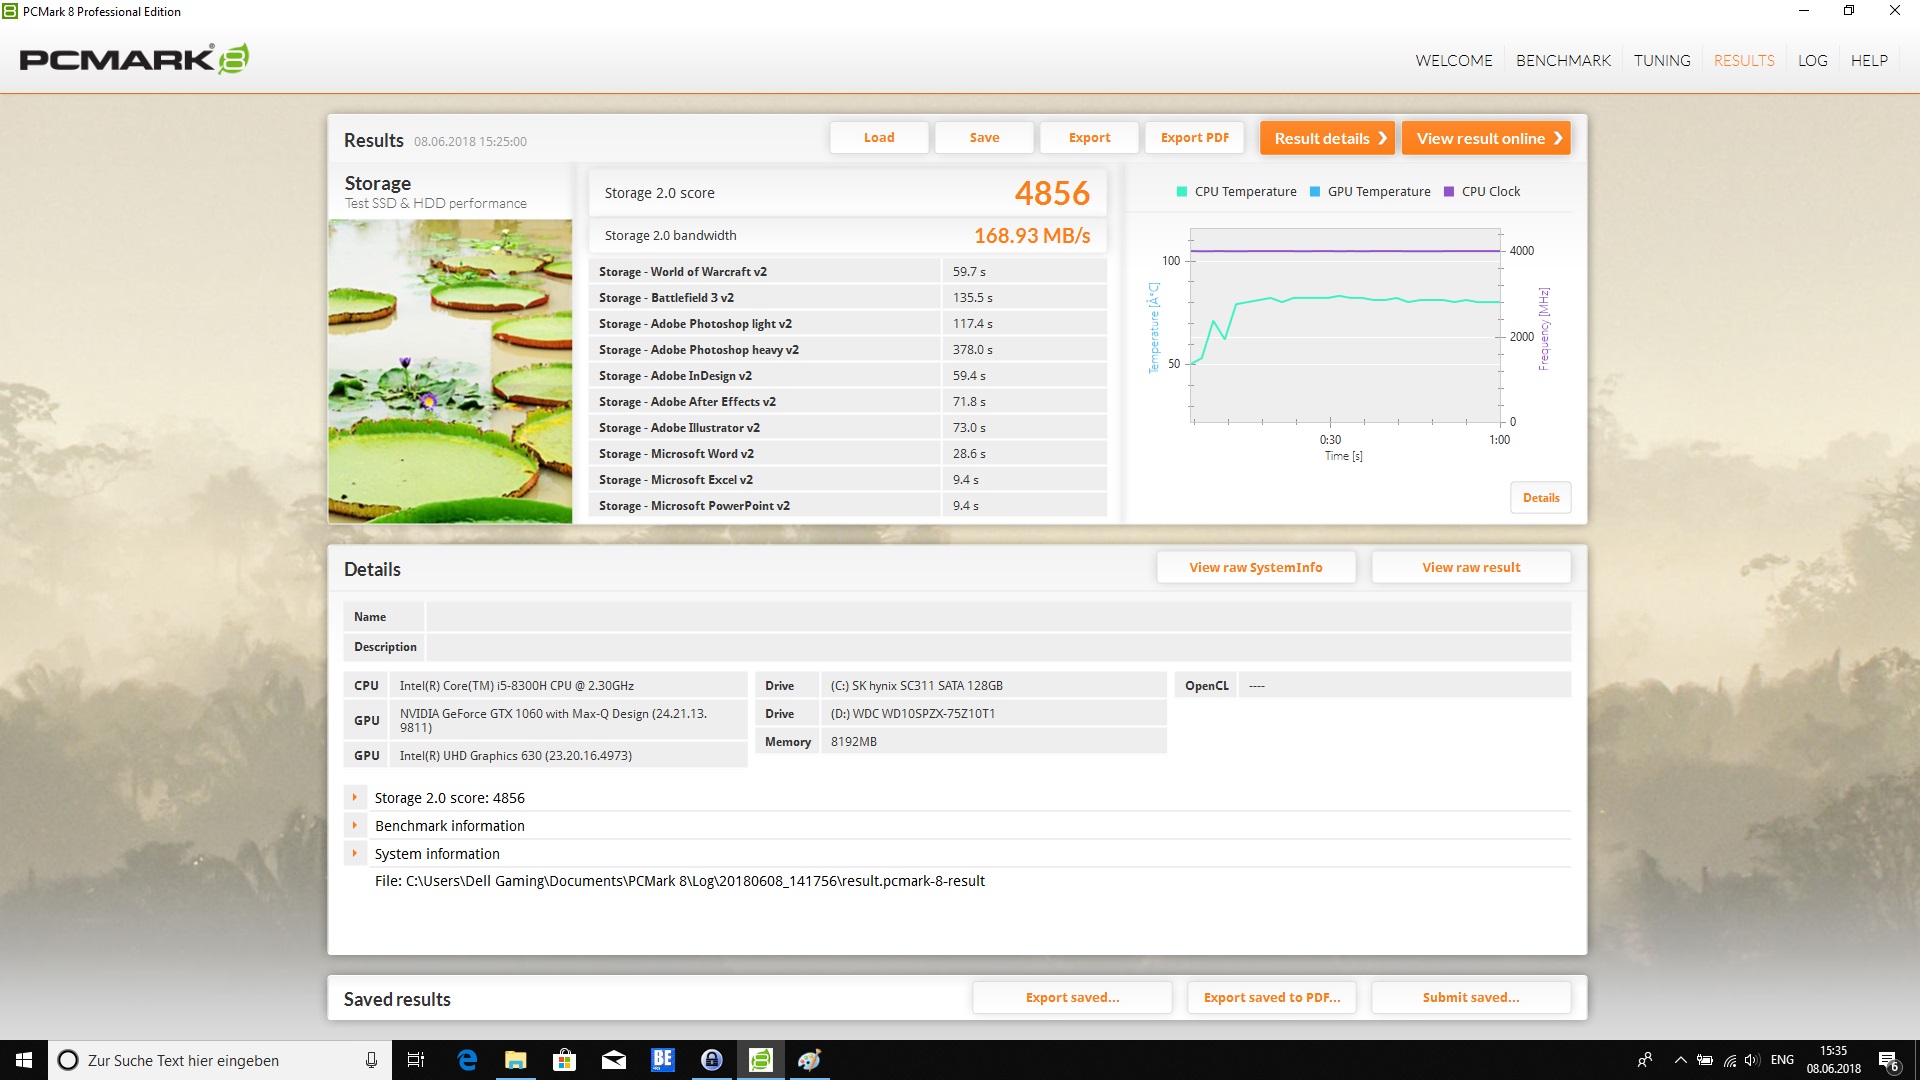
| Dell G5 15 5587 SK hynix SC311 M.2 | Dell Inspiron 15 7000 7577 Samsung PM961 MZVLW256HEHP | PC Zentrum Proteus V Samsung PM961 MZVLW256HEHP | Asus FX503VM-EH73 SanDisk SD8SN8U128G1002 | Acer Nitro 5 Spin NP515-51-86CX Micron 1100 MTFDDAV256TBN | Acer Predator Helios 300 PH317-52-51M6 Hynix HFS128G39TND | |
|---|---|---|---|---|---|---|
| AS SSD | 198% | 220% | -6% | 22% | -47% | |
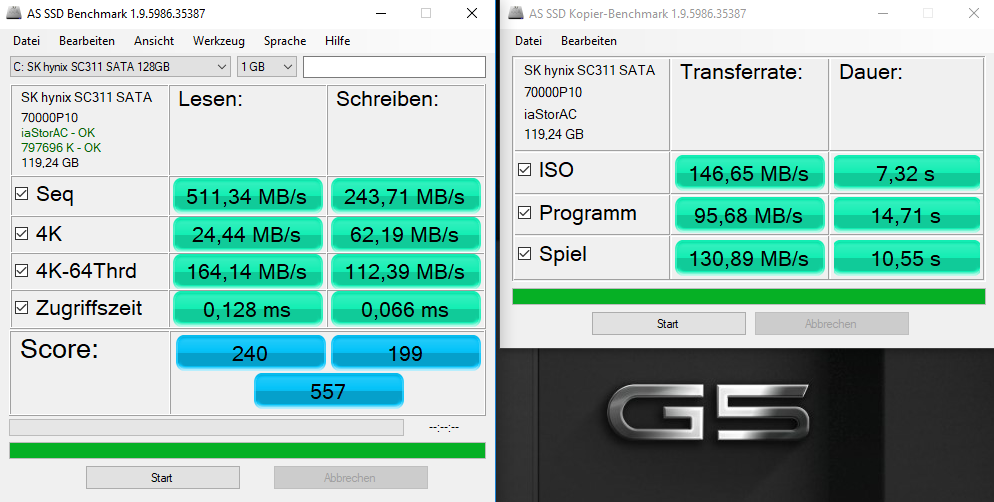
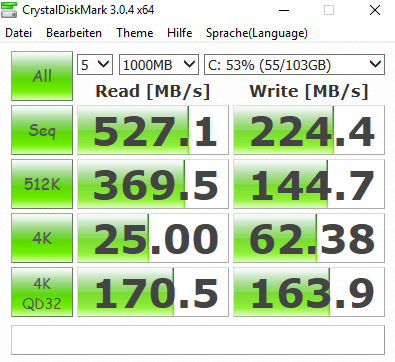
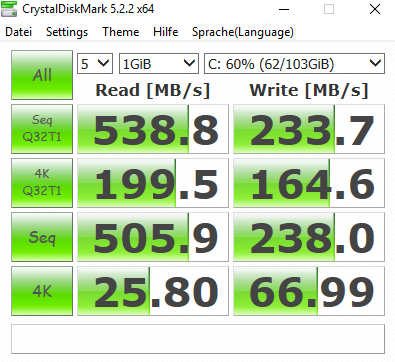
| Seq Read (MB/s) | 511 | 2652 419% | 2541 397% | 476.3 -7% | 490.1 -4% | 513 0% |
| Seq Write (MB/s) | 243.7 | 1181 385% | 1180 384% | 328.4 35% | 335.2 38% | 128.2 -47% |
| 4K Read (MB/s) | 24.44 | 46.95 92% | 51 109% | 20.44 -16% | 25.86 6% | 26.5 8% |
| 4K Write (MB/s) | 62.2 | 100.2 61% | 136.4 119% | 46.48 -25% | 78.1 26% | 62.7 1% |
| Access Time Read * (ms) | 0.128 | 0.058 55% | 0.045 65% | 0.17 -33% | 0.085 34% | |
| Access Time Write * (ms) | 0.066 | 0.037 44% | 0.028 58% | 0.09 -36% | 0.065 2% | 0.259 -292% |
| Score Total (Points) | 557 | 2405 332% | 2842 410% | 798 43% | 835 50% | 811 46% |
* ... a kisebb jobb

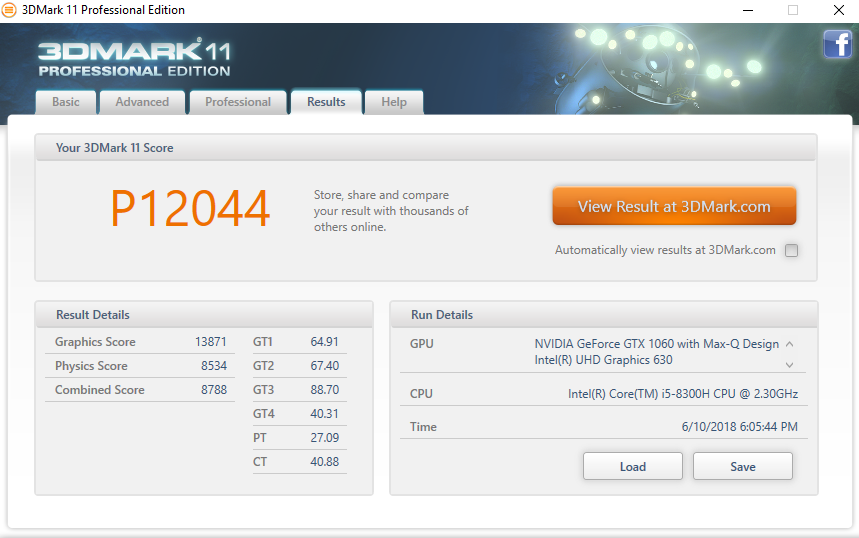
| 3DMark 11 Performance | 12044 pontok | |
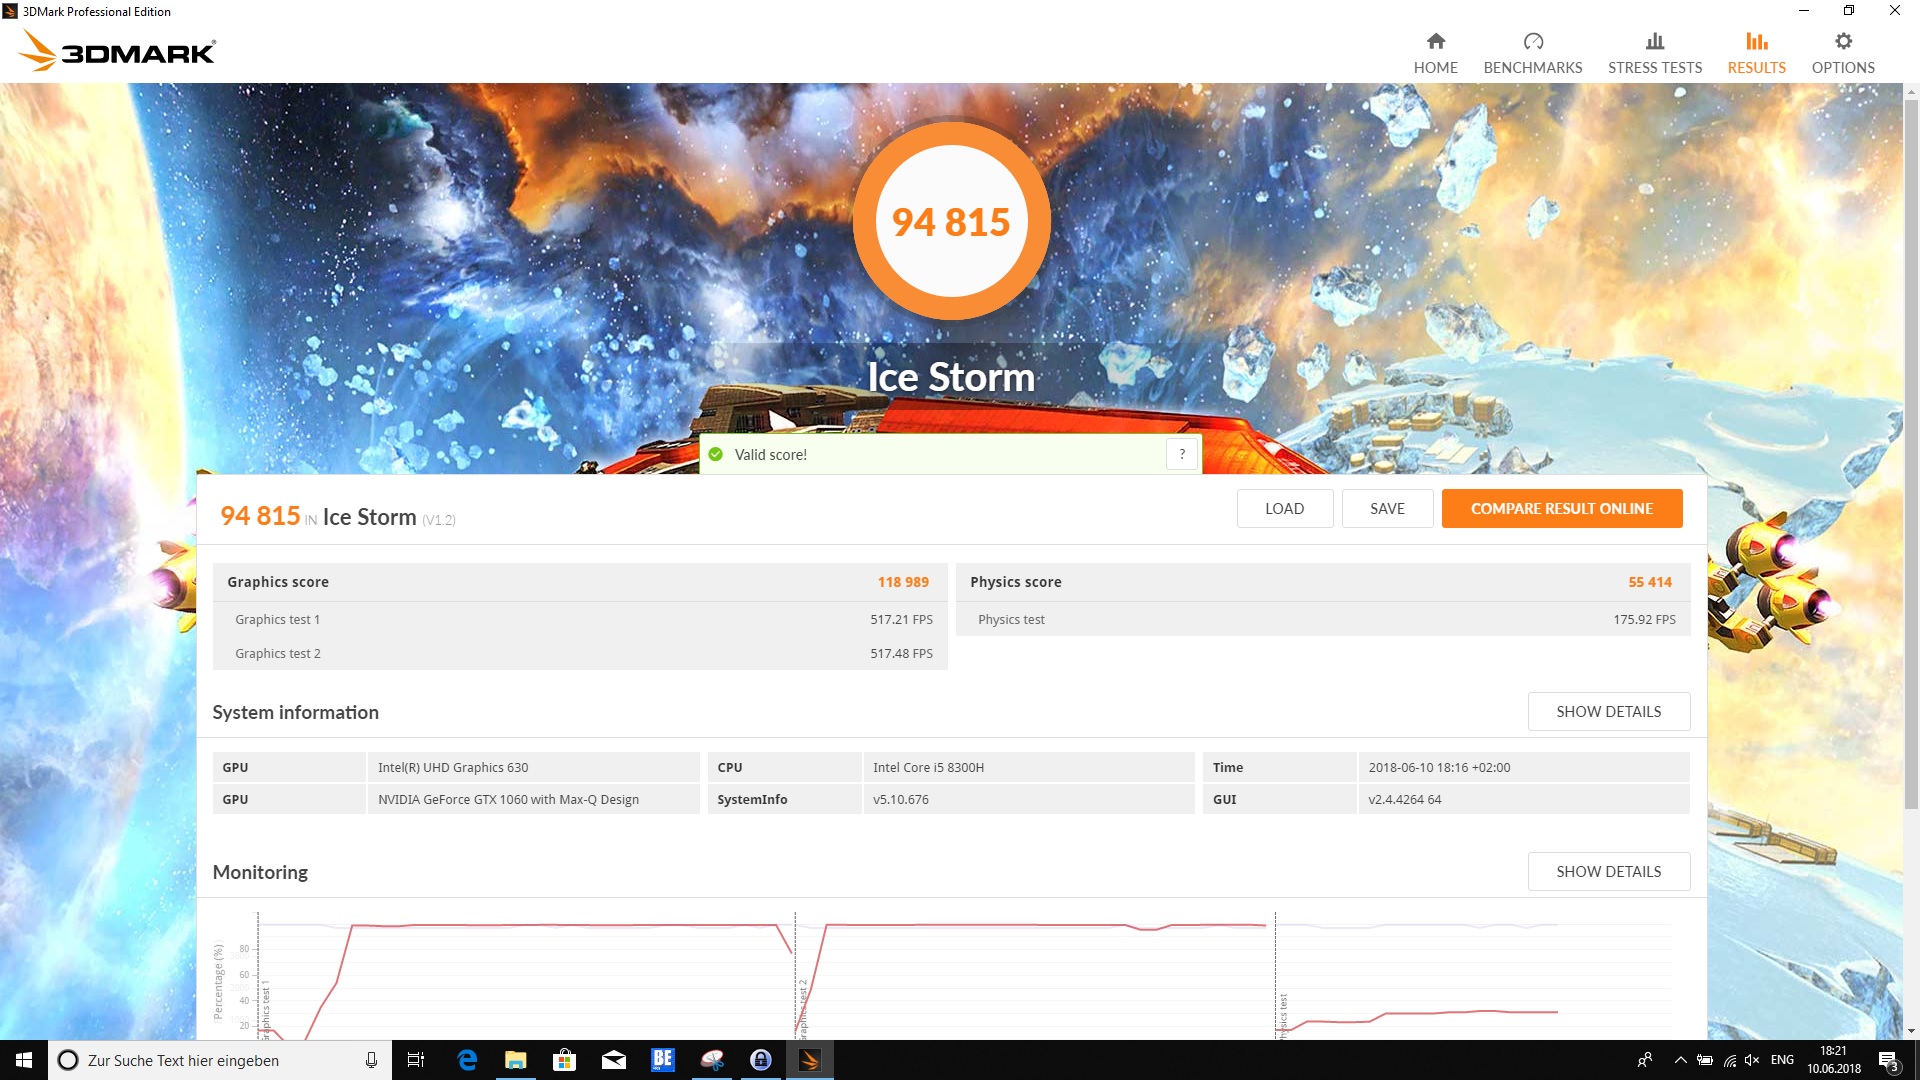
| 3DMark Ice Storm Standard Score | 94815 pontok | |
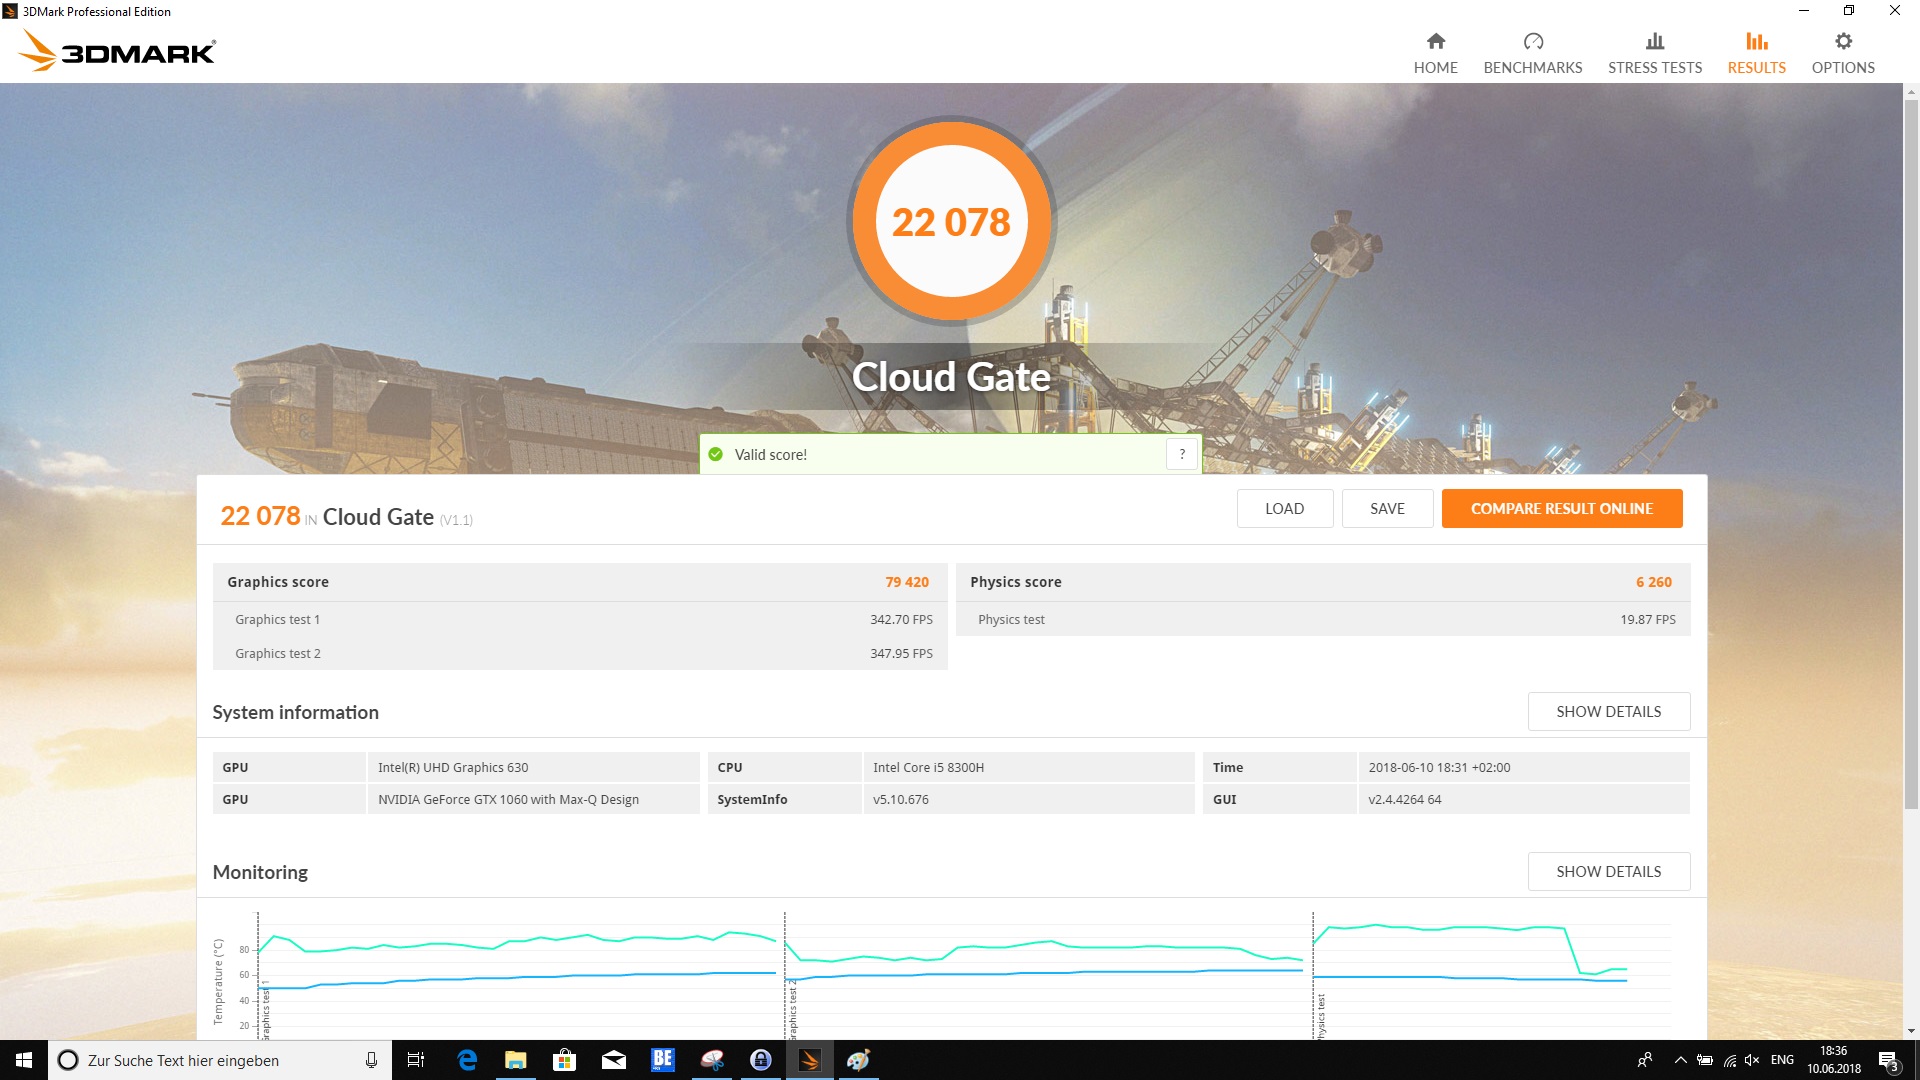
| 3DMark Cloud Gate Standard Score | 22078 pontok | |
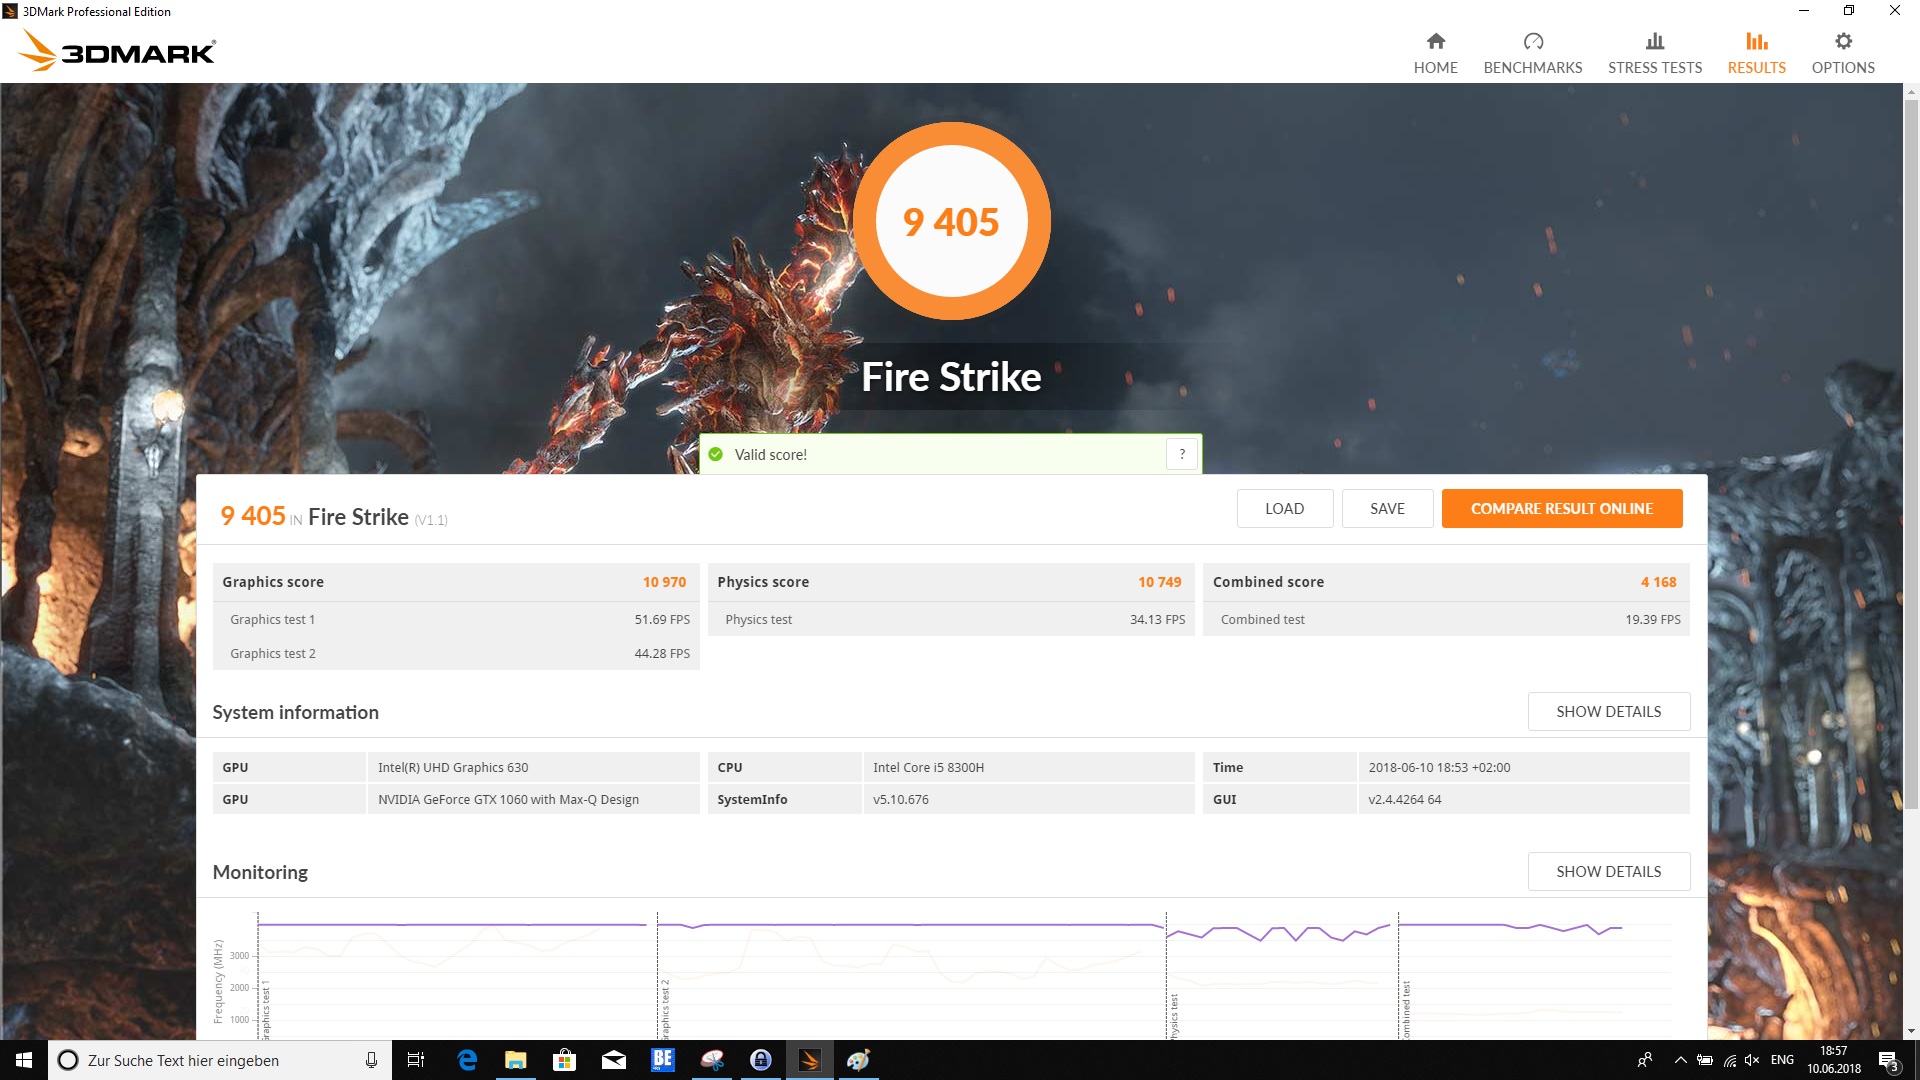
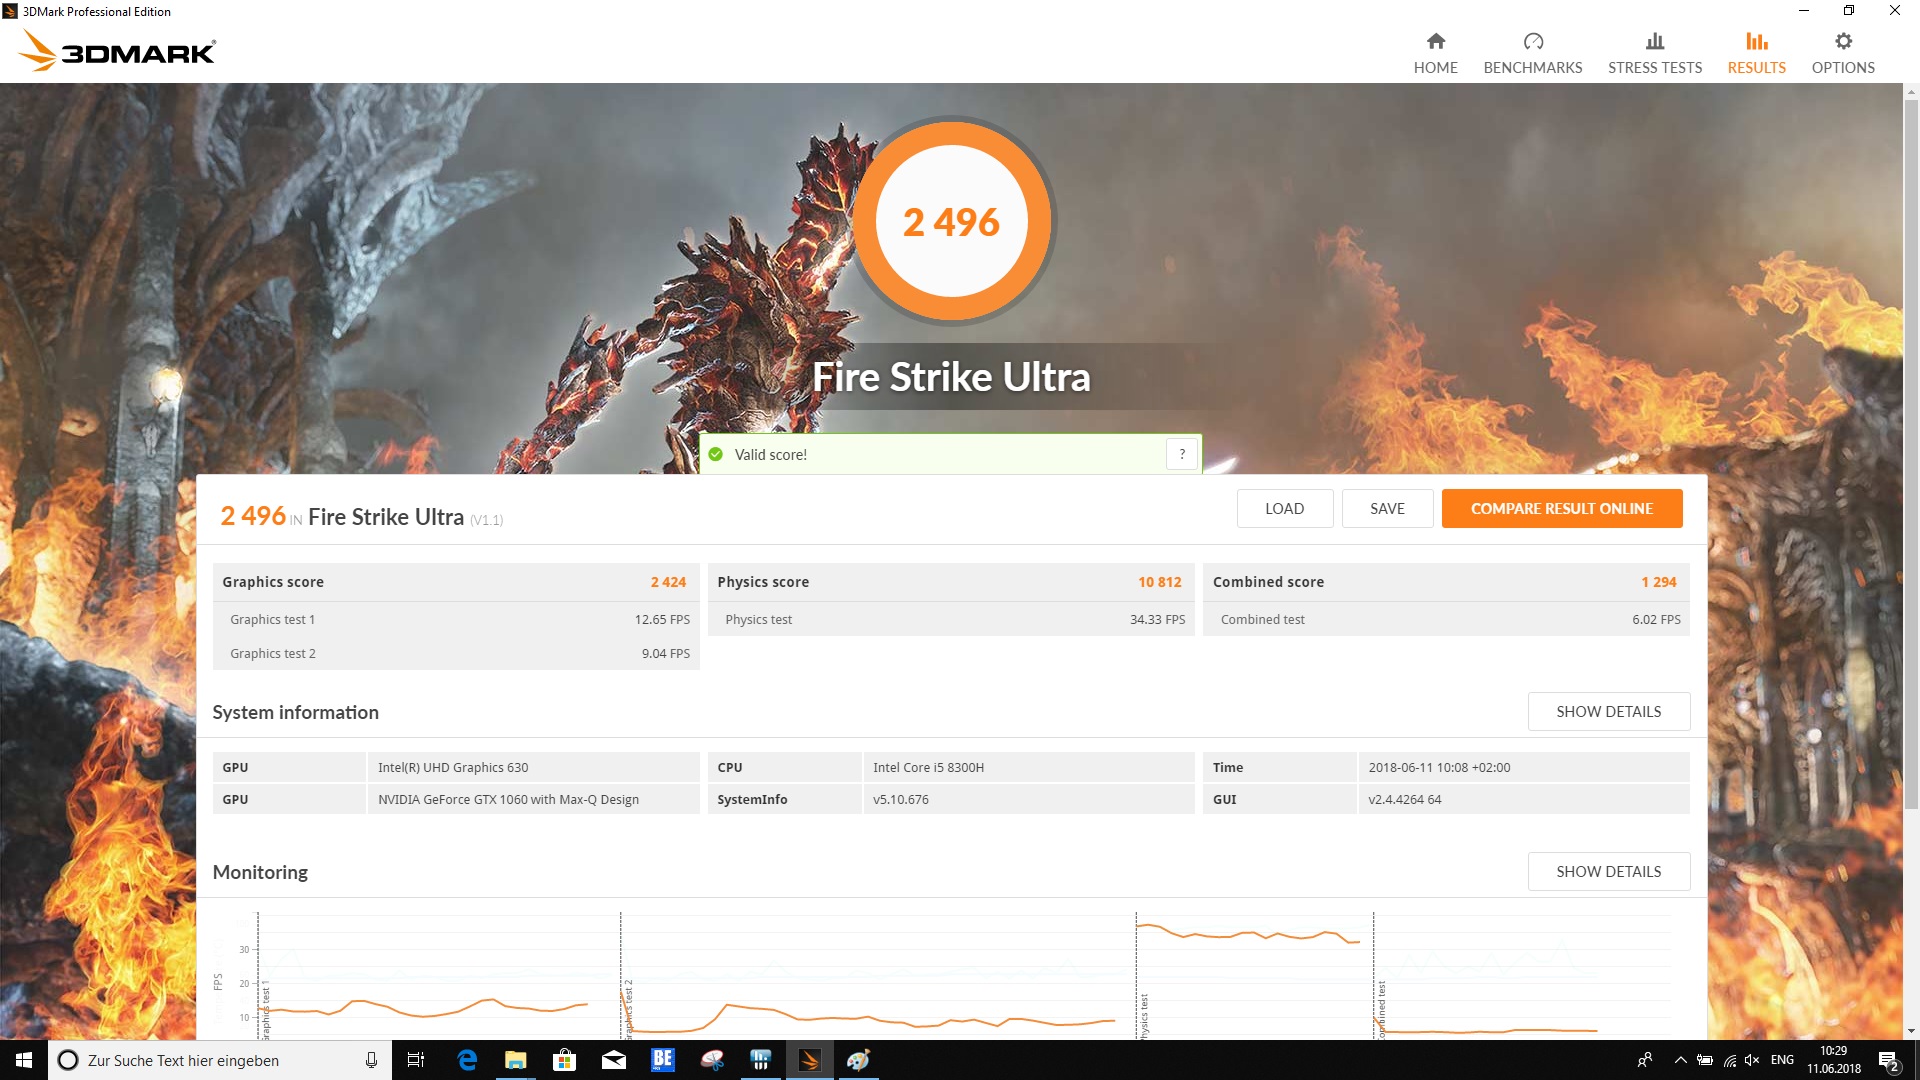
| 3DMark Fire Strike Score | 9405 pontok | |
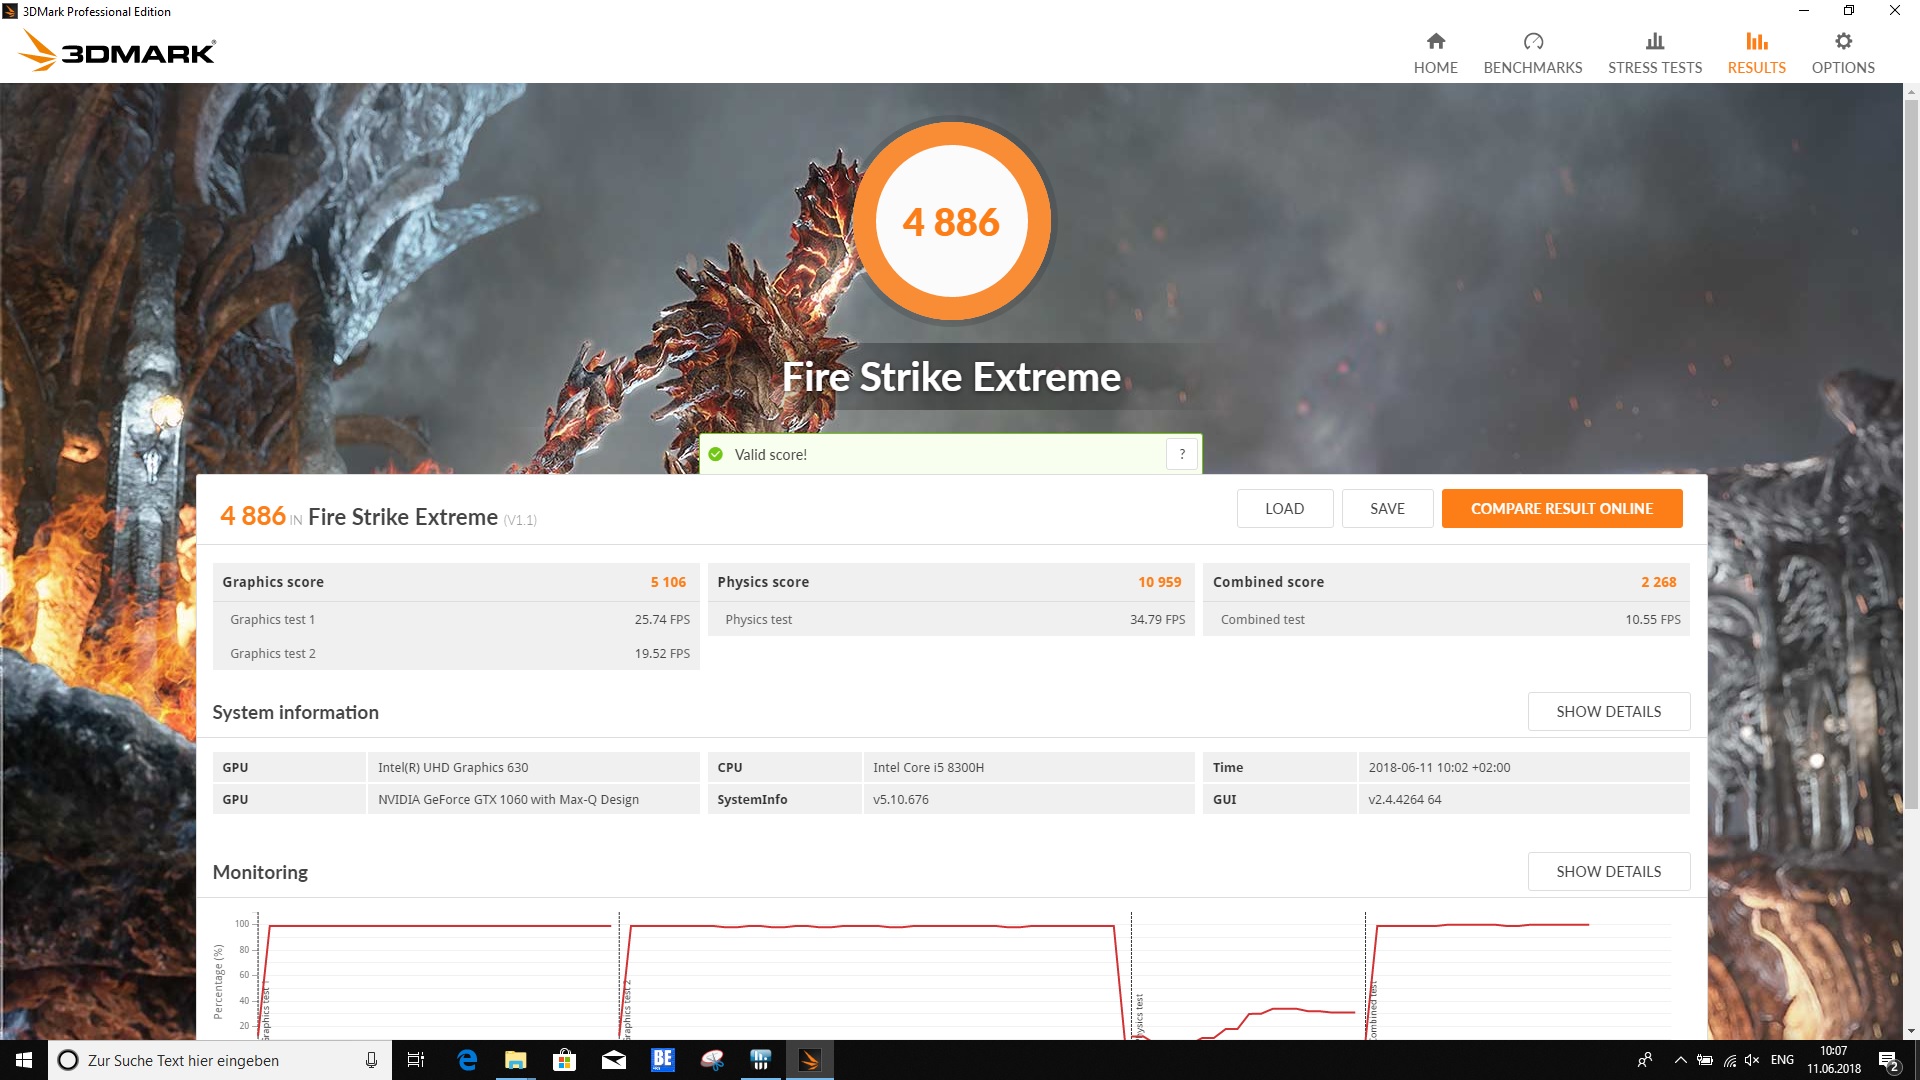
| 3DMark Fire Strike Extreme Score | 4886 pontok | |
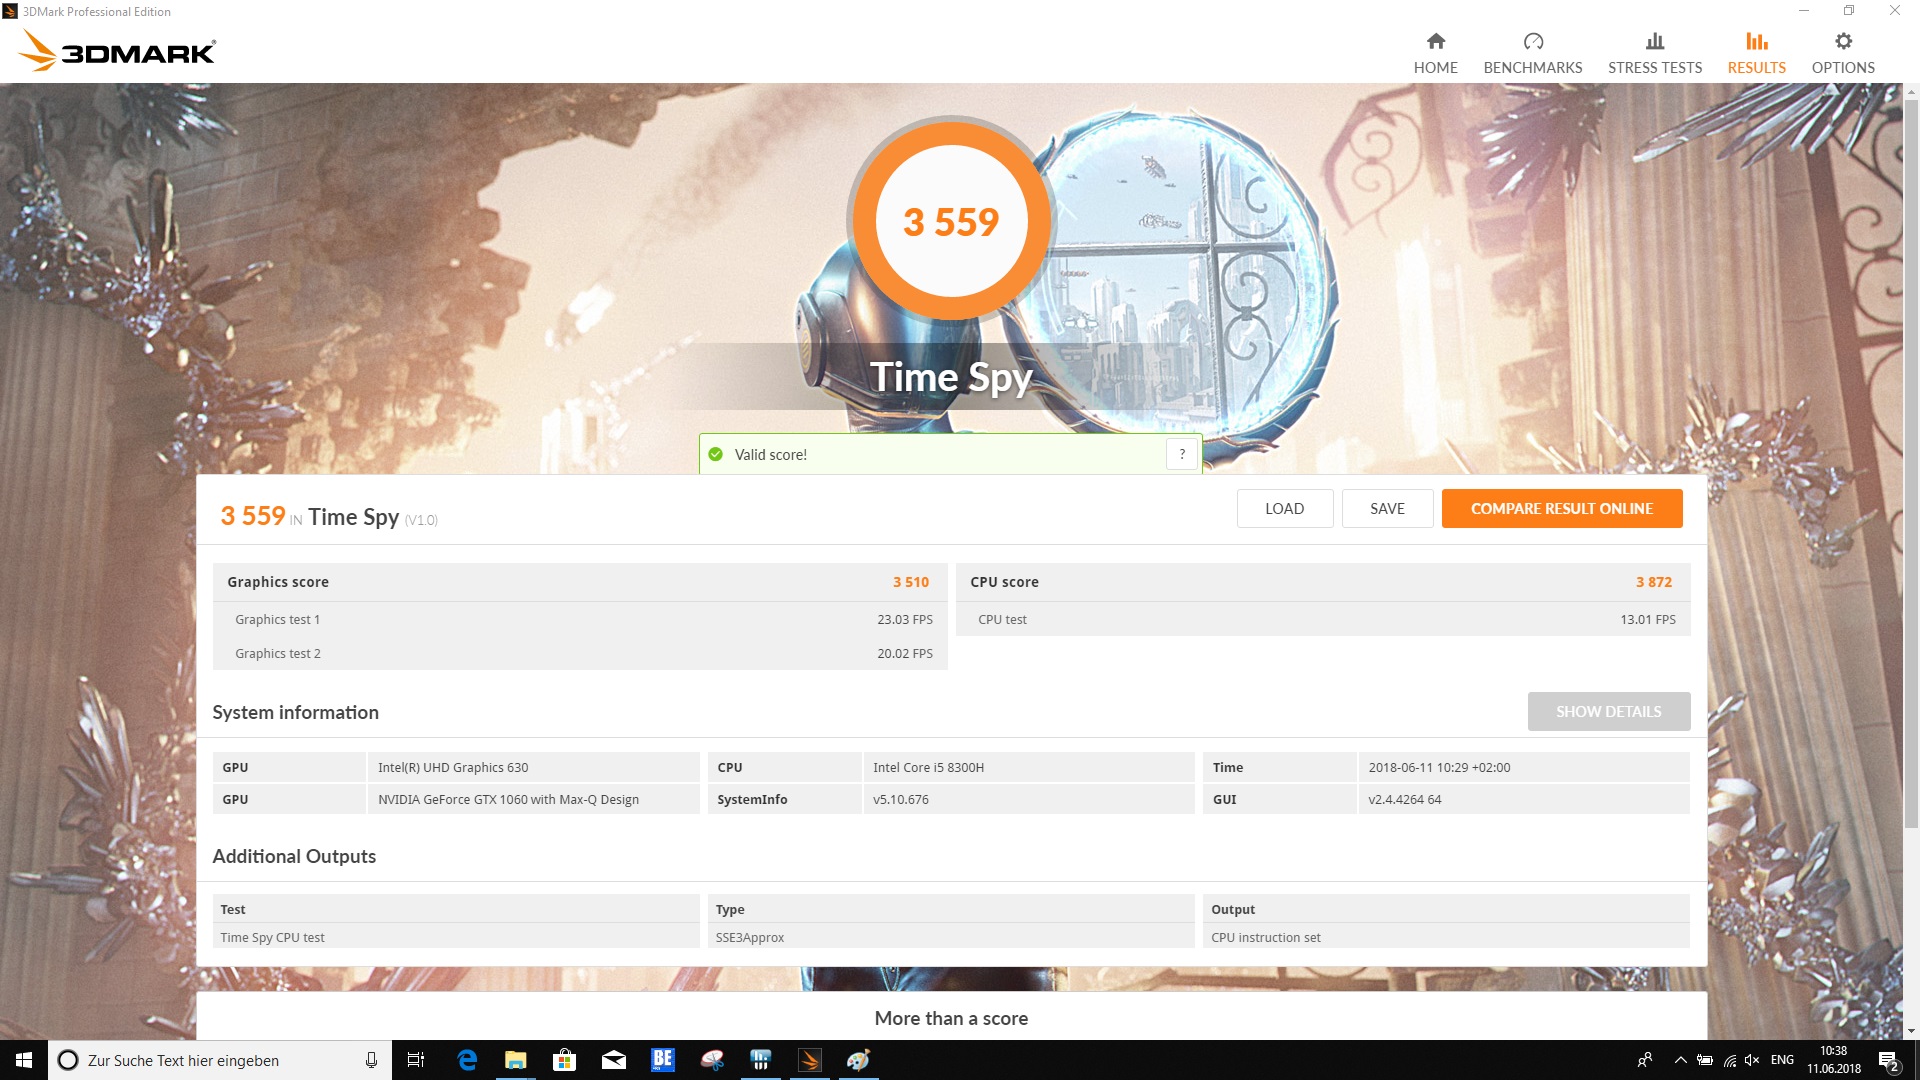
| 3DMark Time Spy Score | 3559 pontok | |
Segítség | ||
| BioShock Infinite - 1920x1080 Ultra Preset, DX11 (DDOF) | |
| Dell G5 15 5587 | |
| Átlagos NVIDIA GeForce GTX 1060 Max-Q (87.2 - 112, n=8) | |
| Dell Inspiron 15 7000 7577 | |
| Dell Inspiron 15 7000 7577 | |
| Rise of the Tomb Raider - 1920x1080 Very High Preset AA:FX AF:16x | |
| Dell G5 15 5587 | |
| Asus FX503VM-EH73 | |
| Átlagos NVIDIA GeForce GTX 1060 Max-Q (45.3 - 66.4, n=8) | |
| Dell Inspiron 15 7000 7577 | |
| Dell Inspiron 15 7000 7577 | |
| Acer Nitro 5 Spin NP515-51-86CX | |
| The Witcher 3 - 1920x1080 Ultra Graphics & Postprocessing (HBAO+) | |
| Az osztály átlaga Gaming (95 - 240, n=8, az elmúlt 2 évben) | |
| PC Zentrum Proteus V | |
| Asus FX503VM-EH73 | |
| Átlagos NVIDIA GeForce GTX 1060 Max-Q (34.6 - 38.5, n=9) | |
| Dell Inspiron 15 7000 7577 | |
| Dell G5 15 5587 | |
| Acer Predator Helios 300 PH317-52-51M6 | |
| Dell Inspiron 15 7000 7577 | |
| alacsony | közepes | magas | ultra | 4K | |
|---|---|---|---|---|---|
| BioShock Infinite (2013) | 264 | 233.1 | 213.3 | 107.5 | |
| GTA V (2015) | 156.8 | 151.6 | 106.5 | 61.8 | 53.7 |
| The Witcher 3 (2015) | 172.2 | 122.3 | 58.3 | 34.9 | 23.3 |
| Rise of the Tomb Raider (2016) | 160.9 | 128.1 | 72.7 | 60.5 | 24.6 |
| Playerunknown's Battlegrounds (PUBG) (2017) | 141.9 | 92.5 | 85.6 | 63.3 | 12.9 |
| FIFA 18 (2017) | 290.6 | 277.9 | 252.3 | 245.7 | 130 |
| Assassin´s Creed Origins (2017) | 77 | 67 | 62 | 52 | 21 |
| Call of Duty WWII (2017) | 174.9 | 163.3 | 91.9 | 70.9 | 31.3 |
| Need for Speed Payback (2017) | 117.9 | 89.1 | 78.5 | 66.6 | 23.8 |
| Star Wars Battlefront 2 (2017) | 135.5 | 93.4 | 81.5 | 62.2 | |
| Fortnite (2018) | 178 | 132.6 | 115.7 | 72.8 | |
| Kingdom Come: Deliverance (2018) | 110 | 66.8 | 52.7 | 38 | 12 |
| Far Cry 5 (2018) | 110 | 70 | 65 | 48 | 20 |
Zajszint
| Üresjárat |
| 31.1 / 31.1 / 34.2 dB(A) |
| Terhelés |
| 34.9 / 44 dB(A) |
 | ||
30 dB csendes 40 dB(A) hallható 50 dB(A) hangos |
||
min: | ||
| Dell G5 15 5587 GeForce GTX 1060 Max-Q, i5-8300H, SK hynix SC311 M.2 | Dell Inspiron 15 7000 7577 GeForce GTX 1050 Mobile, i5-7300HQ, Seagate Mobile HDD 1TB ST1000LX015-1U7172 | Dell Inspiron 15 7000 7577 GeForce GTX 1060 Max-Q, i5-7300HQ, Samsung PM961 MZVLW256HEHP | PC Zentrum Proteus V GeForce GTX 1060 Mobile, i7-7700HQ, Samsung PM961 MZVLW256HEHP | Asus FX503VM-EH73 GeForce GTX 1060 Mobile, i7-7700HQ, SanDisk SD8SN8U128G1002 | Acer Nitro 5 Spin NP515-51-86CX GeForce GTX 1050 Mobile, i5-8550U, Micron 1100 MTFDDAV256TBN | Acer Predator Helios 300 PH317-52-51M6 GeForce GTX 1050 Ti Mobile, i5-8300H, Hynix HFS128G39TND | |
|---|---|---|---|---|---|---|---|
| Noise | -2% | 9% | -16% | -2% | -2% | -5% | |
| off / környezet * (dB) | 30.3 | 31 -2% | 28 8% | 31 -2% | 27.8 8% | 30.4 -0% | 29 4% |
| Idle Minimum * (dB) | 31.1 | 32.7 -5% | 28 10% | 37 -19% | 29.6 5% | 30.9 1% | 29 7% |
| Idle Average * (dB) | 31.1 | 32.7 -5% | 28 10% | 38 -22% | 29.6 5% | 30.9 1% | 31 -0% |
| Idle Maximum * (dB) | 34.2 | 32.7 4% | 28 18% | 39 -14% | 29.6 13% | 30.9 10% | 33 4% |
| Load Average * (dB) | 34.9 | 38.7 -11% | 30.3 13% | 47 -35% | 37.3 -7% | 42.6 -22% | 45 -29% |
| Witcher 3 ultra * (dB) | 42.7 | 39 9% | 39.5 7% | 43 -1% | 49.8 -17% | 45 -5% | |
| Load Maximum * (dB) | 44 | 44.6 -1% | 46.5 -6% | 52 -18% | 53.7 -22% | 45 -2% | 51 -16% |
* ... a kisebb jobb
(-) A felső oldalon a maximális hőmérséklet 50.2 °C / 122 F, összehasonlítva a 40.4 °C / 105 F átlagával , 21.2 és 68.8 °C között a Gaming osztálynál.
(-) Az alsó maximum 57 °C / 135 F-ig melegszik fel, összehasonlítva a 43.2 °C / 110 F átlagával
(+) Üresjáratban a felső oldal átlagos hőmérséklete 27.3 °C / 81 F, összehasonlítva a 33.9 °C / ### eszközátlaggal class_avg_f### F.
(-) A The Witcher 3 játék során a felső oldal átlaghőmérséklete 38.5 °C / 101 F, összehasonlítva a 33.9 °C / ## eszközátlaggal #class_avg_f### F.
(+) A csuklótámasz és az érintőpad eléri a bőr maximális hőmérsékletét (33.7 °C / 92.7 F), ezért nem forrók.
(-) A hasonló eszközök csuklótámasz területének átlagos hőmérséklete 28.8 °C / 83.8 F volt (-4.9 °C / -8.9 F).
| Dell G5 15 5587 GeForce GTX 1060 Max-Q, i5-8300H, SK hynix SC311 M.2 | Dell Inspiron 15 7000 7577 GeForce GTX 1050 Mobile, i5-7300HQ, Seagate Mobile HDD 1TB ST1000LX015-1U7172 | Dell Inspiron 15 7000 7577 GeForce GTX 1060 Max-Q, i5-7300HQ, Samsung PM961 MZVLW256HEHP | PC Zentrum Proteus V GeForce GTX 1060 Mobile, i7-7700HQ, Samsung PM961 MZVLW256HEHP | Asus FX503VM-EH73 GeForce GTX 1060 Mobile, i7-7700HQ, SanDisk SD8SN8U128G1002 | Acer Nitro 5 Spin NP515-51-86CX GeForce GTX 1050 Mobile, i5-8550U, Micron 1100 MTFDDAV256TBN | Acer Predator Helios 300 PH317-52-51M6 GeForce GTX 1050 Ti Mobile, i5-8300H, Hynix HFS128G39TND | |
|---|---|---|---|---|---|---|---|
| Heat | 13% | 12% | 5% | -20% | 10% | -3% | |
| Maximum Upper Side * (°C) | 50.2 | 35.9 28% | 44 12% | 44 12% | 59.6 -19% | 46 8% | 50 -0% |
| Maximum Bottom * (°C) | 57 | 41.6 27% | 43.8 23% | 53 7% | 56 2% | 47 18% | 52 9% |
| Idle Upper Side * (°C) | 28.6 | 27.9 2% | 26 9% | 29 -1% | 37 -29% | 29.6 -3% | 33 -15% |
| Idle Bottom * (°C) | 28.9 | 30.5 -6% | 28 3% | 29 -0% | 38.6 -34% | 24.6 15% | 30 -4% |
* ... a kisebb jobb
Dell G5 15 5587 hangelemzés
(-) | nem túl hangos hangszórók (68.5 dB)
Basszus 100 - 315 Hz
(±) | csökkentett basszus – átlagosan 12.5%-kal alacsonyabb, mint a medián
(+) | a basszus lineáris (5.9% delta az előző frekvenciához)
Közepes 400-2000 Hz
(+) | kiegyensúlyozott középpontok – csak 4.6% választja el a mediántól
(+) | a középpontok lineárisak (5.1% delta az előző frekvenciához)
Maximum 2-16 kHz
(+) | kiegyensúlyozott csúcsok – csak 1.1% választja el a mediántól
(+) | a csúcsok lineárisak (3.6% delta az előző frekvenciához képest)
Összességében 100 - 16.000 Hz
(+) | általános hangzás lineáris (14.9% eltérés a mediánhoz képest)
Ugyanazon osztályhoz képest
» 30%Ebben az osztályban az összes tesztelt eszköz %-a jobb volt, 7% hasonló, 63%-kal rosszabb
» A legjobb delta értéke 6%, az átlag 18%, a legrosszabb 132% volt
Az összes tesztelt eszközzel összehasonlítva
» 20% az összes tesztelt eszköz jobb volt, 4% hasonló, 76%-kal rosszabb
» A legjobb delta értéke 4%, az átlag 24%, a legrosszabb 134% volt
Asus FX503VM-EH73 hangelemzés
(-) | nem túl hangos hangszórók (68.2 dB)
Basszus 100 - 315 Hz
(±) | csökkentett basszus – átlagosan 11.5%-kal alacsonyabb, mint a medián
(±) | a basszus linearitása átlagos (14.8% delta az előző frekvenciához)
Közepes 400-2000 Hz
(+) | kiegyensúlyozott középpontok – csak 1.9% választja el a mediántól
(+) | a középpontok lineárisak (6.7% delta az előző frekvenciához)
Maximum 2-16 kHz
(+) | kiegyensúlyozott csúcsok – csak 4.2% választja el a mediántól
(±) | a csúcsok linearitása átlagos (7.6% delta az előző gyakorisághoz)
Összességében 100 - 16.000 Hz
(±) | az általános hang linearitása átlagos (19.4% eltérés a mediánhoz képest)
Ugyanazon osztályhoz képest
» 67%Ebben az osztályban az összes tesztelt eszköz %-a jobb volt, 7% hasonló, 26%-kal rosszabb
» A legjobb delta értéke 6%, az átlag 18%, a legrosszabb 132% volt
Az összes tesztelt eszközzel összehasonlítva
» 48% az összes tesztelt eszköz jobb volt, 7% hasonló, 45%-kal rosszabb
» A legjobb delta értéke 4%, az átlag 24%, a legrosszabb 134% volt
| Kikapcsolt állapot / Készenlét | |
| Üresjárat | |
| Terhelés |
|
Kulcs:
min: | |
| Dell G5 15 5587 i5-8300H, GeForce GTX 1060 Max-Q, SK hynix SC311 M.2, IPS, 1920x1080, 15.6" | Dell Inspiron 15 7000 7577 i5-7300HQ, GeForce GTX 1050 Mobile, Seagate Mobile HDD 1TB ST1000LX015-1U7172, IPS, 1920x1080, 15.6" | Dell Inspiron 15 7000 7577 i5-7300HQ, GeForce GTX 1060 Max-Q, Samsung PM961 MZVLW256HEHP, IPS, 1920x1080, 15.6" | PC Zentrum Proteus V i7-7700HQ, GeForce GTX 1060 Mobile, Samsung PM961 MZVLW256HEHP, IPS, 1920x1080, 15.6" | Asus FX503VM-EH73 i7-7700HQ, GeForce GTX 1060 Mobile, SanDisk SD8SN8U128G1002, IPS, 1920x1080, 15.6" | Acer Nitro 5 Spin NP515-51-86CX i5-8550U, GeForce GTX 1050 Mobile, Micron 1100 MTFDDAV256TBN, IPS, 1920x1080, 15.6" | Acer Predator Helios 300 PH317-52-51M6 i5-8300H, GeForce GTX 1050 Ti Mobile, Hynix HFS128G39TND, IPS, 1920x1080, 17.3" | Átlagos NVIDIA GeForce GTX 1060 Max-Q | Az osztály átlaga Gaming | |
|---|---|---|---|---|---|---|---|---|---|
| Power Consumption | 3% | 8% | -181% | -50% | 20% | -10% | -40% | -111% | |
| Idle Minimum * (Watt) | 4.9 | 5.3 -8% | 7.1 -45% | 28 -471% | 12.8 -161% | 4.1 16% | 6 -22% | 9.14 ? -87% | 13.2 ? -169% |
| Idle Average * (Watt) | 8.5 | 8.8 -4% | 7.6 11% | 32 -276% | 15.4 -81% | 7.4 13% | 9 -6% | 13.2 ? -55% | 18.9 ? -122% |
| Idle Maximum * (Watt) | 9.1 | 9.7 -7% | 8.6 5% | 38 -318% | 15.9 -75% | 8.6 5% | 13 -43% | 15.1 ? -66% | 24.3 ? -167% |
| Load Average * (Watt) | 90.7 | 100 -10% | 59.5 34% | 91 -0% | 78 14% | 66 27% | 95 -5% | 88.3 ? 3% | 108 ? -19% |
| Witcher 3 ultra * (Watt) | 110 | 87 21% | 89 19% | 124 -13% | 107.3 2% | 102 7% | |||
| Load Maximum * (Watt) | 144 | 109 24% | 112.8 22% | 152 -6% | 143.4 -0% | 87 40% | 134 7% | 134.9 ? 6% | 254 ? -76% |
* ... a kisebb jobb
| Dell G5 15 5587 i5-8300H, GeForce GTX 1060 Max-Q, 56 Wh | Dell Inspiron 15 7000 7577 i5-7300HQ, GeForce GTX 1050 Mobile, 56 Wh | Dell Inspiron 15 7000 7577 i5-7300HQ, GeForce GTX 1060 Max-Q, 56 Wh | PC Zentrum Proteus V i7-7700HQ, GeForce GTX 1060 Mobile, Wh | Asus FX503VM-EH73 i7-7700HQ, GeForce GTX 1060 Mobile, 64 Wh | Acer Nitro 5 Spin NP515-51-86CX i5-8550U, GeForce GTX 1050 Mobile, 48 Wh | Acer Predator Helios 300 PH317-52-51M6 i5-8300H, GeForce GTX 1050 Ti Mobile, 48 Wh | Az osztály átlaga Gaming | |
|---|---|---|---|---|---|---|---|---|
| Akkumulátor üzemidő | -6% | -9% | -47% | -44% | 2% | -11% | 1% | |
| Reader / Idle (h) | 11.8 | 11.1 -6% | 11 -7% | 3.7 -69% | 5.7 -52% | 12.5 6% | 11.8 0% | 8.71 ? -26% |
| H.264 (h) | 5.4 | 5.2 -4% | 3.3 -39% | 6.2 15% | 8.26 ? 53% | |||
| WiFi v1.3 (h) | 6.5 | 6.8 5% | 6.9 6% | 3.3 -49% | 4.6 -29% | 6.6 2% | 5.9 -9% | 7.02 ? 8% |
| Load (h) | 2.2 | 1.8 -18% | 1.6 -27% | 1.5 -32% | 1.1 -50% | 1.9 -14% | 1.7 -23% | 1.47 ? -33% |
Pro
Kontra
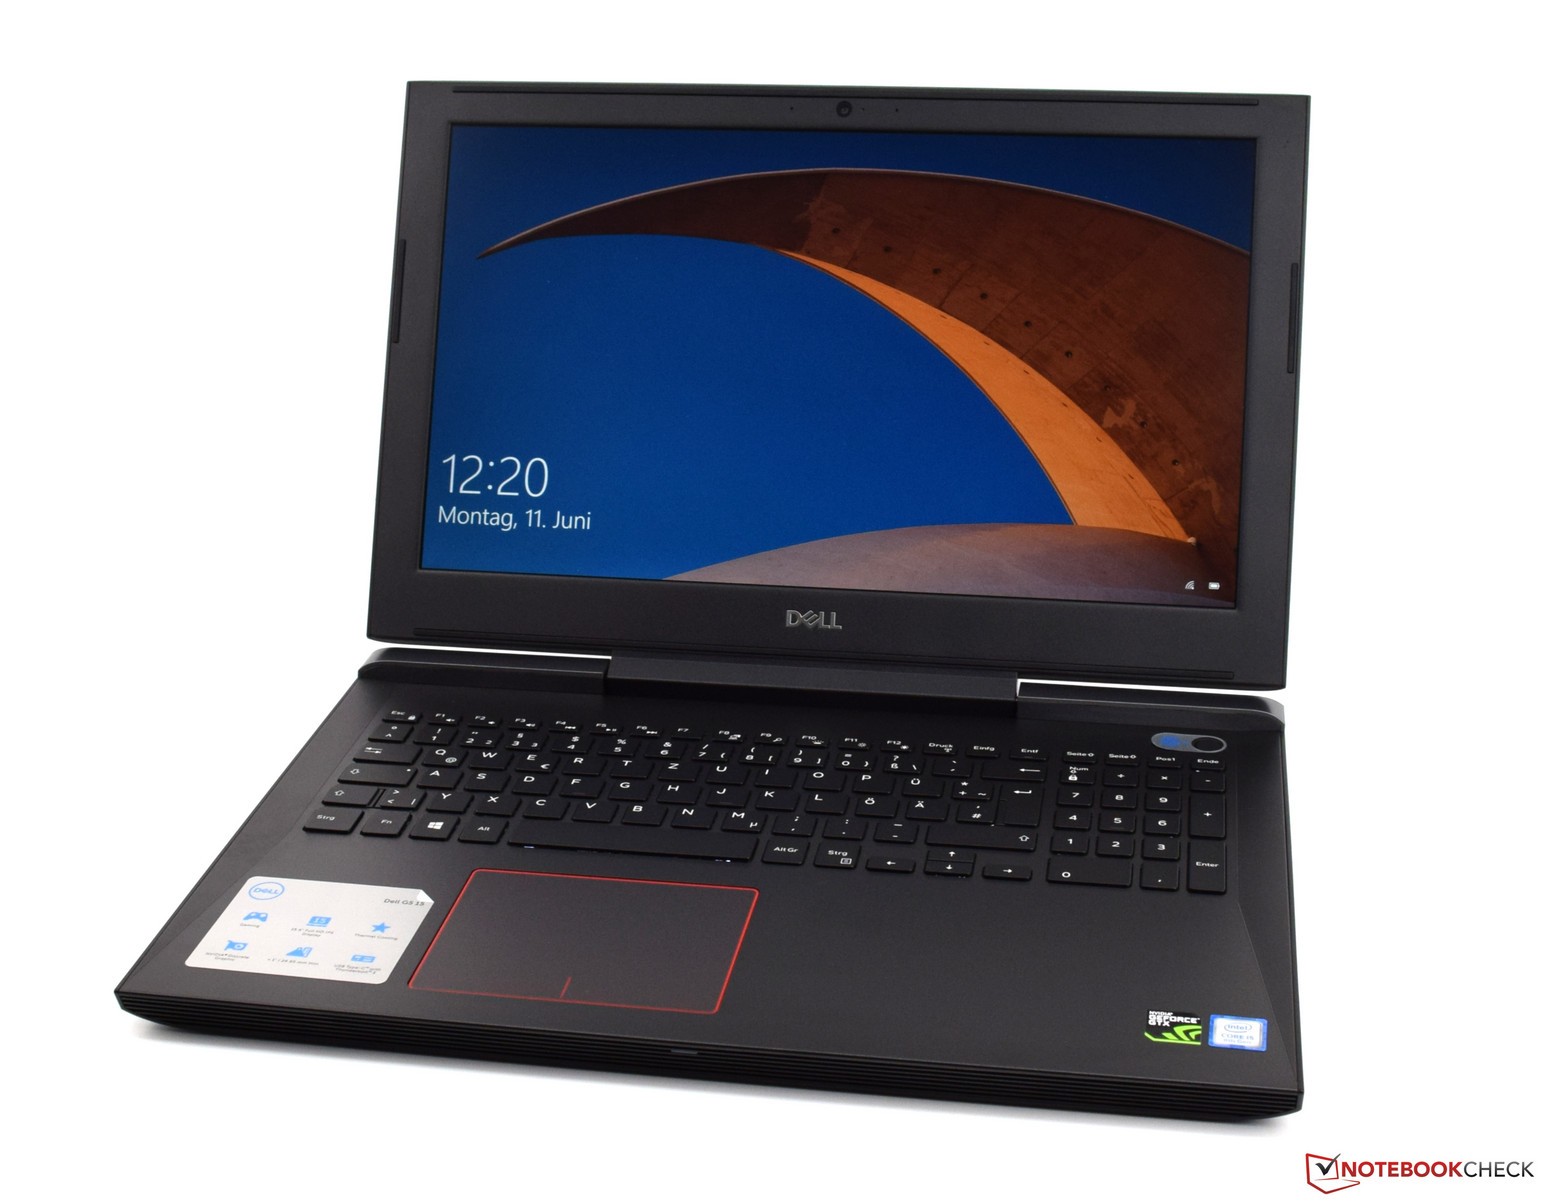
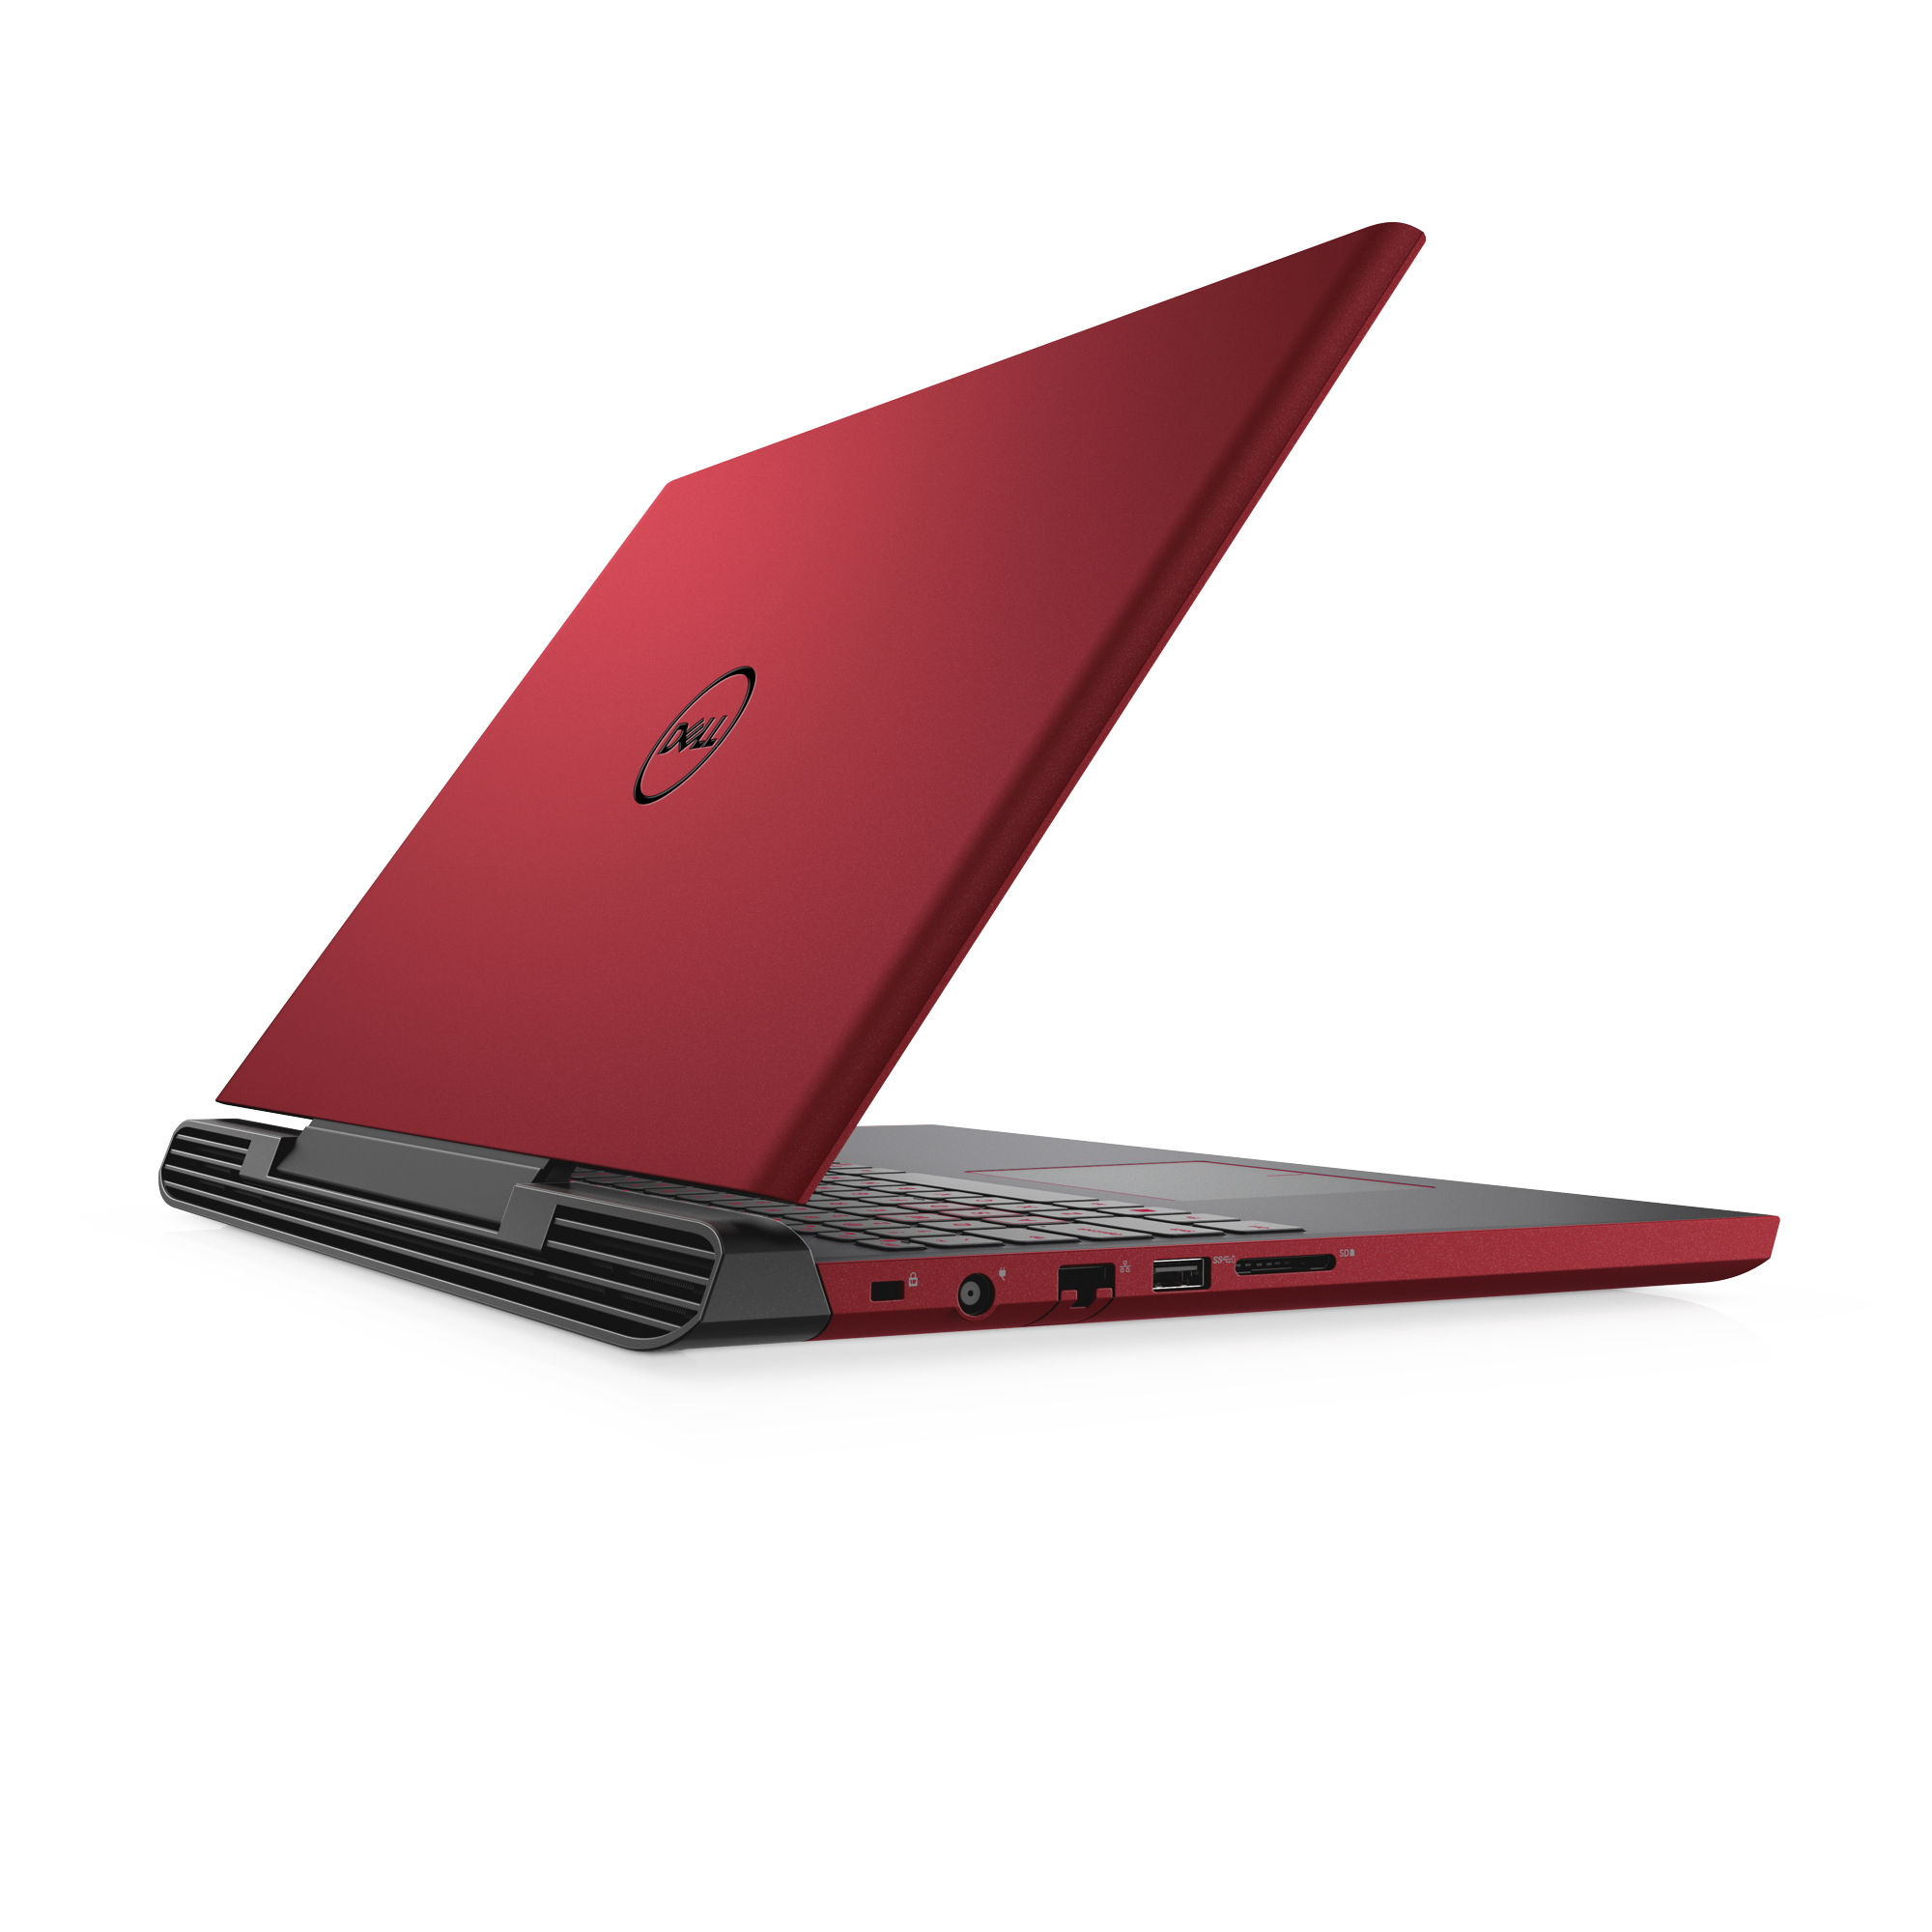
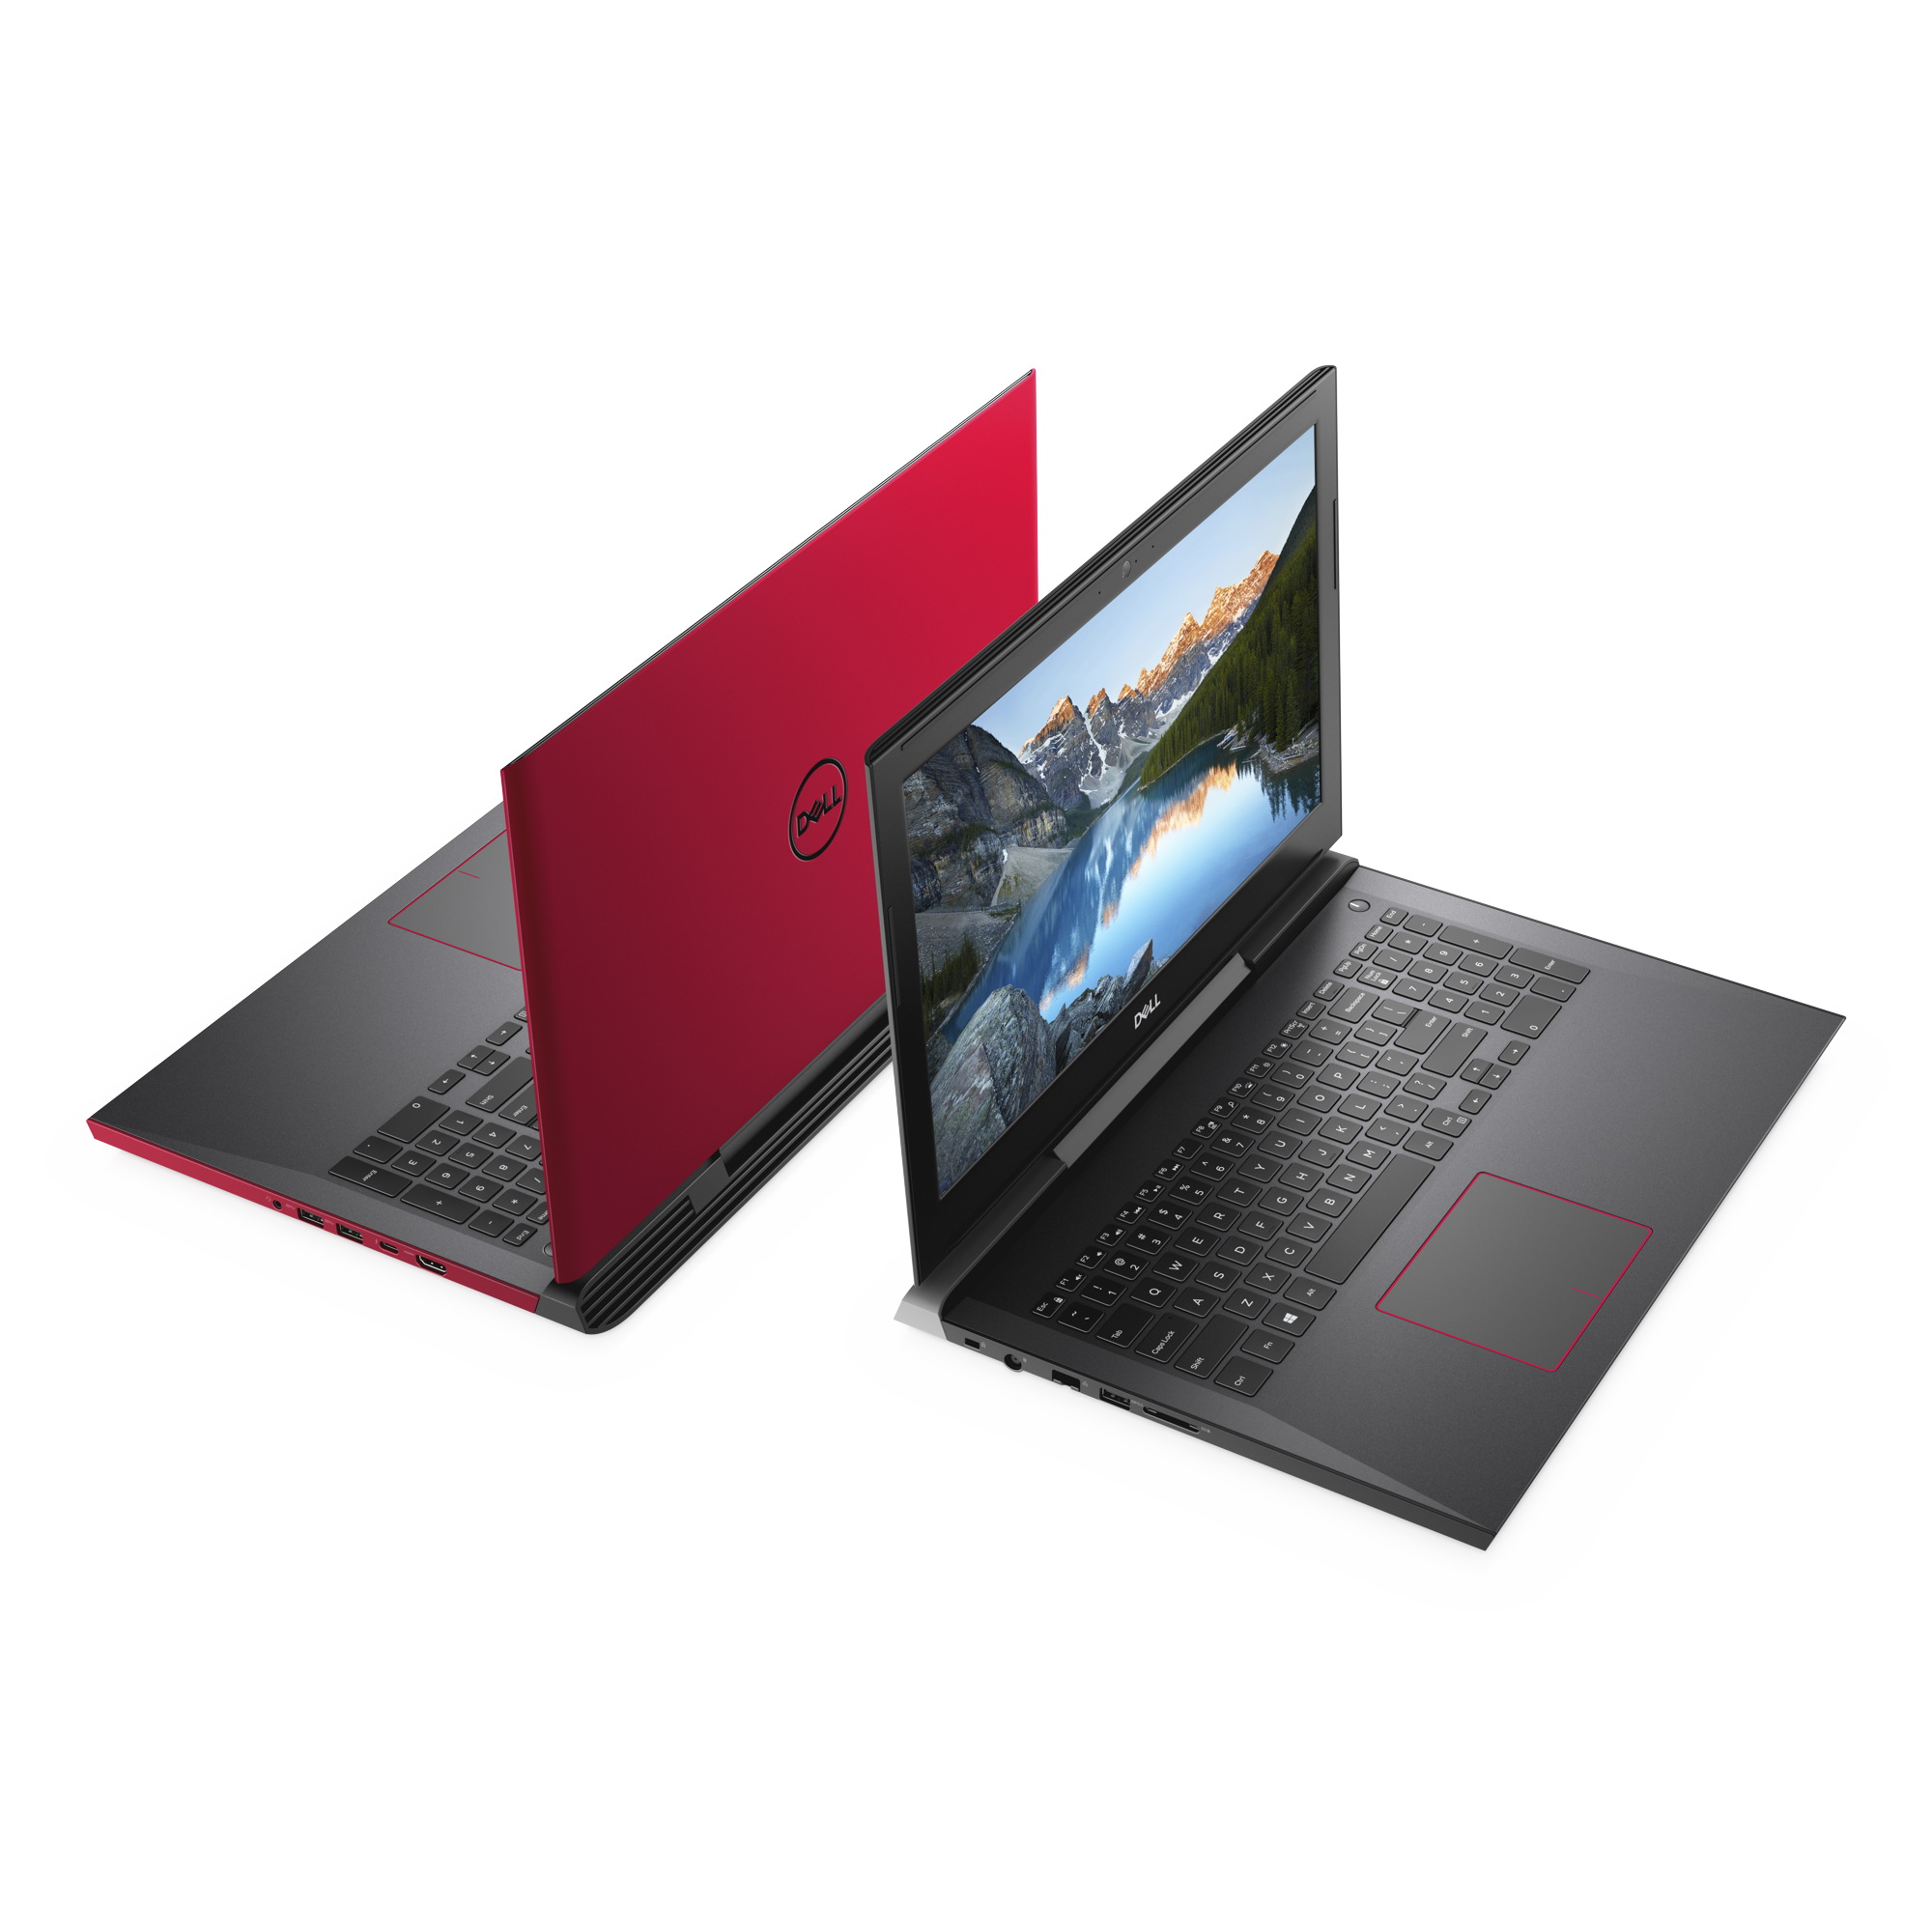
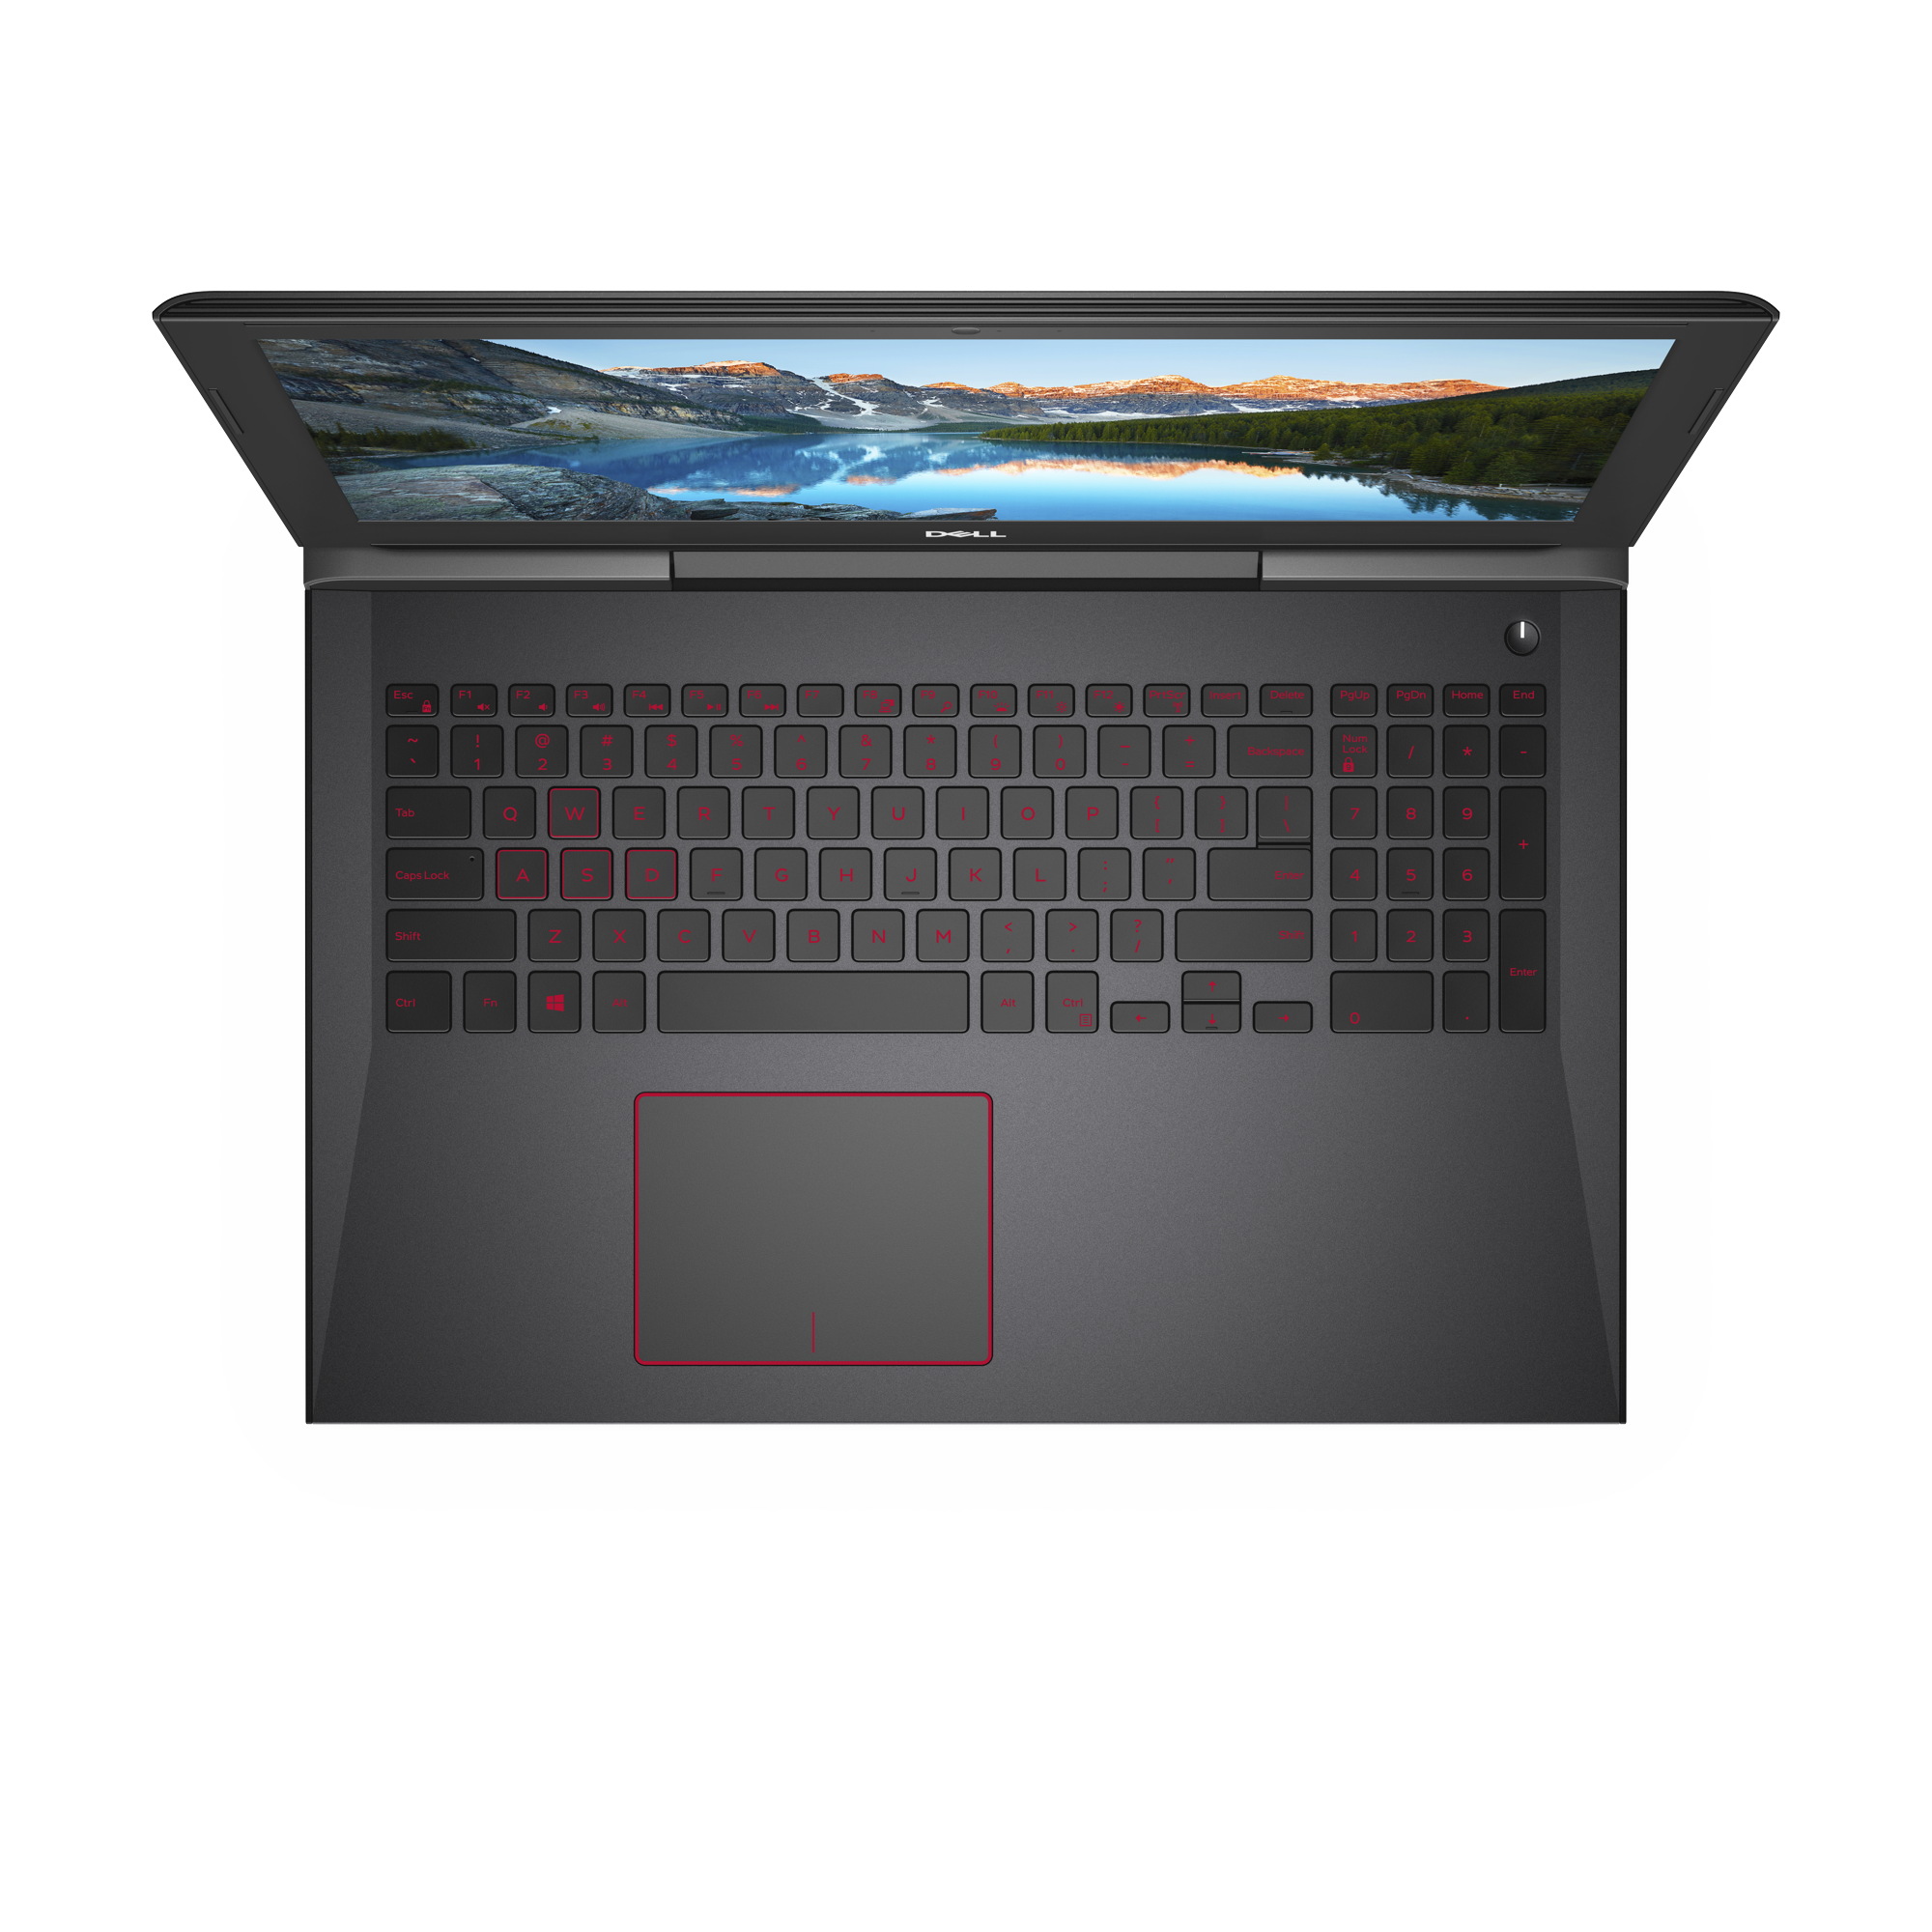
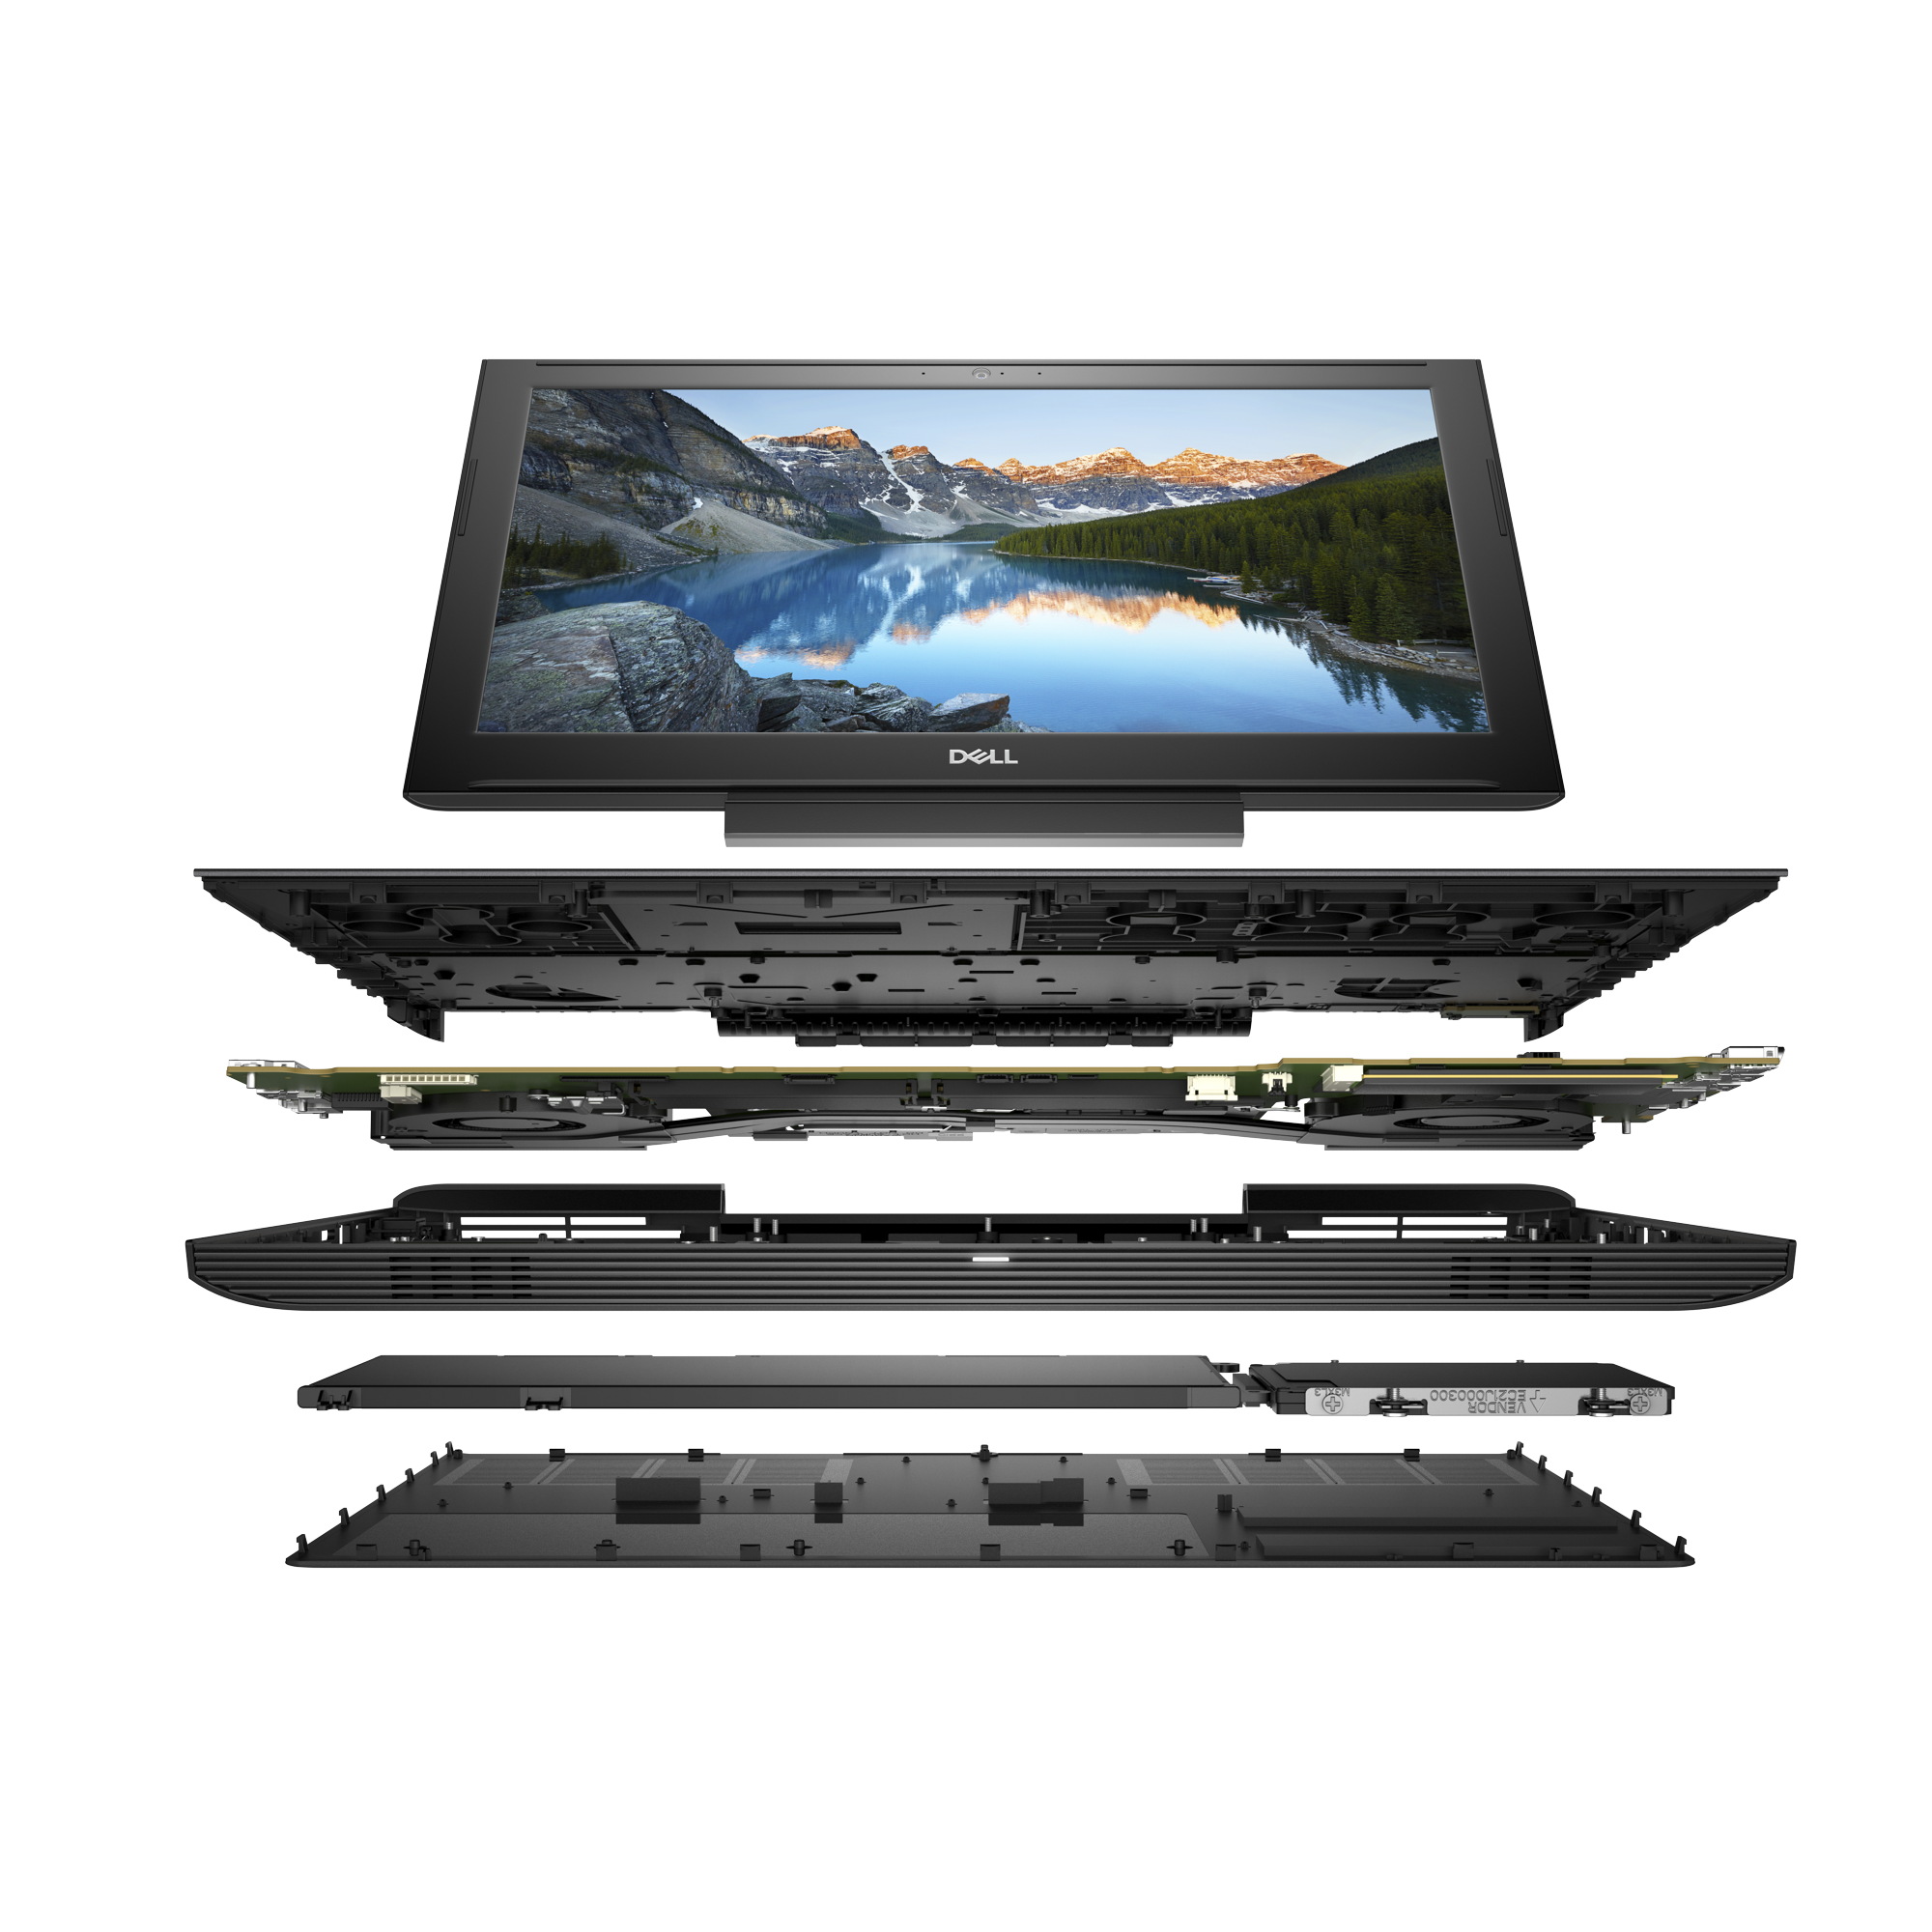
A Dell G5 15 5587 továbbra is jó gamer notebook, amely legfőképpen vonzó árával csalogatja magához a vásárlókat. A nagyon robusztus ház, középen elhelyezett zsanérjaival meggyőző mértékben stabilizálja és tartja a fedelet. A vadonatúj CPU-nak köszönhetően a készülék kicsivel gyorsabb elődjénél, amely még az Inspiron megjelöléssel készült. Akinek az Intel Core i5-8300H teljesítménye nem elég, az választhatja helyette az Intel Core i7-8750H-t, amely hat magjával az eddigi jó helyett kiváló többszálas teljesítményre képes. A logikus választás azonban a kisebb, i5-ös proci lenne, amely remekül bevált a tesztjeink során.
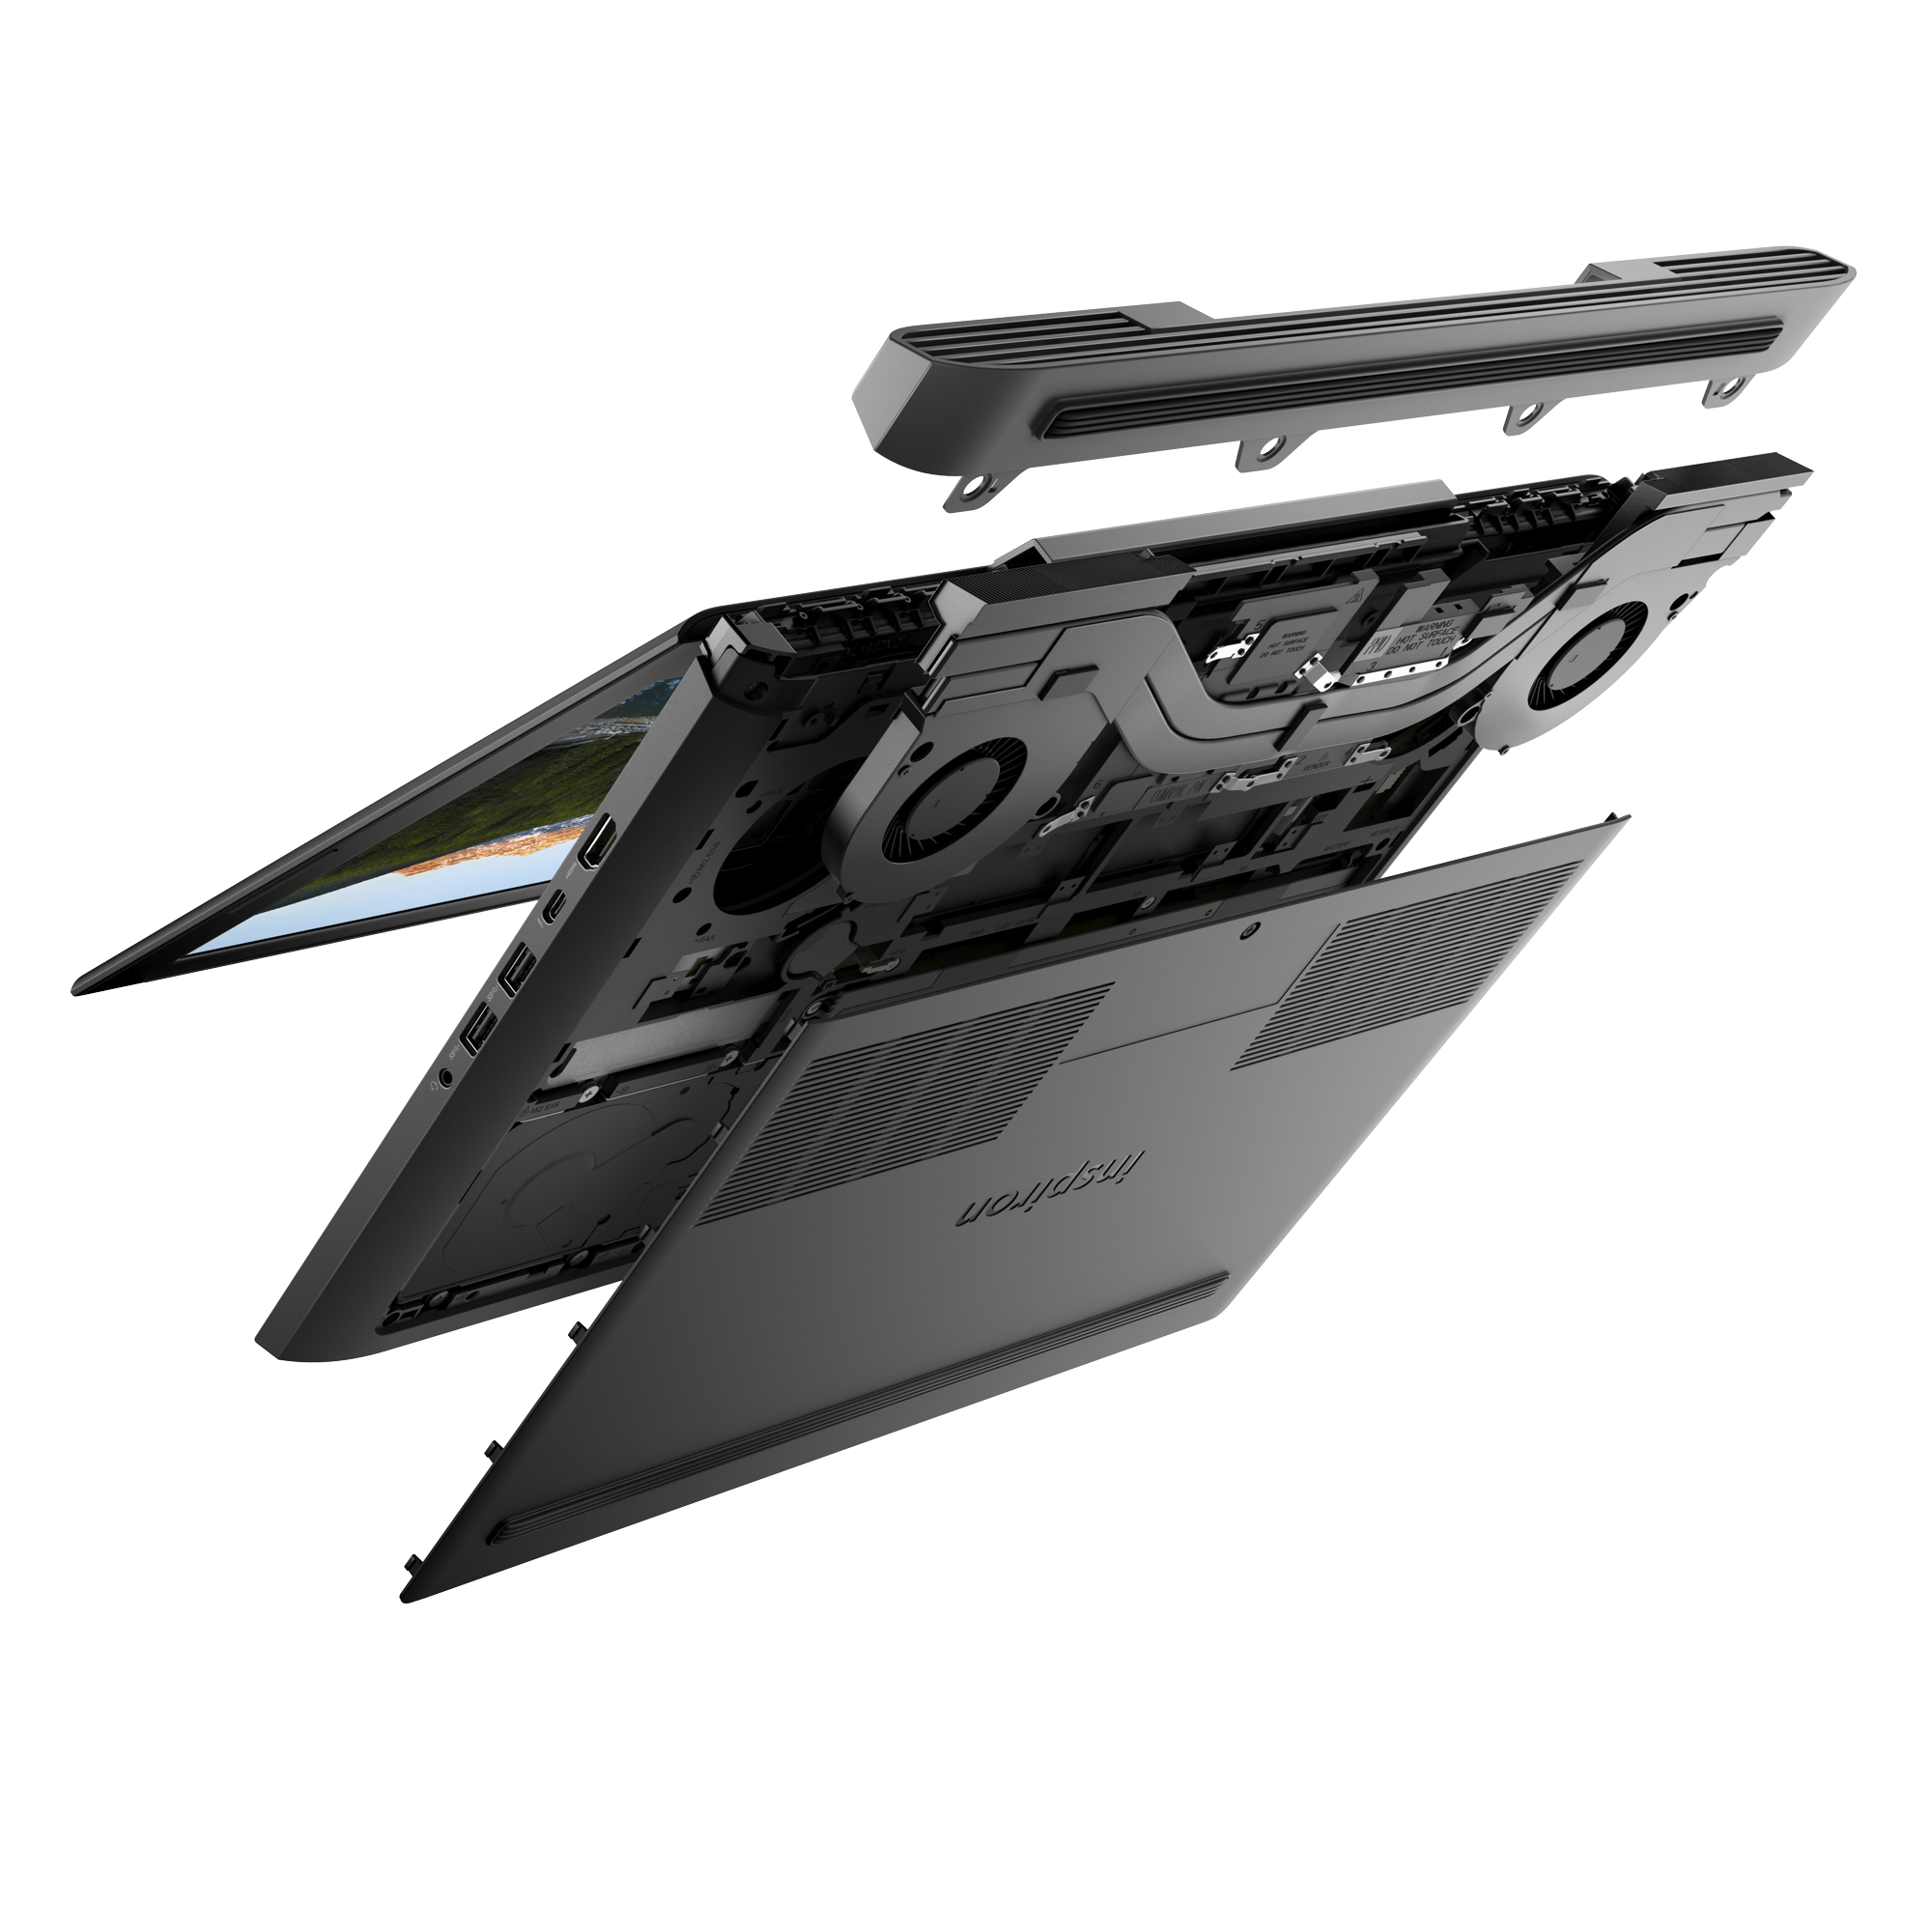
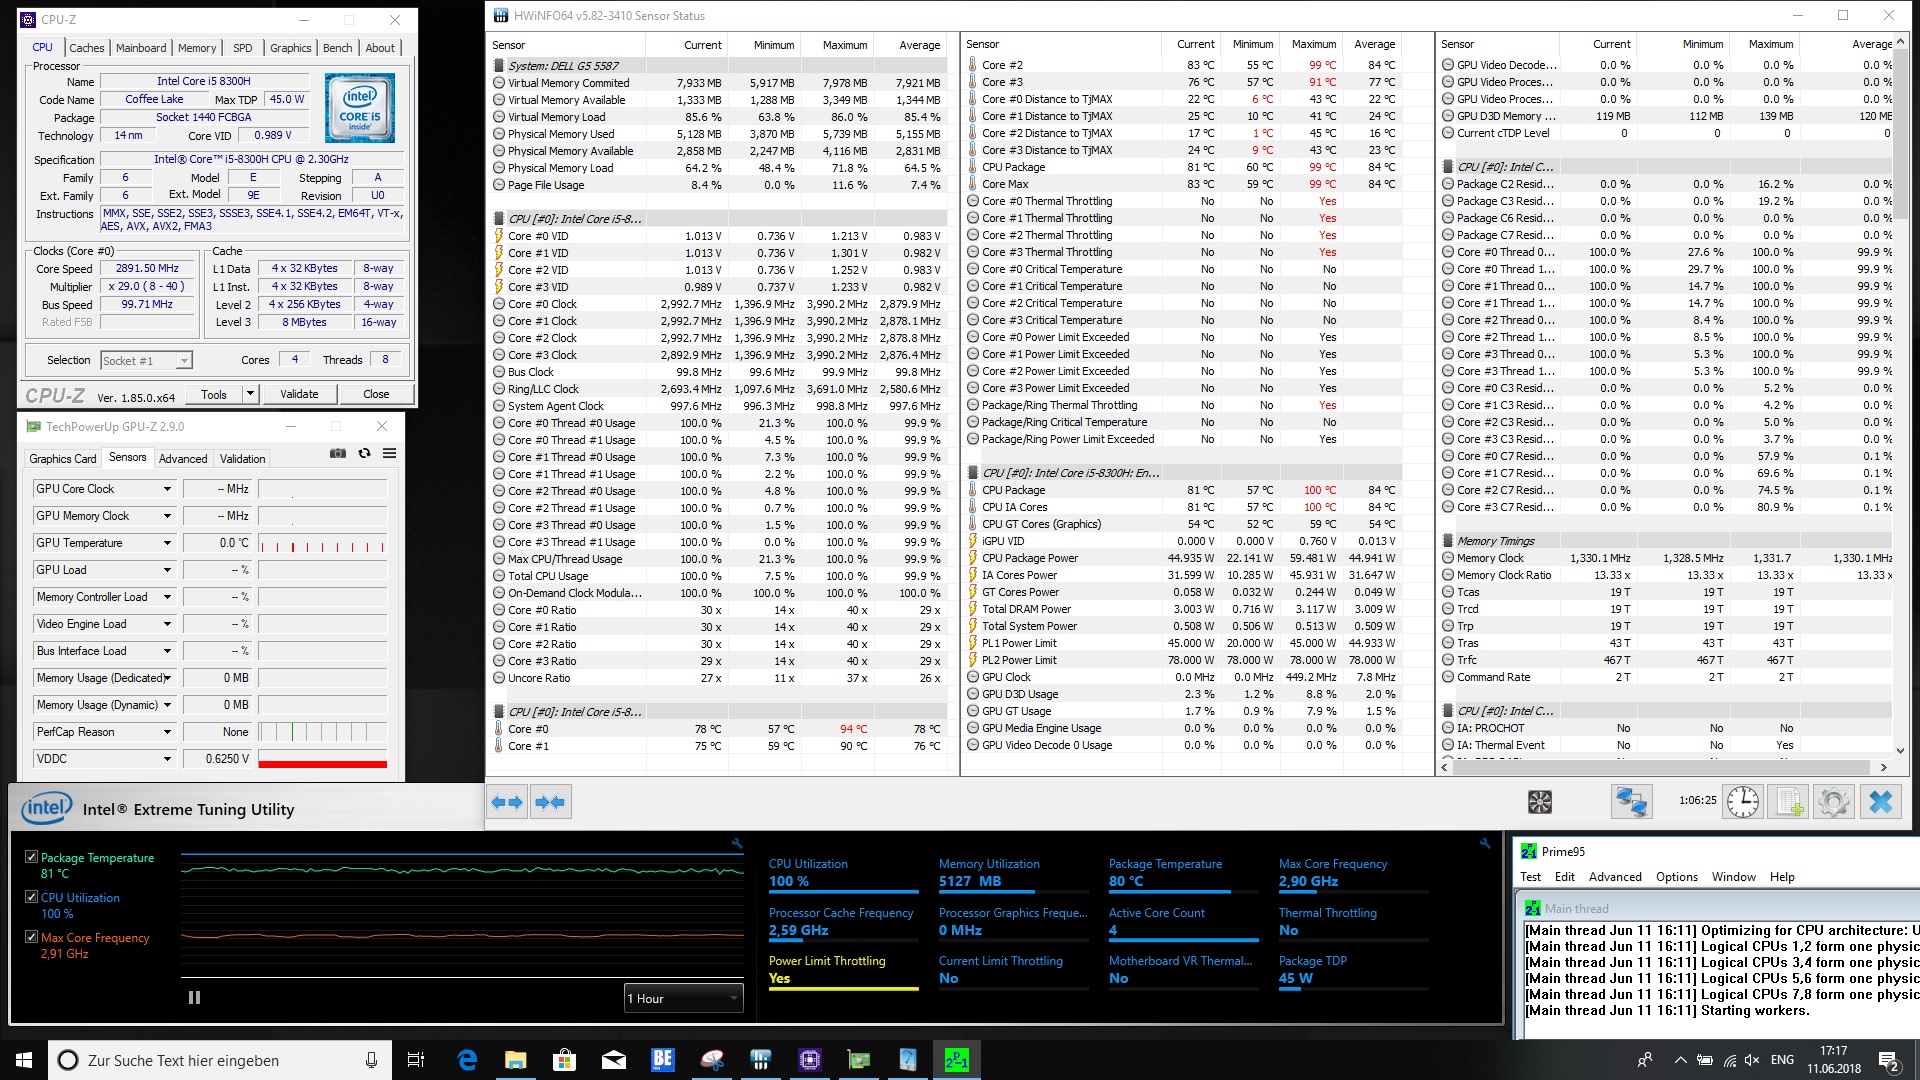
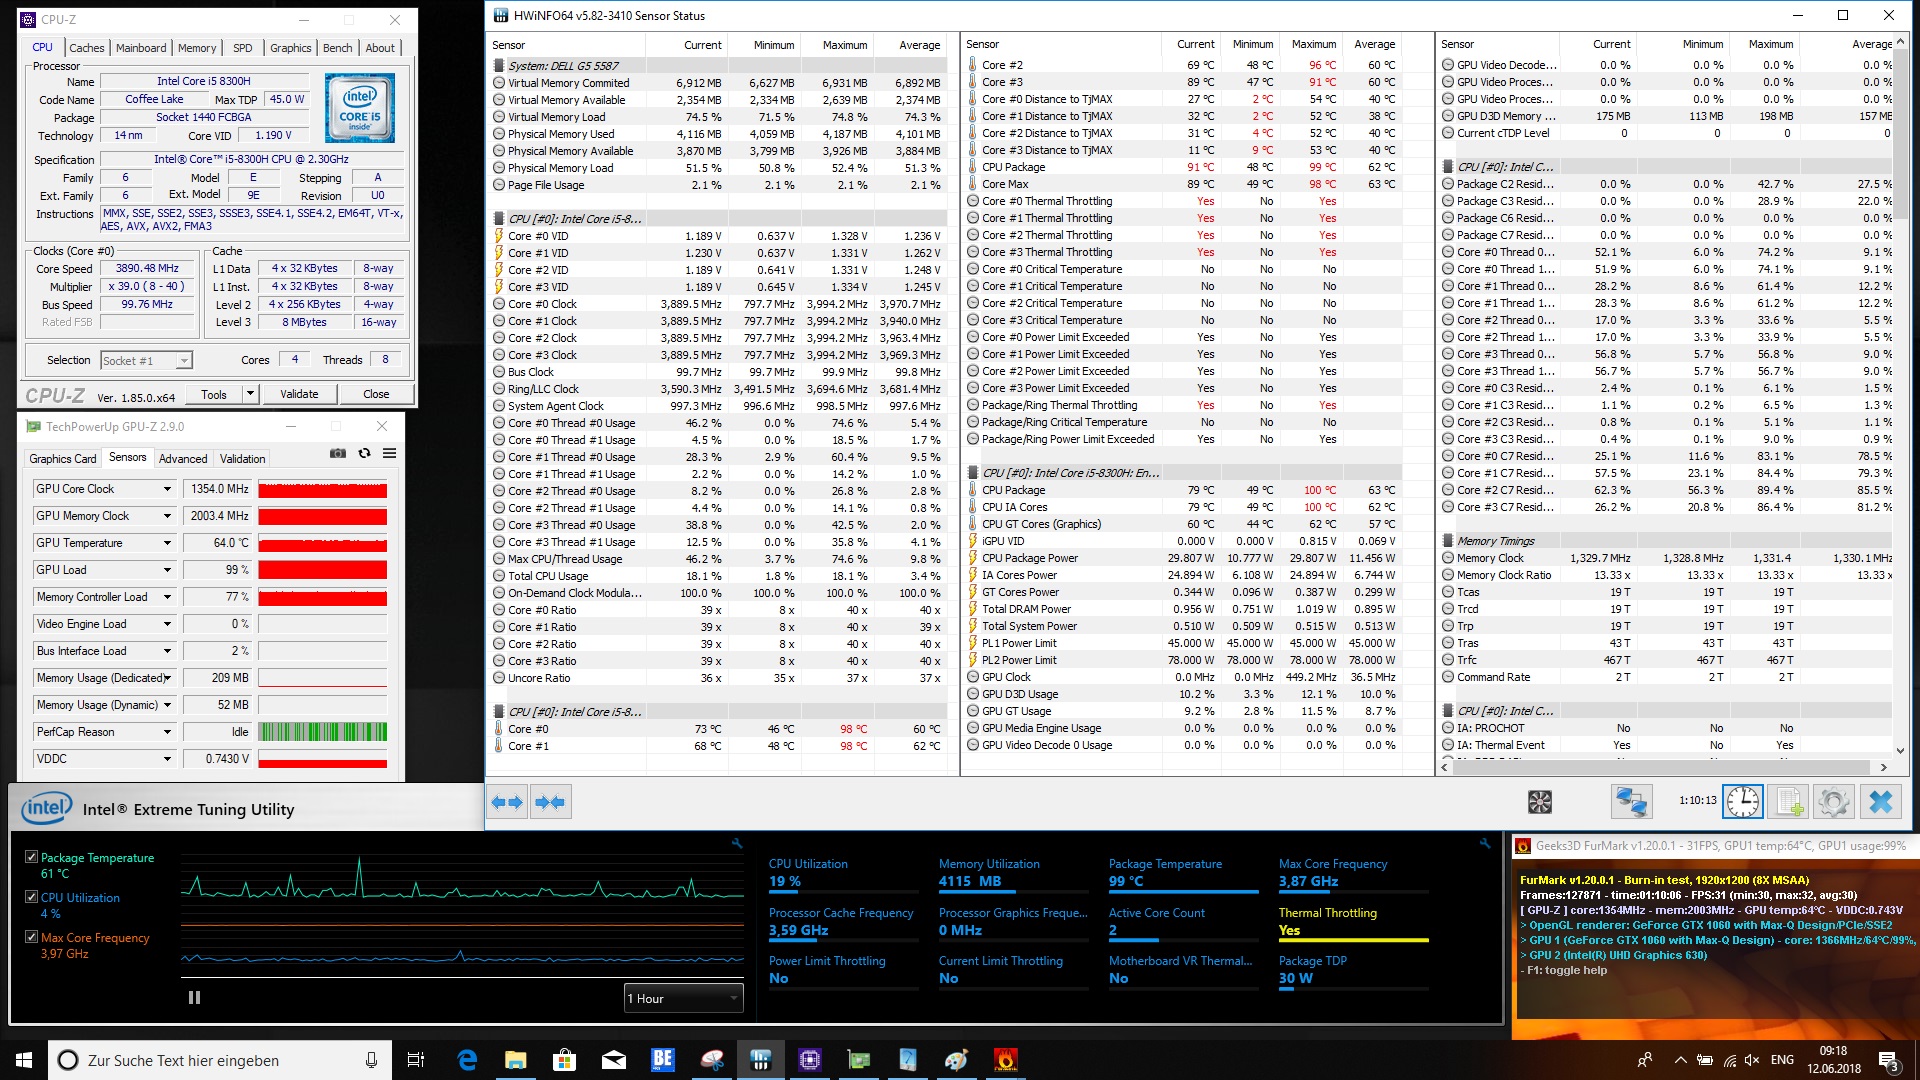
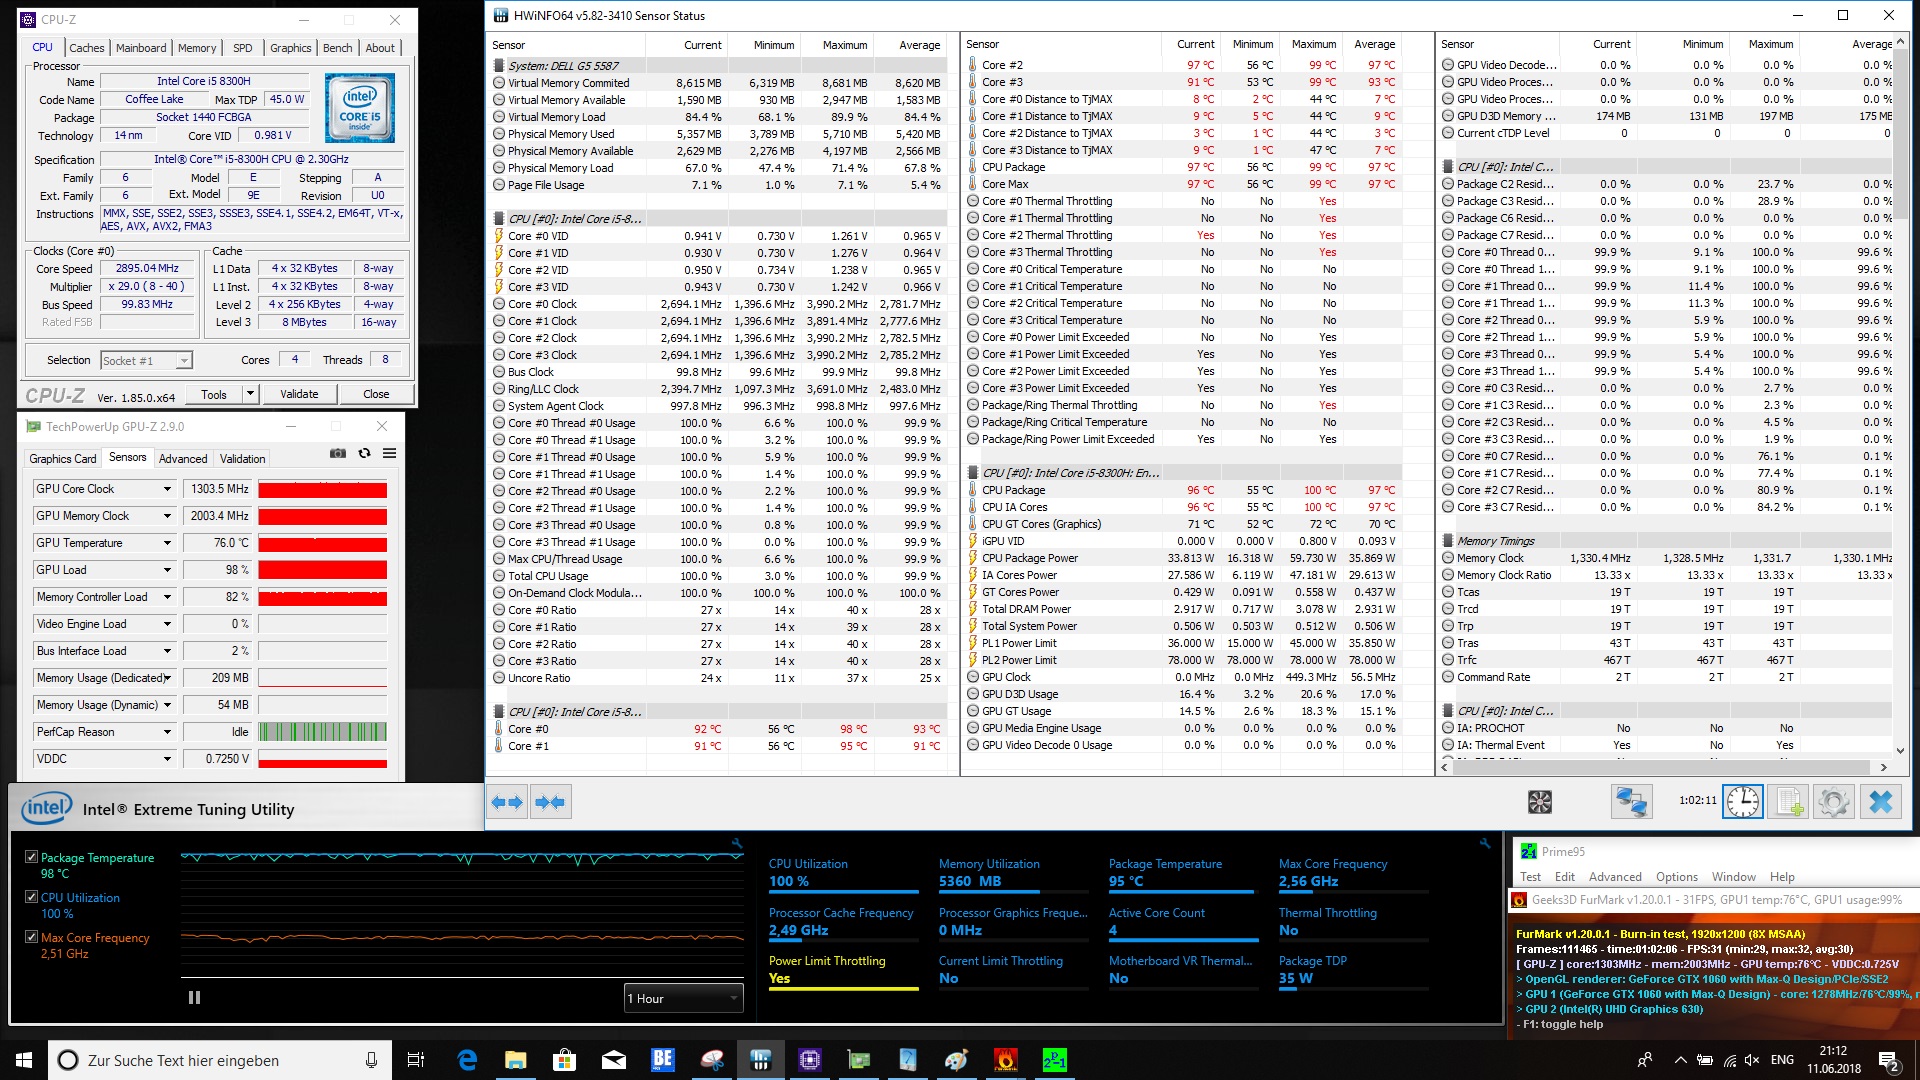
Ha a hőkibocsátást nézzük, a tesztelt konfiguráció a hűtés képességeinek a határán táncol. A CPU lefojtása azonban visszafogott, nem befolyásolta nagyon negatívan az értékelésünket.
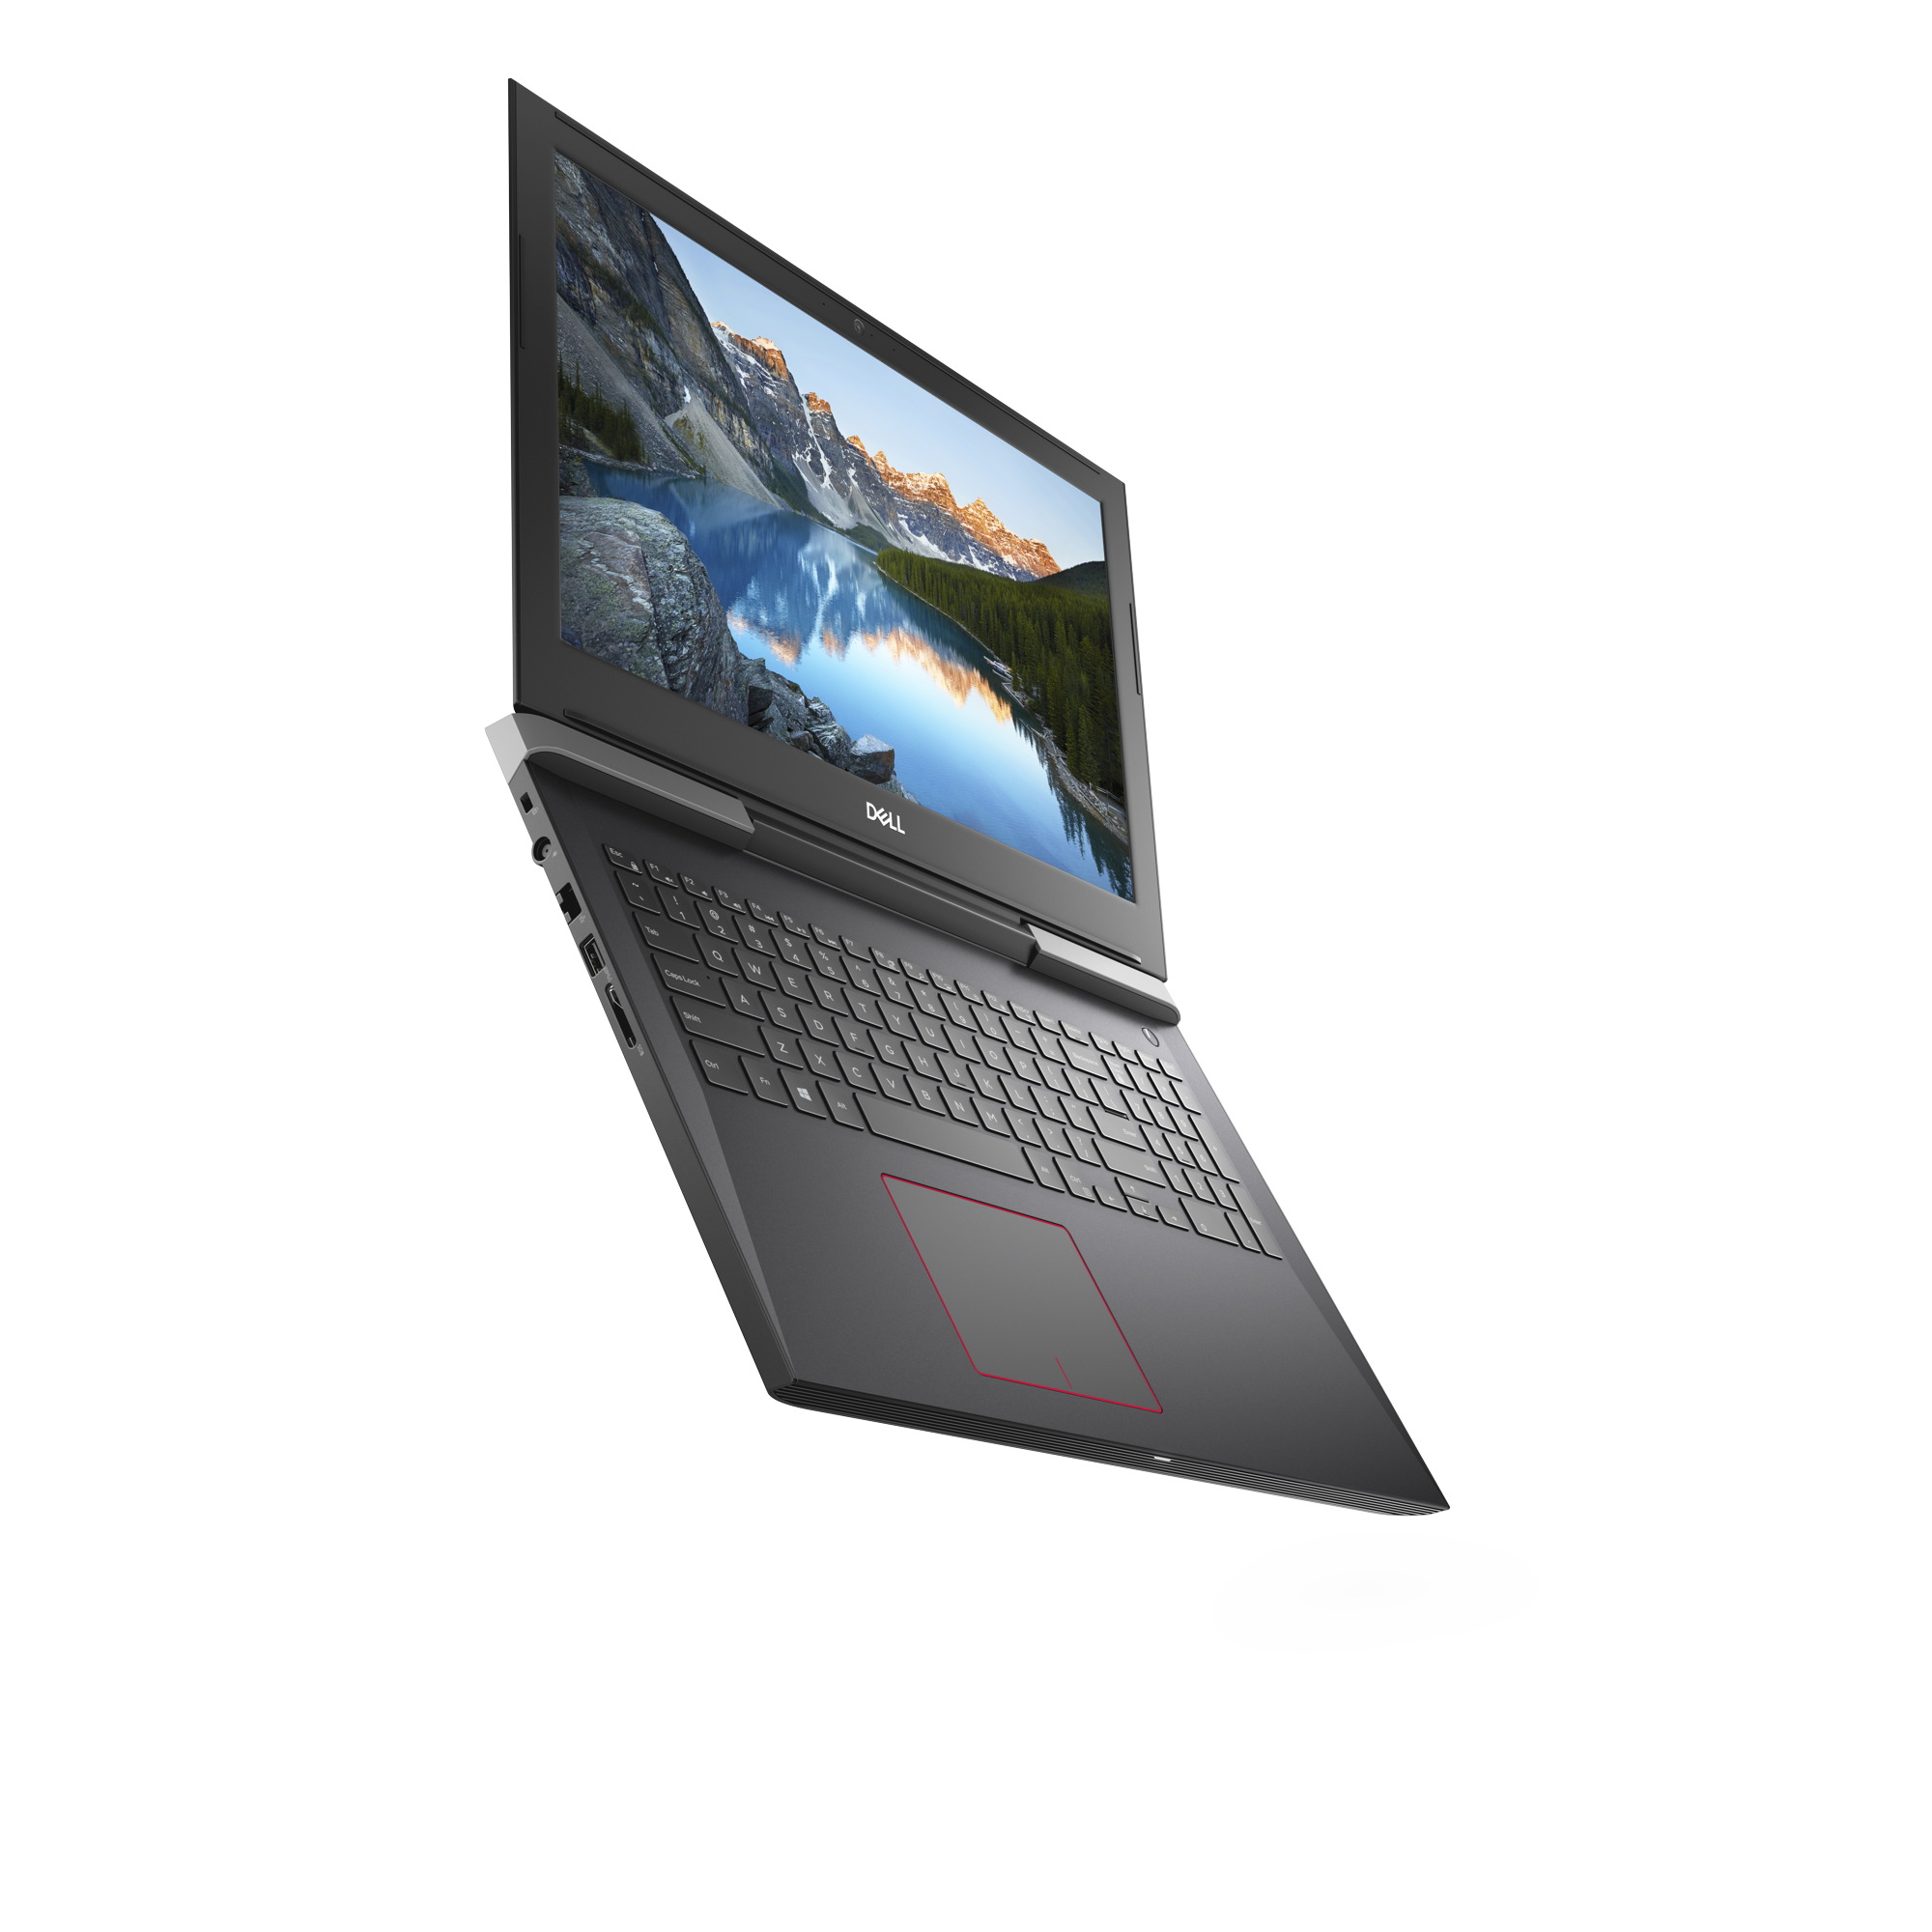
Az Nvidia GeForce GTX 1060 Max-Q a G5 15 5000-be választható legerősebb GPU. A teljesítménye jó, elegendő ahhoz, hogy az összes mai játékot natív felbontásban játszhassuk.
A Dell G5 15 5587 egy jól felszerelt gamer notebook, modern CPU-val, gyors videokártyával, és vonzó árral.
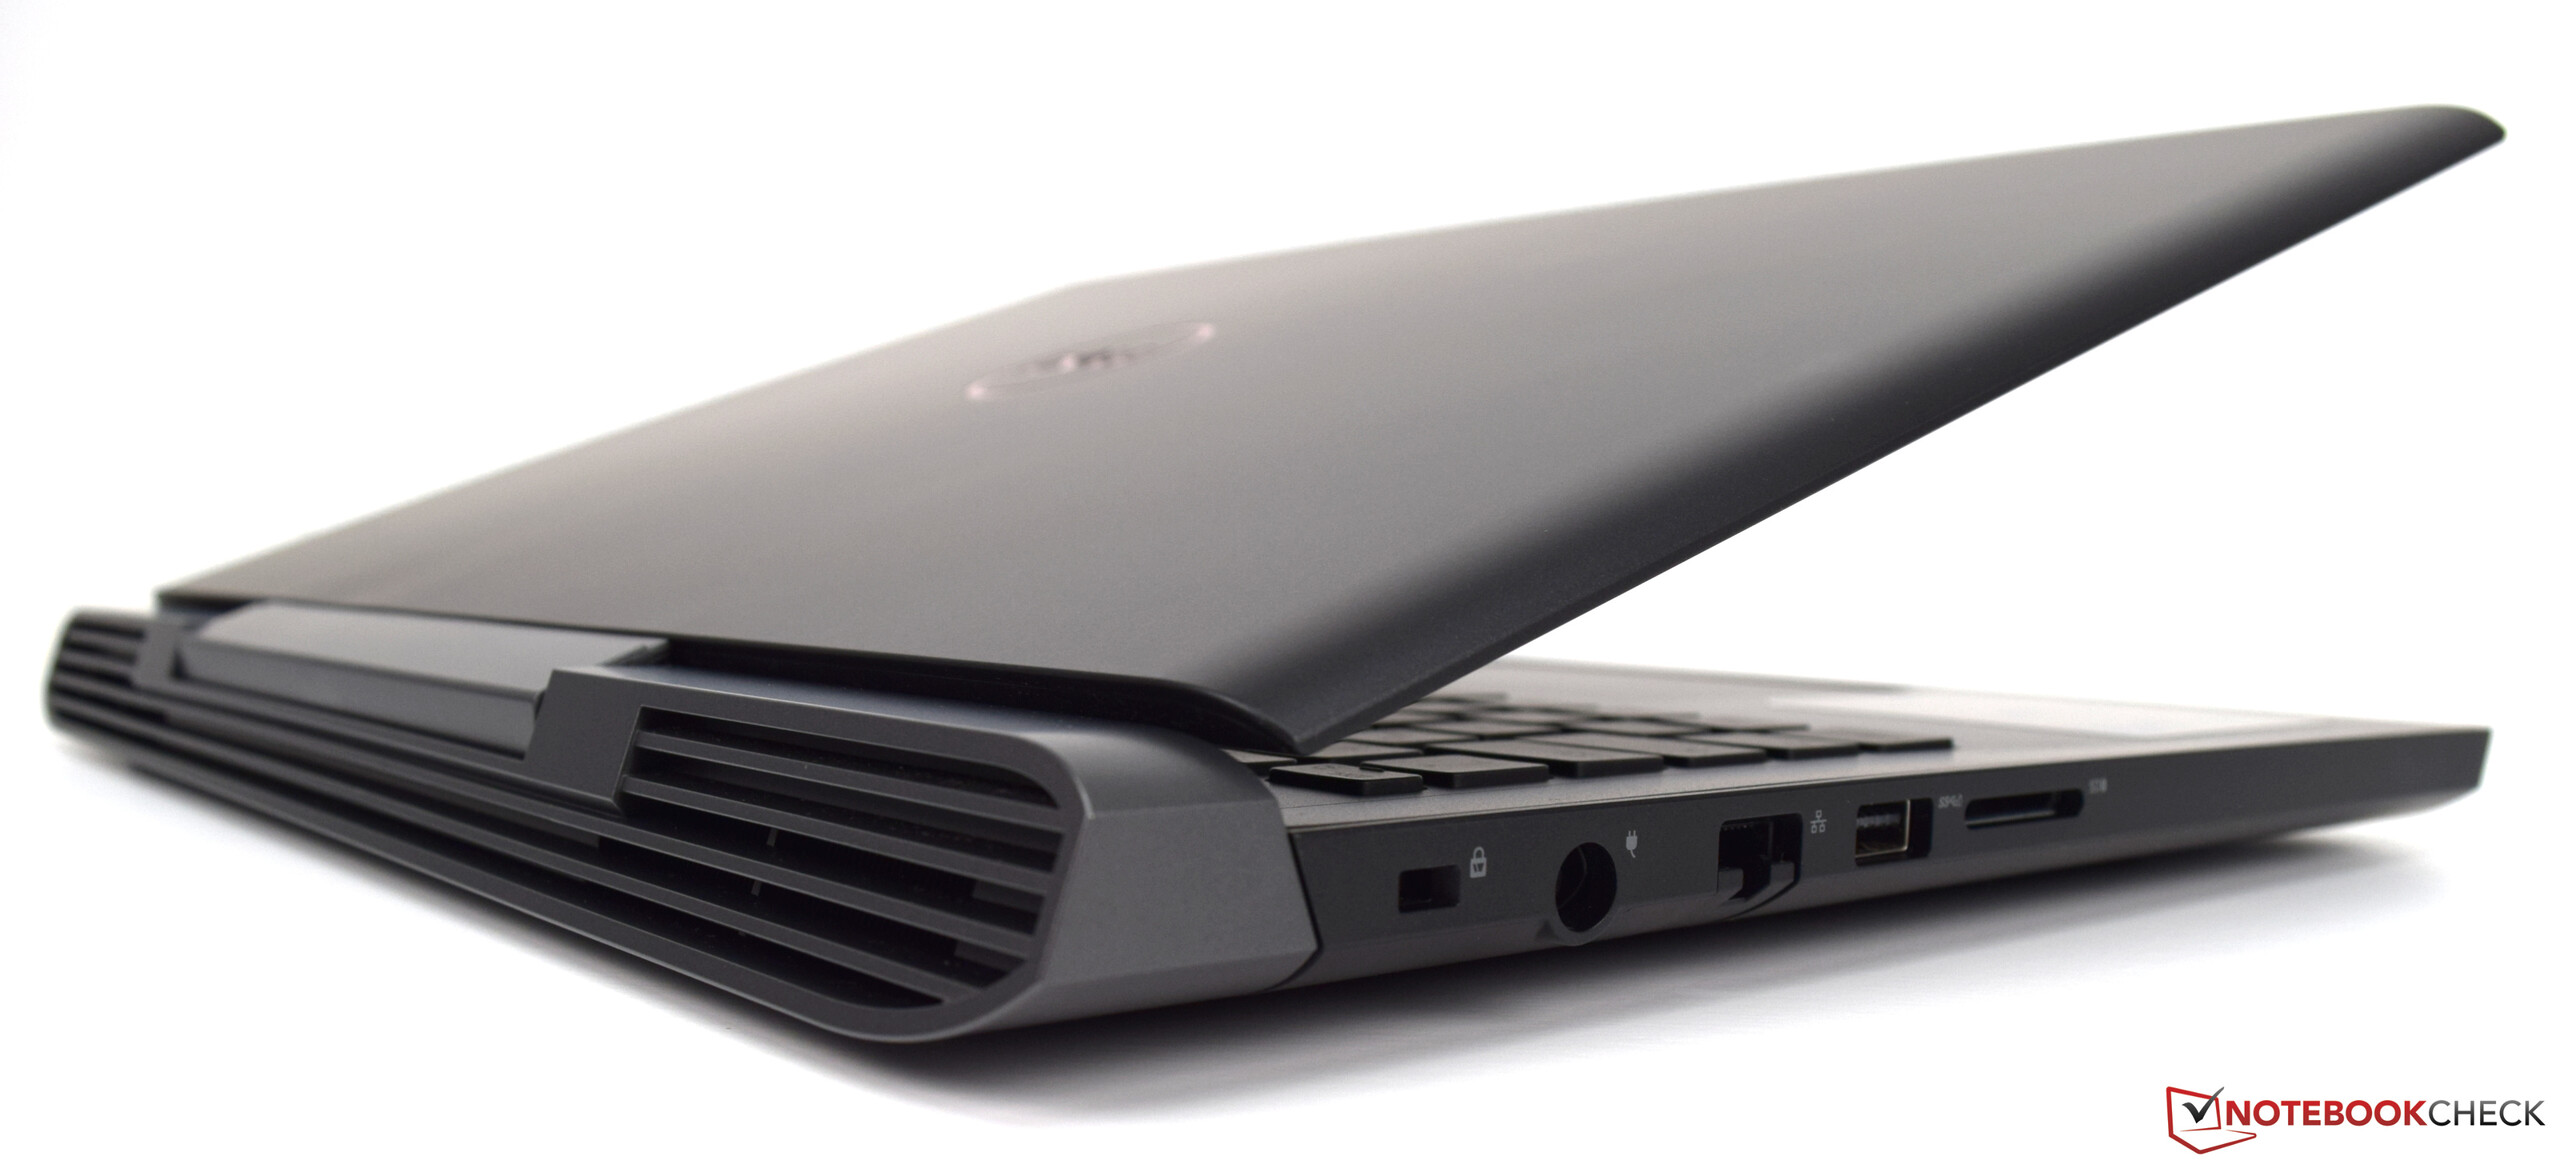
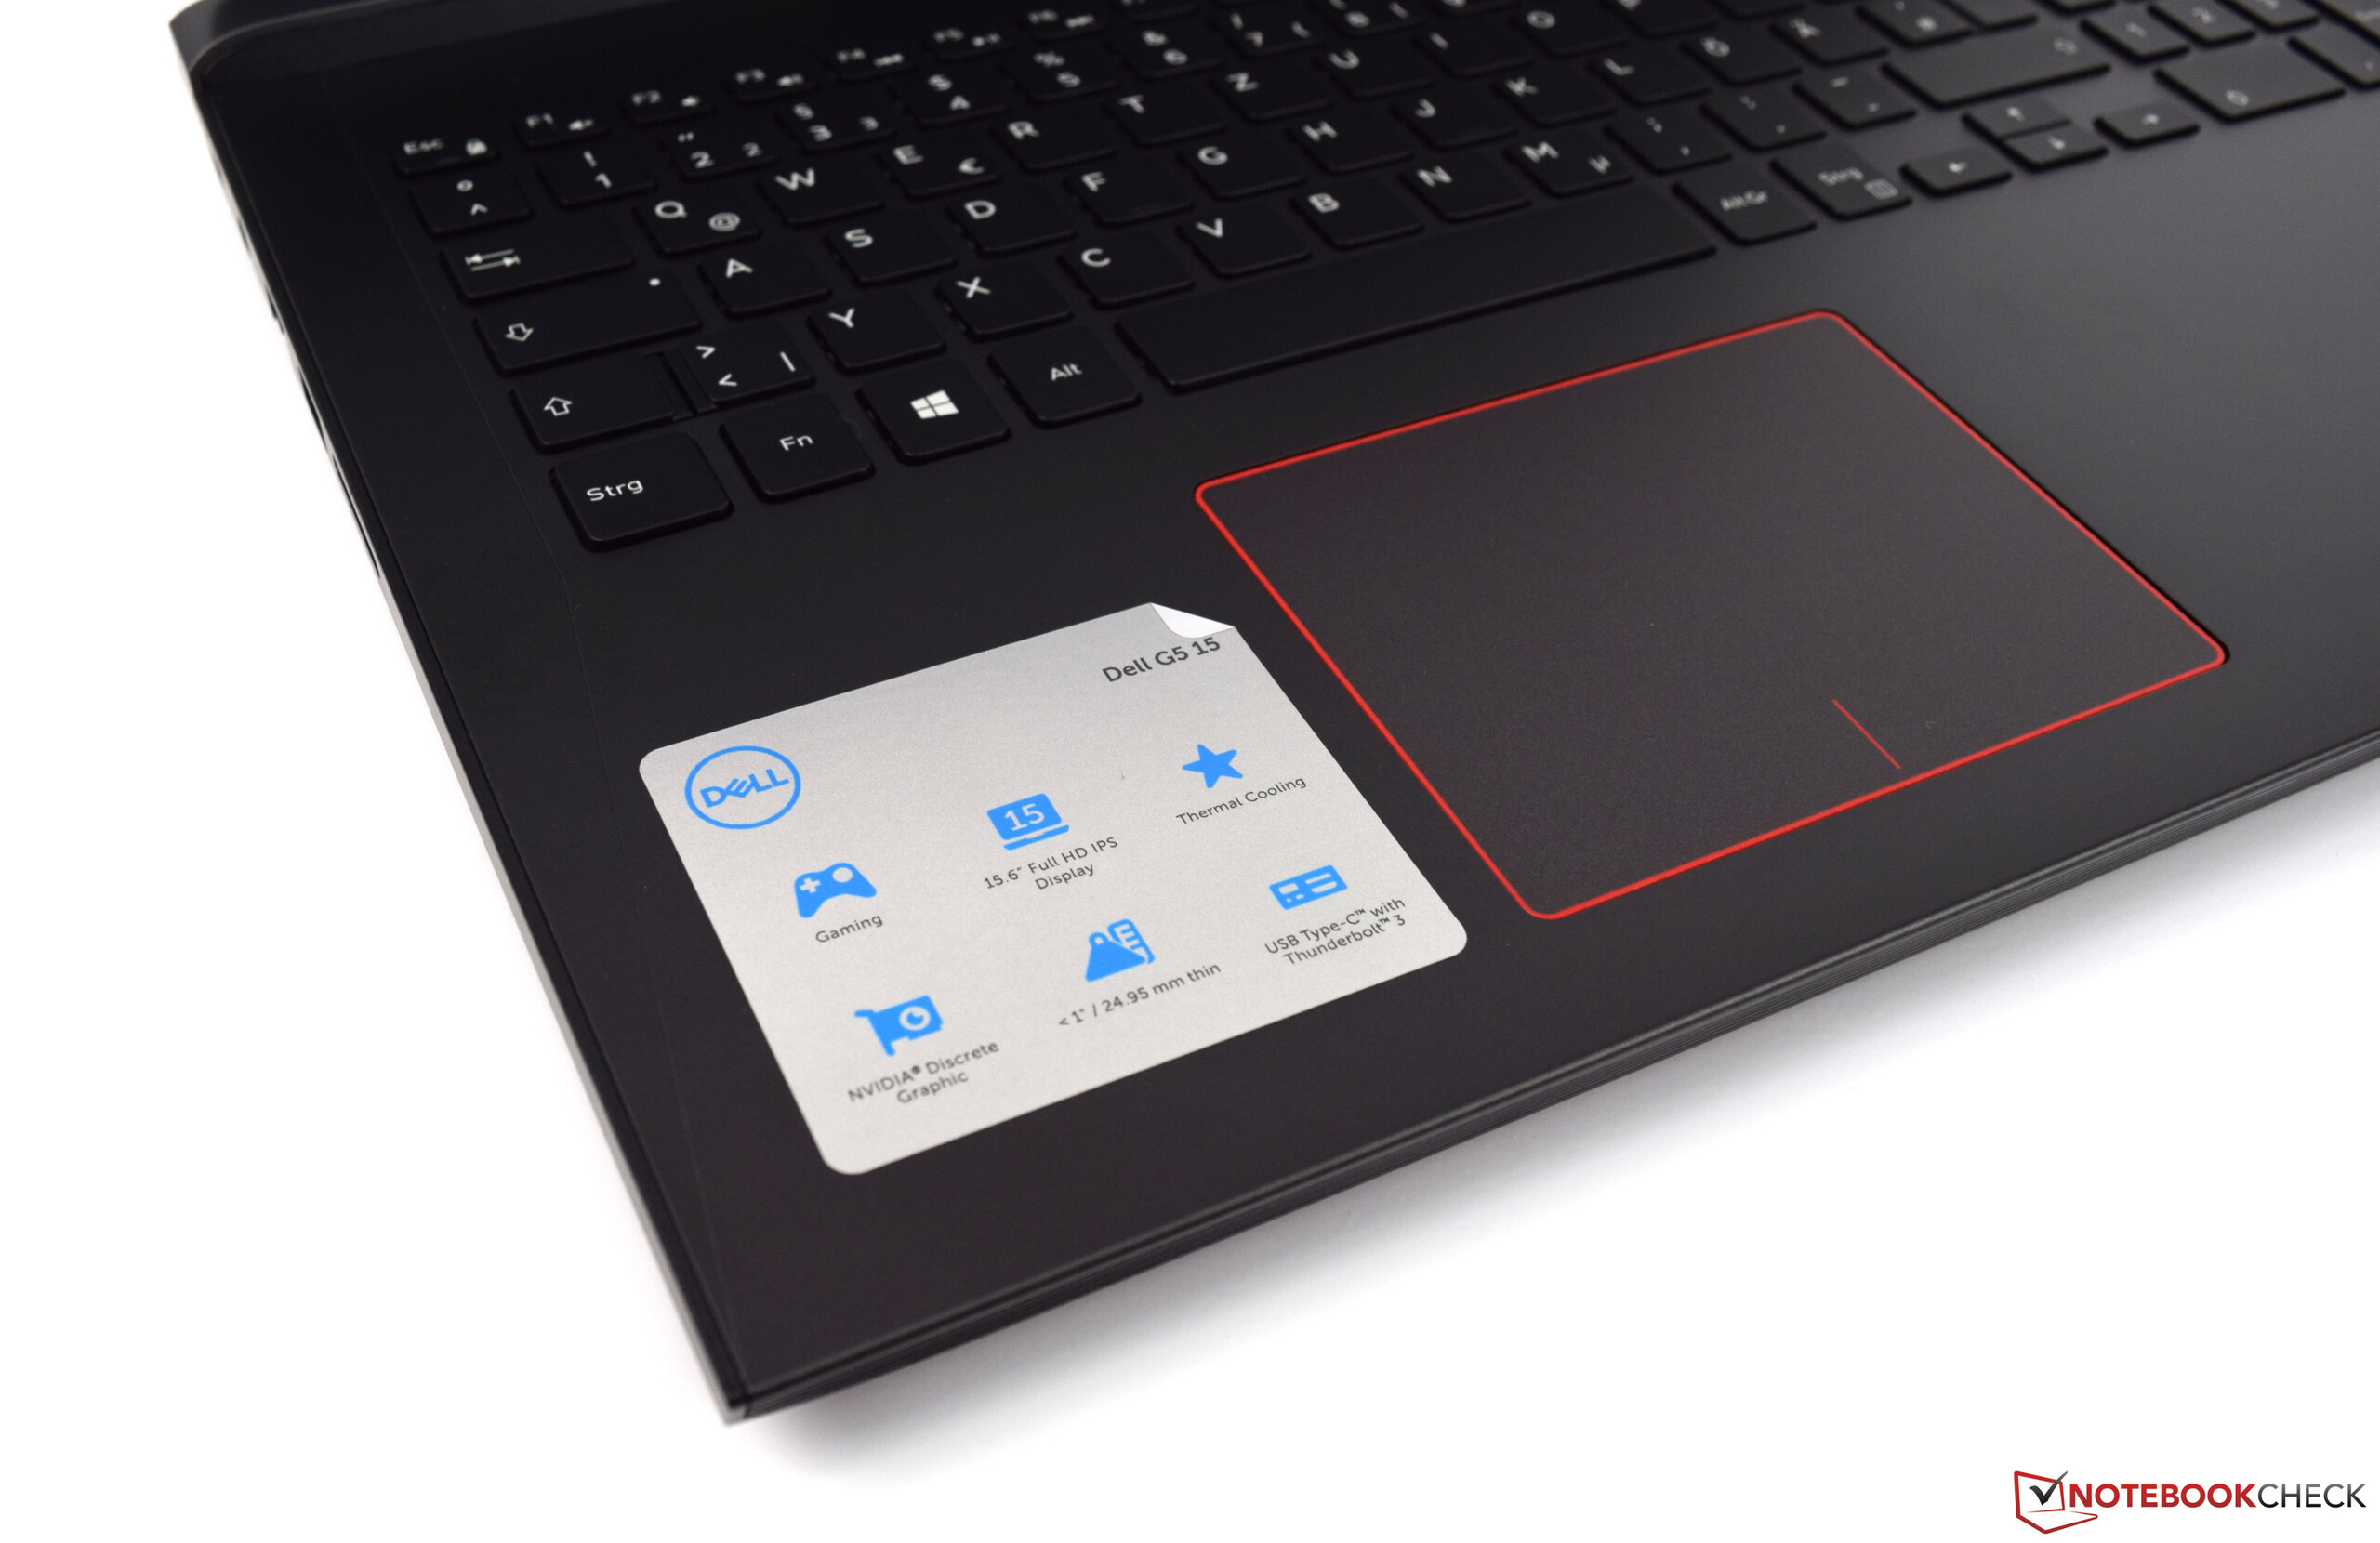
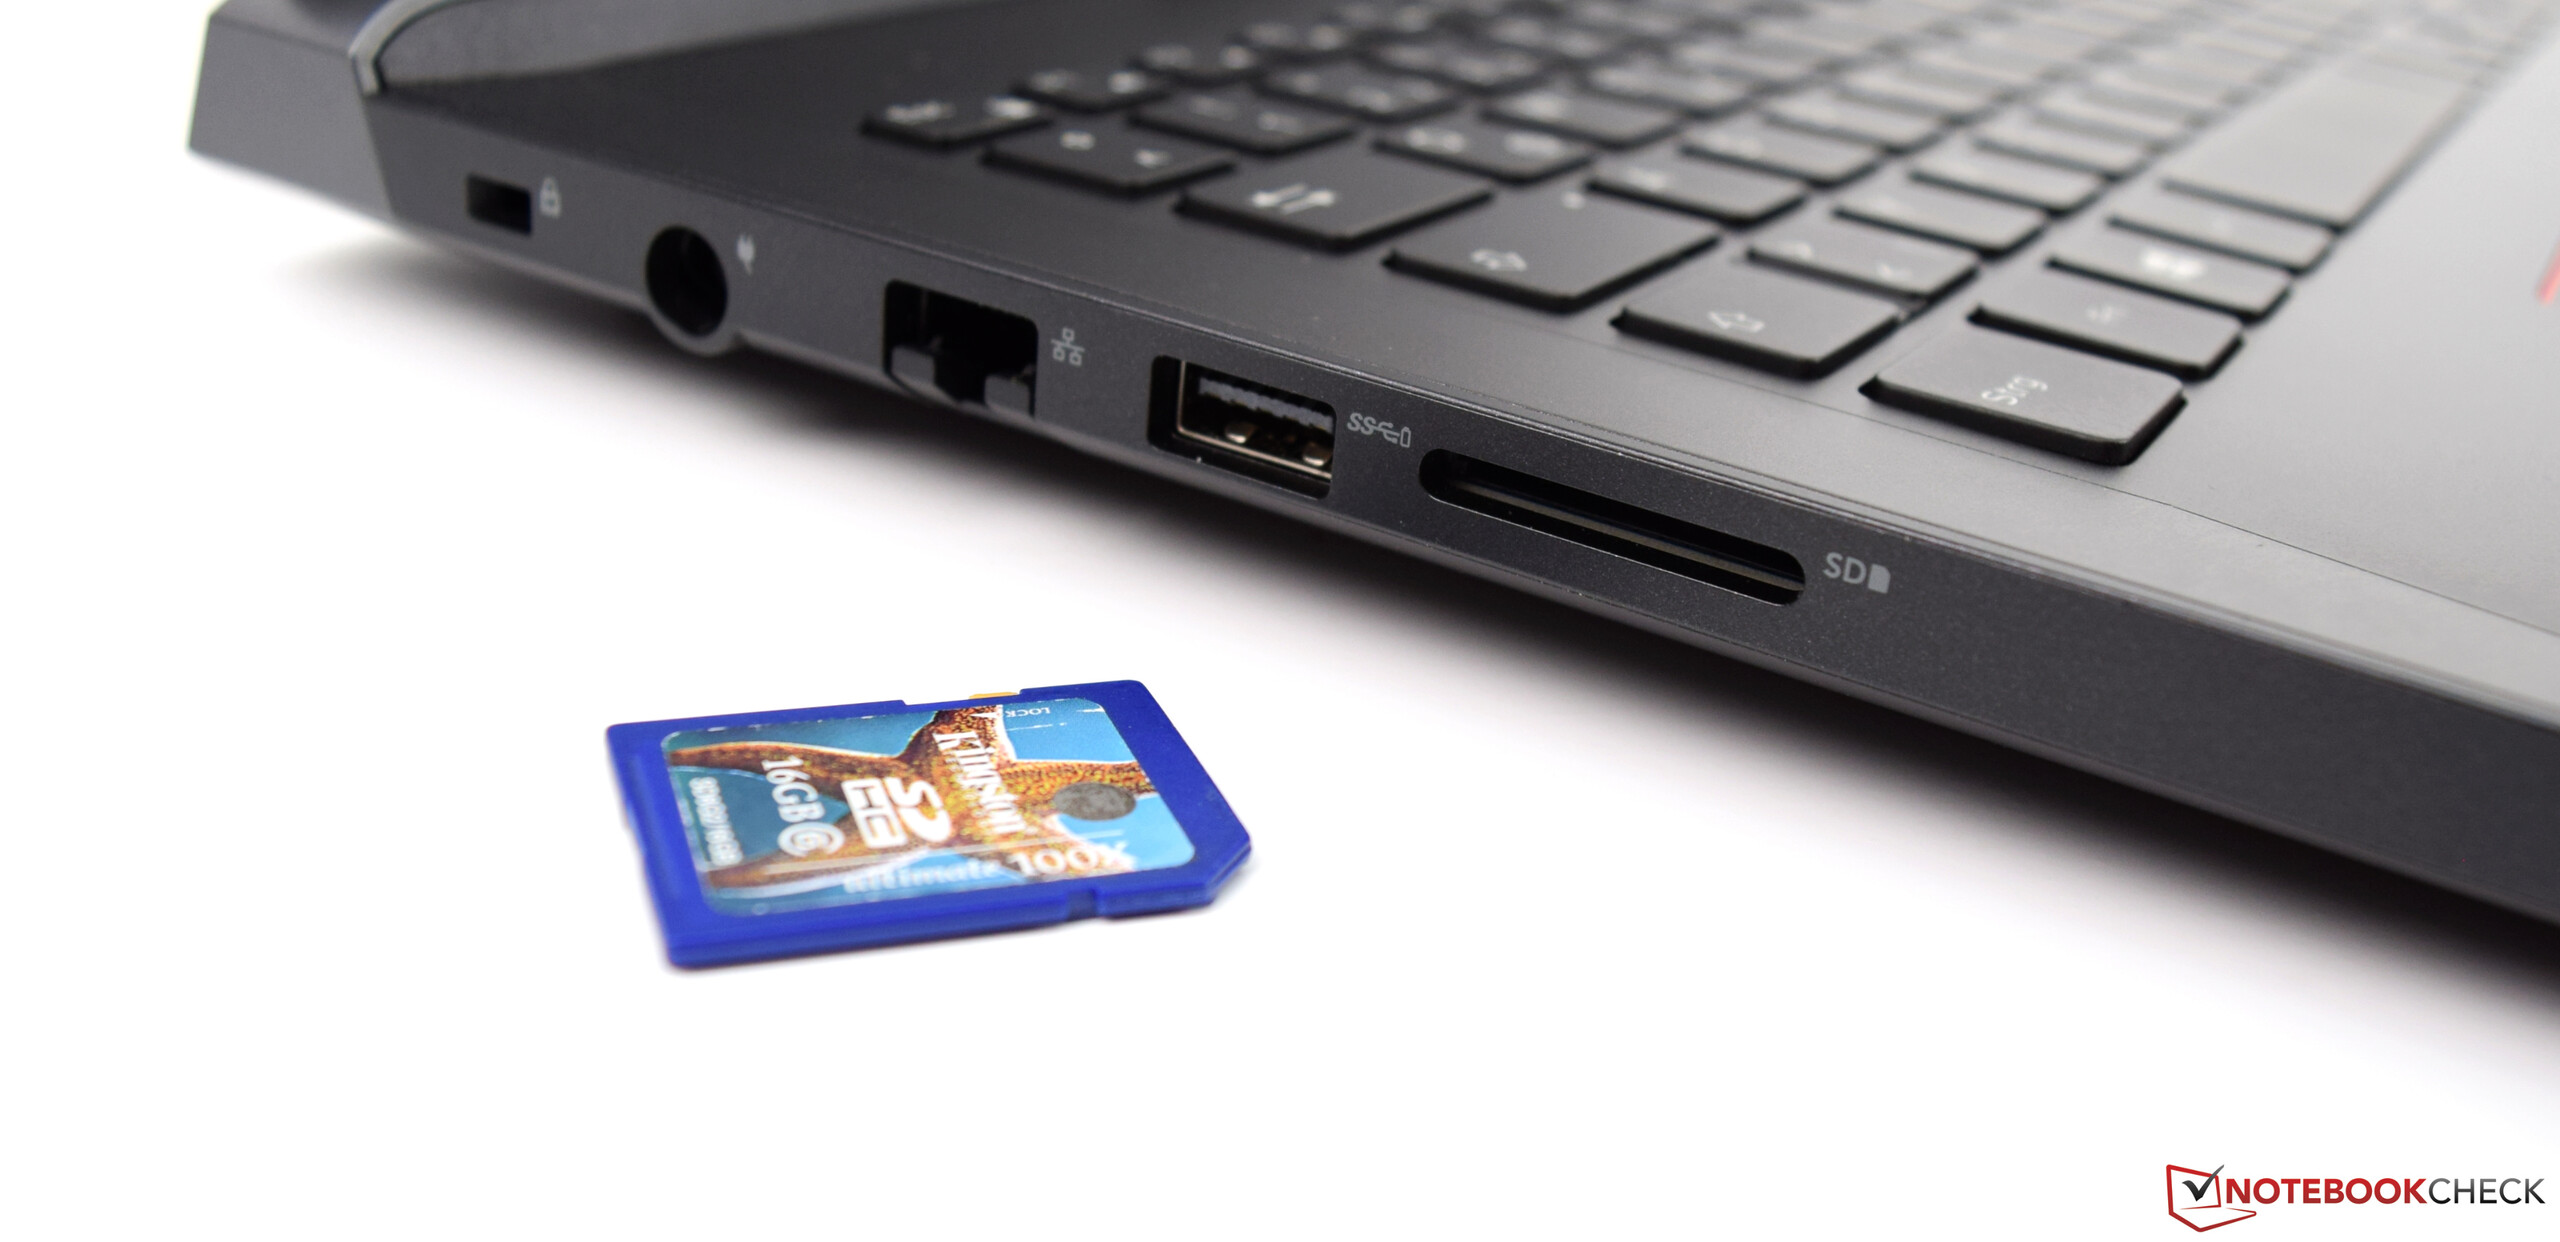
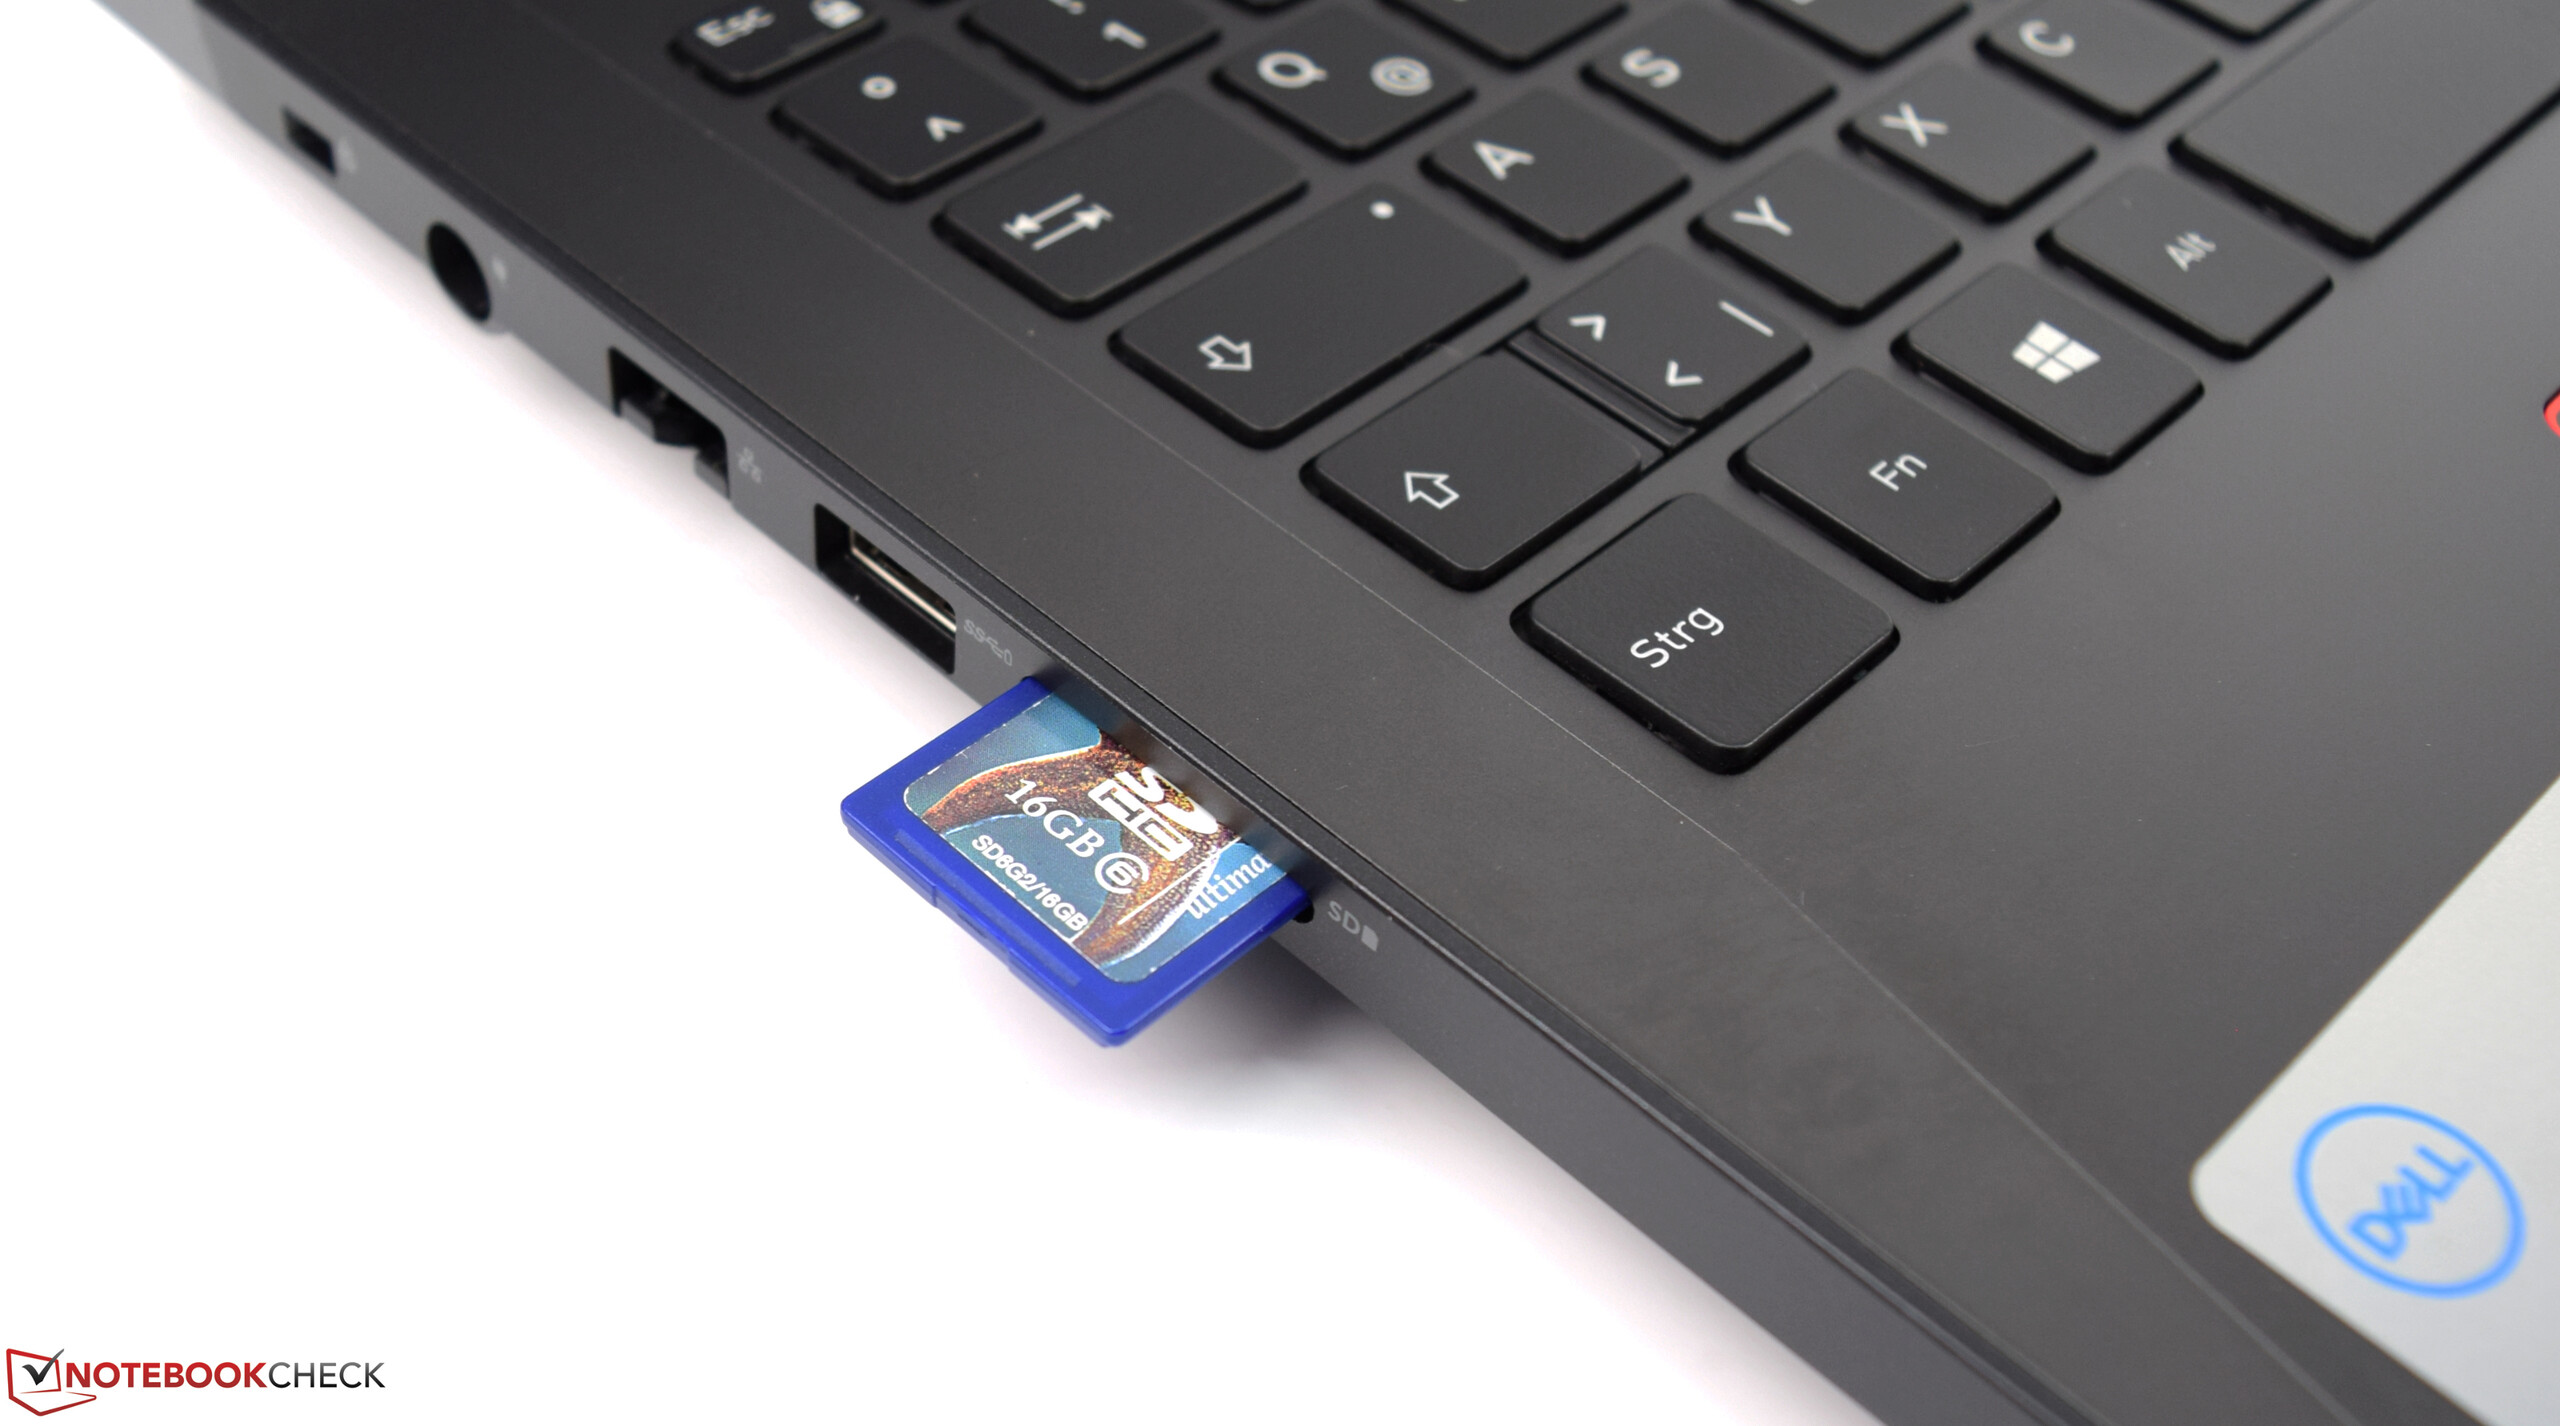
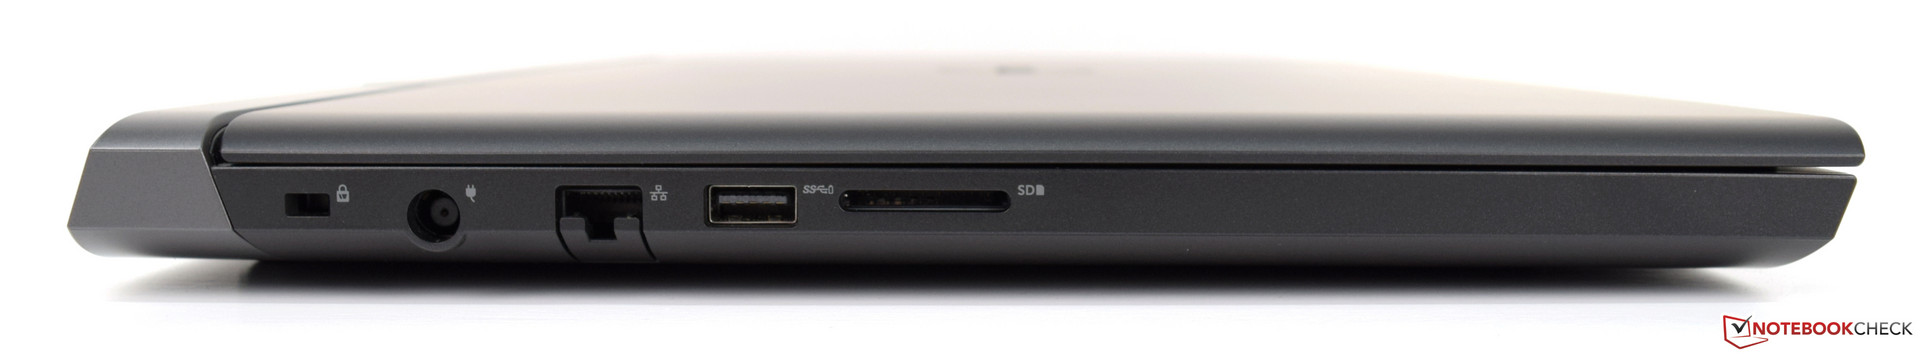
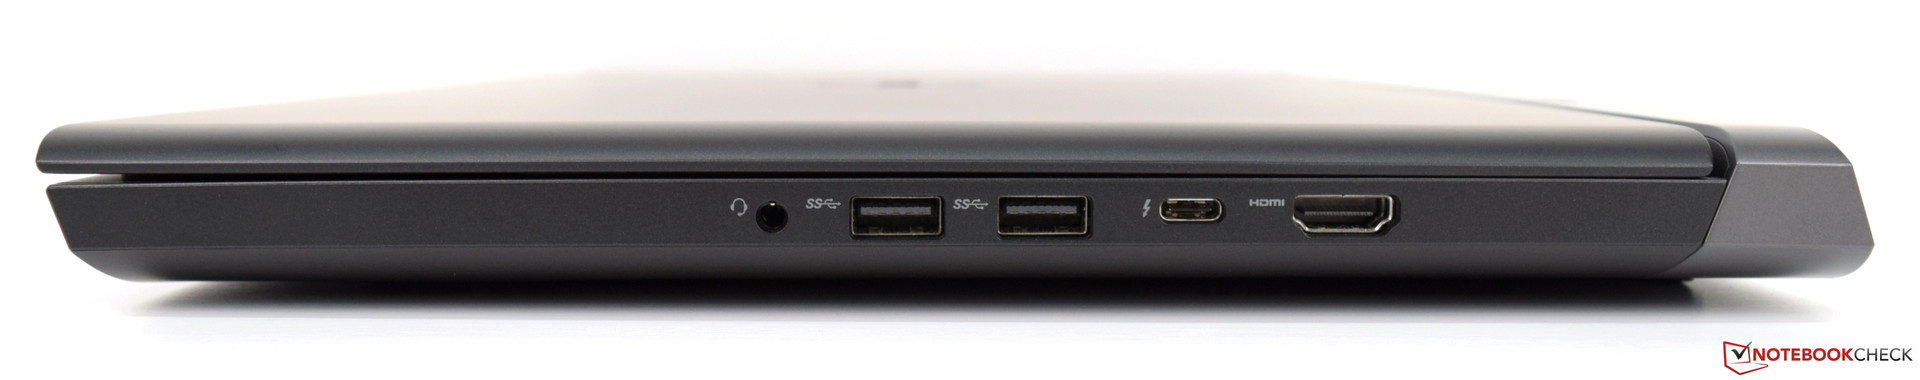
A kijelző nem volt elég meggyőző, bár van jó oldala is. A matt felület, és a PWM elkerülése nem mindig elég önmagában a jó értékeléshez. A tesztpéldány egyszerűen nem elég világos és kontrasztos. A kártyaolvasó esetében pedig a Dell-nek át kellene gondolnia, hogy vajon az USB 2.0 sebessége mennyire naprakész valójában. Szerencsére a Dell G5 15 egy kártyatárhely olvasót is kínál.
A hangrendszertől kicsit többet vártunk, mivel az, amit a Dell G5 15 5587-ben kaptunk, az nem elegendő egy tisztán gamer gépbe. Egy dedikált mélysugárzó elvárható lett volna. A majdnem 3 kg-os tömeg egy 15.6 colos készülék esetén szintén nem elhanyagolható negatívum.
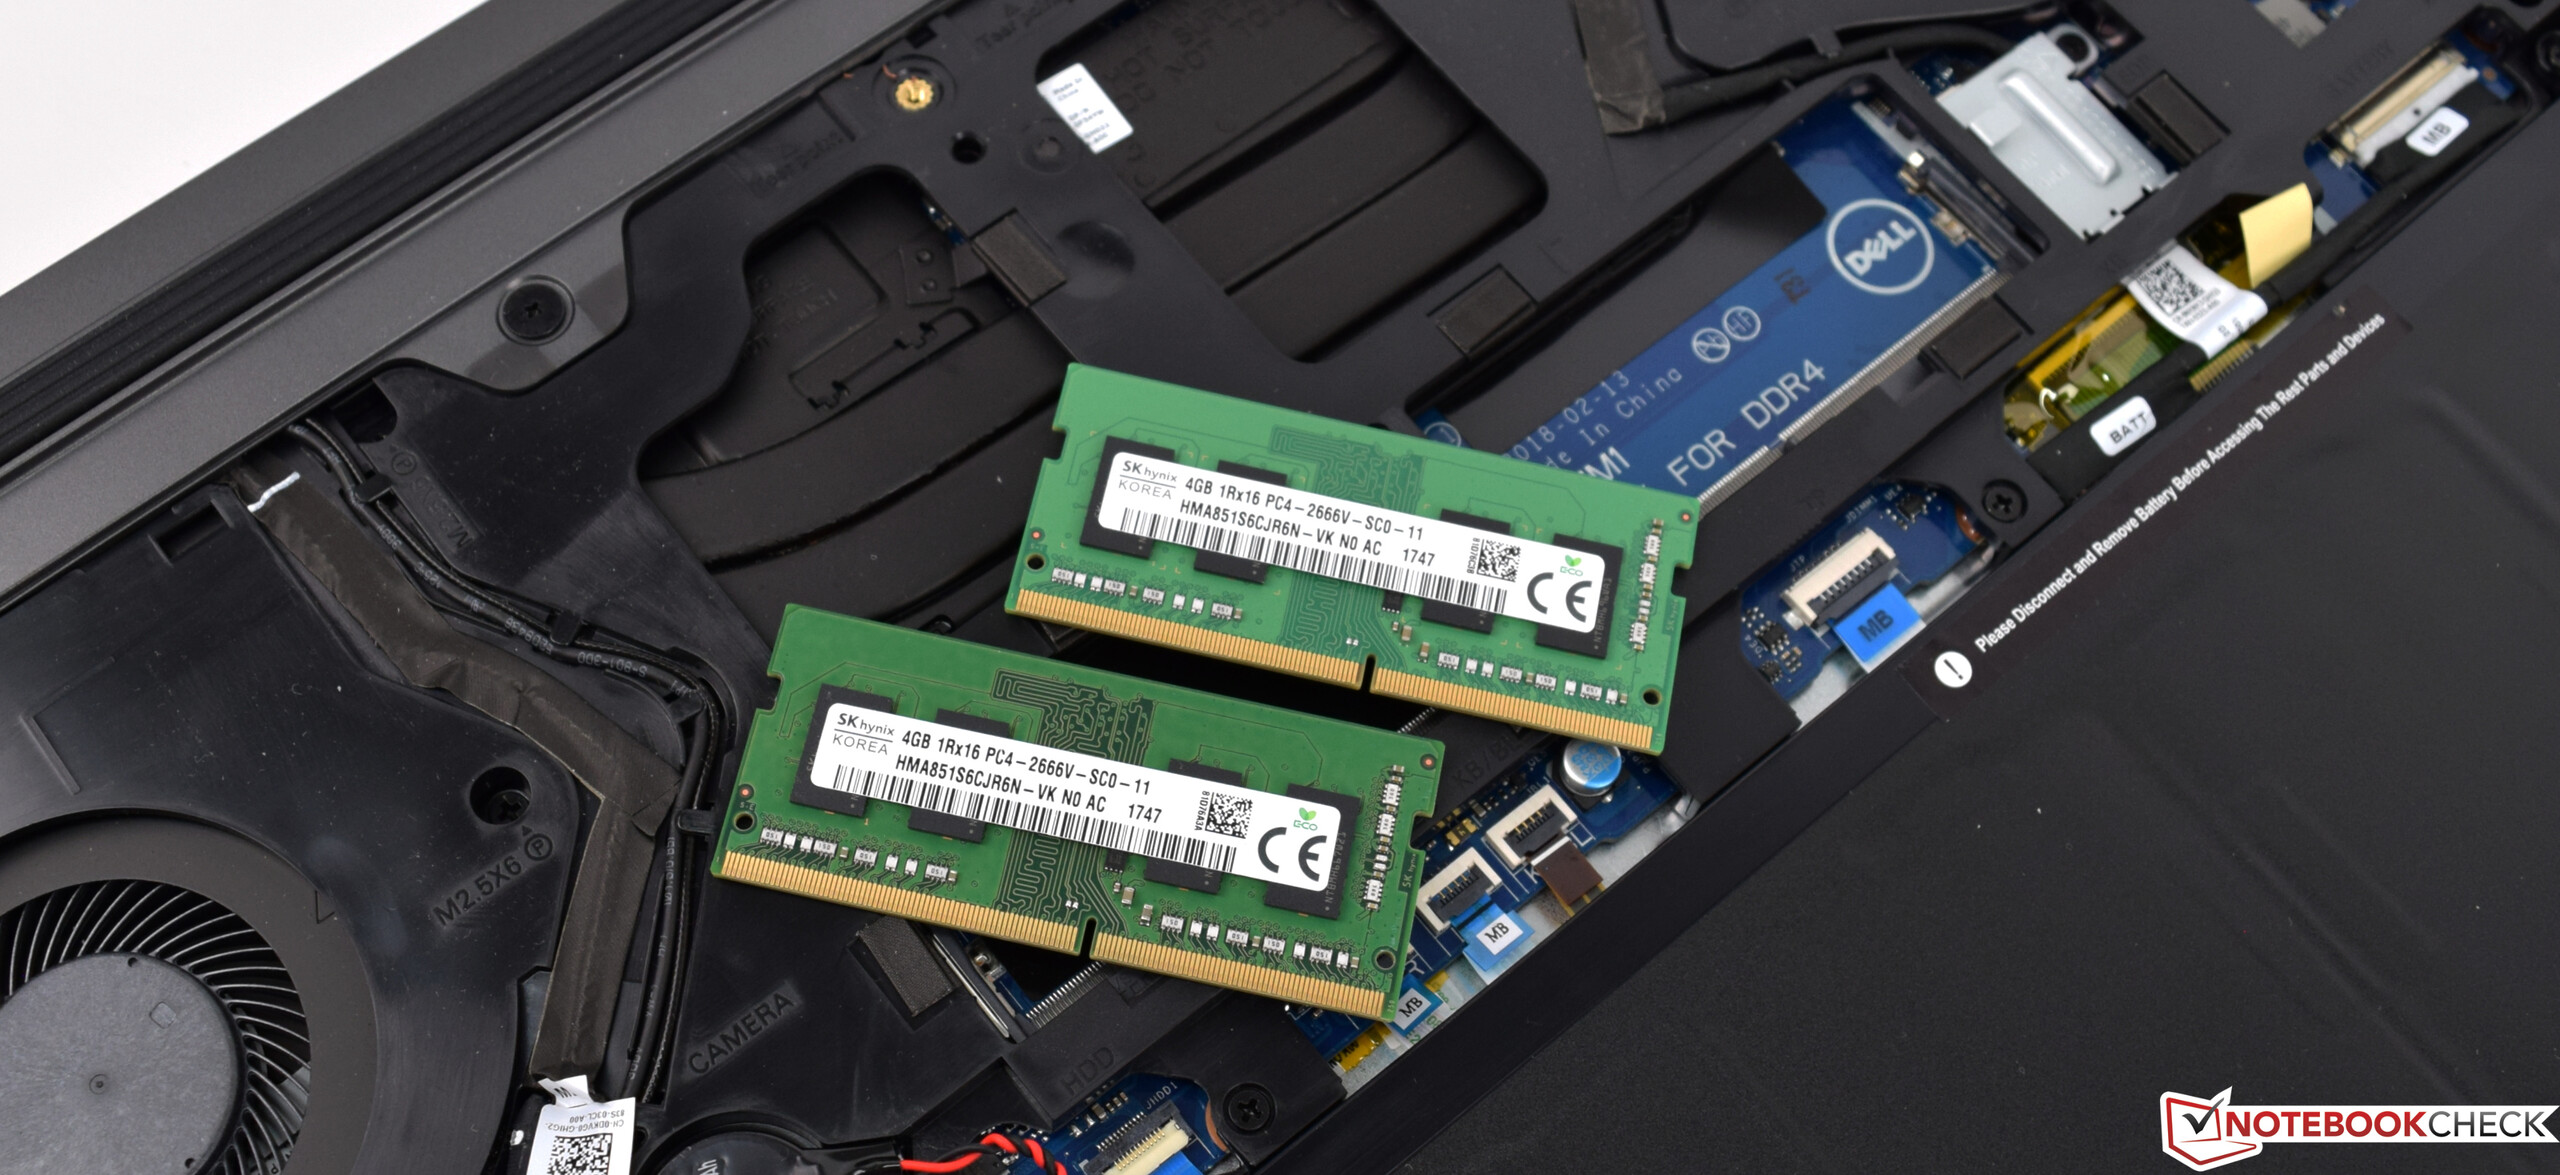
Ugyan az elején elegendő lehet a háttértár mérete, javasoljuk egy nagyobb SSD beszerzését, hogy jobban kihasználható legyen az előnye a sebesség terén.
Ez az eredeti értékelés rövidített változata. A teljes, angol nyelvű cikk itt olvasható.
Dell G5 15 5587
- 06/21/2018 v6 (old)
Sebastian Bade