Acer Predator Helios 500 (GTX 1070, i7-8750H) Laptop rövid értékelés
| |||||||||||||||||||||||||
Fényerő megoszlás: 82 %
Centrumban: 340 cd/m²
Kontraszt: 479:1 (Fekete: 0.7 cd/m²)
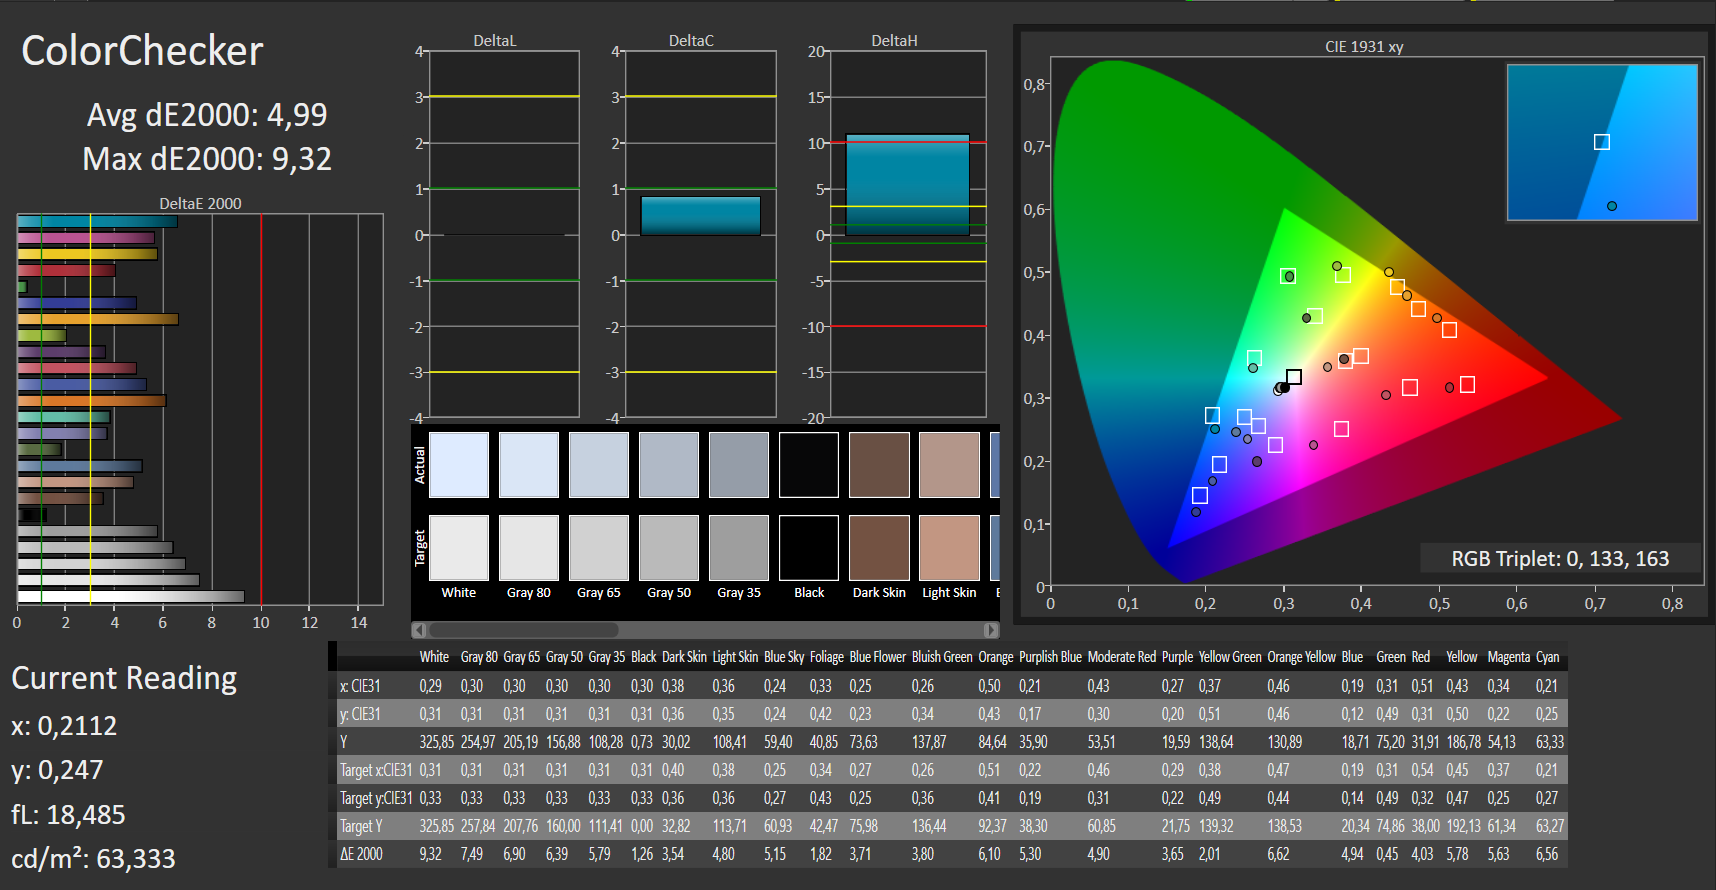
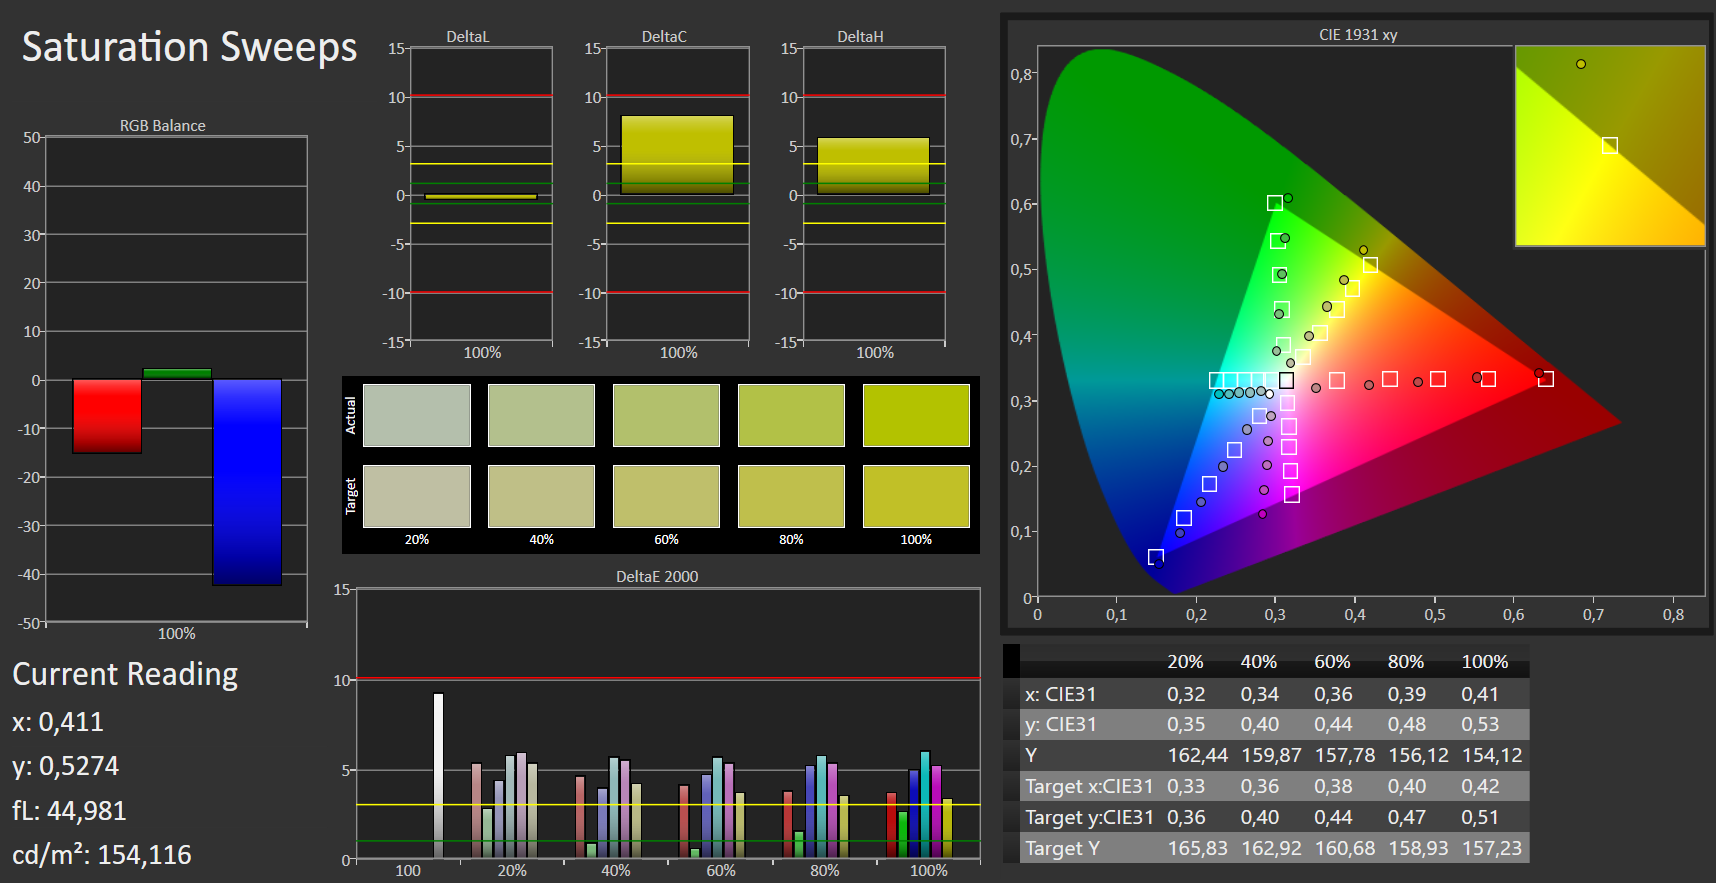
ΔE ColorChecker Calman: 4.99 | ∀{0.5-29.43 Ø4.71}
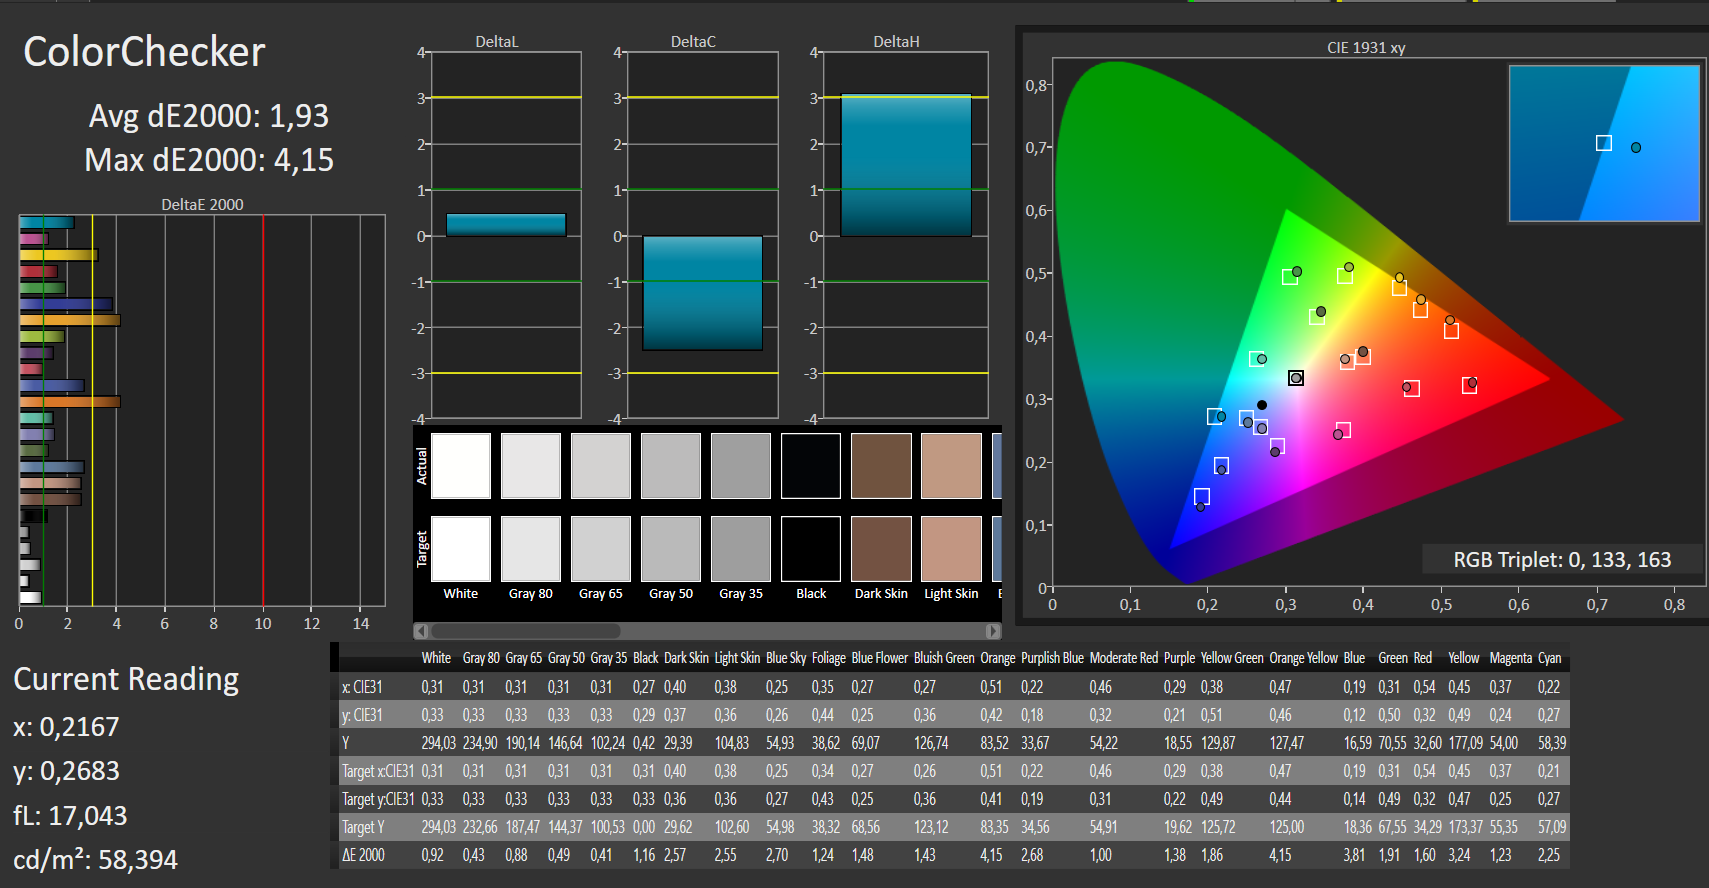
calibrated: 1.93
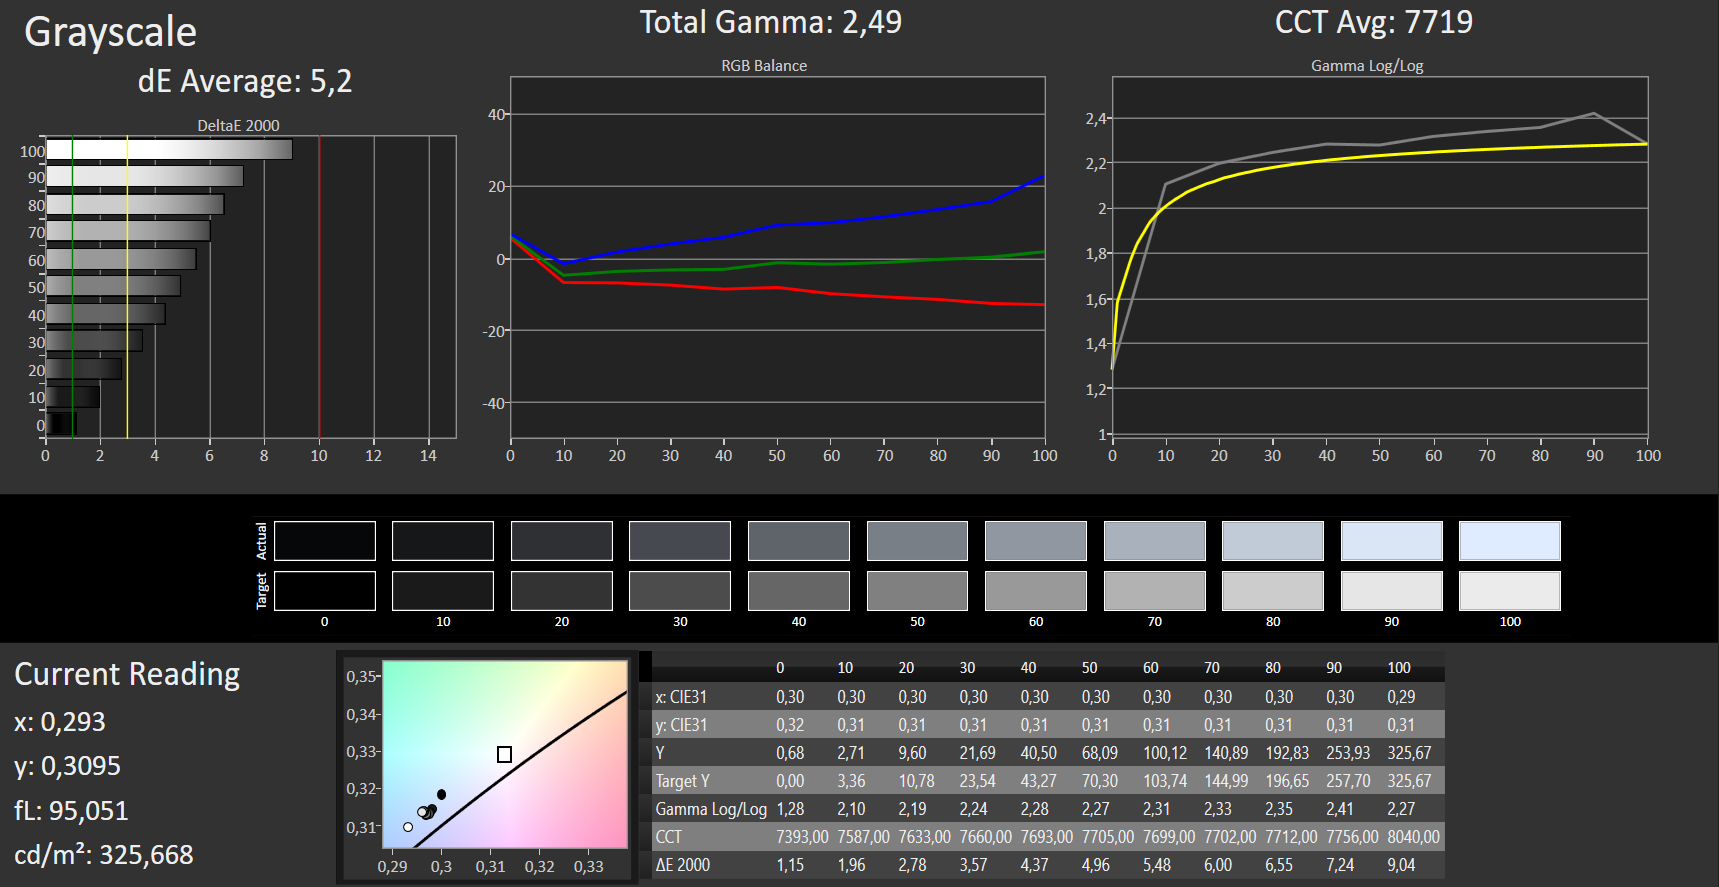
ΔE Greyscale Calman: 5.2 | ∀{0.09-98 Ø4.96}
91% sRGB (Argyll 1.6.3 3D)
59% AdobeRGB 1998 (Argyll 1.6.3 3D)
65.6% AdobeRGB 1998 (Argyll 3D)
91.3% sRGB (Argyll 3D)
64.4% Display P3 (Argyll 3D)
Gamma: 2.49
CCT: 7719 K
| Acer Predator Helios 500 PH517-51-79BY AUO_B173HAN03, , 1920x1080, 17.3" | Asus G703 AUO B173HAN03.0 (AUO309D), , 1920x1080, 17.3" | MSI GT75 8RG-090 Titan CMN N173HHE-G32 (CMN1747), , 1920x1080, 17.3" | HP Omen X 17-ap0xx AU Optronics B173HW01, , 1920x1080, 17.3" | Razer Blade Pro RZ09-0220 ID: AUO169D, Name: AU Optronics B173HAN01.6, , 1920x1080, 17.3" | Acer Predator 17 G9-793-70PJ AU Optronics B173ZAN01.0 (AUO109B), , 3840x2160, 17.3" | |
|---|---|---|---|---|---|---|
| Display | 2% | 27% | -2% | -1% | 31% | |
| Display P3 Coverage (%) | 64.4 | 65.5 2% | 90.9 41% | 63.7 -1% | 64 -1% | 86.4 34% |
| sRGB Coverage (%) | 91.3 | 92.4 1% | 100 10% | 88.2 -3% | 89.7 -2% | 99.9 9% |
| AdobeRGB 1998 Coverage (%) | 65.6 | 66.6 2% | 86.2 31% | 64.2 -2% | 64.9 -1% | 99.1 51% |
| Response Times | -25% | 41% | -233% | -238% | -221% | |
| Response Time Grey 50% / Grey 80% * (ms) | 14 ? | 17.6 ? -26% | 8 ? 43% | 44 ? -214% | 36.8 ? -163% | 50 ? -257% |
| Response Time Black / White * (ms) | 9 ? | 11.2 ? -24% | 5.6 ? 38% | 31.6 ? -251% | 37.2 ? -313% | 25.6 ? -184% |
| PWM Frequency (Hz) | 26000 ? | |||||
| Screen | 18% | 35% | 24% | 27% | 34% | |
| Brightness middle (cd/m²) | 335 | 274 -18% | 240 -28% | 343 2% | 367.4 10% | 343 2% |
| Brightness (cd/m²) | 300 | 268 -11% | 248 -17% | 332 11% | 363 21% | 328 9% |
| Brightness Distribution (%) | 82 | 80 -2% | 83 1% | 83 1% | 86 5% | 84 2% |
| Black Level * (cd/m²) | 0.7 | 0.29 59% | 0.22 69% | 0.35 50% | 0.32 54% | 0.29 59% |
| Contrast (:1) | 479 | 945 97% | 1091 128% | 980 105% | 1148 140% | 1183 147% |
| Colorchecker dE 2000 * | 4.99 | 3.99 20% | 2.14 57% | 3.35 33% | 3.8 24% | 4.01 20% |
| Colorchecker dE 2000 max. * | 9.32 | 7.33 21% | 5.04 46% | 5.62 40% | 10.4 -12% | 6.03 35% |
| Colorchecker dE 2000 calibrated * | 1.93 | 1.79 7% | 1.54 20% | 2.5 -30% | ||
| Greyscale dE 2000 * | 5.2 | 4.14 20% | 1.62 69% | 2.4 54% | 3.5 33% | 4.7 10% |
| Gamma | 2.49 88% | 2.58 85% | 2.28 96% | 2.35 94% | 2.18 101% | 2.4 92% |
| CCT | 7719 84% | 7352 88% | 6846 95% | 6495 100% | 6467 101% | 6451 101% |
| Color Space (Percent of AdobeRGB 1998) (%) | 59 | 60 2% | 77 31% | 57 -3% | 58.1 -2% | 88 49% |
| Color Space (Percent of sRGB) (%) | 91 | 92 1% | 100 10% | 88 -3% | 89.3 -2% | 100 10% |
| Teljes átlag (program / beállítások) | -2% /
9% | 34% /
34% | -70% /
-13% | -71% /
-14% | -52% /
-0% |
* ... a kisebb jobb


Megjelenítési válaszidők
| ↔ Válaszidő Fekete-fehér | ||
|---|---|---|
| 9 ms ... emelkedés és süllyedés ↘ kombinálva | ↗ 5 ms emelkedés | 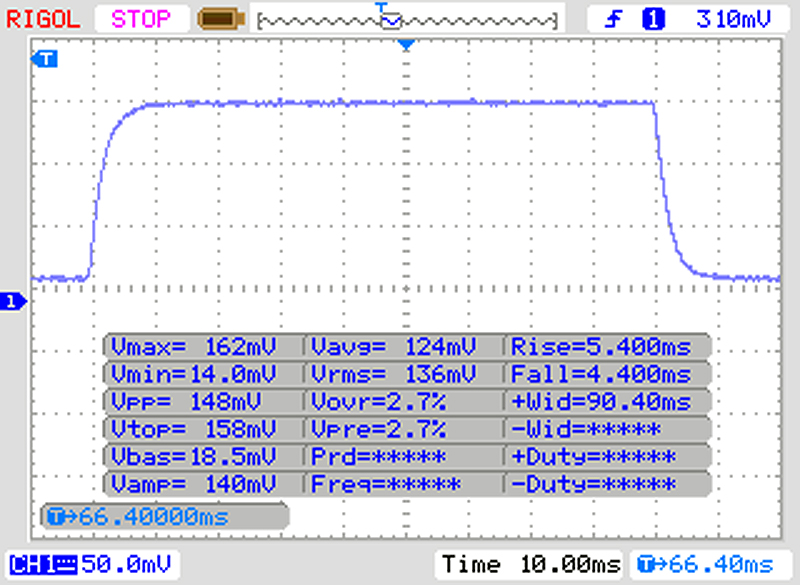 |
| ↘ 4 ms ősz | ||
| A képernyő gyors reakciósebességet mutat tesztjeinkben, és játékra is alkalmasnak kell lennie. Összehasonlításképpen, az összes tesztelt eszköz 0.1 (minimum) és 240 (maximum) ms között mozog. » 25 % of all devices are better. Ez azt jelenti, hogy a mért válaszidő jobb, mint az összes vizsgált eszköz átlaga (19.8 ms). | ||
| ↔ Válaszidő 50% szürke és 80% szürke között | ||
| 14 ms ... emelkedés és süllyedés ↘ kombinálva | ↗ 7 ms emelkedés | 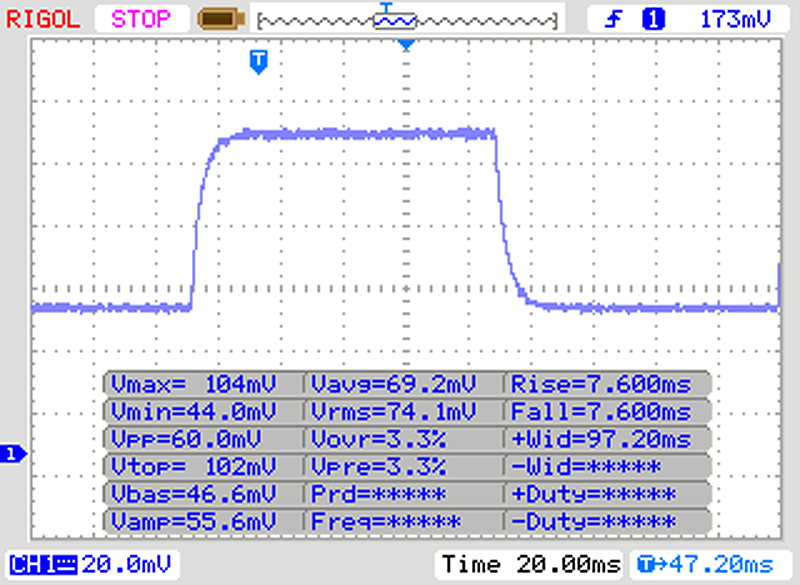 |
| ↘ 7 ms ősz | ||
| A képernyő jó reakciósebességet mutat tesztjeinkben, de túl lassú lehet a versenyképes játékosok számára. Összehasonlításképpen, az összes tesztelt eszköz 0.165 (minimum) és 636 (maximum) ms között mozog. » 28 % of all devices are better. Ez azt jelenti, hogy a mért válaszidő jobb, mint az összes vizsgált eszköz átlaga (31 ms). | ||
Képernyő villogása / PWM (impulzusszélesség-moduláció)
| Képernyő villogása / PWM nem érzékelhető |  | ||
Összehasonlításképpen: az összes tesztelt eszköz 52 %-a nem használja a PWM-et a kijelző elsötétítésére. Ha PWM-et észleltek, akkor átlagosan 7754 (minimum: 5 - maximum: 343500) Hz-t mértek. | |||
| PCMark 8 Home Score Accelerated v2 | 5431 pontok | |
| PCMark 8 Work Score Accelerated v2 | 5872 pontok | |
| PCMark 10 Score | 5589 pontok | |
Segítség | ||
| Acer Predator Helios 500 PH517-51-79BY SK hynix SSD Canvas SC300 HFS256GD9MNE-6200A | Asus G703 2x Samsung SM961 MZVKW512HMJP NVMe (RAID 0) | MSI GT75 8RG-090 Titan 2x Samsung PM961 MZVLW256HEHP (RAID 0) | HP Omen X 17-ap0xx Samsung PM961 MZVLW256HEHP | Razer Blade Pro RZ09-0220 Samsung SSD PM951 MZVLV256HCHP | Átlagos SK hynix SSD Canvas SC300 HFS256GD9MNE-6200A | |
|---|---|---|---|---|---|---|
| CrystalDiskMark 5.2 / 6 | 157% | 96% | 67% | 17% | 0% | |
| Write 4K (MB/s) | 79.2 | 160.7 103% | 111.8 41% | 148.8 88% | 155.1 96% | 79.2 ? 0% |
| Read 4K (MB/s) | 39.69 | 54.8 38% | 42.09 6% | 46.64 18% | 44.22 11% | 39.7 ? 0% |
| Write Seq (MB/s) | 950 | 2738 188% | 2288 141% | 1216 28% | 311.2 -67% | 950 ? 0% |
| Read Seq (MB/s) | 1087 | 3346 208% | 3321 206% | 1461 34% | 1247 15% | 1087 ? 0% |
| Write 4K Q32T1 (MB/s) | 189.6 | 612 223% | 308.3 63% | 444 134% | 310.3 64% | 189.6 ? 0% |
| Read 4K Q32T1 (MB/s) | 304 | 709 133% | 364.9 20% | 535 76% | 551 81% | 304 ? 0% |
| Write Seq Q32T1 (MB/s) | 948 | 3082 225% | 2440 157% | 1210 28% | 311.5 -67% | 948 ? 0% |
| Read Seq Q32T1 (MB/s) | 1488 | 3505 136% | 3485 134% | 3450 132% | 1560 5% | 1488 ? 0% |

| 3DMark Fire Strike Score | 15019 pontok | |
| 3DMark Time Spy Score | 5741 pontok | |
Segítség | ||
| Dirt Rally - 1920x1080 Ultra Preset AA:4x MS | |
| Acer Predator Helios 500 PH517-51-79BY | |
| Átlagos NVIDIA GeForce GTX 1070 Mobile (84.7 - 119, n=3) | |
| The Witcher 3 - 1920x1080 Ultra Graphics & Postprocessing (HBAO+) | |
| Az osztály átlaga Gaming (104.7 - 240, n=7, az elmúlt 2 évben) | |
| Asus G703 | |
| MSI GT75 8RG-090 Titan | |
| HP Omen X 17-ap0xx | |
| Acer Predator 17 G9-793-70PJ | |
| Átlagos NVIDIA GeForce GTX 1070 Mobile (48.2 - 68.4, n=41) | |
| Acer Predator Helios 500 PH517-51-79BY | |
| Razer Blade Pro RZ09-0220 | |
| Fallout 4 - 1920x1080 Ultra Preset AA:T AF:16x | |
| HP Omen X 17-ap0xx | |
| Acer Predator Helios 500 PH517-51-79BY | |
| Átlagos NVIDIA GeForce GTX 1070 Mobile (95.4 - 122, n=9) | |
| Razer Blade Pro RZ09-0220 | |
| Rise of the Tomb Raider - 1920x1080 Very High Preset AA:FX AF:16x | |
| HP Omen X 17-ap0xx | |
| Átlagos NVIDIA GeForce GTX 1070 Mobile (79.1 - 102.5, n=25) | |
| Acer Predator Helios 500 PH517-51-79BY | |
| Razer Blade Pro RZ09-0220 | |
| Resident Evil 7 - 1920x1080 Very High / On AA:FXAA+T | |
| HP Omen X 17-ap0xx | |
| Acer Predator Helios 500 PH517-51-79BY | |
| Átlagos NVIDIA GeForce GTX 1070 Mobile (130 - 162.3, n=6) | |
| Playerunknown's Battlegrounds (PUBG) - 1920x1080 Ultra Preset | |
| Acer Predator Helios 500 PH517-51-79BY | |
| HP Omen X 17-ap0xx | |
| Átlagos NVIDIA GeForce GTX 1070 Mobile (70 - 95, n=5) | |
| F1 2017 - 1920x1080 Ultra High Preset AA:T AF:16x | |
| HP Omen X 17-ap0xx | |
| Acer Predator Helios 500 PH517-51-79BY | |
| Átlagos NVIDIA GeForce GTX 1070 Mobile (88 - 102, n=5) | |
| Razer Blade Pro RZ09-0220 | |
| Call of Duty WWII - 1920x1080 Extra / On AA:Filmic T2X SM | |
| Asus G703 | |
| Átlagos NVIDIA GeForce GTX 1070 Mobile (95 - 122, n=6) | |
| Acer Predator Helios 500 PH517-51-79BY | |
| Star Wars Battlefront 2 - 1920x1080 Ultra Preset | |
| Asus G703 | |
| MSI GT75 8RG-090 Titan | |
| Átlagos NVIDIA GeForce GTX 1070 Mobile (90.7 - 104, n=5) | |
| Acer Predator Helios 500 PH517-51-79BY | |
| Kingdom Come: Deliverance - 1920x1080 Ultra High Preset | |
| Acer Predator Helios 500 PH517-51-79BY | |
| Asus G703 | |
| Átlagos NVIDIA GeForce GTX 1070 Mobile (54.2 - 82, n=5) | |
| alacsony | közepes | magas | ultra | |
|---|---|---|---|---|
| Dirt Rally (2015) | 119 | |||
| The Witcher 3 (2015) | 110 | 57 | ||
| Fallout 4 (2015) | 133 | 122 | ||
| Rise of the Tomb Raider (2016) | 108 | 90 | ||
| Battlefield 1 (2016) | 127 | 118 | ||
| Resident Evil 7 (2017) | 163 | 147 | ||
| Playerunknown's Battlegrounds (PUBG) (2017) | 131 | 95 | ||
| F1 2017 (2017) | 140 | 97 | ||
| Call of Duty WWII (2017) | 130 | 95 | ||
| Star Wars Battlefront 2 (2017) | 113 | 92 | ||
| Kingdom Come: Deliverance (2018) | 59 | 82 |
Zajszint
| Üresjárat |
| 31.2 / 35.3 / 35.3 dB(A) |
| HDD |
| 31 dB(A) |
| Terhelés |
| 44.4 / 45.2 dB(A) |
 | ||
30 dB csendes 40 dB(A) hallható 50 dB(A) hangos |
||
min: | ||
(±) A felső oldalon a maximális hőmérséklet 42.6 °C / 109 F, összehasonlítva a 40.4 °C / 105 F átlagával , 21.2 és 68.8 °C között a Gaming osztálynál.
(+) Az alsó maximum 37.2 °C / 99 F-ig melegszik fel, összehasonlítva a 43.2 °C / 110 F átlagával
(+) Üresjáratban a felső oldal átlagos hőmérséklete 30.1 °C / 86 F, összehasonlítva a 33.9 °C / ### eszközátlaggal class_avg_f### F.
(±) A The Witcher 3 játék során a felső oldal átlaghőmérséklete 37.8 °C / 100 F, összehasonlítva a 33.9 °C / ## eszközátlaggal #class_avg_f### F.
(+) A csuklótámasz és az érintőpad hűvösebb, mint a bőr hőmérséklete, maximum 31 °C / 87.8 F, ezért hűvös tapintású.
(-) A hasonló eszközök csuklótámasz területének átlagos hőmérséklete 28.8 °C / 83.8 F volt (-2.2 °C / -4 F).
Acer Predator Helios 500 PH517-51-79BY hangelemzés
(-) | nem túl hangos hangszórók (65 dB)
Basszus 100 - 315 Hz
(±) | csökkentett basszus – átlagosan 6.5%-kal alacsonyabb, mint a medián
(±) | a basszus linearitása átlagos (7.6% delta az előző frekvenciához)
Közepes 400-2000 Hz
(+) | kiegyensúlyozott középpontok – csak 2.3% választja el a mediántól
(+) | a középpontok lineárisak (5.2% delta az előző frekvenciához)
Maximum 2-16 kHz
(+) | kiegyensúlyozott csúcsok – csak 1.9% választja el a mediántól
(±) | a csúcsok linearitása átlagos (7.9% delta az előző gyakorisághoz)
Összességében 100 - 16.000 Hz
(+) | általános hangzás lineáris (11.7% eltérés a mediánhoz képest)
Ugyanazon osztályhoz képest
» 11%Ebben az osztályban az összes tesztelt eszköz %-a jobb volt, 4% hasonló, 85%-kal rosszabb
» A legjobb delta értéke 6%, az átlag 18%, a legrosszabb 132% volt
Az összes tesztelt eszközzel összehasonlítva
» 8% az összes tesztelt eszköz jobb volt, 3% hasonló, 89%-kal rosszabb
» A legjobb delta értéke 4%, az átlag 23%, a legrosszabb 134% volt
HP Omen X 17-ap0xx hangelemzés
(-) | nem túl hangos hangszórók (65.7 dB)
Basszus 100 - 315 Hz
(-) | szinte nincs basszus – átlagosan 18.1%-kal alacsonyabb a mediánnál
(±) | a basszus linearitása átlagos (9.9% delta az előző frekvenciához)
Közepes 400-2000 Hz
(+) | kiegyensúlyozott középpontok – csak 3.4% választja el a mediántól
(+) | a középpontok lineárisak (6.3% delta az előző frekvenciához)
Maximum 2-16 kHz
(+) | kiegyensúlyozott csúcsok – csak 2.3% választja el a mediántól
(±) | a csúcsok linearitása átlagos (9.8% delta az előző gyakorisághoz)
Összességében 100 - 16.000 Hz
(±) | az általános hang linearitása átlagos (22.3% eltérés a mediánhoz képest)
Ugyanazon osztályhoz képest
» 80%Ebben az osztályban az összes tesztelt eszköz %-a jobb volt, 6% hasonló, 14%-kal rosszabb
» A legjobb delta értéke 6%, az átlag 18%, a legrosszabb 132% volt
Az összes tesztelt eszközzel összehasonlítva
» 65% az összes tesztelt eszköz jobb volt, 6% hasonló, 29%-kal rosszabb
» A legjobb delta értéke 4%, az átlag 23%, a legrosszabb 134% volt
Acer Predator 17 G9-793-70PJ hangelemzés
(+) | a hangszórók viszonylag hangosan tudnak játszani (87 dB)
Basszus 100 - 315 Hz
(±) | csökkentett basszus – átlagosan 5.5%-kal alacsonyabb, mint a medián
(±) | a basszus linearitása átlagos (8% delta az előző frekvenciához)
Közepes 400-2000 Hz
(+) | kiegyensúlyozott középpontok – csak 2.9% választja el a mediántól
(+) | a középpontok lineárisak (3.5% delta az előző frekvenciához)
Maximum 2-16 kHz
(±) | csökkentett csúcsok – átlagosan 5.2%-kal alacsonyabb a mediánnál
(+) | a csúcsok lineárisak (6.2% delta az előző frekvenciához képest)
Összességében 100 - 16.000 Hz
(+) | általános hangzás lineáris (10.3% eltérés a mediánhoz képest)
Ugyanazon osztályhoz képest
» 6%Ebben az osztályban az összes tesztelt eszköz %-a jobb volt, 2% hasonló, 93%-kal rosszabb
» A legjobb delta értéke 6%, az átlag 18%, a legrosszabb 132% volt
Az összes tesztelt eszközzel összehasonlítva
» 5% az összes tesztelt eszköz jobb volt, 1% hasonló, 94%-kal rosszabb
» A legjobb delta értéke 4%, az átlag 23%, a legrosszabb 134% volt
| Kikapcsolt állapot / Készenlét | |
| Üresjárat | |
| Terhelés |
|
Kulcs:
min: | |
| Acer Predator Helios 500 PH517-51-79BY i7-8750H, GeForce GTX 1070 Mobile, SK hynix SSD Canvas SC300 HFS256GD9MNE-6200A, IPS, 1920x1080, 17.3" | Acer Predator Helios 300 i7-7700HQ, GeForce GTX 1060 Mobile, Intel SSD 600p SSDPEKKW512G7, AH-IPS, WLED, 1920x1080, 17.3" | Asus G703 i7-7820HK, GeForce GTX 1080 Mobile, 2x Samsung SM961 MZVKW512HMJP NVMe (RAID 0), IPS, 1920x1080, 17.3" | MSI GT75 8RG-090 Titan i9-8950HK, GeForce GTX 1080 Mobile, 2x Samsung PM961 MZVLW256HEHP (RAID 0), TN, 1920x1080, 17.3" | HP Omen X 17-ap0xx i7-7820HK, GeForce GTX 1080 Mobile, Samsung PM961 MZVLW256HEHP, IPS, 1920x1080, 17.3" | Razer Blade Pro RZ09-0220 i7-7700HQ, GeForce GTX 1060 Mobile, Samsung SSD PM951 MZVLV256HCHP, IPS, 1920x1080, 17.3" | Acer Predator 17 G9-793-70PJ i7-7700HQ, GeForce GTX 1070 Mobile, Toshiba NVMe THNSN5512GPU7, IPS, 3840x2160, 17.3" | Átlagos NVIDIA GeForce GTX 1070 Mobile | Az osztály átlaga Gaming | |
|---|---|---|---|---|---|---|---|---|---|
| Power Consumption | 43% | -22% | -37% | 6% | 42% | -3% | 4% | 18% | |
| Idle Minimum * (Watt) | 20.4 | 7 66% | 26 -27% | 31 -52% | 21.6 -6% | 10.6 48% | 23 -13% | 21 ? -3% | 13 ? 36% |
| Idle Average * (Watt) | 26.5 | 13 51% | 30 -13% | 35 -32% | 26.4 -0% | 16 40% | 33 -25% | 26.4 ? -0% | 19 ? 28% |
| Idle Maximum * (Watt) | 37 | 20 46% | 37 -0% | 45 -22% | 26.6 28% | 16.4 56% | 40 -8% | 31.8 ? 14% | 24.6 ? 34% |
| Load Average * (Watt) | 129 | 81 37% | 123 5% | 130 -1% | 95.6 26% | 75.9 41% | 94 27% | 117.7 ? 9% | 110.7 ? 14% |
| Witcher 3 ultra * (Watt) | 186 | 127 32% | 257 -38% | 268 -44% | 221.7 -19% | 111.2 40% | 177 5% | ||
| Load Maximum * (Watt) | 216 | 162 25% | 341 -58% | 374 -73% | 199.6 8% | 163.8 24% | 228 -6% | 219 ? -1% | 259 ? -20% |
* ... a kisebb jobb
| Battery Runtime | |||
| Felbontás | Beállítások | Érték | |
| 1920x1080 | Witcher 3 ultra 150cd | 66 min | |
| WiFi Websurfing | 174 min | ||
| Acer Predator Helios 500 PH517-51-79BY i7-8750H, GeForce GTX 1070 Mobile, 72 Wh | Acer Predator Helios 300 i7-7700HQ, GeForce GTX 1060 Mobile, 48 Wh | Asus G703 i7-7820HK, GeForce GTX 1080 Mobile, 71 Wh | MSI GT75 8RG-090 Titan i9-8950HK, GeForce GTX 1080 Mobile, 75 Wh | HP Omen X 17-ap0xx i7-7820HK, GeForce GTX 1080 Mobile, 99 Wh | Razer Blade Pro RZ09-0220 i7-7700HQ, GeForce GTX 1060 Mobile, 70 Wh | Acer Predator 17 G9-793-70PJ i7-7700HQ, GeForce GTX 1070 Mobile, 88 Wh | Az osztály átlaga Gaming | |
|---|---|---|---|---|---|---|---|---|
| Akkumulátor üzemidő | 55% | -25% | -19% | 55% | 102% | 18% | 81% | |
| Reader / Idle (h) | 4.2 | 10.2 143% | 3.3 -21% | 3.8 -10% | 5.8 38% | 12 186% | 5.4 29% | 8.27 ? 97% |
| WiFi v1.3 (h) | 2.9 | 4.7 62% | 2.5 -14% | 5.6 93% | 7 141% | 3.6 24% | 7.11 ? 145% | |
| Witcher 3 ultra (h) | 1.1 | |||||||
| Load (h) | 1.5 | 0.9 -40% | 0.9 -40% | 1.1 -27% | 2 33% | 1.2 -20% | 1.5 0% | 1.502 ? 0% |
| H.264 (h) | 4.7 | 2.4 | 2.9 | 8.32 ? |
Pro
Kontra
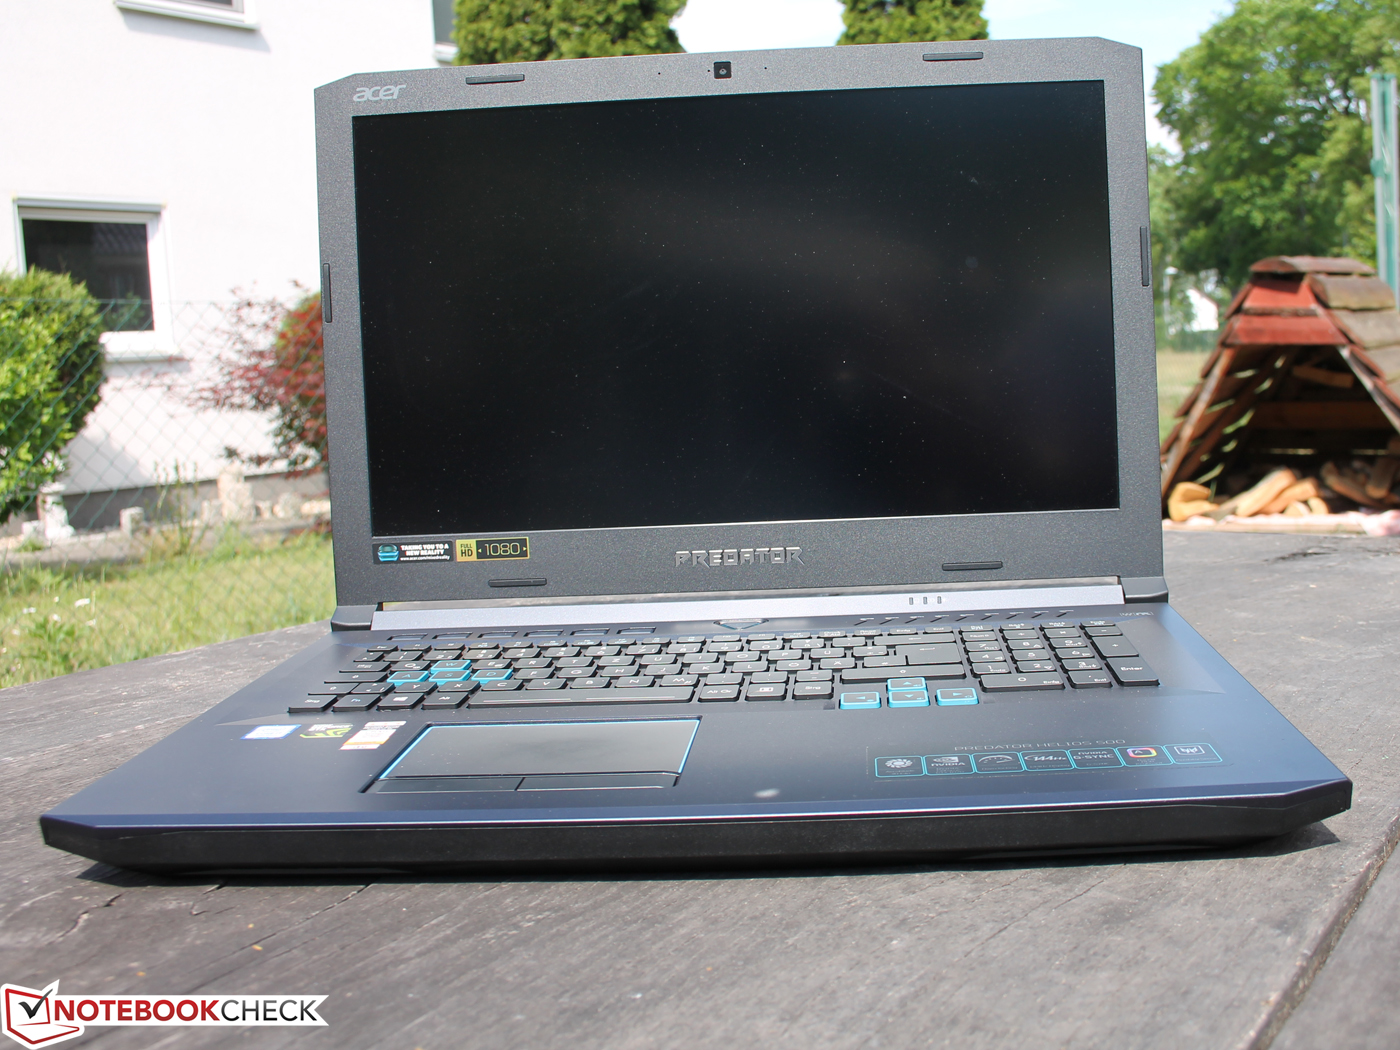
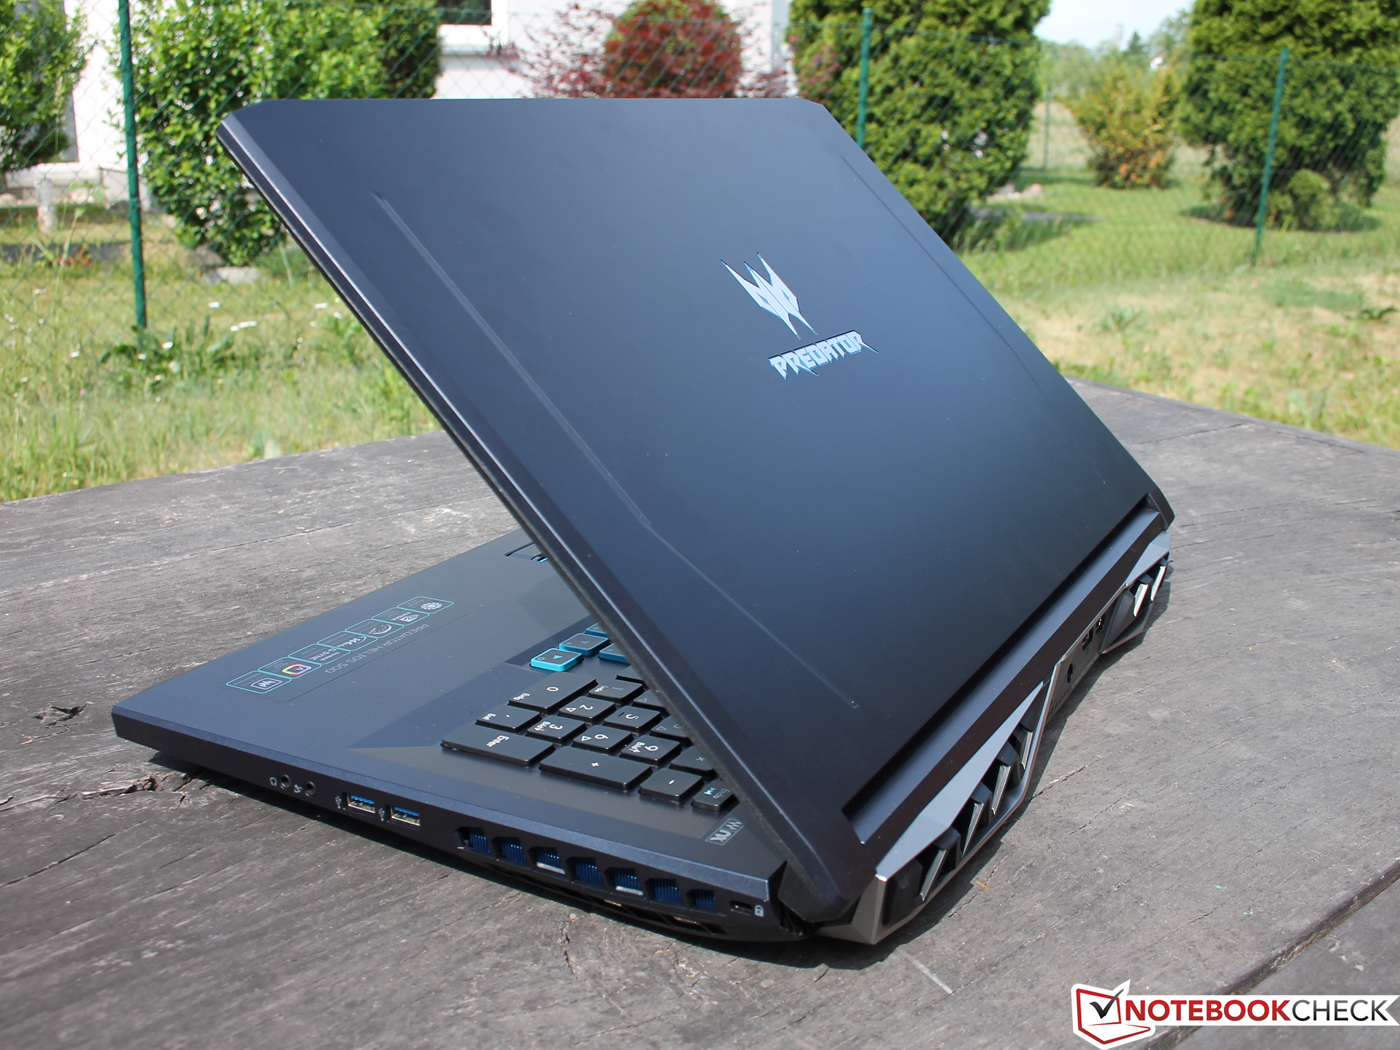
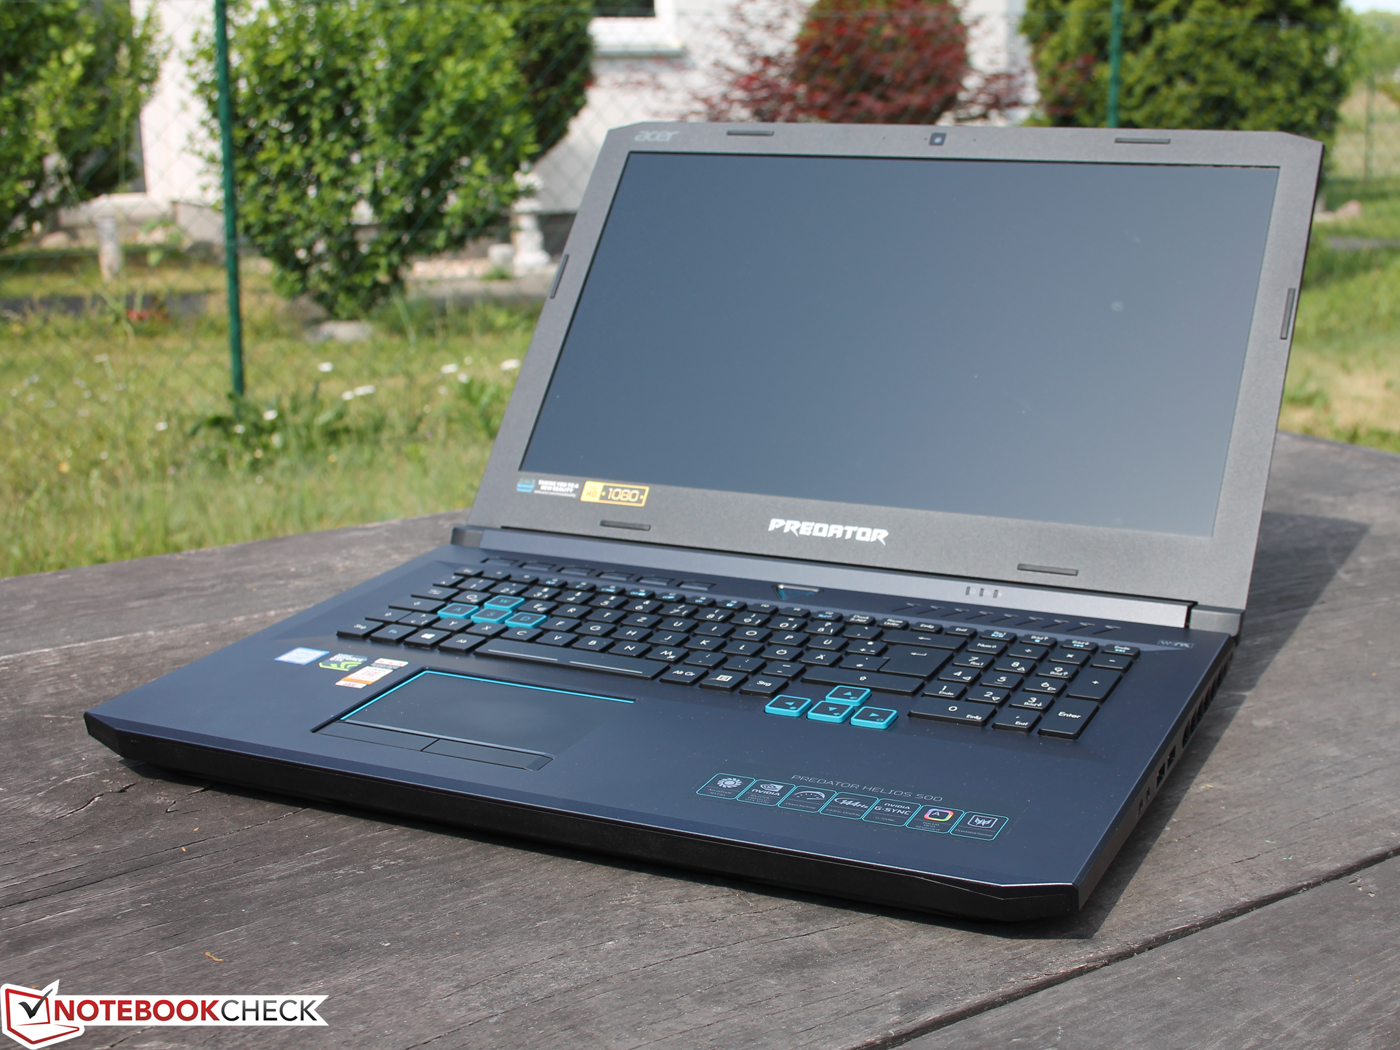
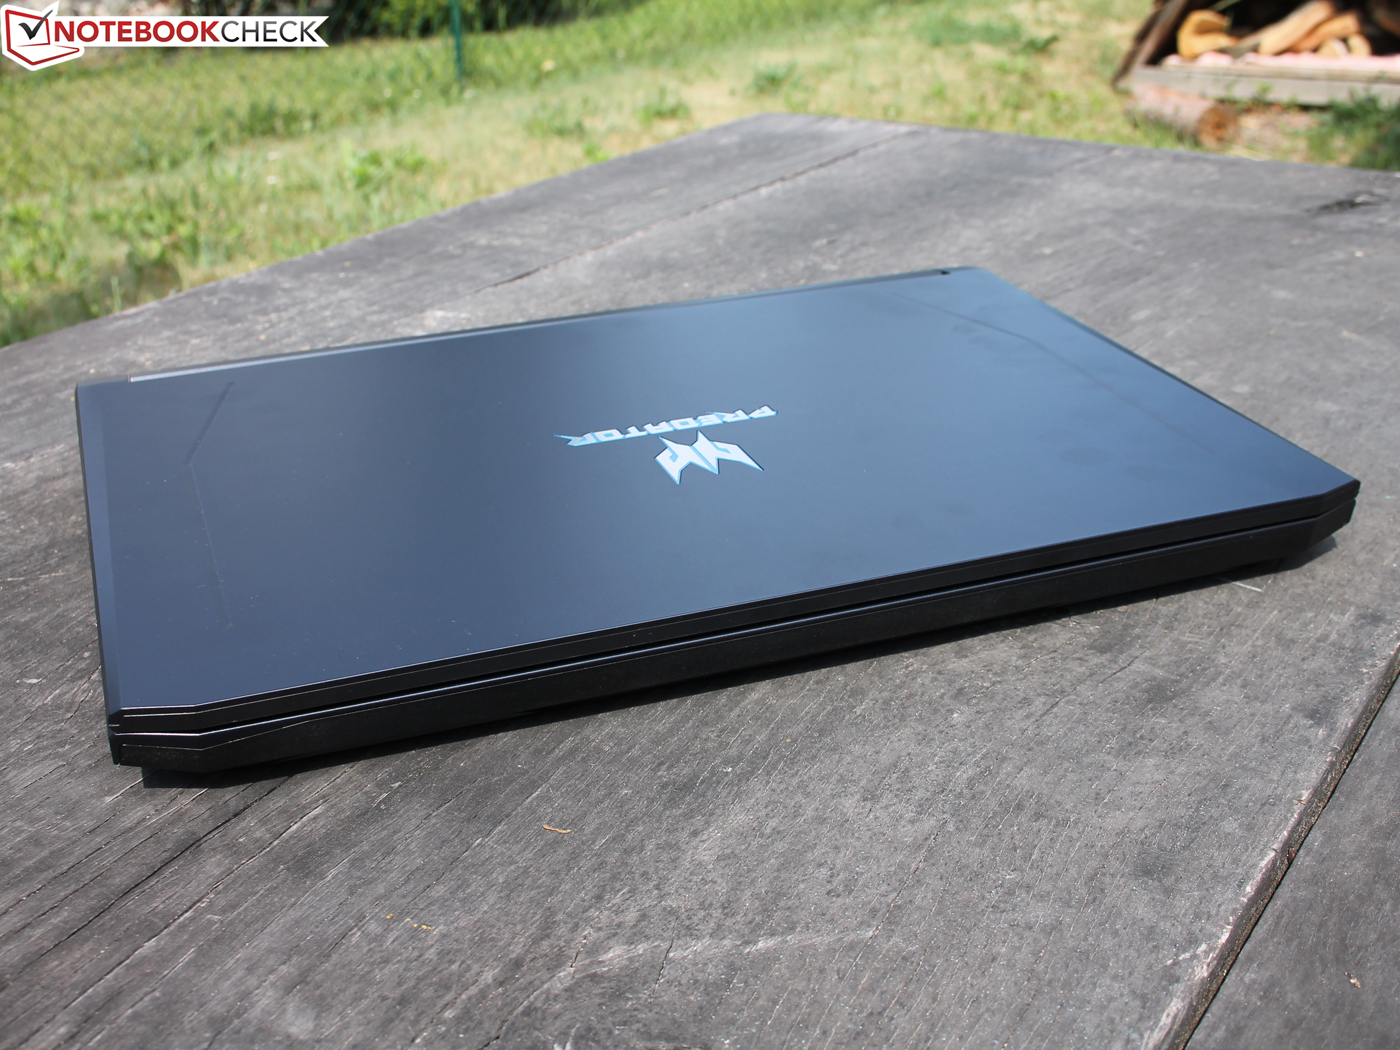
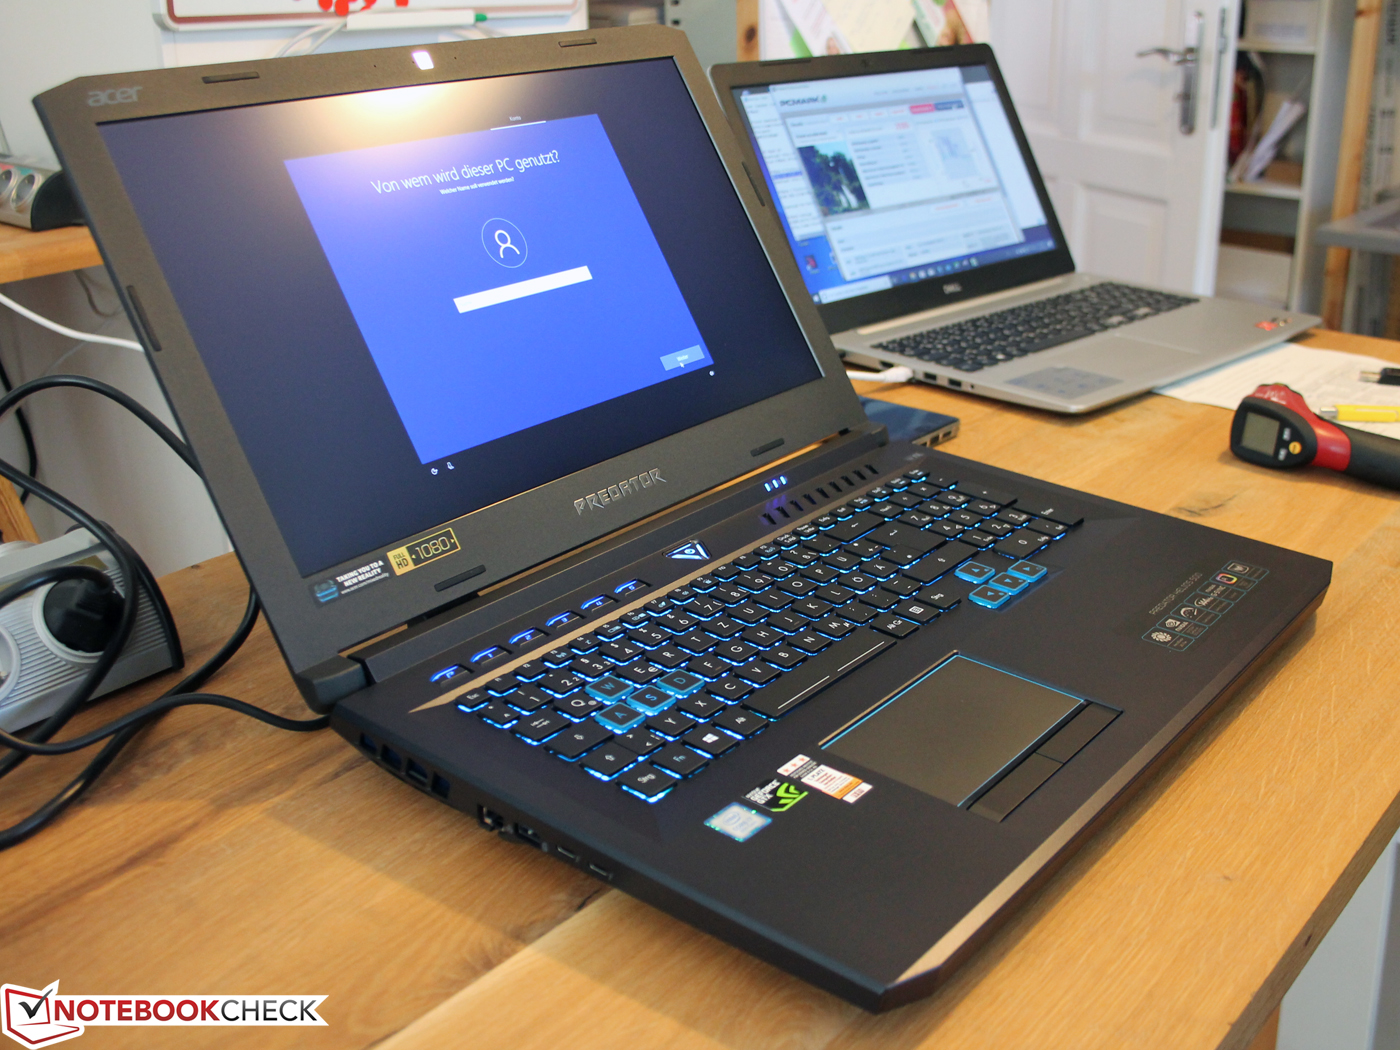
Az Acer Predator Helios 500 egy jól kialakított gamer erőgép, játékok terén több előnnyel, mint hátránnyal. Természetesen, még ez a 17 colos gép sem tökéletes, így részletes elemzése szükséges.
A kijelző például egyértelműen játékra készült. 144 Hz-es, nagyon gyors válaszidejű. A színhűsége kitűnő, legalábbis manuális kalibráció után. Az sRGB lefedettsége nem teljes, és az 500:1 kontrasztarány is túl alacsony. Ennek megfelelően a fekete némileg szürkének tűnik rajta.
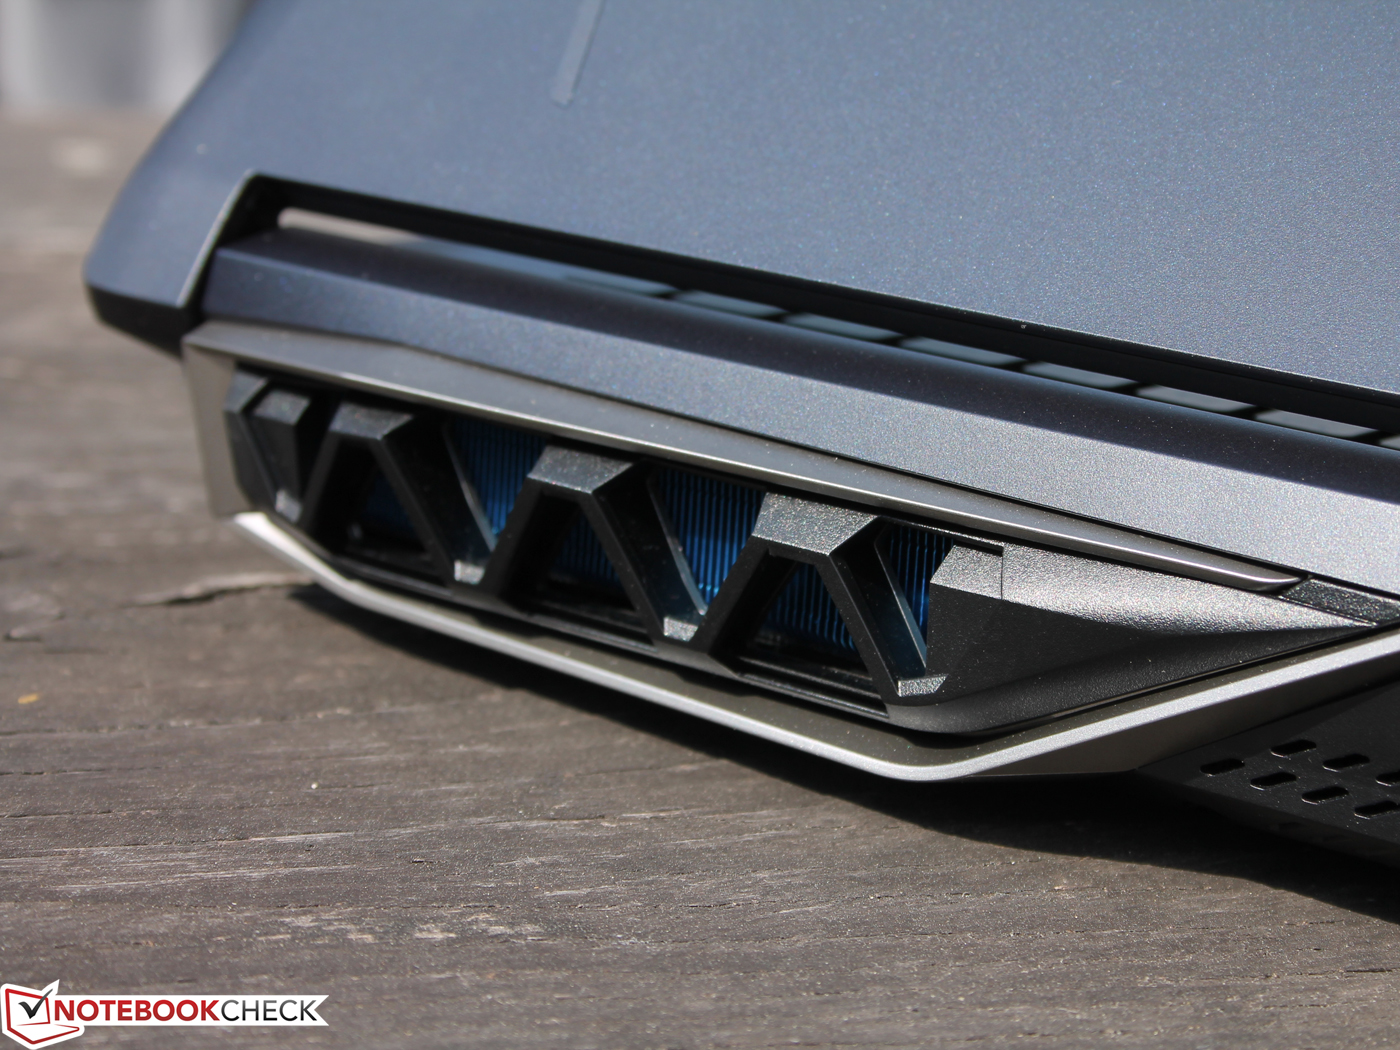
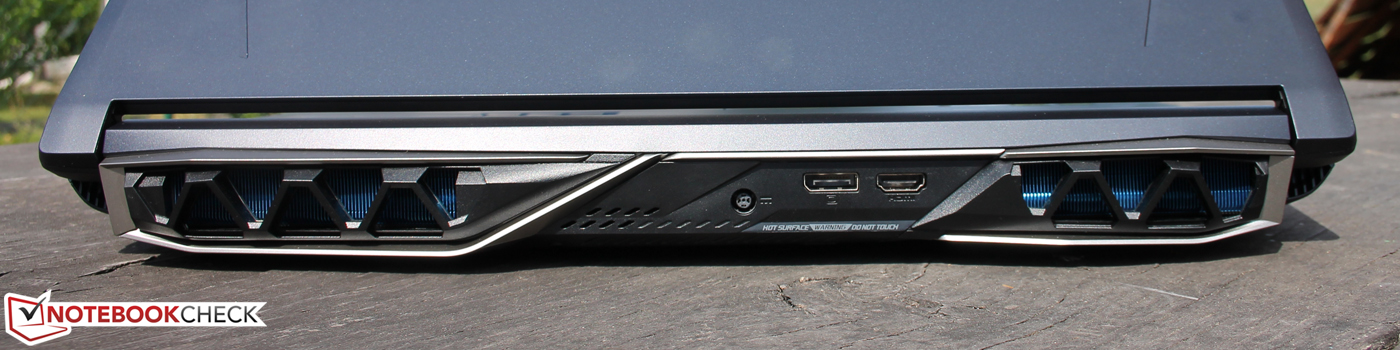
A gép teljesítményét figyelembe véve a kibocsátásai több, mint elfogadhatók voltak. A felhasználók választhatnak, hogy feljebb kapcsolják-e a hűtést (Cool Boost), illetve hogy kicsit tuningolnak-e a GPU-n (GPU turbo). Az automata ventilátorvezérléssel a gép elég halk volt ahhoz, hogy a legtöbb irodai környezetbe tökéletesen illeszkedjen, sőt a ventilátorok néha teljesen le is kapcsoltak.
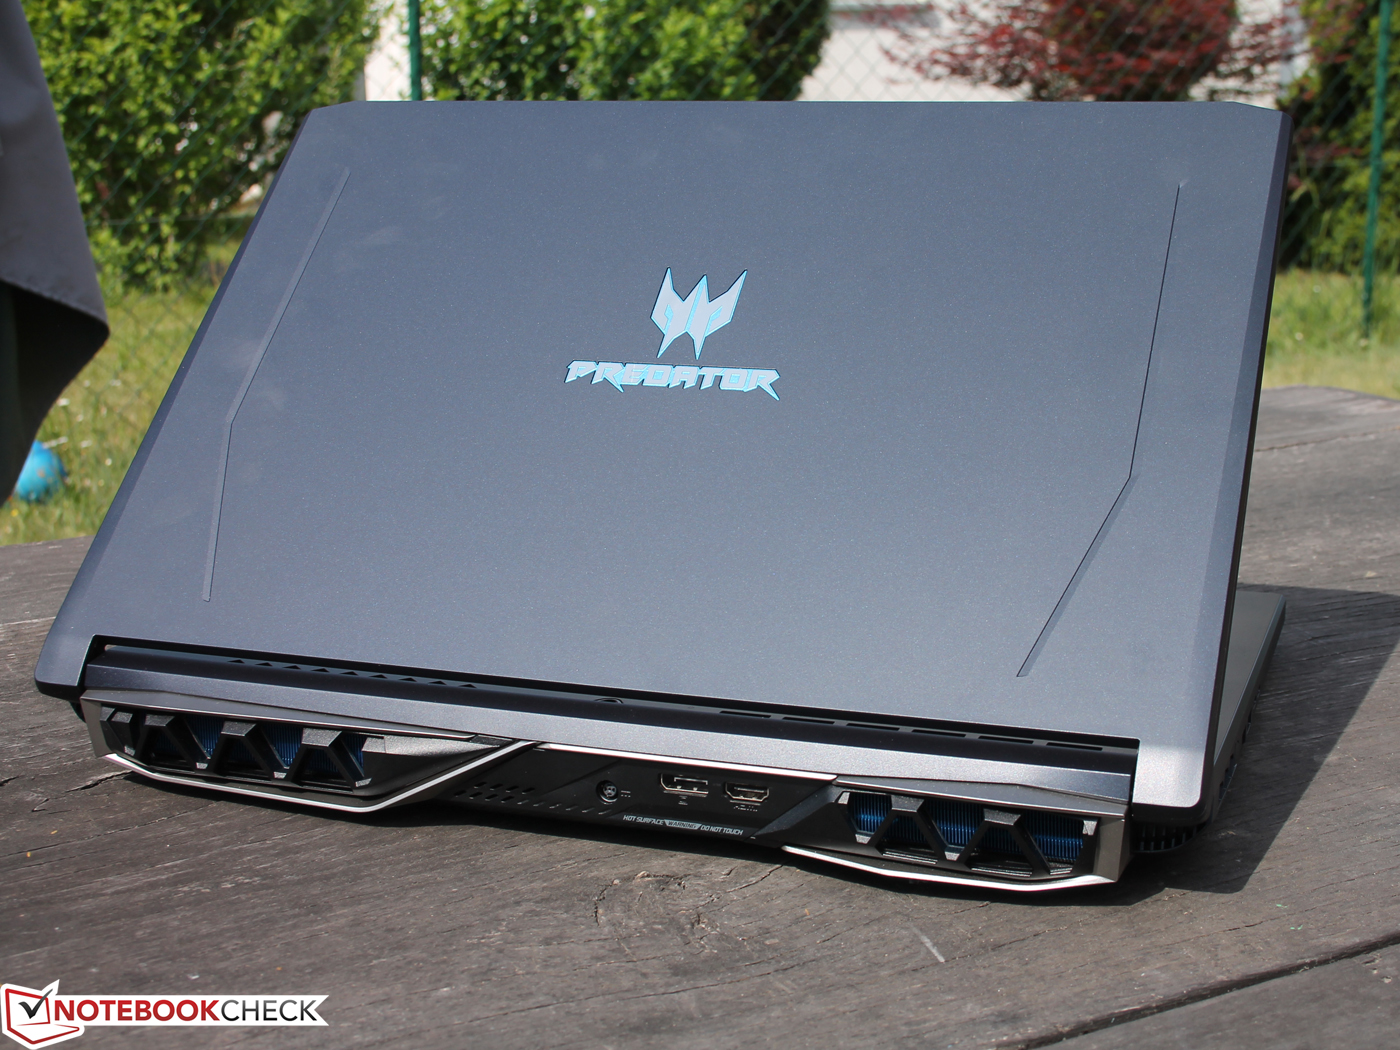
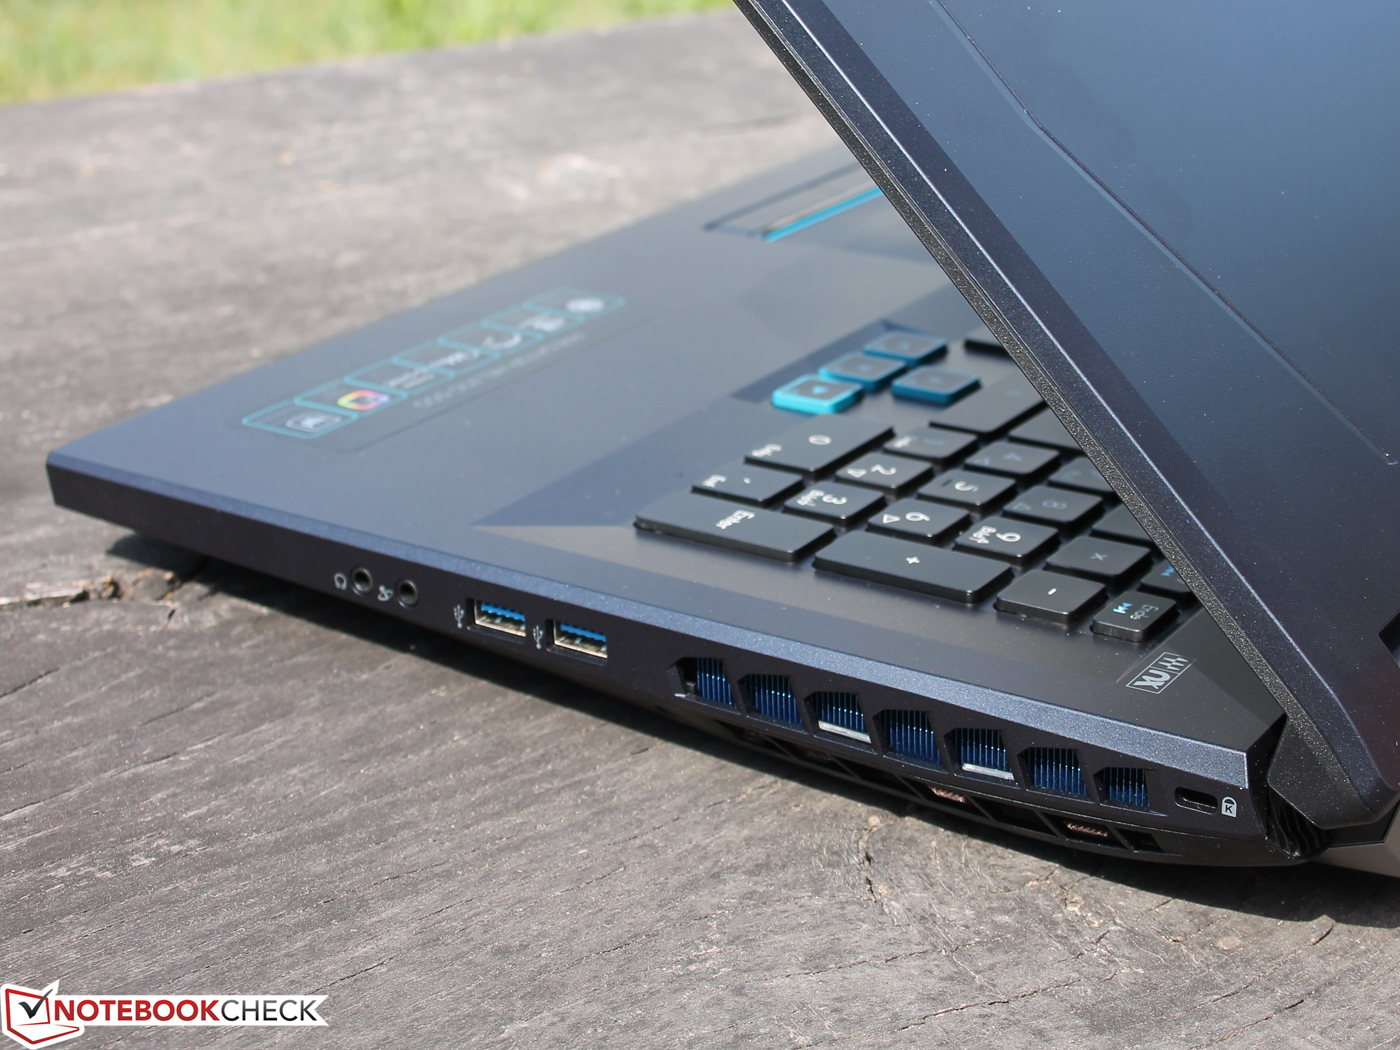
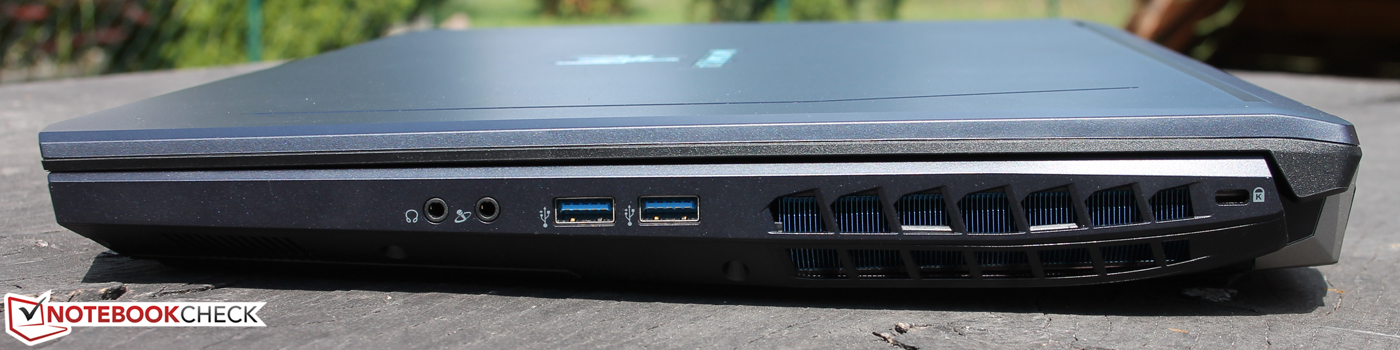
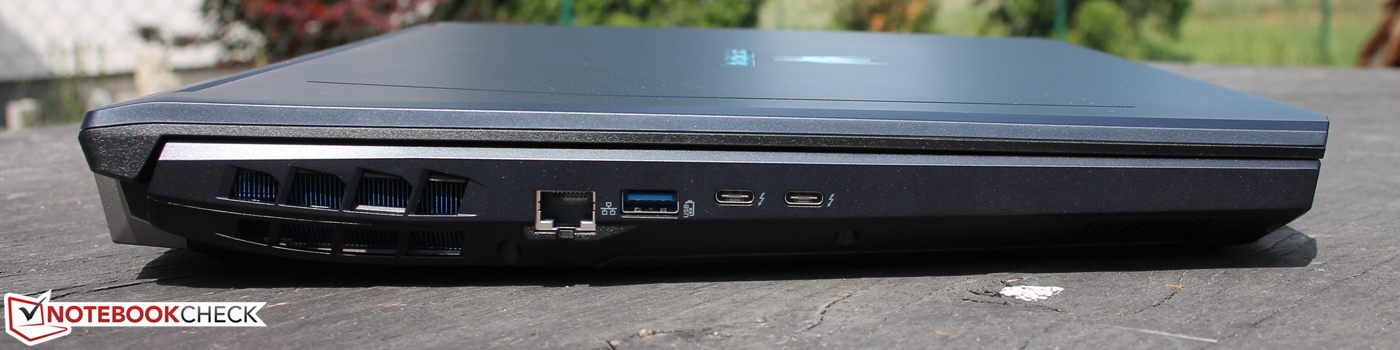
A kivitelezés minősége nem tökéletes, de a műanyag ház nagyjából elég merev. A két Thunderbolt 3 port különösen tetszett, az SD olvasó hiánya már nem annyira.
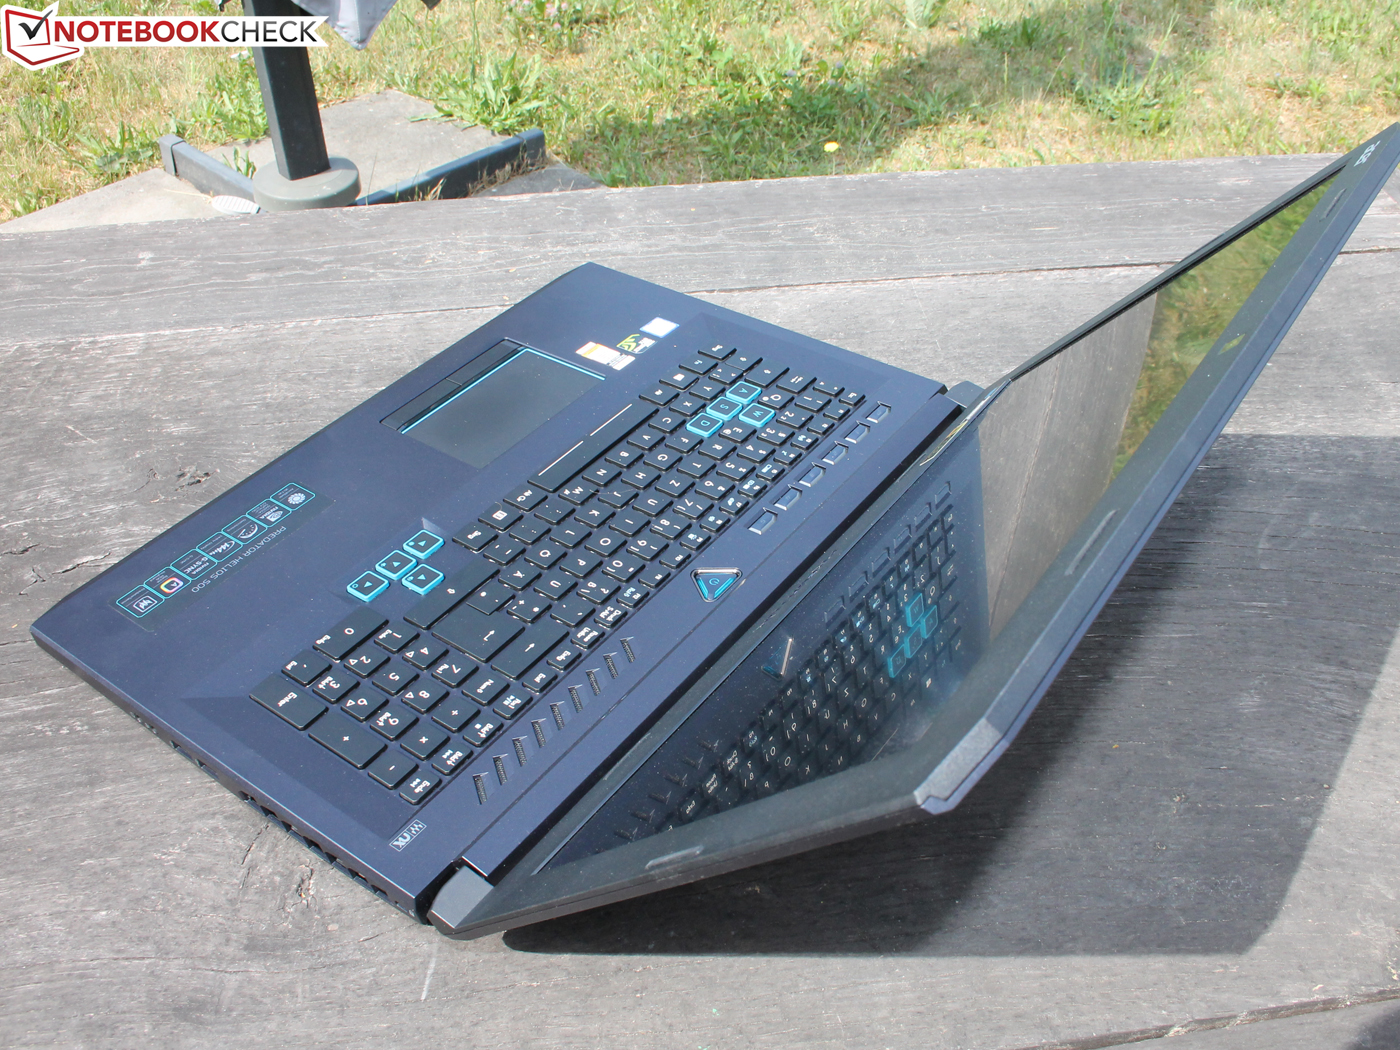
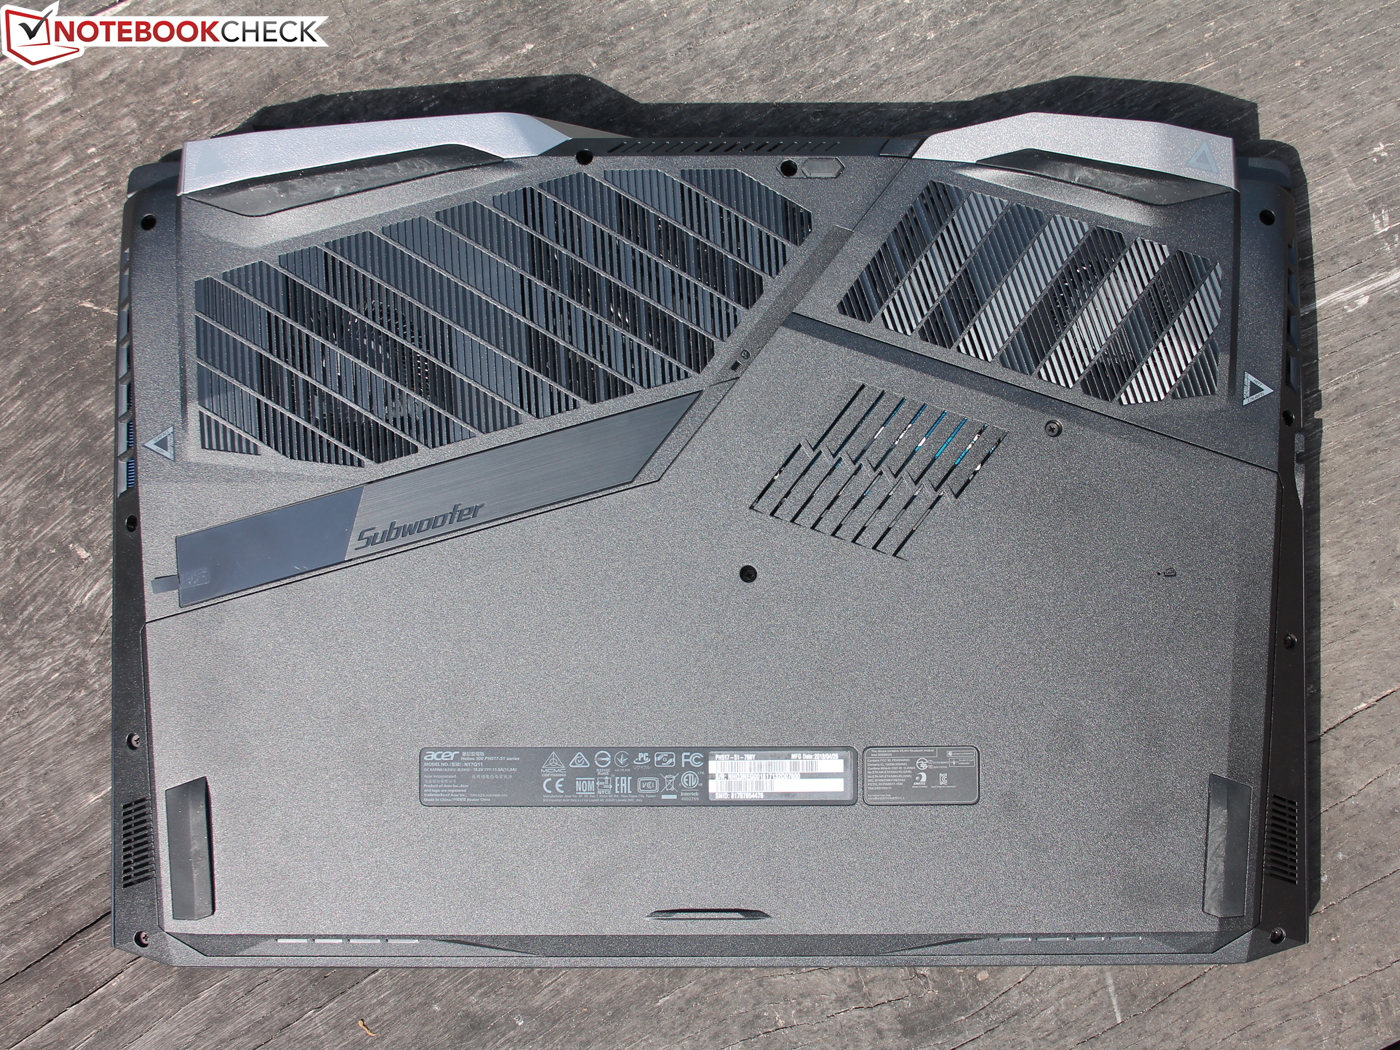
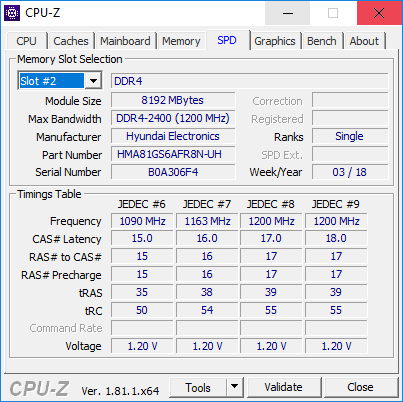
A karbantarthatósága remek, a bővíthetősége kitűnő. Egyebek között a RAM (max. 64 GB) és háttértár (2x M.2 SSD RAID, 2.5-inch HDD) is bővíthető. Az M.2 támogatás sajnos csak SATA, nem pedig a gyorsabb NVMe protokoll.
A hangrendszer remek, de nem olyan zseniális, mint nagy testvérén, a Predator 17-en. A háttérvilágításos beviteli eszközök megfelelők, és a gép teljesítményéhez képest a tömege sem vészes.
A notebook alapjárati áramfelvétele nagyon magas, a telep üzemideje pedig elég rövid. Sem a webkamera, sem a mikrofon nem illik egy ilyen árú laptopba, egy 400 dolláros gépbe valók lennének inkább.
Amennyiben ezeket a hátrányokat túl soknak ítéljük, vagy az árat magasnak találjuk, az Acer Predator Helios 300 is megér egy pillantást, amely kicsivel $1,000 (GTX 1050 Ti), illetve $1,300 (GTX 1060) feletti áron kapható. Az mindenesetre biztos, hogy a 300 a jelenleg tesztelt gépnél jobb energiahatékonyságú.
Hamarosan teszteljük Helios 500 más konfigurációit is, például a csúcsmodellt, amelyet az Intel Core i9-8950HK-val (2.9 - 4.8 GHz) szereltek fel.
Ez az eredeti értékelés rövidített változata. A teljes, angol nyelvű cikk itt olvasható.
Acer Predator Helios 500 PH517-51-79BY
- 05/29/2018 v6 (old)
Sebastian Jentsch
Price comparison
