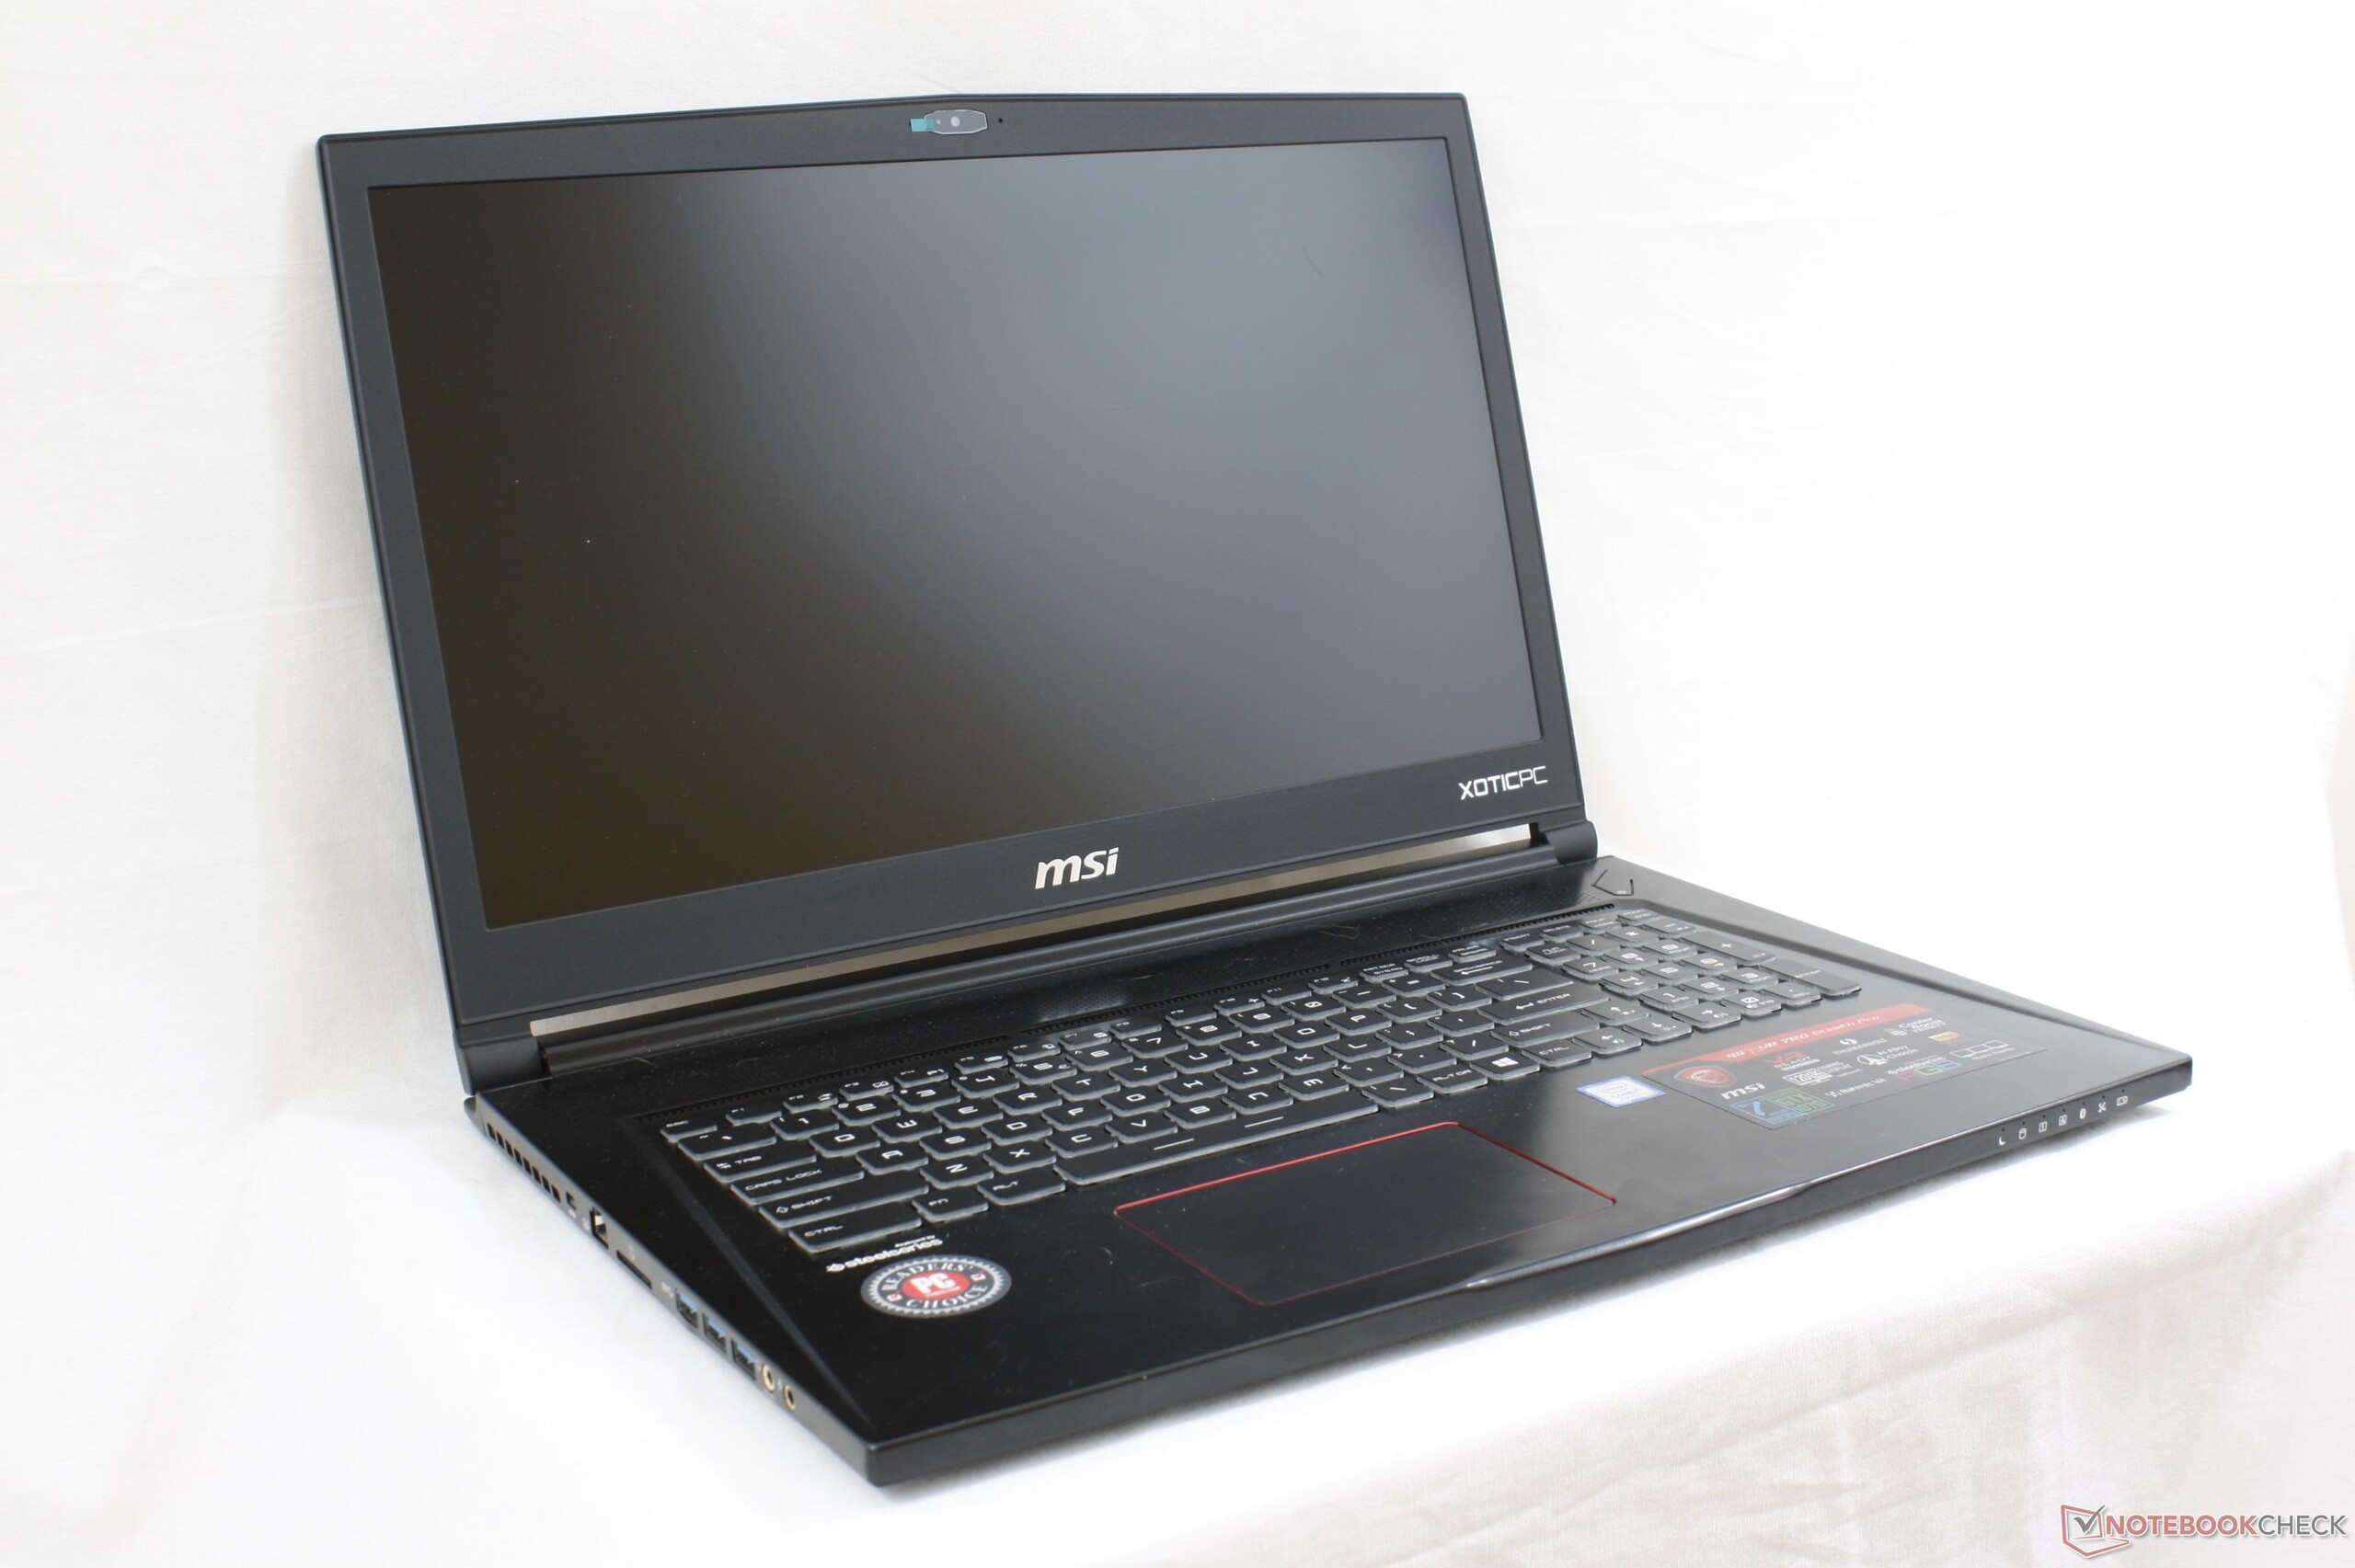
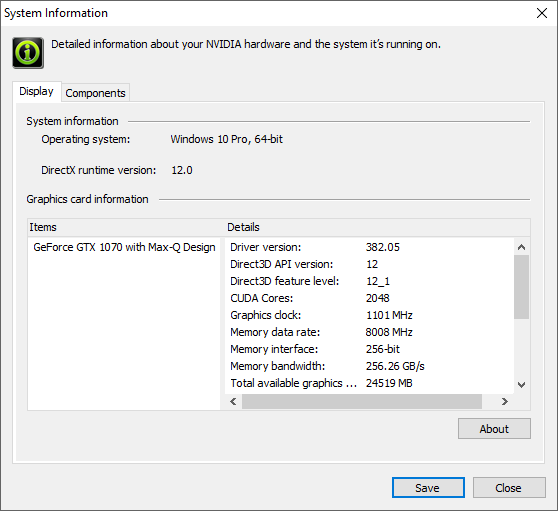
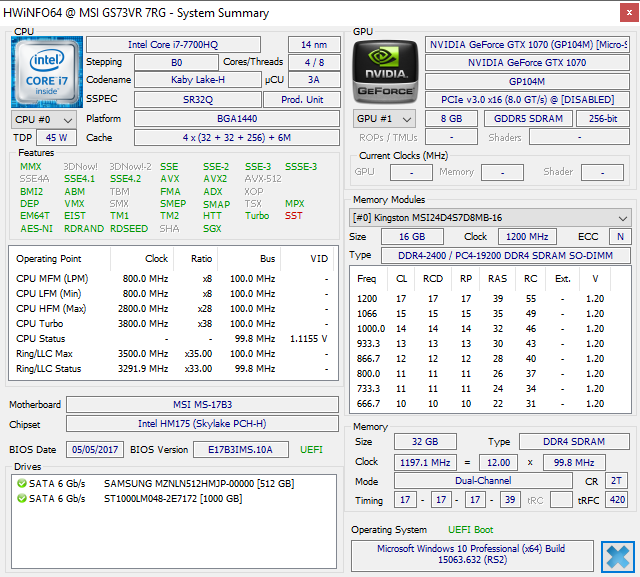
MSI GS73VR 7RG (i7-7700HQ, GTX 1070 Max-Q, FHD) Laptop rövid értékelés


| SD Card Reader | |
| average JPG Copy Test (av. of 3 runs) | |
| MSI GS73VR 7RG | |
| Eurocom Sky X7E2 | |
| MSI GS73VR 7RF | |
| maximum AS SSD Seq Read Test (1GB) | |
| Eurocom Sky X7E2 | |
| MSI GS73VR 7RG | |
| MSI GS73VR 7RF | |
| Networking | |
| iperf3 transmit AX12 | |
| MSI GT73VR 7RF-296 | |
| Aorus X7 v7 | |
| MSI GS73VR 7RG | |
| iperf3 receive AX12 | |
| MSI GT73VR 7RF-296 | |
| MSI GS73VR 7RG | |
| Aorus X7 v7 | |
| |||||||||||||||||||||||||
Fényerő megoszlás: 79 %
Centrumban: 350.9 cd/m²
Kontraszt: 1063:1 (Fekete: 0.33 cd/m²)
ΔE ColorChecker Calman: 7.7 | ∀{0.5-29.43 Ø4.71}
ΔE Greyscale Calman: 11.1 | ∀{0.09-98 Ø4.96}
100% sRGB (Argyll 1.6.3 3D)
77.74% AdobeRGB 1998 (Argyll 1.6.3 3D)
86.9% AdobeRGB 1998 (Argyll 3D)
100% sRGB (Argyll 3D)
89.6% Display P3 (Argyll 3D)
Gamma: 2.11
CCT: 11813 K
| MSI GS73VR 7RG ID: CMN1747, Name: Chi Mei N173HHE-G32, TN LED, 17.3", 1920x1080 | Lenovo Legion Y920-17IKB LP173WF4-SPF5, IPS, 17.3", 1920x1080 | Aorus X7 v7 AU Optronics B173QTN01.4 (AUO1496), TN LED, 17.3", 2560x1440 | Gigabyte P57X v7 SHP145E, IPS, 17.3", 3840x2160 | EVGA SC17 GTX 1070 Sharp LQ173D1JW31, IPS, 17.3", 3840x2160 | |
|---|---|---|---|---|---|
| Display | -24% | -23% | 4% | 4% | |
| Display P3 Coverage (%) | 89.6 | 66.4 -26% | 63 -30% | 87.8 -2% | 87.3 -3% |
| sRGB Coverage (%) | 100 | 84 -16% | 87.1 -13% | 100 0% | 100 0% |
| AdobeRGB 1998 Coverage (%) | 86.9 | 61.4 -29% | 63.7 -27% | 98.9 14% | 98.8 14% |
| Response Times | -99% | 14% | -297% | -206% | |
| Response Time Grey 50% / Grey 80% * (ms) | 23.6 ? | 28.8 ? -22% | 24 ? -2% | 55.6 ? -136% | 45.6 ? -93% |
| Response Time Black / White * (ms) | 8.4 ? | 23.2 ? -176% | 6 ? 29% | 46.8 ? -457% | 35.2 ? -319% |
| PWM Frequency (Hz) | 26040 ? | 20000 | 1000 ? | 1042 ? | |
| Screen | 9% | -3% | 17% | 17% | |
| Brightness middle (cd/m²) | 350.9 | 422.3 20% | 375 7% | 441.3 26% | 399.1 14% |
| Brightness (cd/m²) | 311 | 378 22% | 353 14% | 408 31% | 360 16% |
| Brightness Distribution (%) | 79 | 81 3% | 85 8% | 86 9% | 81 3% |
| Black Level * (cd/m²) | 0.33 | 0.48 -45% | 0.58 -76% | 0.44 -33% | 0.4 -21% |
| Contrast (:1) | 1063 | 880 -17% | 647 -39% | 1003 -6% | 998 -6% |
| Colorchecker dE 2000 * | 7.7 | 4.4 43% | 6.06 21% | 5.1 34% | 4.78 38% |
| Colorchecker dE 2000 max. * | 14.4 | 9.2 36% | 10.54 27% | 9.8 32% | 7.65 47% |
| Greyscale dE 2000 * | 11.1 | 2.8 75% | 5.68 49% | 4.3 61% | 3.8 66% |
| Gamma | 2.11 104% | 2.22 99% | 2.3 96% | 2.08 106% | 2.03 108% |
| CCT | 11813 55% | 6403 102% | 7998 81% | 7345 88% | 7288 89% |
| Color Space (Percent of AdobeRGB 1998) (%) | 77.74 | 55 -29% | 57 -27% | 87 12% | 86.9 12% |
| Color Space (Percent of sRGB) (%) | 100 | 84 -16% | 87 -13% | 100 0% | 100 0% |
| Teljes átlag (program / beállítások) | -38% /
-12% | -4% /
-5% | -92% /
-28% | -62% /
-15% |
* ... a kisebb jobb
Megjelenítési válaszidők
| ↔ Válaszidő Fekete-fehér | ||
|---|---|---|
| 8.4 ms ... emelkedés és süllyedés ↘ kombinálva | ↗ 6 ms emelkedés | 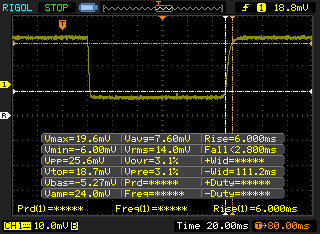 |
| ↘ 2.4 ms ősz | ||
| A képernyő gyors reakciósebességet mutat tesztjeinkben, és játékra is alkalmasnak kell lennie. Összehasonlításképpen, az összes tesztelt eszköz 0.1 (minimum) és 240 (maximum) ms között mozog. » 24 % of all devices are better. Ez azt jelenti, hogy a mért válaszidő jobb, mint az összes vizsgált eszköz átlaga (19.8 ms). | ||
| ↔ Válaszidő 50% szürke és 80% szürke között | ||
| 23.6 ms ... emelkedés és süllyedés ↘ kombinálva | ↗ 13.6 ms emelkedés | 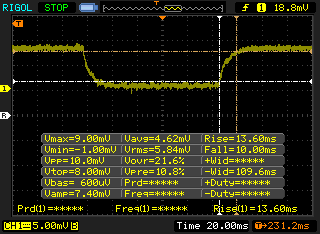 |
| ↘ 10 ms ősz | ||
| A képernyő jó reakciósebességet mutat tesztjeinkben, de túl lassú lehet a versenyképes játékosok számára. Összehasonlításképpen, az összes tesztelt eszköz 0.165 (minimum) és 636 (maximum) ms között mozog. » 34 % of all devices are better. Ez azt jelenti, hogy a mért válaszidő jobb, mint az összes vizsgált eszköz átlaga (31 ms). | ||
Képernyő villogása / PWM (impulzusszélesség-moduláció)
| Képernyő villogása / PWM észlelve | 26040 Hz | ≤ 10 % fényerő beállítása | 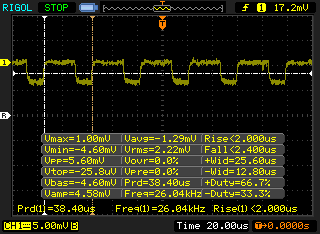 |
A kijelző háttérvilágítása 26040 Hz-en villog (a legrosszabb esetben, pl. PWM használatával) Villódzás észlelve a 10 % vagy annál kisebb fényerő-beállításnál. E fényerő-beállítás felett nem lehet villogás vagy PWM. A 26040 Hz frekvenciája meglehetősen magas, így a legtöbb PWM-re érzékeny felhasználó nem észlel semmilyen villogást. Összehasonlításképpen: az összes tesztelt eszköz 52 %-a nem használja a PWM-et a kijelző elsötétítésére. Ha PWM-et észleltek, akkor átlagosan 7754 (minimum: 5 - maximum: 343500) Hz-t mértek. | |||
| Cinebench R15 | |
| CPU Single 64Bit | |
| no name | |
| Eurocom Tornado F5 | |
| no name | |
| MSI GT75VR 7RF-012 Titan Pro | |
| MSI GS73VR 7RG | |
| Asus Zephyrus GX501VS | |
| Razer Blade (2016) FHD | |
| MSI GT80 Titan SLI | |
| Asus GL552JX-CN154H | |
| Toshiba Satellite S70-B-106 | |
| CPU Multi 64Bit | |
| no name | |
| no name | |
| Eurocom Tornado F5 | |
| MSI GT75VR 7RF-012 Titan Pro | |
| MSI GS73VR 7RG | |
| Asus Zephyrus GX501VS | |
| MSI GT80 Titan SLI | |
| Razer Blade (2016) FHD | |
| Asus GL552JX-CN154H | |
| Toshiba Satellite S70-B-106 | |
| Cinebench R11.5 | |
| CPU Single 64Bit | |
| no name | |
| Eurocom Tornado F5 | |
| no name | |
| MSI GS73VR 7RG | |
| MSI GT75VR 7RF-012 Titan Pro | |
| Asus Zephyrus GX501VS | |
| Razer Blade (2016) FHD | |
| MSI GT80 Titan SLI | |
| Asus GL552JX-CN154H | |
| Toshiba Satellite S70-B-106 | |
| CPU Multi 64Bit | |
| no name | |
| no name | |
| Eurocom Tornado F5 | |
| MSI GT75VR 7RF-012 Titan Pro | |
| MSI GS73VR 7RG | |
| Asus Zephyrus GX501VS | |
| MSI GT80 Titan SLI | |
| Razer Blade (2016) FHD | |
| Asus GL552JX-CN154H | |
| Toshiba Satellite S70-B-106 | |
| Cinebench R10 | |
| Rendering Multiple CPUs 32Bit | |
| no name | |
| no name | |
| Eurocom Tornado F5 | |
| MSI GS73VR 7RG | |
| Asus Zephyrus GX501VS | |
| MSI GT80 Titan SLI | |
| Razer Blade (2016) FHD | |
| Asus GL552JX-CN154H | |
| Rendering Single 32Bit | |
| no name | |
| Eurocom Tornado F5 | |
| no name | |
| MSI GS73VR 7RG | |
| Asus Zephyrus GX501VS | |
| MSI GT80 Titan SLI | |
| Razer Blade (2016) FHD | |
| Asus GL552JX-CN154H | |
| wPrime 2.10 - 1024m | |
| Asus Zephyrus GX501VS | |
| MSI GS73VR 7RG | |
| no name | |
| Eurocom Tornado F5 | |
| no name | |
* ... a kisebb jobb
| PCMark 8 | |
| Home Score Accelerated v2 | |
| Lenovo Legion Y920-17IKB | |
| EVGA SC17 GTX 1070 | |
| MSI GS73VR 7RG | |
| MSI GF72VR 7RF | |
| Work Score Accelerated v2 | |
| Lenovo Legion Y920-17IKB | |
| MSI GS73VR 7RG | |
| MSI GF72VR 7RF | |
| EVGA SC17 GTX 1070 | |
| Creative Score Accelerated v2 | |
| Lenovo Legion Y920-17IKB | |
| EVGA SC17 GTX 1070 | |
| MSI GS73VR 7RG | |
| MSI GF72VR 7RF | |
| PCMark 10 | |
| Digital Content Creation | |
| Lenovo Legion Y920-17IKB | |
| MSI GS73VR 7RG | |
| MSI GF72VR 7RF | |
| Productivity | |
| Lenovo Legion Y920-17IKB | |
| MSI GF72VR 7RF | |
| MSI GS73VR 7RG | |
| Essentials | |
| Lenovo Legion Y920-17IKB | |
| MSI GS73VR 7RG | |
| MSI GF72VR 7RF | |
| Score | |
| Lenovo Legion Y920-17IKB | |
| MSI GS73VR 7RG | |
| MSI GF72VR 7RF | |
| PCMark 8 Home Score Accelerated v2 | 4394 pontok | |
| PCMark 8 Creative Score Accelerated v2 | 5491 pontok | |
| PCMark 8 Work Score Accelerated v2 | 5215 pontok | |
| PCMark 10 Score | 4891 pontok | |
Segítség | ||
| MSI GS73VR 7RG Samsung SSD PM871 MZNLN512HMJP | Lenovo Legion Y920-17IKB Samsung SM961 MZVKW512HMJP m.2 PCI-e | Gigabyte P57X v7 Transcend MTS800 256GB M.2 (TS256GMTS800) | EVGA SC17 GTX 1070 Samsung SM951 MZVPV256 m.2 | MSI GT73VR 7RF-296 2x Samsung SM951 MZVPV256HDGL (RAID 0) | |
|---|---|---|---|---|---|
| AS SSD | 179% | -34% | 107% | 184% | |
| Copy Game MB/s (MB/s) | 381.5 | 1117 193% | 389.8 2% | 1034 171% | |
| Copy Program MB/s (MB/s) | 229.8 | 407.8 77% | 206.1 -10% | 470 105% | |
| Copy ISO MB/s (MB/s) | 423.5 | 1975 366% | 392.2 -7% | 1337 216% | |
| Score Total (Points) | 1064 | 3080 189% | 721 -32% | 2328 119% | 3310 211% |
| Score Write (Points) | 417 | 1506 261% | 249 -40% | 487 17% | 1054 153% |
| Score Read (Points) | 421 | 1072 155% | 314 -25% | 1238 194% | 1511 259% |
| Access Time Write * (ms) | 0.032 | 0.029 9% | 0.055 -72% | 0.033 -3% | 0.03 6% |
| Access Time Read * (ms) | 0.051 | 0.044 14% | 0.11 -116% | 0.049 4% | 0.035 31% |
| 4K-64 Write (MB/s) | 273.6 | 1220 346% | 151.4 -45% | 260.9 -5% | 697 155% |
| 4K-64 Read (MB/s) | 337.7 | 747 121% | 241.4 -29% | 999 196% | 1165 245% |
| 4K Write (MB/s) | 96.8 | 127.1 31% | 72 -26% | 112.1 16% | 123.8 28% |
| 4K Read (MB/s) | 33.69 | 48.23 43% | 23.65 -30% | 45.64 35% | 46.75 39% |
| Seq Write (MB/s) | 465.1 | 1589 242% | 260.9 -44% | 1144 146% | 2332 401% |
| Seq Read (MB/s) | 497.9 | 2768 456% | 491.9 -1% | 1934 288% | 2988 500% |
* ... a kisebb jobb

| 3DMark 11 Performance | 14903 pontok | |
| 3DMark Ice Storm Standard Score | 128787 pontok | |
| 3DMark Cloud Gate Standard Score | 27498 pontok | |
| 3DMark Fire Strike Score | 12077 pontok | |
| 3DMark Fire Strike Extreme Score | 6394 pontok | |
Segítség | ||
| Rise of the Tomb Raider - 1920x1080 Very High Preset AA:FX AF:16x | |
| Alienware 17 R4 | |
| Asus Zephyrus GX501 | |
| Nvidia GeForce GTX 1070 Founders Edition | |
| MSI GE73VR 7RF Raider | |
| Asus Zephyrus GX501VS | |
| MSI GS73VR 7RG | |
| MSI GS43VR 7RE-069US | |
| EVGA SC17 | |
| HP Omen 15-ce002ng | |
| Zotac ZBOX Magnus EN51050 | |
| BioShock Infinite - 1920x1080 Ultra Preset, DX11 (DDOF) | |
| Alienware 17 R4 | |
| Nvidia GeForce GTX 1070 Founders Edition | |
| MSI GE73VR 7RF Raider | |
| Asus Zephyrus GX501VS | |
| MSI GS73VR 7RG | |
| MSI GS43VR 7RE-069US | |
| EVGA SC17 | |
| Lenovo Legion Y520-15IKBN 80WK0042GE | |
| Zotac ZBOX Magnus EN51050 | |
| The Witcher 3 - 1920x1080 Ultra Graphics & Postprocessing (HBAO+) | |
| Alienware 17 R4 | |
| Nvidia GeForce GTX 1070 Founders Edition | |
| Asus Zephyrus GX501 | |
| MSI GE73VR 7RF Raider | |
| MSI GS73VR 7RG | |
| Asus Zephyrus GX501VS | |
| MSI GS43VR 7RE-069US | |
| HP Omen 15-ce002ng | |
| Lenovo Legion Y520-15IKBN 80WK0042GE | |
| Zotac ZBOX Magnus EN51050 | |
| alacsony | közepes | magas | ultra | |
|---|---|---|---|---|
| BioShock Infinite (2013) | 127.6 | |||
| Metro: Last Light (2013) | 96.1 | |||
| Thief (2014) | 93.3 | |||
| The Witcher 3 (2015) | 98.2 | 51.3 | ||
| Batman: Arkham Knight (2015) | 106 | 56 | ||
| Metal Gear Solid V (2015) | 60 | 60 | ||
| Fallout 4 (2015) | 88.3 | |||
| Rise of the Tomb Raider (2016) | 97.7 | 83.5 | ||
| Ashes of the Singularity (2016) | 67.5 | 63.5 | ||
| Overwatch (2016) | 138.1 | |||
| Mafia 3 (2016) | 55.1 | |||
| Prey (2017) | 132 | |||
| Dirt 4 (2017) | 115.4 | 72.8 | ||
| F1 2017 (2017) | 125 | 81 |
Zajszint
| Üresjárat |
| 29.4 / 30.7 / 34 dB(A) |
| Terhelés |
| 42 / 45.8 dB(A) |
 | ||
30 dB csendes 40 dB(A) hallható 50 dB(A) hangos |
||
min: | ||
| MSI GS73VR 7RG GeForce GTX 1070 Max-Q, i7-7700HQ, Samsung SSD PM871 MZNLN512HMJP | MSI GS73VR 6RF GeForce GTX 1060 Mobile, 6700HQ, SanDisk SD8SN8U1T001122 | Gigabyte P57X v7 GeForce GTX 1070 Mobile, i7-7700HQ, Transcend MTS800 256GB M.2 (TS256GMTS800) | EVGA SC17 GTX 1070 GeForce GTX 1070 Mobile, 6820HK, Samsung SM951 MZVPV256 m.2 | Alienware 17 R4 GeForce GTX 1080 Mobile, i7-7820HK, SK Hynix PC300 NVMe 512 GB | HP Omen 15-ce002ng GeForce GTX 1060 Max-Q, i7-7700HQ, Samsung PM961 MZVLW256HEHP | |
|---|---|---|---|---|---|---|
| Noise | -6% | -5% | -8% | -12% | -3% | |
| off / környezet * (dB) | 28 | 28.4 -1% | 29 -4% | 29.2 -4% | 28.2 -1% | 30 -7% |
| Idle Minimum * (dB) | 29.4 | 31.9 -9% | 30.4 -3% | 33.9 -15% | 35.6 -21% | 30 -2% |
| Idle Average * (dB) | 30.7 | 32 -4% | 32.1 -5% | 33.9 -10% | 35.6 -16% | 33 -7% |
| Idle Maximum * (dB) | 34 | 34 -0% | 32.1 6% | 33.9 -0% | 35.7 -5% | 37 -9% |
| Load Average * (dB) | 42 | 47 -12% | 45.6 -9% | 43.8 -4% | 50.2 -20% | 41 2% |
| Witcher 3 ultra * (dB) | 45.8 | 50.2 -10% | 42 8% | |||
| Load Maximum * (dB) | 45.8 | 49.4 -8% | 51.5 -12% | 53.4 -17% | 50.2 -10% | 50 -9% |
* ... a kisebb jobb
(-) A felső oldalon a maximális hőmérséklet 52.2 °C / 126 F, összehasonlítva a 40.4 °C / 105 F átlagával , 21.2 és 68.8 °C között a Gaming osztálynál.
(-) Az alsó maximum 46.6 °C / 116 F-ig melegszik fel, összehasonlítva a 43.2 °C / 110 F átlagával
(+) Üresjáratban a felső oldal átlagos hőmérséklete 28.7 °C / 84 F, összehasonlítva a 33.9 °C / ### eszközátlaggal class_avg_f### F.
(-) A The Witcher 3 játék során a felső oldal átlaghőmérséklete 38.4 °C / 101 F, összehasonlítva a 33.9 °C / ## eszközátlaggal #class_avg_f### F.
(+) A csuklótámasz és az érintőpad eléri a bőr maximális hőmérsékletét (33.6 °C / 92.5 F), ezért nem forrók.
(-) A hasonló eszközök csuklótámasz területének átlagos hőmérséklete 28.8 °C / 83.8 F volt (-4.8 °C / -8.7 F).
MSI GS73VR 7RG hangelemzés
(-) | nem túl hangos hangszórók (71.6 dB)
Basszus 100 - 315 Hz
(-) | szinte nincs basszus – átlagosan 20.4%-kal alacsonyabb a mediánnál
(+) | a basszus lineáris (5.7% delta az előző frekvenciához)
Közepes 400-2000 Hz
(±) | magasabb középértékek – átlagosan 10%-kal magasabb, mint a medián
(±) | a középpontok linearitása átlagos (13.2% delta az előző gyakorisághoz)
Maximum 2-16 kHz
(+) | kiegyensúlyozott csúcsok – csak 3.4% választja el a mediántól
(±) | a csúcsok linearitása átlagos (14.9% delta az előző gyakorisághoz)
Összességében 100 - 16.000 Hz
(-) | az összhang nem lineáris (34.7% eltérés a mediánhoz képest)
Ugyanazon osztályhoz képest
» 99%Ebben az osztályban az összes tesztelt eszköz %-a jobb volt, 1% hasonló, 1%-kal rosszabb
» A legjobb delta értéke 6%, az átlag 18%, a legrosszabb 132% volt
Az összes tesztelt eszközzel összehasonlítva
» 93% az összes tesztelt eszköz jobb volt, 1% hasonló, 6%-kal rosszabb
» A legjobb delta értéke 4%, az átlag 23%, a legrosszabb 134% volt
Apple MacBook 12 (Early 2016) 1.1 GHz hangelemzés
(+) | a hangszórók viszonylag hangosan tudnak játszani (83.6 dB)
Basszus 100 - 315 Hz
(±) | csökkentett basszus – átlagosan 11.3%-kal alacsonyabb, mint a medián
(±) | a basszus linearitása átlagos (14.2% delta az előző frekvenciához)
Közepes 400-2000 Hz
(+) | kiegyensúlyozott középpontok – csak 2.4% választja el a mediántól
(+) | a középpontok lineárisak (5.5% delta az előző frekvenciához)
Maximum 2-16 kHz
(+) | kiegyensúlyozott csúcsok – csak 2% választja el a mediántól
(+) | a csúcsok lineárisak (4.5% delta az előző frekvenciához képest)
Összességében 100 - 16.000 Hz
(+) | általános hangzás lineáris (10.2% eltérés a mediánhoz képest)
Ugyanazon osztályhoz képest
» 7%Ebben az osztályban az összes tesztelt eszköz %-a jobb volt, 2% hasonló, 90%-kal rosszabb
» A legjobb delta értéke 5%, az átlag 18%, a legrosszabb 53% volt
Az összes tesztelt eszközzel összehasonlítva
» 5% az összes tesztelt eszköz jobb volt, 1% hasonló, 94%-kal rosszabb
» A legjobb delta értéke 4%, az átlag 23%, a legrosszabb 134% volt
| Kikapcsolt állapot / Készenlét | |
| Üresjárat | |
| Terhelés |
|
Kulcs:
min: | |
| MSI GS73VR 7RG i7-7700HQ, GeForce GTX 1070 Max-Q, Samsung SSD PM871 MZNLN512HMJP, TN LED, 1920x1080, 17.3" | MSI GF72VR 7RF i7-7700HQ, GeForce GTX 1060 Mobile, Samsung PM961 MZVLW256HEHP, TN LED, 1920x1080, 17.3" | Gigabyte Aero 15X i7-7700HQ, GeForce GTX 1070 Max-Q, Samsung SM961 MZVKW512HMJP m.2 PCI-e, IPS, 1920x1080, 15.6" | Alienware 17 R4 i7-7820HK, GeForce GTX 1080 Mobile, SK Hynix PC300 NVMe 512 GB, TN LED, 2560x1440, 17.3" | MSI GE73VR 7RF Raider i7-7700HQ, GeForce GTX 1070 Mobile, Toshiba HG6 THNSNJ256G8NY, TN WLED, 1920x1080, 17.3" | |
|---|---|---|---|---|---|
| Power Consumption | -13% | 8% | -102% | -20% | |
| Idle Minimum * (Watt) | 10.1 | 15.7 -55% | 10 1% | 37.5 -271% | 10 1% |
| Idle Average * (Watt) | 18.3 | 21.4 -17% | 13 29% | 37.6 -105% | 18 2% |
| Idle Maximum * (Watt) | 19.6 | 21.9 -12% | 20 -2% | 37.6 -92% | 26 -33% |
| Load Average * (Watt) | 87.6 | 83.9 4% | 79 10% | 122.4 -40% | 97 -11% |
| Witcher 3 ultra * (Watt) | 136.3 | 130.2 4% | 120 12% | 180.3 -32% | 183 -34% |
| Load Maximum * (Watt) | 160.7 | 159.6 1% | 165 -3% | 277.4 -73% | 230 -43% |
* ... a kisebb jobb
| MSI GS73VR 7RG i7-7700HQ, GeForce GTX 1070 Max-Q, 51 Wh | Aorus X7 v7 i7-7820HK, GeForce GTX 1070 Mobile, 94 Wh | MSI GF72VR 7RF i7-7700HQ, GeForce GTX 1060 Mobile, 43 Wh | Gigabyte Aero 15X i7-7700HQ, GeForce GTX 1070 Max-Q, 94.2 Wh | Alienware 17 R4 i7-7820HK, GeForce GTX 1080 Mobile, 99 Wh | Lenovo Legion Y920-17IKB i7-7820HK, GeForce GTX 1070 Mobile, 90 Wh | |
|---|---|---|---|---|---|---|
| Akkumulátor üzemidő | -1% | -32% | 147% | -2% | 50% | |
| Reader / Idle (h) | 5.8 | 3.7 -36% | 3.4 -41% | 13 124% | 4.6 -21% | 5.9 2% |
| WiFi v1.3 (h) | 3.2 | 3 -6% | 2.4 -25% | 8.2 156% | 3 -6% | 4.7 47% |
| Load (h) | 1 | 1.4 40% | 0.7 -30% | 2.6 160% | 1.2 20% | 2 100% |
Pro
Kontra

A GS73VR Max-Q frissítése a széria eddigi legjobbja. Nem csak jobban teljesít, mint a korábbi, GTX 1060-as konfig, hasonló fogyasztás mellett, de csendesebben működik, és kevésbé melegszik. Ez pontosan az az irány, amerre a GS sorozatnak tartania kell, ha meg akarja verni a többi szupervékony gamer notebookot.
Bár a GS73VR 7RG jelentősen jobb, mint a GS73VR 7RF és 6RF, még mindig hosszú út áll előtte. Az 7RG az egyik leghangosabb Max-Q notebook, amelyet teszteltünk, hasonló a Eurocom Q5-höz. Annyira közel sem zajos, mint mondjuk az Alienware 17 vagy Eurocom Tornado F5, de a "Max-Q GTX" és "szabvány GTX" között egyensúlyoz, és szerintünk túlságosan az utóbbi felé dől. Az Asus Zephyrus kisebb, és mégis sokkal halkabb, miközben egy GTX 1080 Max-Q dolgozik benne.
A fentebb említett előnyök mellett, az előző GS73VR iterációk jellemzői köszönnek vissza itt is. A ház lehetne stabilabb, a trackpad határozottabb, és a szerelési minőség általában lehetne jobb. Még mindig érthetetlen, hogy az alsó burkolat megbontása miért garanciavesztő, hiszen a HDD cseréje amúgy nem egy összetett feladat. A 120 Hz-es kijelző és a SteelSeries billentyűzet viszont nagyon szimpatikusak.
Ez a GS73VR jelenleg kapható legcsendesebb és legerősebb változata. Összességében, azért vannak erősebb, és csendesebb Max-Q notebookok, főleg a 15 inches tartományban, ahol jelenleg a Zephyrus GX501 és a Predator Triton a királyok.
Ez az eredeti értékelés rövidített változata. A teljes, angol nyelvű cikk itt olvasható.
MSI GS73VR 7RG
- 10/19/2017 v6 (old)
Allen Ngo
Price comparison
