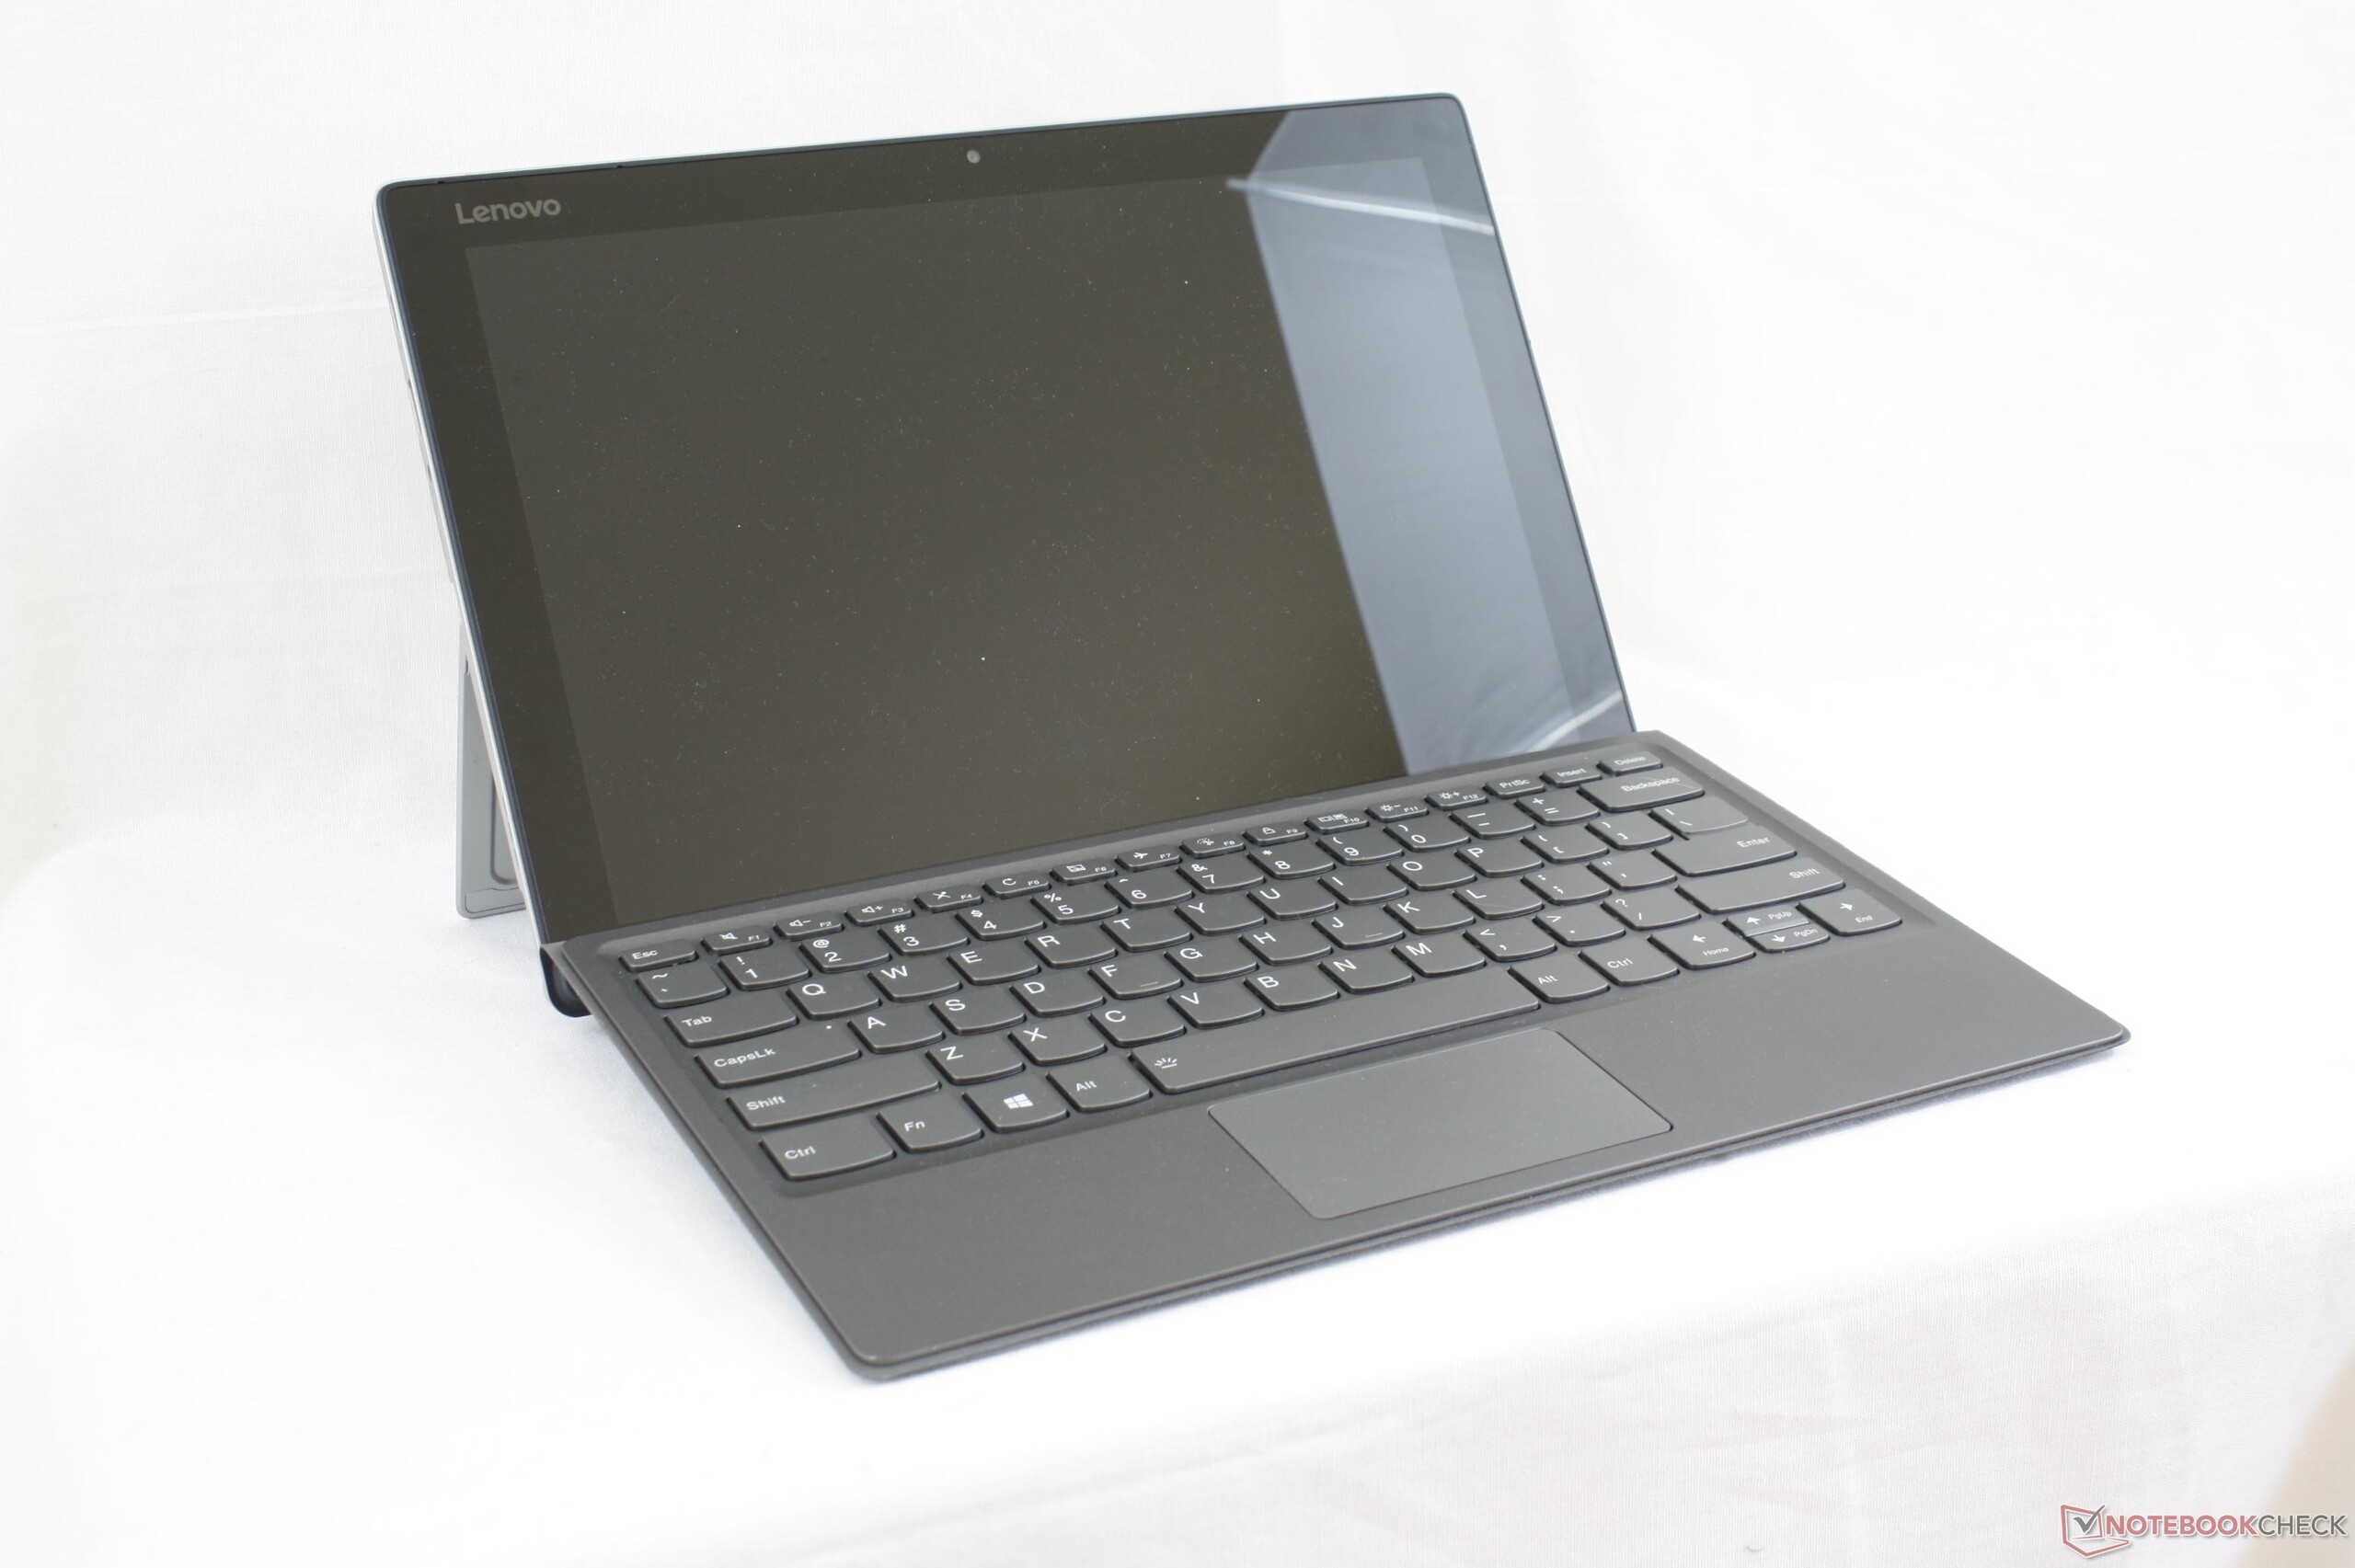
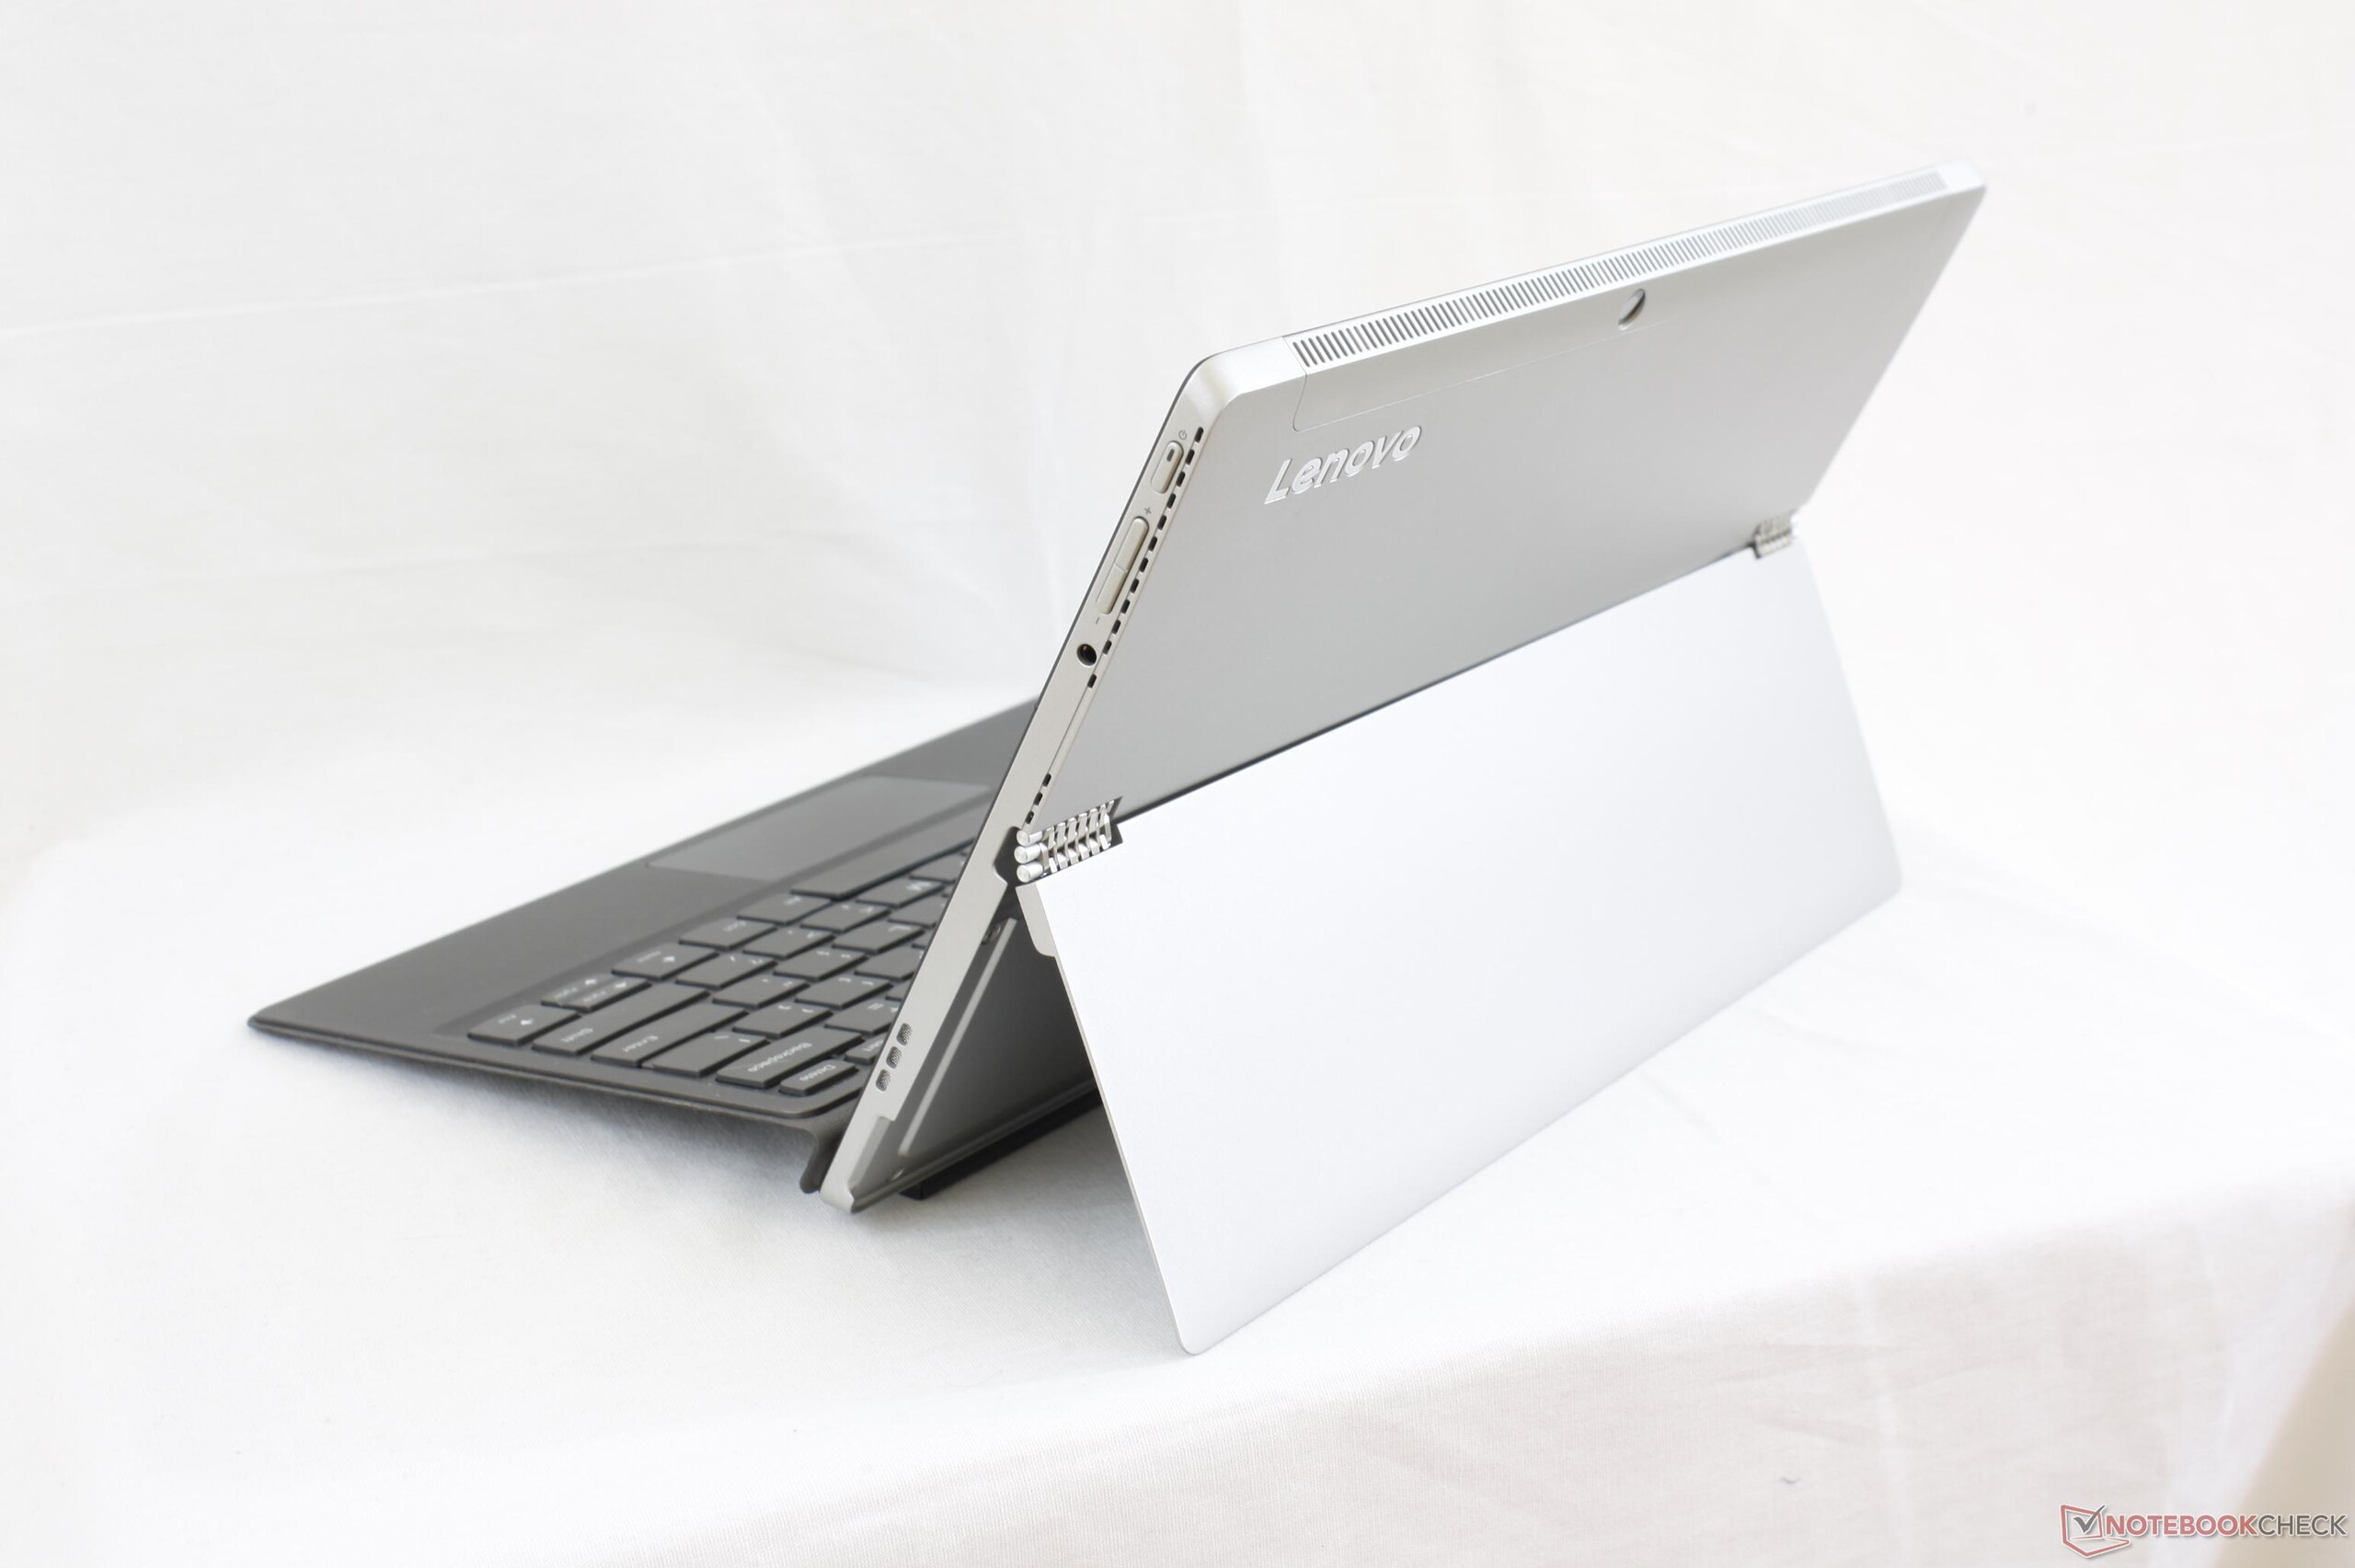
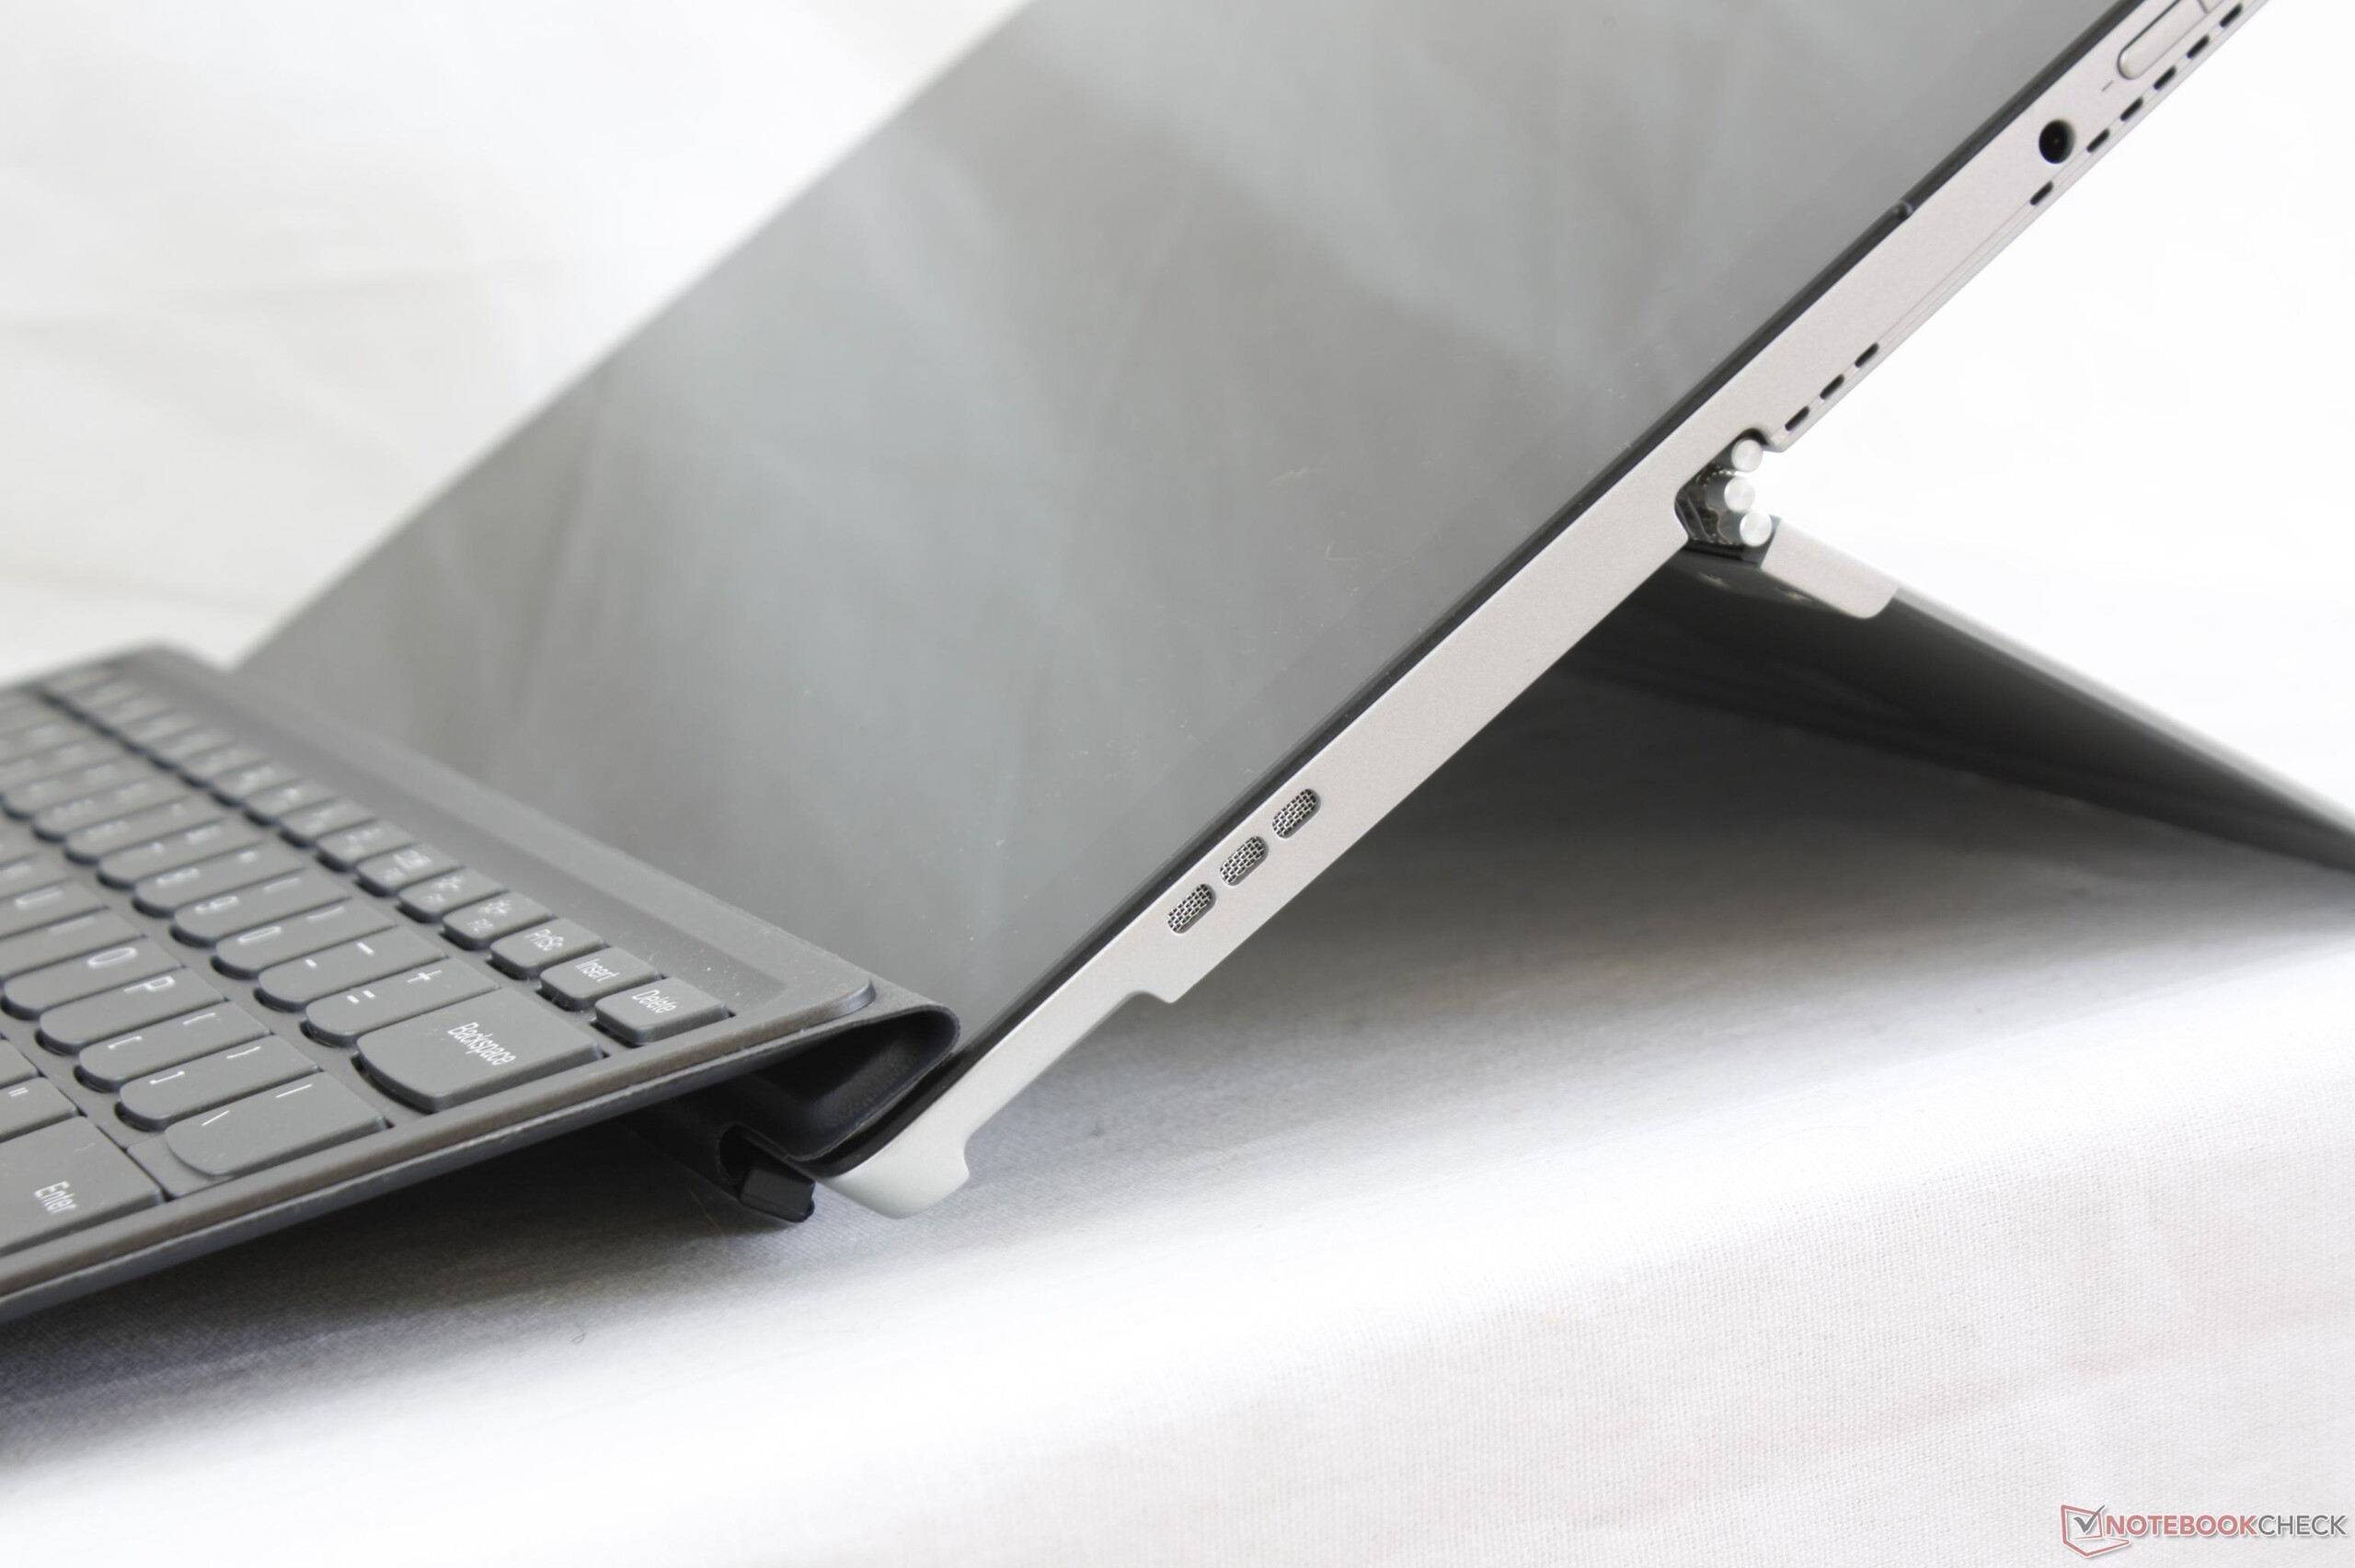
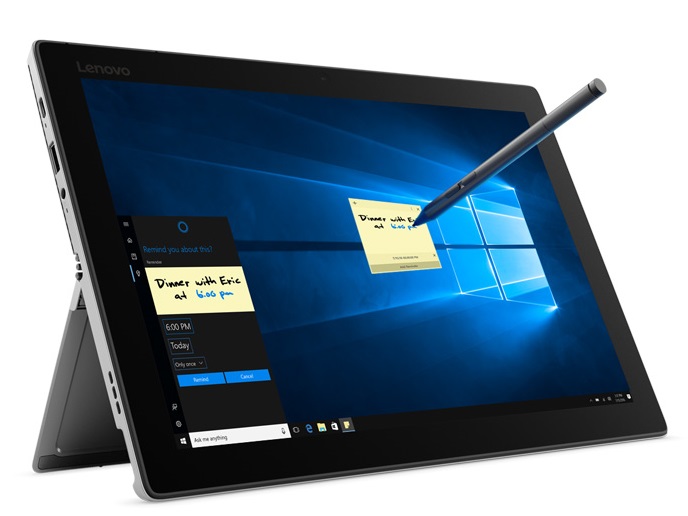
Lenovo Miix 520 (i5-8250U, FHD) Convertible rövid értékelés
| SD Card Reader | |
| average JPG Copy Test (av. of 3 runs) | |
| HP Elite x2 1012 G2-1LV76EA | |
| Lenovo Miix 520-12IKB 81CG | |
| Lenovo ThinkPad X1 Tablet Gen 2 | |
| maximum AS SSD Seq Read Test (1GB) | |
| Lenovo ThinkPad X1 Tablet Gen 2 | |
| HP Elite x2 1012 G2-1LV76EA | |
| Lenovo Miix 520-12IKB 81CG | |
| Networking | |
| iperf3 transmit AX12 | |
| Lenovo Miix 520-12IKB 81CG | |
| Lenovo Miix 510 Pro 80U10006GE (jseb) | |
| Dell XPS 13-9365 2-in-1 | |
| HP Elite x2 1012 G2-1LV76EA | |
| iperf3 receive AX12 | |
| Lenovo Miix 510 Pro 80U10006GE (jseb) | |
| HP Elite x2 1012 G2-1LV76EA | |
| Lenovo Miix 520-12IKB 81CG | |
| Dell XPS 13-9365 2-in-1 | |
| |||||||||||||||||||||||||
Fényerő megoszlás: 87 %
Centrumban: 348.8 cd/m²
Kontraszt: 872:1 (Fekete: 0.4 cd/m²)
ΔE ColorChecker Calman: 7 | ∀{0.5-29.43 Ø4.73}
ΔE Greyscale Calman: 10.1 | ∀{0.09-98 Ø4.97}
90.9% sRGB (Argyll 1.6.3 3D)
58.7% AdobeRGB 1998 (Argyll 1.6.3 3D)
65.4% AdobeRGB 1998 (Argyll 3D)
90.8% sRGB (Argyll 3D)
64.4% Display P3 (Argyll 3D)
Gamma: 2.22
CCT: 9065 K
| Lenovo Miix 520-12IKB 81CG Unknown, IPS, 12.2", 1920x1200 | Microsoft Surface Pro (2017) m3 LG Display LP123WQ112604, IPS, 12.3", 2736x1826 | Lenovo Miix 510 Pro 80U10006GE Unknown, IPS, 12.2", 1920x1200 | HP Elite x2 1012 G2-1LV76EA Samsung SDC4A49, IPS, 12.3", 2716x1824 | Dell XPS 13 9365-4537 2-in-1 Sharp LQ133Z1, IPS, 13.3", 3200x1800 | Lenovo ThinkPad X1 Tablet Gen 2 LSN120QL01L01, IPS, 12", 2160x1440 | |
|---|---|---|---|---|---|---|
| Display | 7% | 0% | 6% | 1% | ||
| Display P3 Coverage (%) | 64.4 | 68.5 6% | 64.5 0% | 66.7 4% | 64.4 0% | |
| sRGB Coverage (%) | 90.8 | 99.2 9% | 92 1% | 98 8% | 92.9 2% | |
| AdobeRGB 1998 Coverage (%) | 65.4 | 70.1 7% | 65.5 0% | 68.7 5% | 66.1 1% | |
| Response Times | -9% | 13% | -3% | -18% | 20% | |
| Response Time Grey 50% / Grey 80% * (ms) | 35.6 ? | 42 ? -18% | 33 ? 7% | 45.6 ? -28% | 48 ? -35% | 28.4 ? 20% |
| Response Time Black / White * (ms) | 28 ? | 28 ? -0% | 23 ? 18% | 21.6 ? 23% | 28 ? -0% | 22.8 ? 19% |
| PWM Frequency (Hz) | 198.4 ? | 125 ? | 2119 ? | 221.2 ? | ||
| Screen | 35% | 3% | 31% | 33% | 14% | |
| Brightness middle (cd/m²) | 348.8 | 461 32% | 327 -6% | 443 27% | 348 0% | 388.1 11% |
| Brightness (cd/m²) | 339 | 444 31% | 324 -4% | 446 32% | 306 -10% | 344 1% |
| Brightness Distribution (%) | 87 | 93 7% | 88 1% | 88 1% | 78 -10% | 78 -10% |
| Black Level * (cd/m²) | 0.4 | 0.34 15% | 0.35 13% | 0.41 -2% | 0.2 50% | 0.39 2% |
| Contrast (:1) | 872 | 1356 56% | 934 7% | 1080 24% | 1740 100% | 995 14% |
| Colorchecker dE 2000 * | 7 | 3.43 51% | 6.54 7% | 2.6 63% | 2.79 60% | 4.6 34% |
| Colorchecker dE 2000 max. * | 16.2 | 5.55 66% | 15.59 4% | 4 75% | 5.53 66% | 9.1 44% |
| Greyscale dE 2000 * | 10.1 | 3.08 70% | 9.52 6% | 3 70% | 3.47 66% | 6.1 40% |
| Gamma | 2.22 99% | 3.03 73% | 2.35 94% | 2.38 92% | 2.54 87% | 2.07 106% |
| CCT | 9065 72% | 7014 93% | 8802 74% | 6780 96% | 6564 99% | 7104 91% |
| Color Space (Percent of AdobeRGB 1998) (%) | 58.7 | 64 9% | 59 1% | 62.6 7% | 60 2% | 59 1% |
| Color Space (Percent of sRGB) (%) | 90.9 | 99 9% | 92 1% | 98 8% | 93 2% | 91 0% |
| Teljes átlag (program / beállítások) | 11% /
23% | 5% /
4% | 11% /
21% | 5% /
20% | 17% /
15% |
* ... a kisebb jobb
Megjelenítési válaszidők
| ↔ Válaszidő Fekete-fehér | ||
|---|---|---|
| 28 ms ... emelkedés és süllyedés ↘ kombinálva | ↗ 14.8 ms emelkedés | 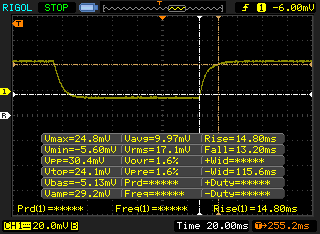 |
| ↘ 13.2 ms ősz | ||
| A képernyő viszonylag lassú reakciósebességet mutat tesztjeinkben, és túl lassú lehet a játékosok számára. Összehasonlításképpen, az összes tesztelt eszköz 0.1 (minimum) és 240 (maximum) ms között mozog. » 71 % of all devices are better. Ez azt jelenti, hogy a mért válaszidő rosszabb, mint az összes vizsgált eszköz átlaga (19.9 ms). | ||
| ↔ Válaszidő 50% szürke és 80% szürke között | ||
| 35.6 ms ... emelkedés és süllyedés ↘ kombinálva | ↗ 17.2 ms emelkedés | 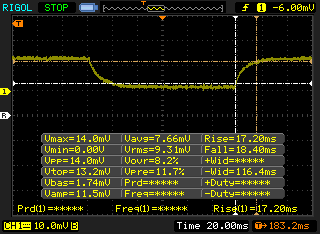 |
| ↘ 18.4 ms ősz | ||
| A képernyő lassú reakciósebességet mutat tesztjeinkben, és nem lesz kielégítő a játékosok számára. Összehasonlításképpen, az összes tesztelt eszköz 0.165 (minimum) és 636 (maximum) ms között mozog. » 50 % of all devices are better. Ez azt jelenti, hogy a mért válaszidő rosszabb, mint az összes vizsgált eszköz átlaga (31.1 ms). | ||
Képernyő villogása / PWM (impulzusszélesség-moduláció)
| Képernyő villogása / PWM észlelve | 198.4 Hz | ≤ 99 % fényerő beállítása | 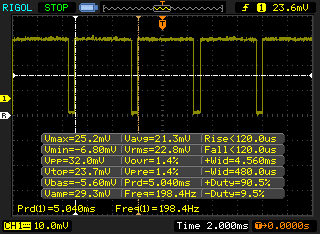 |
A kijelző háttérvilágítása 198.4 Hz-en villog (a legrosszabb esetben, pl. PWM használatával) Villódzás észlelve a 99 % vagy annál kisebb fényerő-beállításnál. E fényerő-beállítás felett nem lehet villogás vagy PWM. A 198.4 Hz frekvenciája viszonylag alacsony, így az érzékeny felhasználók valószínűleg villogást észlelnek, és megerőltetik a szemüket a megadott és az alatti fényerő-beállítás mellett. Összehasonlításképpen: az összes tesztelt eszköz 52 %-a nem használja a PWM-et a kijelző elsötétítésére. Ha PWM-et észleltek, akkor átlagosan 7798 (minimum: 5 - maximum: 343500) Hz-t mértek. | |||
| Cinebench R15 | |
| CPU Single 64Bit | |
| Microsoft Surface Pro (2017) i7 | |
| Lenovo ThinkPad P51s 20HB000SGE | |
| HP Spectre x360 15t-bl100 | |
| Acer Swift 3 SF315-51G-57E5 | |
| MSI GF62VR 7RF-877 | |
| Lenovo Miix 520-12IKB 81CG | |
| Lenovo ThinkPad T460s-20FA003GGE | |
| HP Envy x360 15m-bq121dx | |
| Dell Latitude 7285 | |
| Dell Inspiron 15 7000 7577 | |
| Lenovo Miix 510 Pro 80U10006GE | |
| HP 350 G2 L8B05ES | |
| CPU Multi 64Bit | |
| MSI GF62VR 7RF-877 | |
| HP Envy x360 15m-bq121dx | |
| Lenovo Miix 520-12IKB 81CG | |
| Acer Swift 3 SF315-51G-57E5 | |
| HP Spectre x360 15t-bl100 | |
| Dell Inspiron 15 7000 7577 | |
| Microsoft Surface Pro (2017) i7 | |
| Lenovo ThinkPad P51s 20HB000SGE | |
| Lenovo ThinkPad T460s-20FA003GGE | |
| Dell Latitude 7285 | |
| HP 350 G2 L8B05ES | |
| Lenovo Miix 510 Pro 80U10006GE | |
| Cinebench R11.5 | |
| CPU Single 64Bit | |
| Microsoft Surface Pro (2017) i7 | |
| Lenovo ThinkPad P51s 20HB000SGE | |
| HP Spectre x360 15t-bl100 | |
| MSI GF62VR 7RF-877 | |
| Lenovo Miix 520-12IKB 81CG | |
| Lenovo ThinkPad T460s-20FA003GGE | |
| HP Envy x360 15m-bq121dx | |
| Dell Latitude 7285 | |
| Dell Inspiron 15 7000 7577 | |
| HP 350 G2 L8B05ES | |
| CPU Multi 64Bit | |
| MSI GF62VR 7RF-877 | |
| HP Envy x360 15m-bq121dx | |
| Lenovo Miix 520-12IKB 81CG | |
| Dell Inspiron 15 7000 7577 | |
| HP Spectre x360 15t-bl100 | |
| Microsoft Surface Pro (2017) i7 | |
| Lenovo ThinkPad P51s 20HB000SGE | |
| Lenovo ThinkPad T460s-20FA003GGE | |
| Dell Latitude 7285 | |
| HP 350 G2 L8B05ES | |
| Cinebench R10 | |
| Rendering Multiple CPUs 32Bit | |
| MSI GF62VR 7RF-877 | |
| Dell Inspiron 15 7000 7577 | |
| Lenovo Miix 520-12IKB 81CG | |
| Acer Swift 3 SF315-51G-57E5 | |
| HP Spectre x360 15t-bl100 | |
| HP Envy x360 15m-bq121dx | |
| Microsoft Surface Pro (2017) i7 | |
| Lenovo ThinkPad P51s 20HB000SGE | |
| Lenovo ThinkPad T460s-20FA003GGE | |
| Dell Latitude 7285 | |
| HP 350 G2 L8B05ES | |
| Rendering Single 32Bit | |
| HP Spectre x360 15t-bl100 | |
| Lenovo ThinkPad P51s 20HB000SGE | |
| Microsoft Surface Pro (2017) i7 | |
| Acer Swift 3 SF315-51G-57E5 | |
| Lenovo Miix 520-12IKB 81CG | |
| MSI GF62VR 7RF-877 | |
| Dell Inspiron 15 7000 7577 | |
| Lenovo ThinkPad T460s-20FA003GGE | |
| Dell Latitude 7285 | |
| HP 350 G2 L8B05ES | |
| HP Envy x360 15m-bq121dx | |
| wPrime 2.10 - 1024m | |
| Microsoft Surface Pro (2017) i7 | |
| HP Spectre x360 15t-bl100 | |
| Dell Inspiron 15 7000 7577 | |
| Lenovo Miix 520-12IKB 81CG | |
| HP Envy x360 15m-bq121dx | |
| MSI GF62VR 7RF-877 | |
* ... a kisebb jobb
| PCMark 8 | |
| Home Score Accelerated v2 | |
| Lenovo Miix 520-12IKB 81CG | |
| HP Elite x2 1012 G2-1LV76EA | |
| Lenovo Miix 510 Pro 80U10006GE | |
| Microsoft Surface Pro (2017) m3 | |
| Work Score Accelerated v2 | |
| Lenovo Miix 510 Pro 80U10006GE | |
| HP Elite x2 1012 G2-1LV76EA | |
| Microsoft Surface Pro (2017) m3 | |
| Lenovo Miix 520-12IKB 81CG | |
| Creative Score Accelerated v2 | |
| Lenovo Miix 520-12IKB 81CG | |
| HP Elite x2 1012 G2-1LV76EA | |
| Microsoft Surface Pro (2017) m3 | |
| PCMark 10 - Score | |
| Lenovo Miix 520-12IKB 81CG | |
| HP Elite x2 1012 G2-1LV76EA | |
| Microsoft Surface Pro (2017) m3 | |
| PCMark 8 Home Score Accelerated v2 | 3733 pontok | |
| PCMark 8 Creative Score Accelerated v2 | 4869 pontok | |
| PCMark 8 Work Score Accelerated v2 | 2699 pontok | |
| PCMark 10 Score | 3295 pontok | |
Segítség | ||
| Lenovo Miix 520-12IKB 81CG Samsung PM961 MZVLW256HEHP | Microsoft Surface Pro (2017) m3 Samsung PM971 KUS020203M | Lenovo Miix 510 Pro 80U10006GE Samsung PM951 NVMe MZVLV256 | HP Elite x2 1012 G2-1LV76EA Samsung PM961 MZVLW256HEHP | Dell XPS 13 9365-4537 2-in-1 Toshiba NVMe THNSN5256GPUK | |
|---|---|---|---|---|---|
| AS SSD | -22% | -146% | 48% | -11% | |
| Copy Game MB/s (MB/s) | 410.8 | 140.7 -66% | 379.9 -8% | 457.8 11% | |
| Copy Program MB/s (MB/s) | 310.4 | 83.8 -73% | 198.2 -36% | 264.7 -15% | |
| Copy ISO MB/s (MB/s) | 659 | 173.2 -74% | 791 20% | 714 8% | |
| Score Total (Points) | 2378 | 1847 -22% | 1190 -50% | 4653 96% | 1388 -42% |
| Score Write (Points) | 572 | 284 -50% | 60 -90% | 879 54% | 389 -32% |
| Score Read (Points) | 1200 | 1053 -12% | 777 -35% | 2545 112% | 681 -43% |
| Access Time Write * (ms) | 0.33 | 0.04 88% | 4.206 -1175% | 0.027 92% | 0.041 88% |
| Access Time Read * (ms) | 0.49 | 0.074 85% | 0.053 89% | 0.041 92% | 0.169 66% |
| 4K-64 Write (MB/s) | 345.5 | 144.3 -58% | 43.14 -88% | 657 90% | 249.4 -28% |
| 4K-64 Read (MB/s) | 999 | 891 -11% | 611 -39% | 2280 128% | 512 -49% |
| 4K Write (MB/s) | 107.9 | 88.6 -18% | 0.96 -99% | 132.2 23% | 85.8 -20% |
| 4K Read (MB/s) | 48.69 | 38.82 -20% | 39.6 -19% | 45.24 -7% | 34.77 -29% |
| Seq Write (MB/s) | 1182 | 514 -57% | 158.3 -87% | 897 -24% | 543 -54% |
| Seq Read (MB/s) | 1523 | 1226 -20% | 1260 -17% | 2197 44% | 1342 -12% |
* ... a kisebb jobb

| 3DMark 11 | |
| 1280x720 Performance GPU | |
| Intel Skull Canyon NUC6i7KYK | |
| Lenovo IdeaPad 320S-13IKB | |
| Microsoft Surface Laptop i7 | |
| Microsoft Surface Laptop i7 | |
| Razer Blade Stealth QHD i7-8550U | |
| Dell XPS 13 i5-8250U | |
| Toshiba Tecra X40-D | |
| Lenovo Miix 520-12IKB 81CG | |
| Acer TravelMate P249-M-5452 | |
| Lenovo Miix 510 Pro 80U10006GE | |
| 1280x720 Performance Combined | |
| Lenovo IdeaPad 320S-13IKB | |
| Intel Skull Canyon NUC6i7KYK | |
| Microsoft Surface Laptop i7 | |
| Microsoft Surface Laptop i7 | |
| Razer Blade Stealth QHD i7-8550U | |
| Dell XPS 13 i5-8250U | |
| Toshiba Tecra X40-D | |
| Lenovo Miix 520-12IKB 81CG | |
| Acer TravelMate P249-M-5452 | |
| Lenovo Miix 510 Pro 80U10006GE | |
| 3DMark | |
| 1280x720 Cloud Gate Standard Graphics | |
| Lenovo IdeaPad 320S-13IKB | |
| Intel Skull Canyon NUC6i7KYK | |
| Microsoft Surface Laptop i7 | |
| Razer Blade Stealth QHD i7-8550U | |
| Dell XPS 13 i5-8250U | |
| Toshiba Tecra X40-D | |
| Lenovo Miix 520-12IKB 81CG | |
| Acer TravelMate P249-M-5452 | |
| Lenovo Miix 510 Pro 80U10006GE | |
| 1920x1080 Fire Strike Graphics | |
| Lenovo IdeaPad 320S-13IKB | |
| Intel Skull Canyon NUC6i7KYK | |
| Microsoft Surface Laptop i7 | |
| Toshiba Tecra X40-D | |
| Lenovo Miix 520-12IKB 81CG | |
| Acer TravelMate P249-M-5452 | |
| 1920x1080 Ice Storm Extreme Graphics | |
| Intel Skull Canyon NUC6i7KYK | |
| Lenovo Miix 520-12IKB 81CG | |
| Acer TravelMate P249-M-5452 | |
| 3DMark 11 Performance | 1800 pontok | |
| 3DMark Ice Storm Standard Score | 65197 pontok | |
| 3DMark Cloud Gate Standard Score | 7775 pontok | |
| 3DMark Fire Strike Score | 952 pontok | |
| 3DMark Fire Strike Extreme Score | 437 pontok | |
Segítség | ||
| alacsony | közepes | magas | ultra | |
|---|---|---|---|---|
| BioShock Infinite (2013) | 54.3 | 29.3 | 24.1 | 7.4 |
| Rise of the Tomb Raider (2016) | 21.3 | 11 |
Zajszint
| Üresjárat |
| 28.2 / 28.2 / 29.6 dB(A) |
| Terhelés |
| 34 / 36 dB(A) |
 | ||
30 dB csendes 40 dB(A) hallható 50 dB(A) hangos |
||
min: | ||
| Lenovo Miix 520-12IKB 81CG UHD Graphics 620, i5-8250U, Samsung PM961 MZVLW256HEHP | Microsoft Surface Pro (2017) i7 Iris Plus Graphics 640, i7-7660U, Samsung PM971 KUS040202M | Lenovo Miix 510 Pro 80U10006GE HD Graphics 520, 6200U, Samsung PM951 NVMe MZVLV256 | HP Elite x2 1012 G2-1LV76EA HD Graphics 620, i5-7200U, Samsung PM961 MZVLW256HEHP | Dell XPS 13 9365-4537 2-in-1 HD Graphics 615, i5-7Y54, Toshiba NVMe THNSN5256GPUK | Lenovo ThinkPad X1 Tablet Gen 2 HD Graphics 615, i5-7Y54, Samsung PM961 MZVLW256HEHP | |
|---|---|---|---|---|---|---|
| Noise | -1% | -5% | 1% | |||
| off / környezet * (dB) | 28.2 | 29.6 -5% | 30.15 -7% | 29.5 -5% | ||
| Idle Minimum * (dB) | 28.2 | 29.6 -5% | 30.15 -7% | 29.5 -5% | ||
| Idle Average * (dB) | 28.2 | 29.6 -5% | 30.8 -9% | 29.5 -5% | ||
| Idle Maximum * (dB) | 29.6 | 29.6 -0% | 31 -5% | 29.5 -0% | ||
| Load Average * (dB) | 34 | 33.4 2% | 36.8 -8% | 30.6 10% | ||
| Load Maximum * (dB) | 36 | 34.1 5% | 33.8 6% | 32.5 10% | ||
| Witcher 3 ultra * (dB) | 33.4 |
* ... a kisebb jobb
(±) A felső oldalon a maximális hőmérséklet 44.8 °C / 113 F, összehasonlítva a 35.4 °C / 96 F átlagával , 19.6 és 60 °C között a Convertible osztálynál.
(±) Az alsó maximum 44.2 °C / 112 F-ig melegszik fel, összehasonlítva a 36.9 °C / 98 F átlagával
(+) Üresjáratban a felső oldal átlagos hőmérséklete 28 °C / 82 F, összehasonlítva a 30.3 °C / ### eszközátlaggal class_avg_f### F.
(+) A csuklótámasz és az érintőpad eléri a bőr maximális hőmérsékletét (35 °C / 95 F), ezért nem forrók.
(-) A hasonló eszközök csuklótámasz területének átlagos hőmérséklete 28 °C / 82.4 F volt (-7 °C / -12.6 F).
Lenovo Miix 520-12IKB 81CG hangelemzés
(-) | nem túl hangos hangszórók (61.3 dB)
Basszus 100 - 315 Hz
(-) | szinte nincs basszus – átlagosan 18.1%-kal alacsonyabb a mediánnál
(±) | a basszus linearitása átlagos (12.5% delta az előző frekvenciához)
Közepes 400-2000 Hz
(+) | kiegyensúlyozott középpontok – csak 4% választja el a mediántól
(±) | a középpontok linearitása átlagos (9.9% delta az előző gyakorisághoz)
Maximum 2-16 kHz
(±) | magasabb csúcsok – átlagosan 5.1%-kal magasabb, mint a medián
(±) | a csúcsok linearitása átlagos (10.9% delta az előző gyakorisághoz)
Összességében 100 - 16.000 Hz
(-) | az összhang nem lineáris (31% eltérés a mediánhoz képest)
Ugyanazon osztályhoz képest
» 90%Ebben az osztályban az összes tesztelt eszköz %-a jobb volt, 2% hasonló, 8%-kal rosszabb
» A legjobb delta értéke 6%, az átlag 20%, a legrosszabb 57% volt
Az összes tesztelt eszközzel összehasonlítva
» 90% az összes tesztelt eszköz jobb volt, 2% hasonló, 8%-kal rosszabb
» A legjobb delta értéke 4%, az átlag 24%, a legrosszabb 134% volt
Apple MacBook 12 (Early 2016) 1.1 GHz hangelemzés
(+) | a hangszórók viszonylag hangosan tudnak játszani (83.6 dB)
Basszus 100 - 315 Hz
(±) | csökkentett basszus – átlagosan 11.3%-kal alacsonyabb, mint a medián
(±) | a basszus linearitása átlagos (14.2% delta az előző frekvenciához)
Közepes 400-2000 Hz
(+) | kiegyensúlyozott középpontok – csak 2.4% választja el a mediántól
(+) | a középpontok lineárisak (5.5% delta az előző frekvenciához)
Maximum 2-16 kHz
(+) | kiegyensúlyozott csúcsok – csak 2% választja el a mediántól
(+) | a csúcsok lineárisak (4.5% delta az előző frekvenciához képest)
Összességében 100 - 16.000 Hz
(+) | általános hangzás lineáris (10.2% eltérés a mediánhoz képest)
Ugyanazon osztályhoz képest
» 7%Ebben az osztályban az összes tesztelt eszköz %-a jobb volt, 2% hasonló, 91%-kal rosszabb
» A legjobb delta értéke 5%, az átlag 18%, a legrosszabb 53% volt
Az összes tesztelt eszközzel összehasonlítva
» 5% az összes tesztelt eszköz jobb volt, 1% hasonló, 94%-kal rosszabb
» A legjobb delta értéke 4%, az átlag 24%, a legrosszabb 134% volt
| Kikapcsolt állapot / Készenlét | |
| Üresjárat | |
| Terhelés |
|
Kulcs:
min: | |
| Lenovo Miix 520-12IKB 81CG i5-8250U, UHD Graphics 620, Samsung PM961 MZVLW256HEHP, IPS, 1920x1200, 12.2" | Microsoft Surface Pro (2017) i7 i7-7660U, Iris Plus Graphics 640, Samsung PM971 KUS040202M, IPS, 2736x1824, 12.3" | Microsoft Surface Pro (2017) i5 i5-7300U, HD Graphics 620, Samsung PM971 KUS030202M, IPS, 2736x1824, 12.3" | Lenovo Miix 510 Pro 80U10006GE 6200U, HD Graphics 520, Samsung PM951 NVMe MZVLV256, IPS, 1920x1200, 12.2" | HP Elite x2 1012 G2-1LV76EA i5-7200U, HD Graphics 620, Samsung PM961 MZVLW256HEHP, IPS, 2716x1824, 12.3" | Dell XPS 13 9365-4537 2-in-1 i5-7Y54, HD Graphics 615, Toshiba NVMe THNSN5256GPUK, IPS, 3200x1800, 13.3" | |
|---|---|---|---|---|---|---|
| Power Consumption | -2% | 26% | 6% | -0% | -3% | |
| Idle Minimum * (Watt) | 5.5 | 4.2 24% | 3.6 35% | 4.2 24% | 4.1 25% | 8.2 -49% |
| Idle Average * (Watt) | 8.3 | 10.1 -22% | 8.1 2% | 11.5 -39% | 9.2 -11% | 10.8 -30% |
| Idle Maximum * (Watt) | 11.5 | 14 -22% | 8.7 24% | 11.7 -2% | 11.1 3% | 12.7 -10% |
| Load Average * (Watt) | 38.3 | 37.4 2% | 25.5 33% | 31 19% | 33.8 12% | 22.6 41% |
| Load Maximum * (Watt) | 37.7 | 34 10% | 23.5 38% | 27.4 27% | 49.2 -31% | 24.6 35% |
| Witcher 3 ultra * (Watt) | 38.1 |
* ... a kisebb jobb
| Lenovo Miix 520-12IKB 81CG i5-8250U, UHD Graphics 620, 38 Wh | Microsoft Surface Pro (2017) i5 i5-7300U, HD Graphics 620, 45 Wh | Lenovo Miix 510 Pro 80U10006GE 6200U, HD Graphics 520, 50 Wh | HP Elite x2 1012 G2-1LV76EA i5-7200U, HD Graphics 620, 47 Wh | Dell XPS 13 9365-4537 2-in-1 i5-7Y54, HD Graphics 615, 46 Wh | Lenovo ThinkPad X1 Tablet Gen 2 i5-7Y54, HD Graphics 615, 37 Wh | |
|---|---|---|---|---|---|---|
| Akkumulátor üzemidő | 106% | 21% | 45% | 21% | 40% | |
| Reader / Idle (h) | 12.3 | 17.6 43% | 11.6 -6% | 13.9 13% | 11 -11% | |
| WiFi v1.3 (h) | 5.6 | 12.4 121% | 5.4 -4% | 6.3 13% | 6.8 21% | 7.4 32% |
| Load (h) | 1.1 | 2.8 155% | 1.9 73% | 2.3 109% | 2.2 100% |
Pro
Kontra
A Miix 520 legjobb tulajdonságai a processzorteljesítmény, SSD sebesség, a sokoldalú port választék és az ár. Jelenleg az egyik legjobb teljesítmény/dollár arányú gép, mivel a legtöbb Windows-os tablet leragadt a Core Y vagy a 7. generációs processzoroknál. Azok, akik ezt a plusz erőt kihasználják, remek úti ultrabook-helyettesnek találhatják a Miix 520-at.
A Lenovo egy része sem rossz, vagy középszerű, de egyes riválisokkal összevetve van még hová fejlődni. A Surface Pro és Elite x2 strapabíróbbak, a kijelzőjük világosabb és nagyobb felbontású, a színeik pontosabbak és az üzemidejük is hosszabb. A HP tablet még Thunderbolt 3-mal is fel van szerelve, tovább szélesítve a csatlakozási lehetőségeket. Egy stabilabb billentyűzet segítene a Lenovo-nak javítani a jelenleg szivacsos gépelési érzetet.
A gyorsabb processzor legfeltűnőbb hátránya a ventilátorzaj. Ez kissé hangosabb, mint a Surface Pro esetén, és a mindennapokban is sokkal gyakrabban hallani fogjuk. Közel sem olyan hangos, mint a HP Spectre átalakíthatóké, de tablet módban különösen feltűnő.
A Miix 520 remek vétel, amíg nem tévesztjük szem elől a hátrányait. A nagyobb CPU teljesítmény ára a gyakrabban felpörgő és zajosabb ventilátor. Reméljük, hogy a jövőbeli kiadásokban jobb kijelzőt és egy Thunderbolt 3 portot is látunk a gépben, és a Miix még erősebb ellenfél lesz a Microsoft számára.
Ez az eredeti értékelés rövidített változata. A teljes, angol nyelvű cikk itt olvasható.
Lenovo Miix 520-12IKB 81CG
- 12/10/2017 v6 (old)
Allen Ngo
Price comparison
