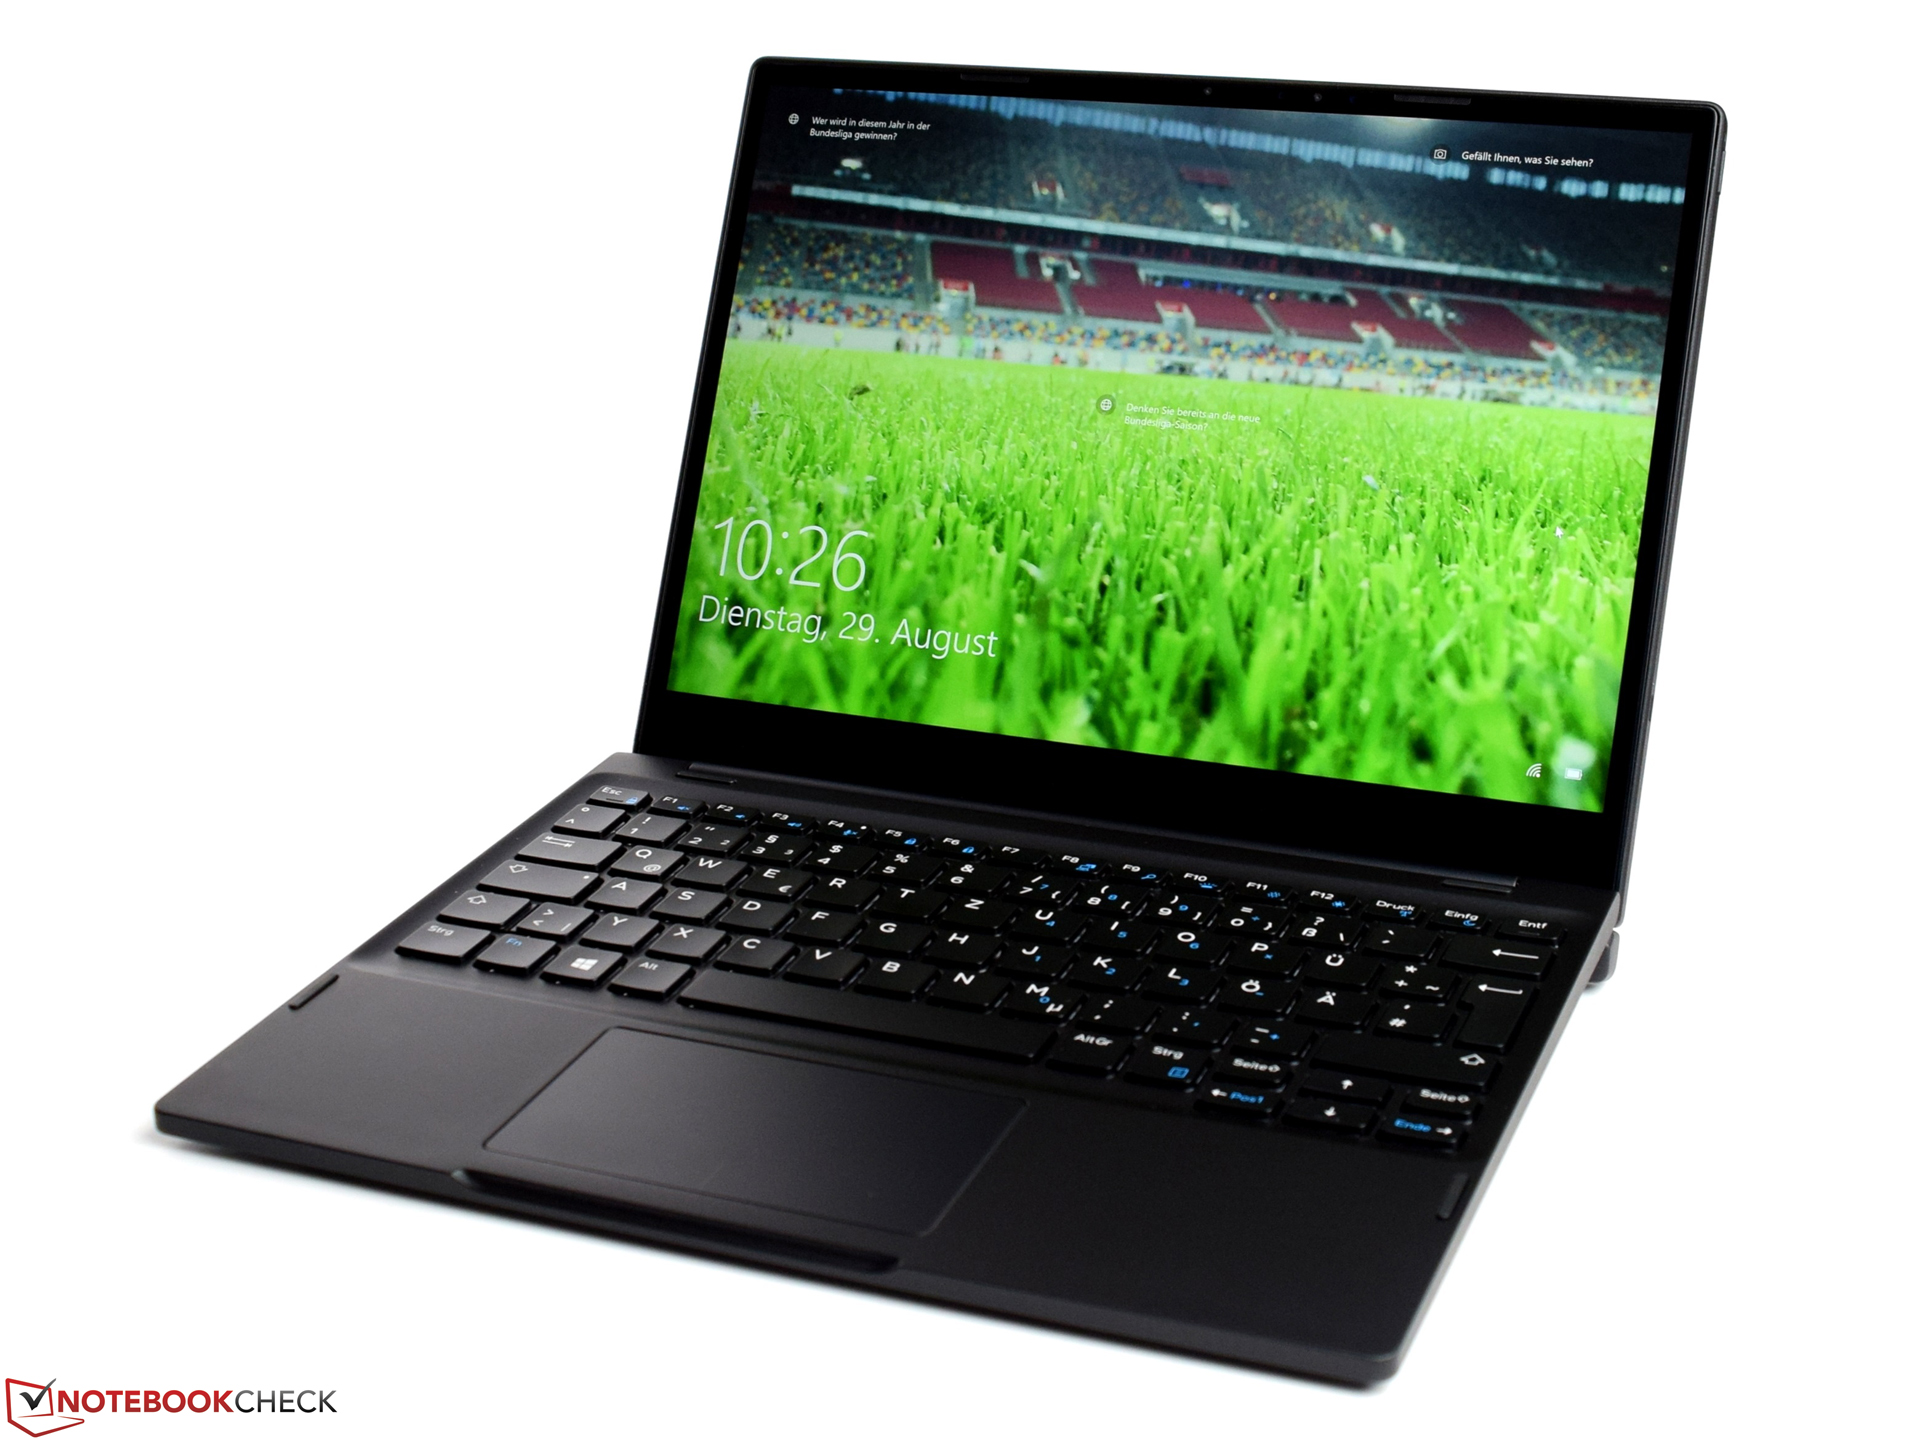
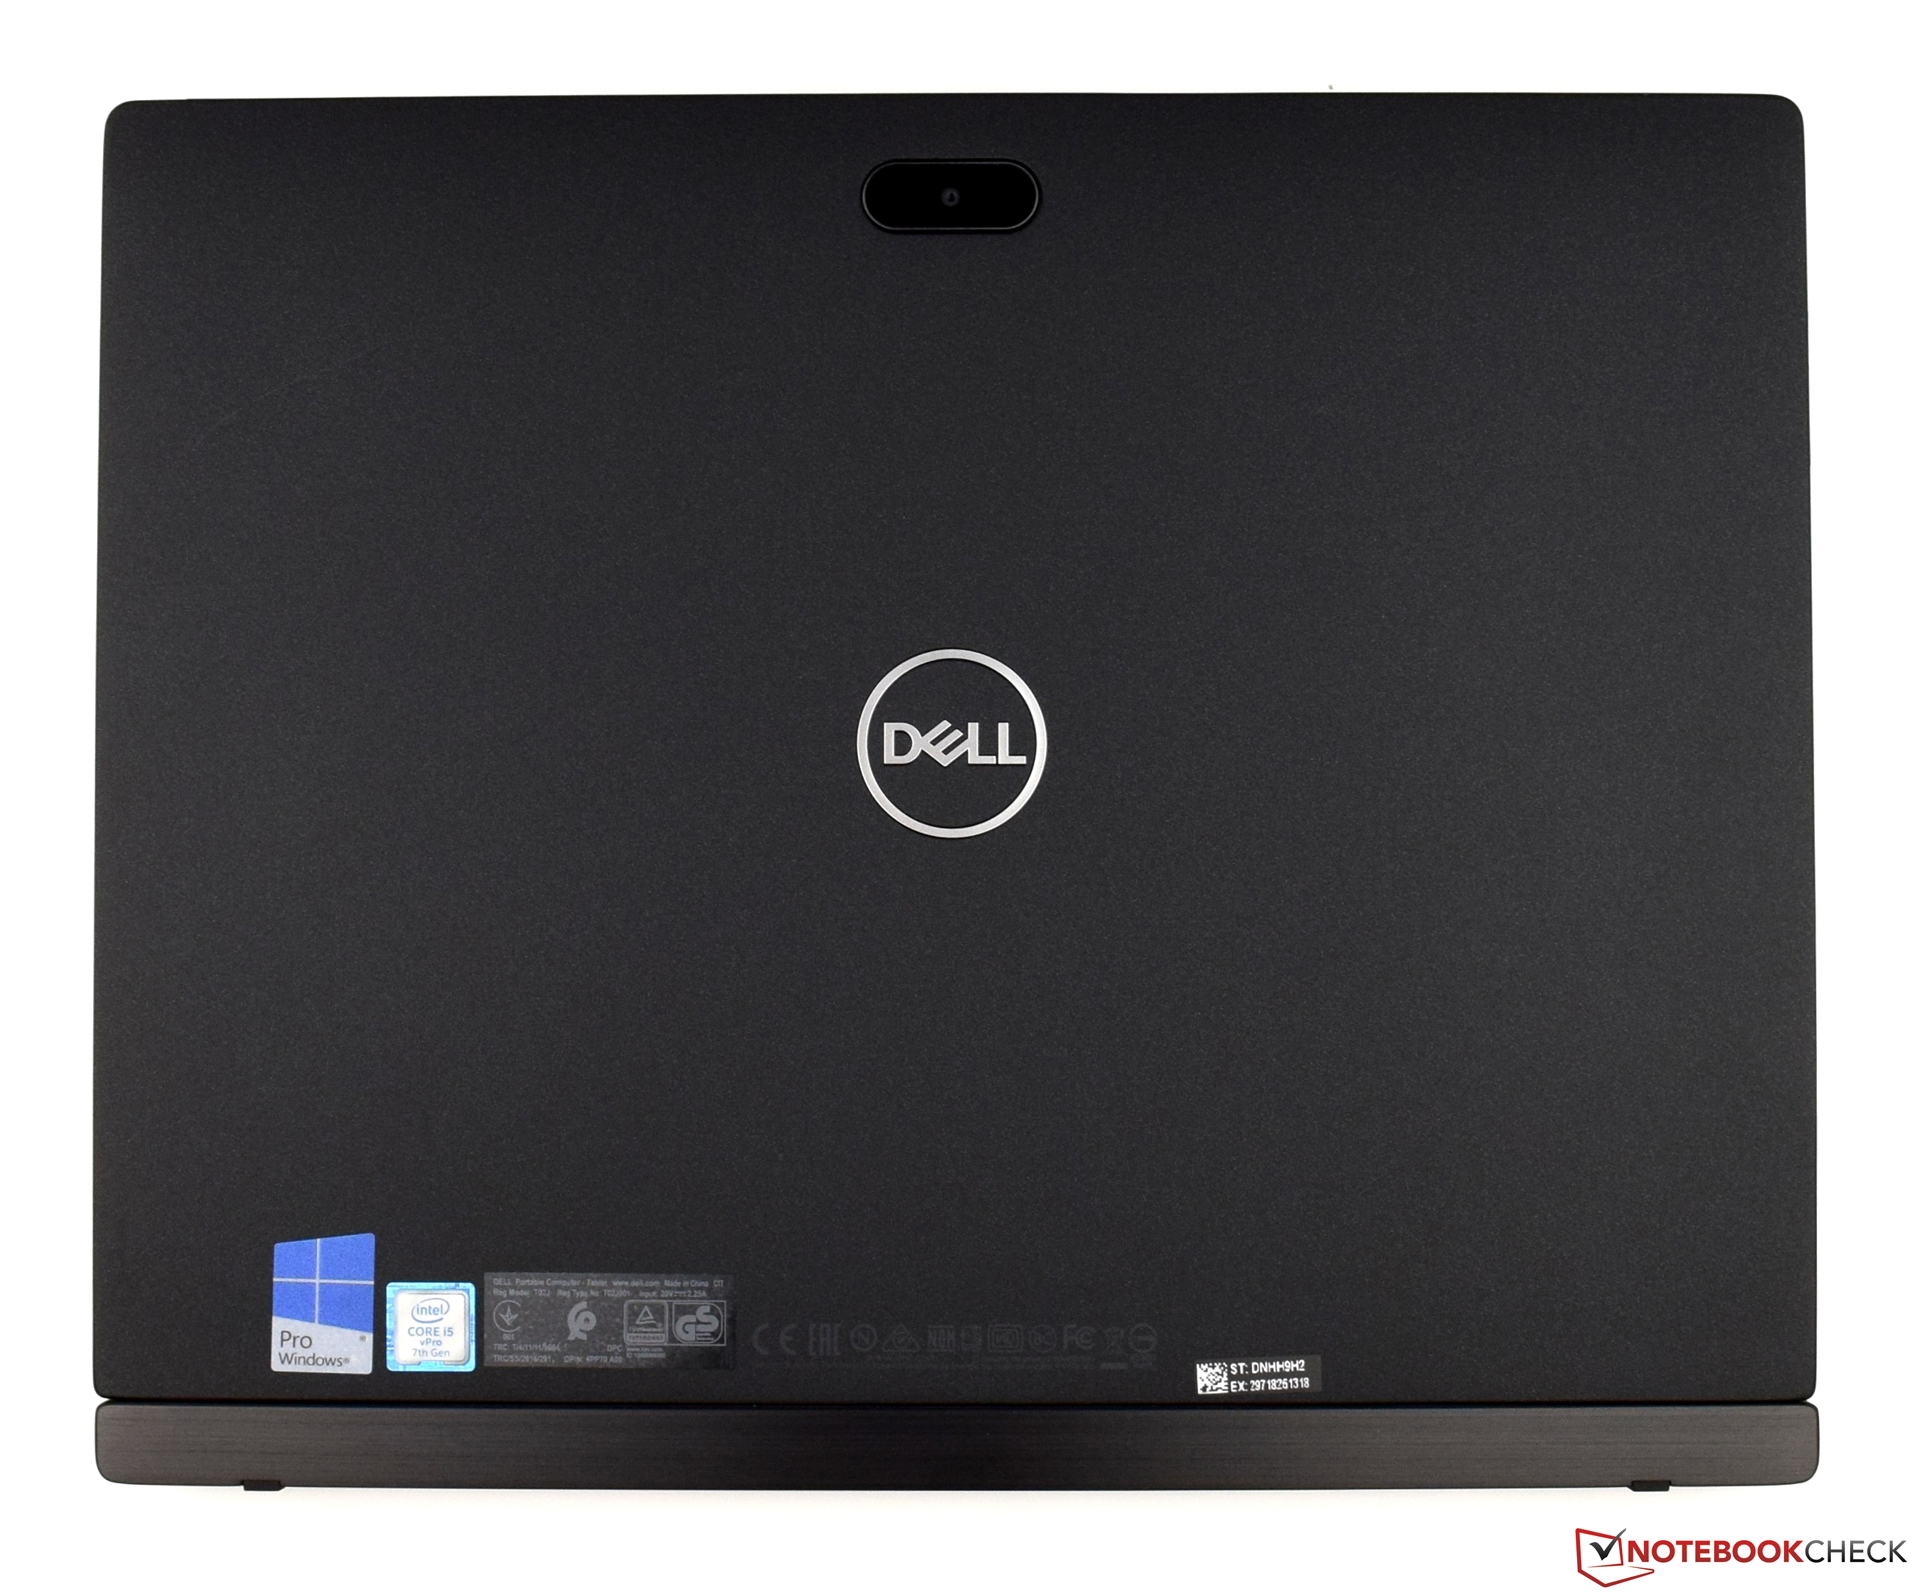
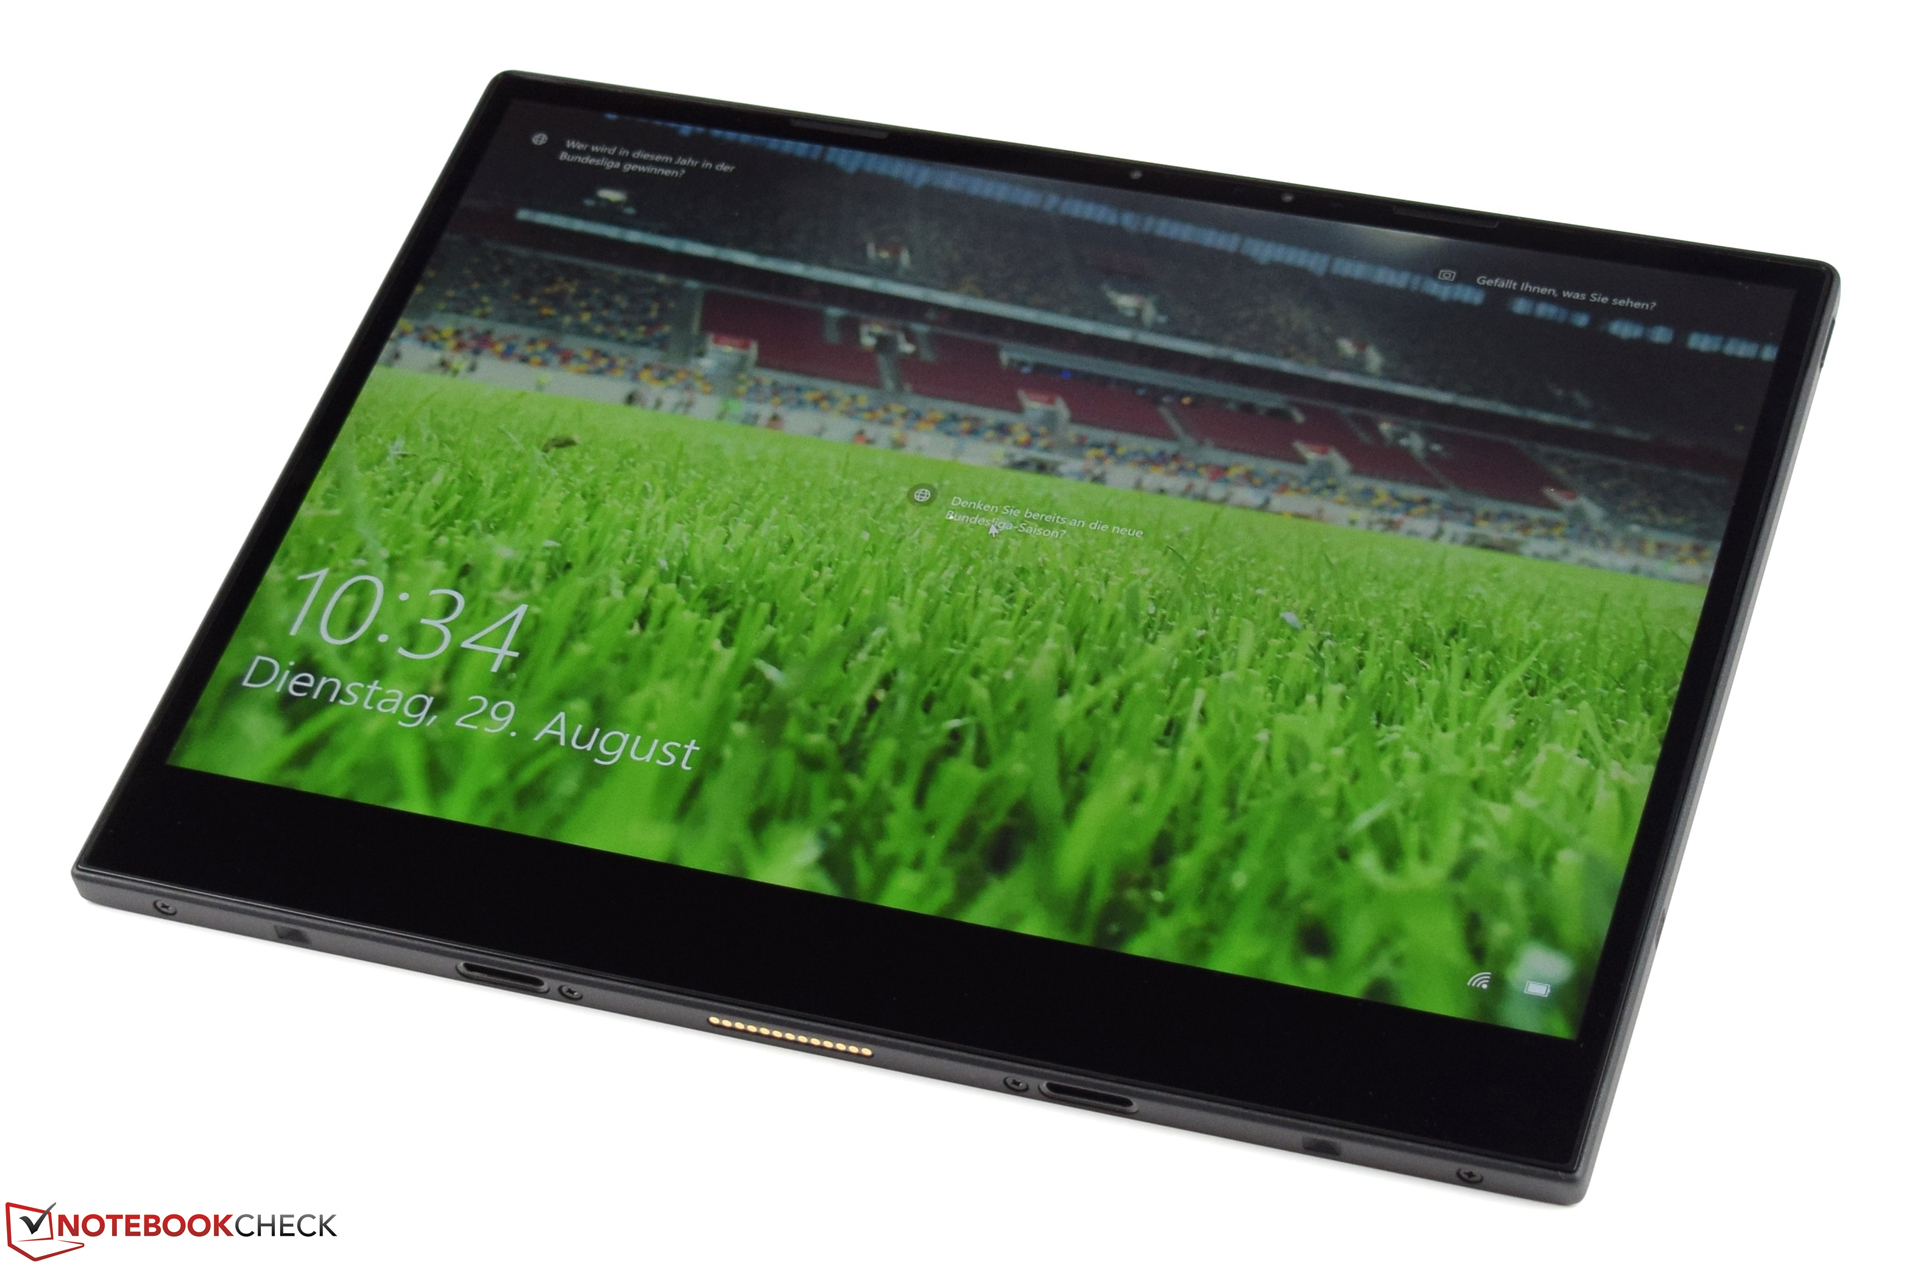
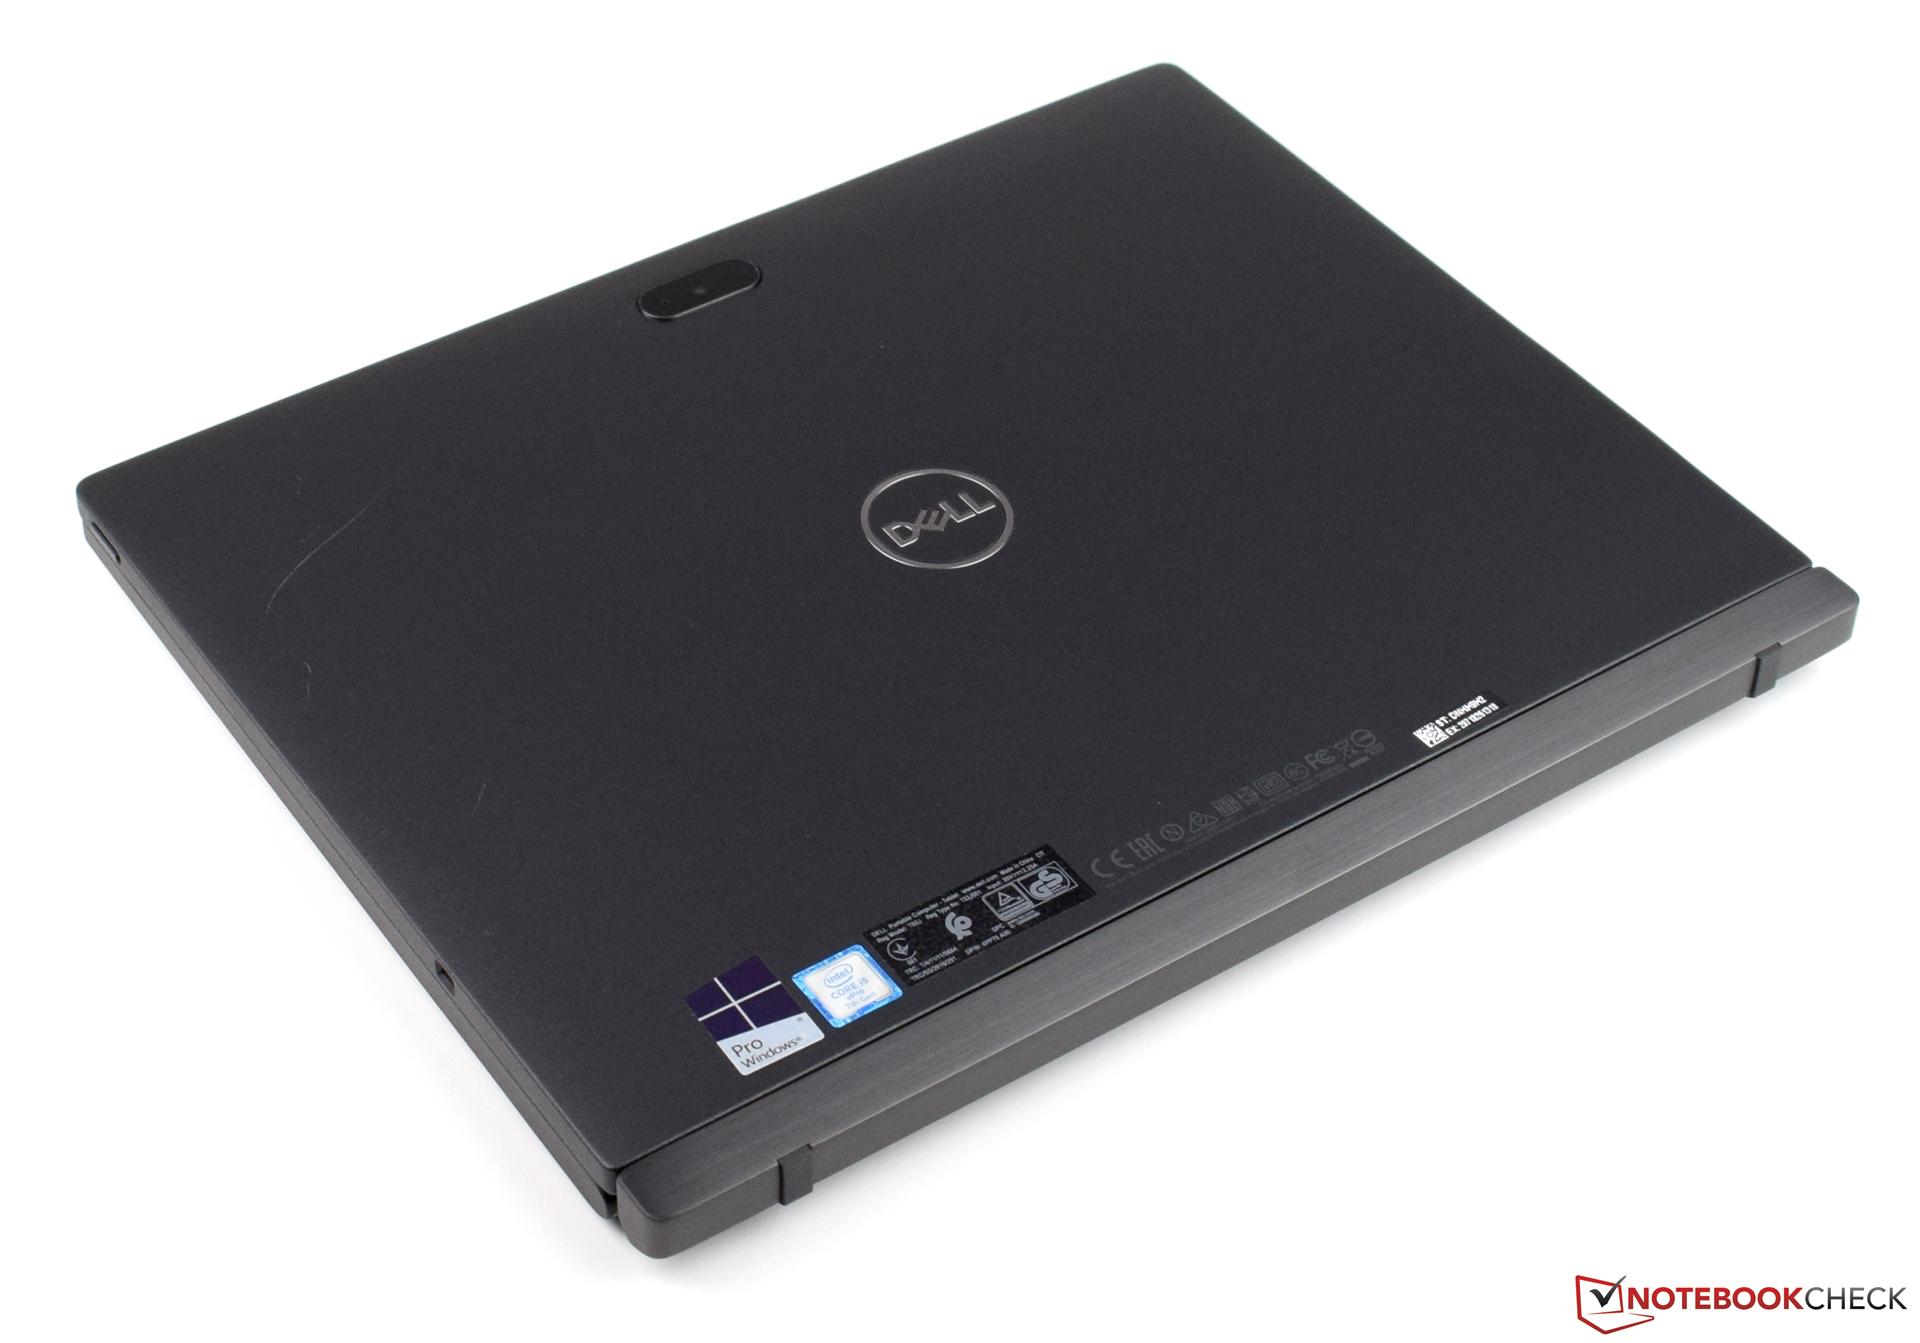
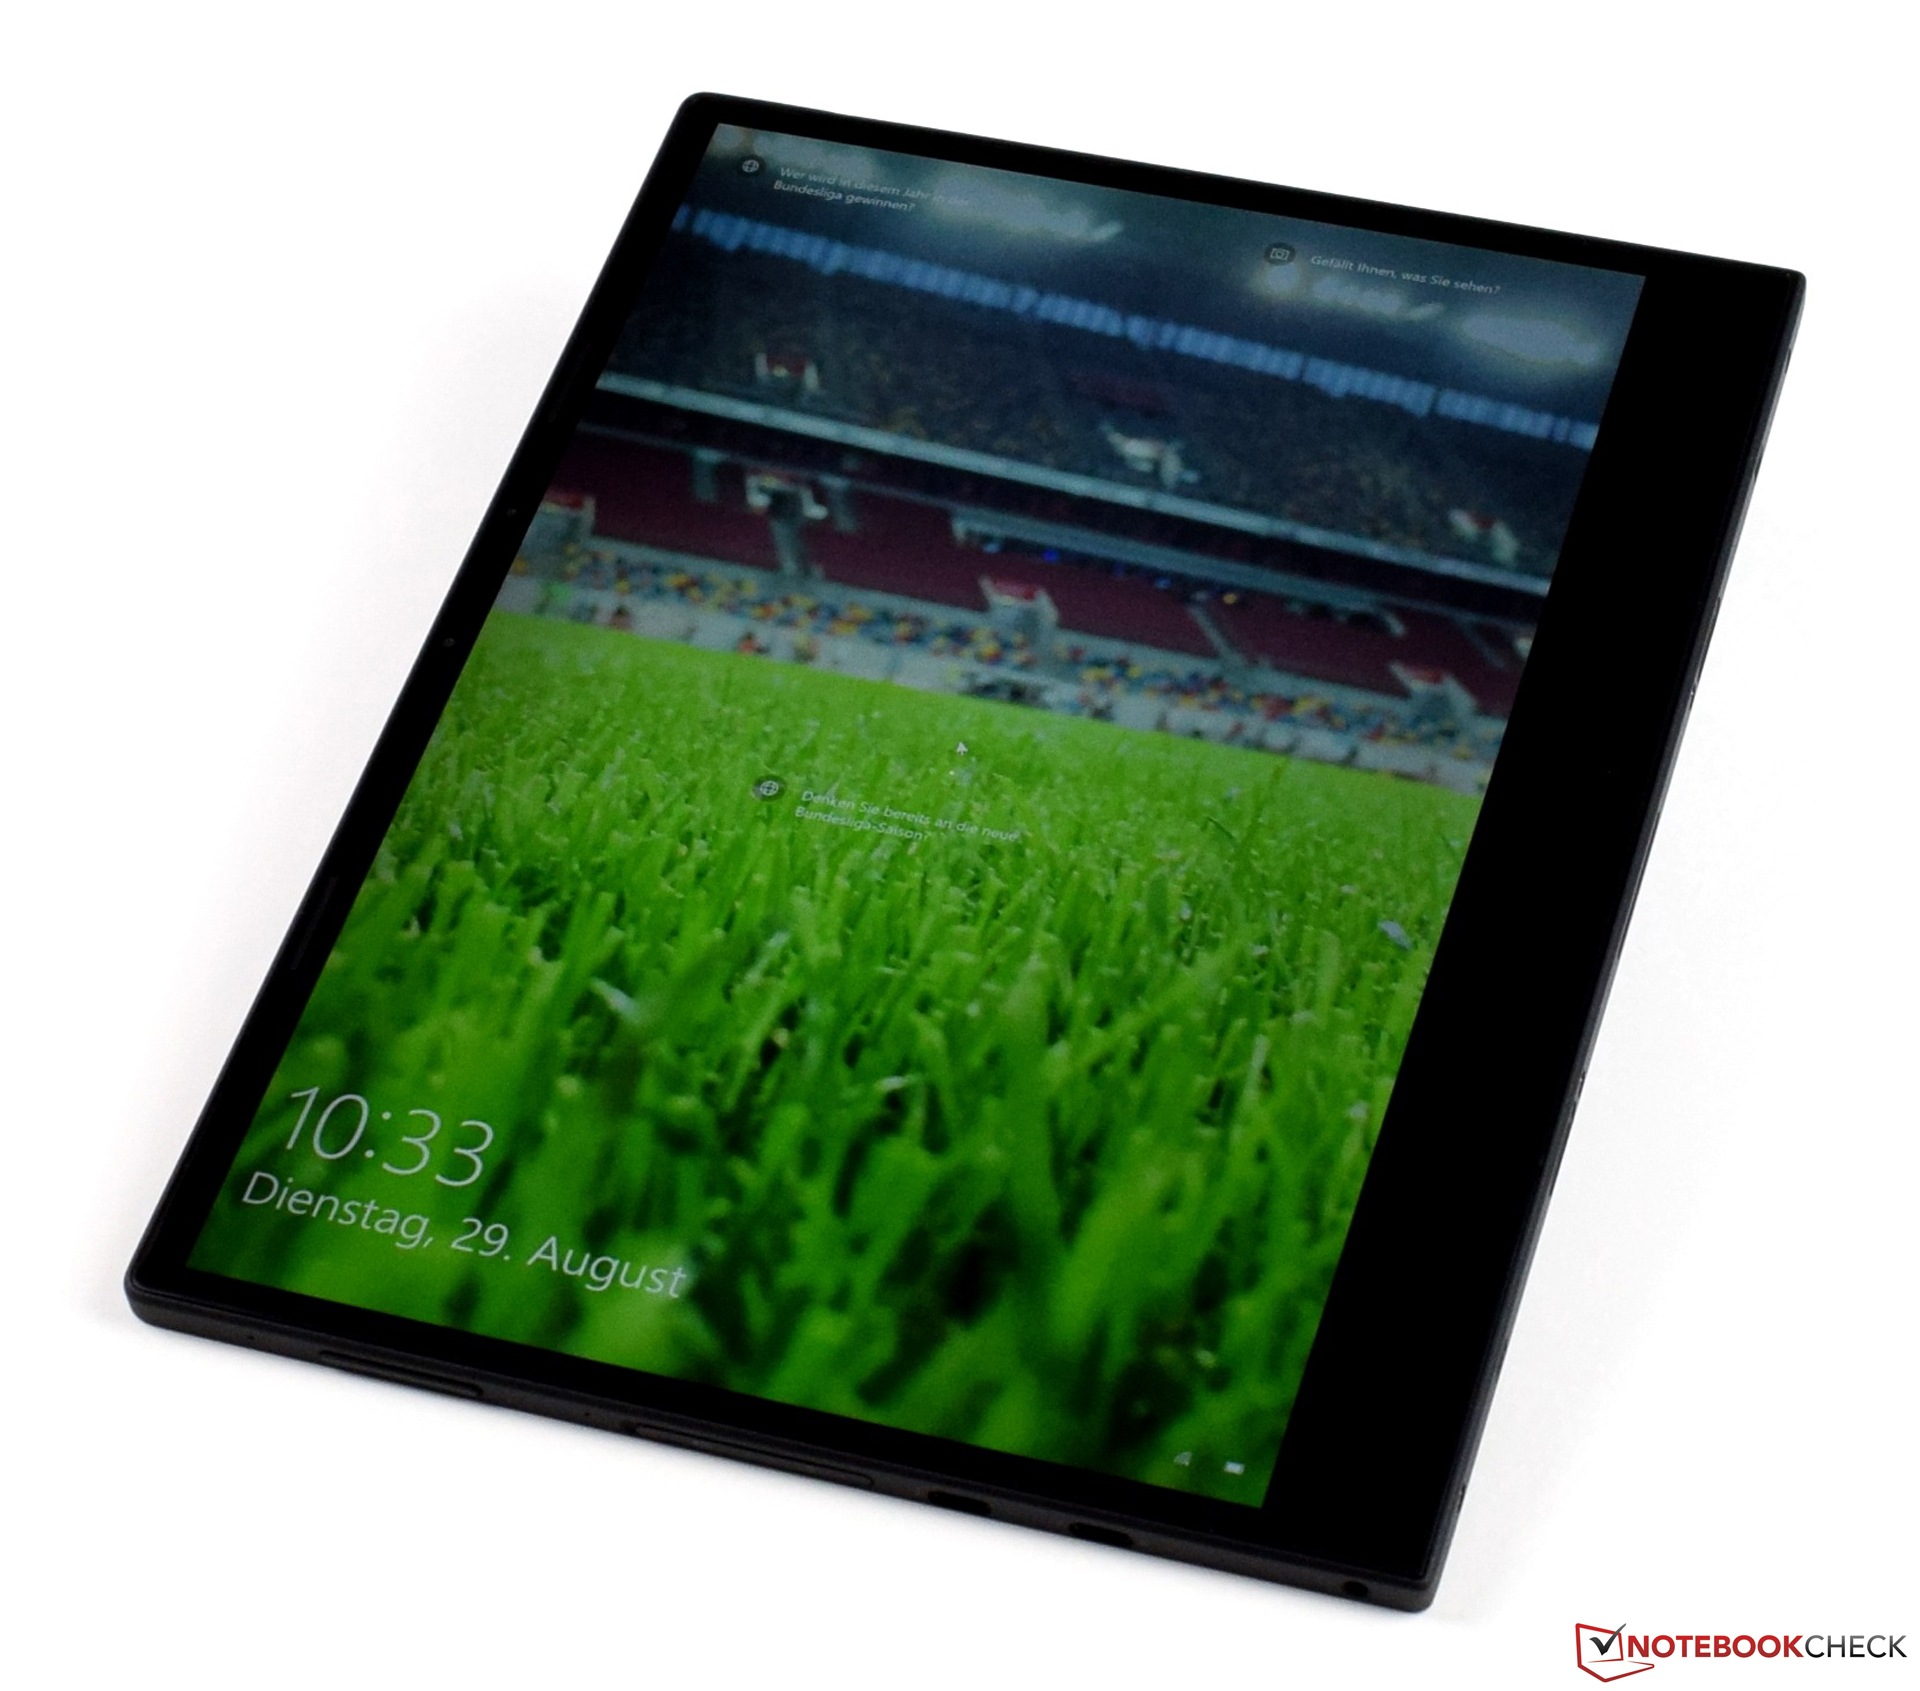
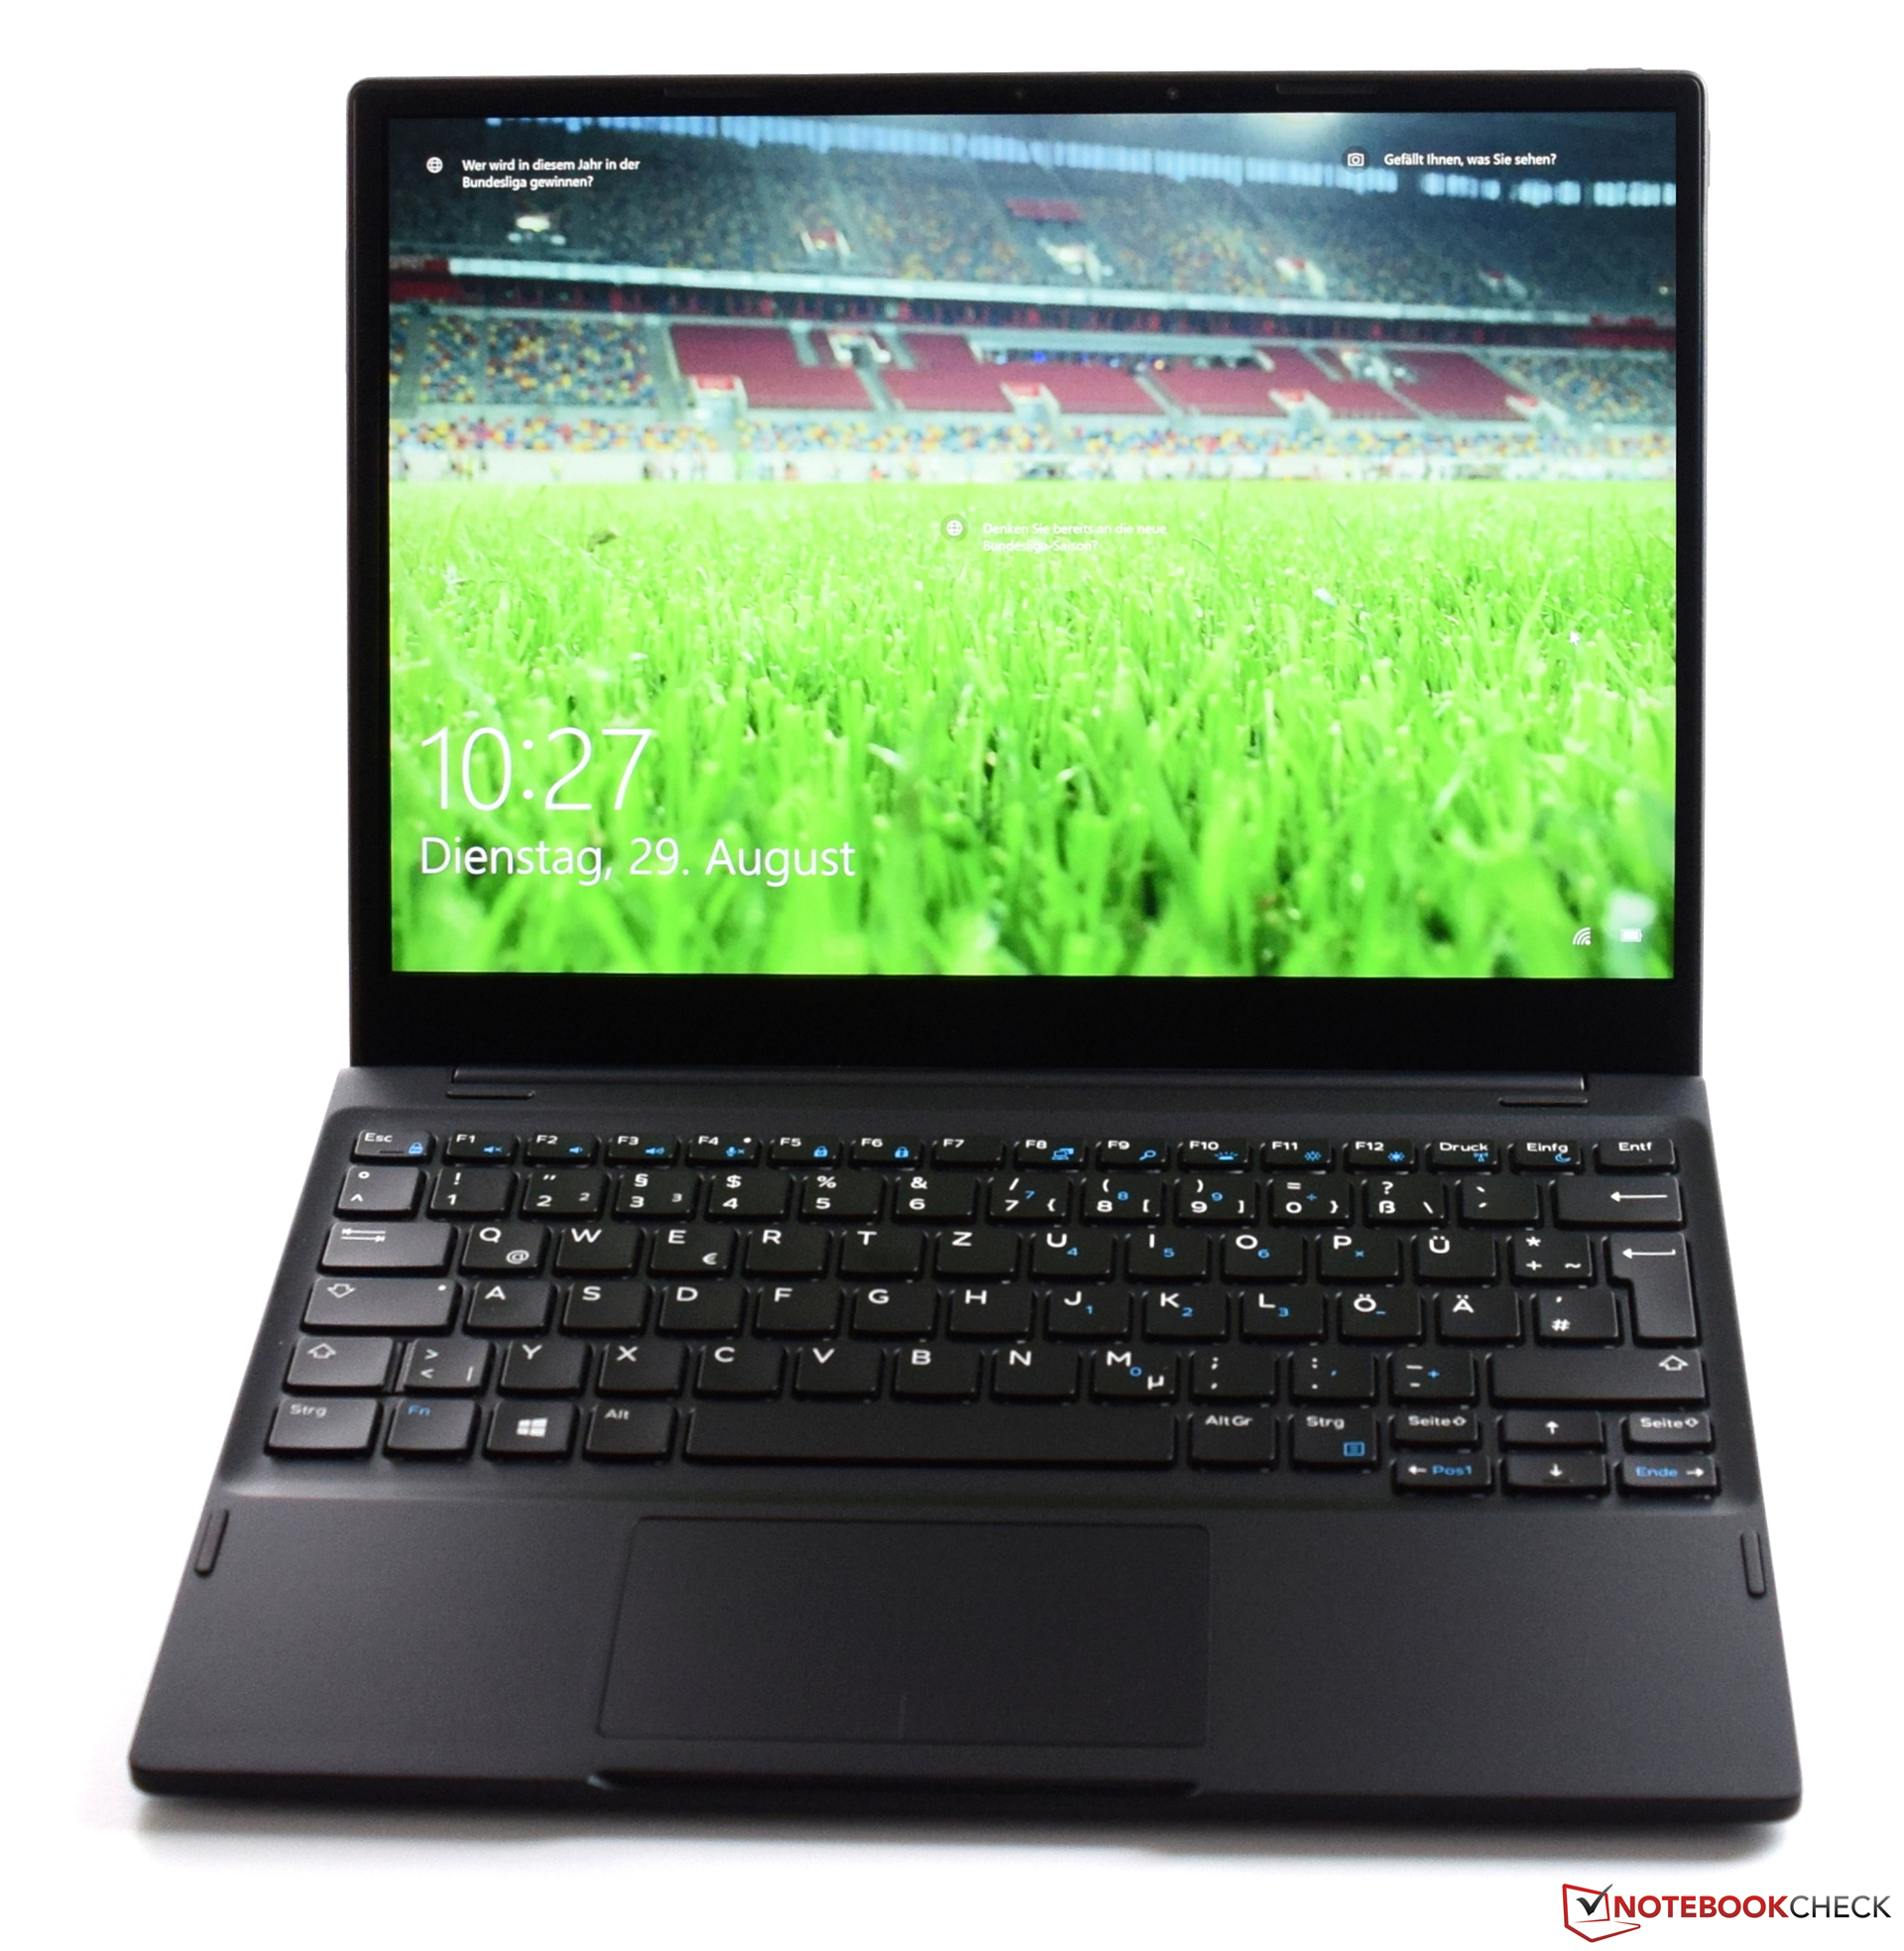
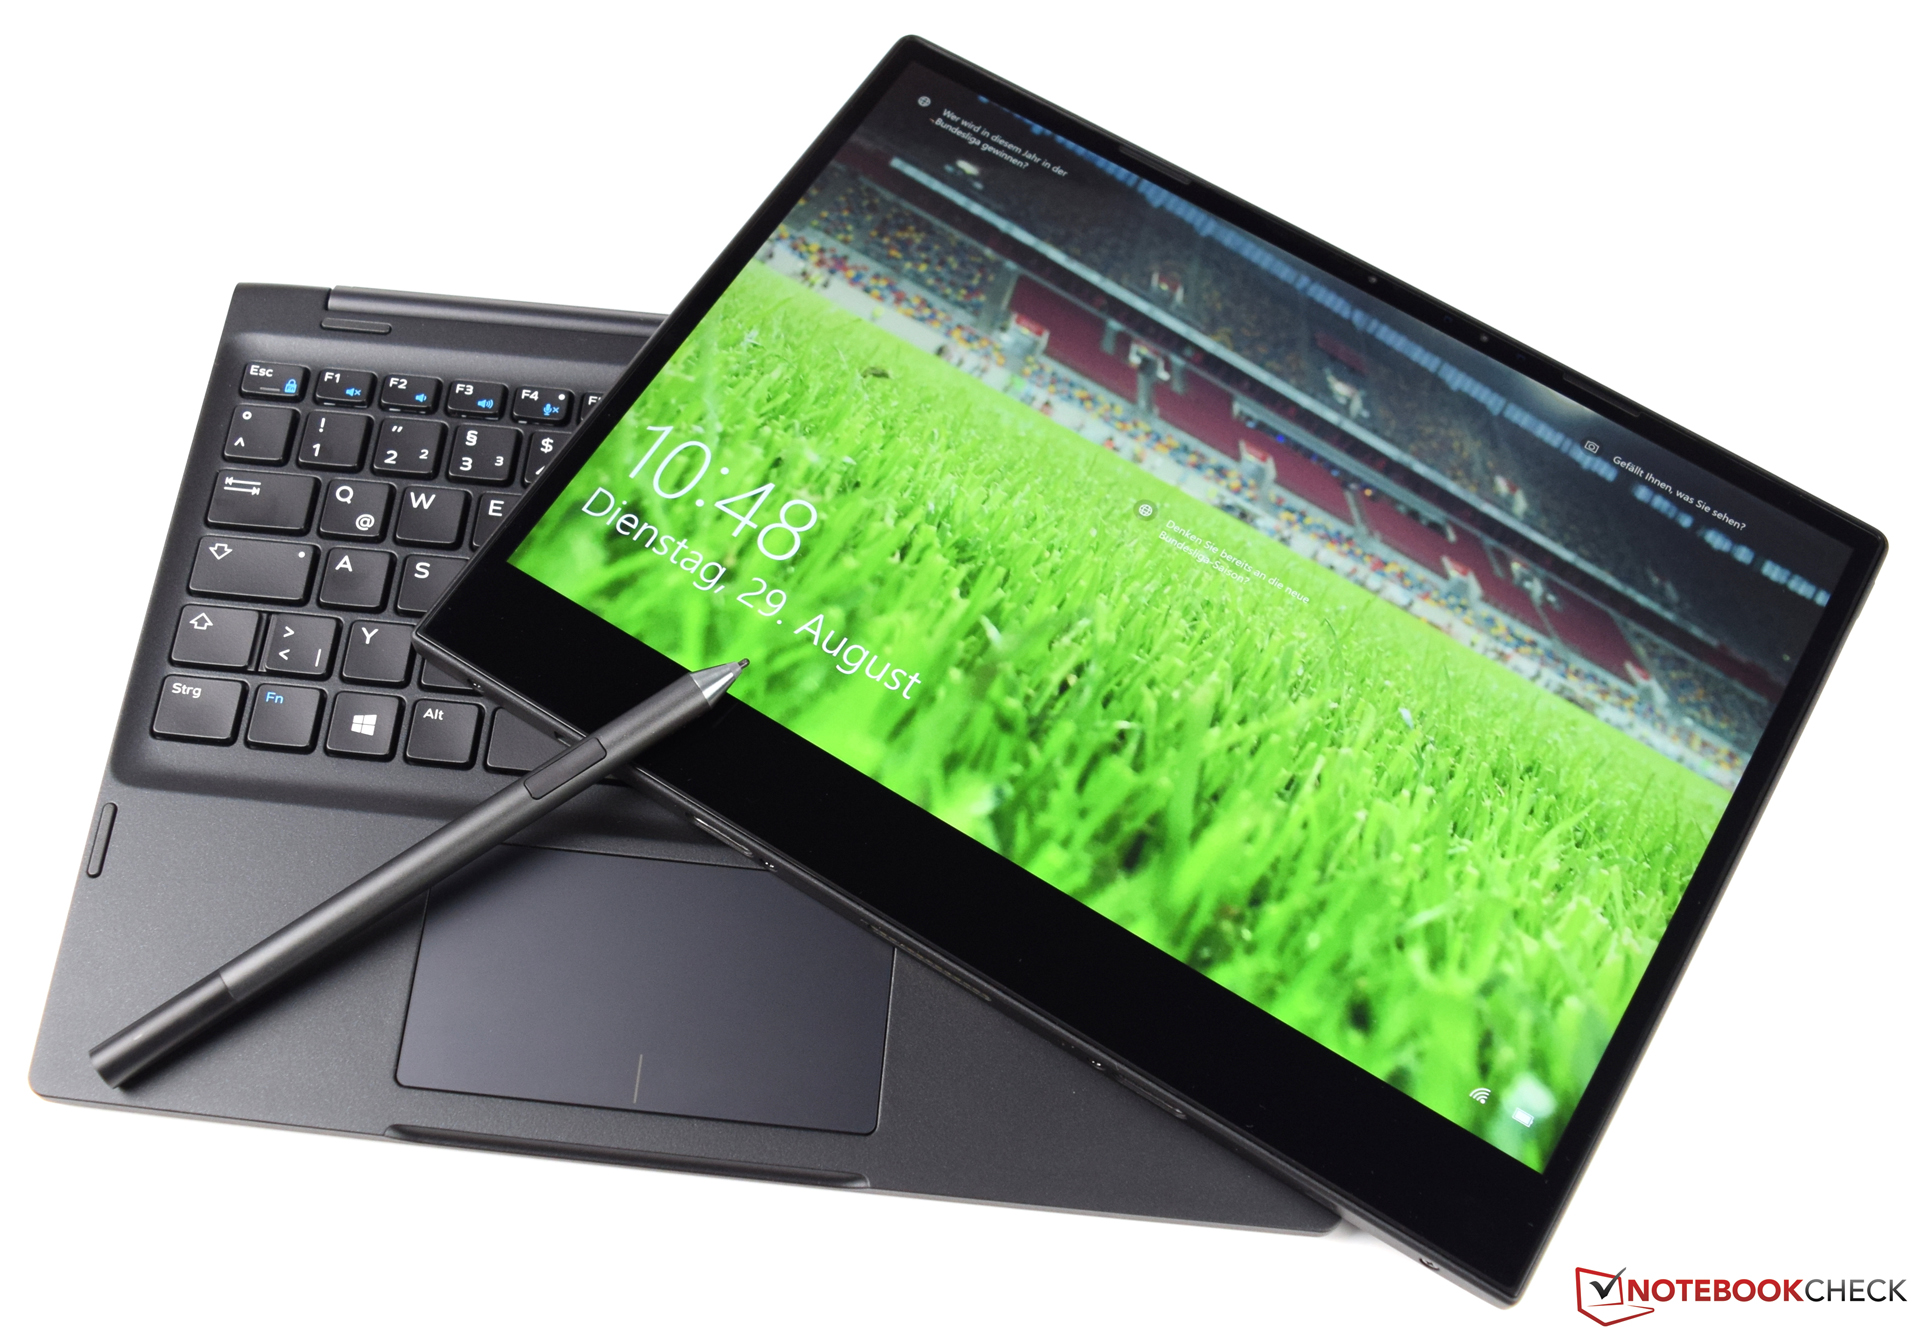
Dell Latitude 7285 (i5-7Y57, 256 GB, 3K) Convertible rövid értékelés


| SD Card Reader | |
| average JPG Copy Test (av. of 3 runs) | |
| Lenovo ThinkPad X1 Yoga 2017 20JES03T00 (Toshiba Exceria Pro M401) | |
| Dell Latitude 12 5285 2-in-1 (Toshiba THN-M401S0640E2) | |
| Dell Latitude 7285 (Toshiba Exceria Pro M501) | |
| maximum AS SSD Seq Read Test (1GB) | |
| Lenovo ThinkPad X1 Yoga 2017 20JES03T00 (Toshiba Exceria Pro M401) | |
| Dell Latitude 12 5285 2-in-1 (Toshiba THN-M401S0640E2) | |
| Dell Latitude 7285 (Toshiba Exceria Pro M501) | |
| |||||||||||||||||||||||||
Fényerő megoszlás: 86 %
Centrumban: 525 cd/m²
Kontraszt: 1435:1 (Fekete: 0.37 cd/m²)
ΔE ColorChecker Calman: 3.5 | ∀{0.5-29.43 Ø4.73}
ΔE Greyscale Calman: 4.7 | ∀{0.09-98 Ø4.97}
99.8% sRGB (Argyll 1.6.3 3D)
67.6% AdobeRGB 1998 (Argyll 1.6.3 3D)
74.1% AdobeRGB 1998 (Argyll 3D)
99.8% sRGB (Argyll 3D)
73.3% Display P3 (Argyll 3D)
Gamma: 2.04
CCT: 6581 K
| Dell Latitude 7285 SHP1482 (LQ123Z1), , 2880x1920, 12.3" | Microsoft Surface Pro (2017) i5 LG Display LP123WQ112604, , 2736x1824, 12.3" | Lenovo ThinkPad X1 Yoga 2017 20JES03T00 LEN4140, , 2560x1440, 14" | Dell Latitude 12 5285 2-in-1 BOE06DC, , 1920x1280, 12.3" | Acer Switch 5 SW512-52-5819 WST KL.1200w.004, , 2160x1440, 12" | Toshiba Portege X20W-D-10R Toshiba TOS508F, , 1920x1080, 12.5" | HP Elite x2 1012 G1 LG Philips, , 1920x1280, 12.1" | |
|---|---|---|---|---|---|---|---|
| Display | -5% | -11% | -17% | -5% | -27% | ||
| Display P3 Coverage (%) | 73.3 | 67.6 -8% | 62.8 -14% | 58.8 -20% | 68.7 -6% | 53.8 -27% | |
| sRGB Coverage (%) | 99.8 | 99 -1% | 94 -6% | 87.5 -12% | 96.8 -3% | 73.7 -26% | |
| AdobeRGB 1998 Coverage (%) | 74.1 | 69.1 -7% | 64.7 -13% | 60.6 -18% | 70.4 -5% | 53.8 -27% | |
| Response Times | 5% | 91% | 2% | 15% | -40% | 25% | |
| Response Time Grey 50% / Grey 80% * (ms) | 44 ? | 42 ? 5% | 3.6 ? 92% | 42.4 ? 4% | 37 ? 16% | 67 ? -52% | 33.2 ? 25% |
| Response Time Black / White * (ms) | 30.4 ? | 29 ? 5% | 3.2 ? 89% | 30.8 ? -1% | 26 ? 14% | 39 ? -28% | 22.8 ? 25% |
| PWM Frequency (Hz) | 922 ? | 21000 | 240.4 ? | 210.1 ? | |||
| Screen | 2% | -18% | -10% | -33% | -17% | -35% | |
| Brightness middle (cd/m²) | 531 | 417 -21% | 243 -54% | 523.2 -1% | 369 -31% | 442 -17% | 322 -39% |
| Brightness (cd/m²) | 490 | 401 -18% | 240 -51% | 522 7% | 331 -32% | 410 -16% | 319 -35% |
| Brightness Distribution (%) | 86 | 88 2% | 95 10% | 88 2% | 75 -13% | 86 0% | 97 13% |
| Black Level * (cd/m²) | 0.37 | 0.29 22% | 0.42 -14% | 0.46 -24% | 0.22 41% | 0.42 -14% | |
| Contrast (:1) | 1435 | 1438 0% | 1246 -13% | 802 -44% | 2009 40% | 767 -47% | |
| Colorchecker dE 2000 * | 3.5 | 3.63 -4% | 5.3 -51% | 4 -14% | 5.52 -58% | 5.22 -49% | 6.02 -72% |
| Colorchecker dE 2000 max. * | 6.2 | 6.74 -9% | 8.9 -44% | 8.6 -39% | 9.29 -50% | 11.84 -91% | 10.06 -62% |
| Greyscale dE 2000 * | 4.7 | 2.18 54% | 3.7 21% | 5.5 -17% | 6.95 -48% | 7.88 -68% | 6.29 -34% |
| Gamma | 2.04 108% | 3.09 71% | 1.78 124% | 2.16 102% | 2.58 85% | 2.51 88% | 2.4 92% |
| CCT | 6581 99% | 6767 96% | 6202 105% | 7546 86% | 7009 93% | 6756 96% | 7712 84% |
| Color Space (Percent of AdobeRGB 1998) (%) | 67.6 | 63 -7% | 84.8 25% | 64.86 -4% | 56 -17% | 64 -5% | 47.8 -29% |
| Color Space (Percent of sRGB) (%) | 99.8 | 99 -1% | 100 0% | 93.97 -6% | 88 -12% | 97 -3% | 73.2 -27% |
| Teljes átlag (program / beállítások) | 1% /
1% | 37% /
4% | -6% /
-9% | -12% /
-23% | -21% /
-17% | -12% /
-25% |
* ... a kisebb jobb
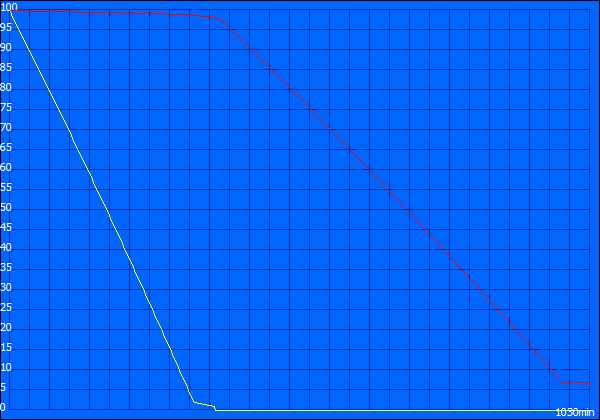
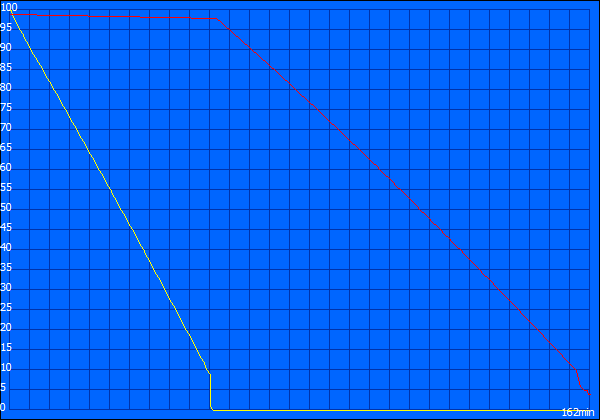
Megjelenítési válaszidők
| ↔ Válaszidő Fekete-fehér | ||
|---|---|---|
| 30.4 ms ... emelkedés és süllyedés ↘ kombinálva | ↗ 15.6 ms emelkedés | 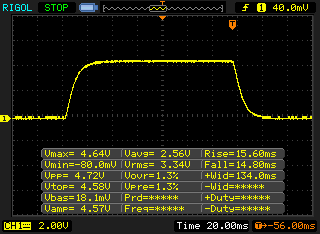 |
| ↘ 14.8 ms ősz | ||
| A képernyő lassú reakciósebességet mutat tesztjeinkben, és nem lesz kielégítő a játékosok számára. Összehasonlításképpen, az összes tesztelt eszköz 0.1 (minimum) és 240 (maximum) ms között mozog. » 82 % of all devices are better. Ez azt jelenti, hogy a mért válaszidő rosszabb, mint az összes vizsgált eszköz átlaga (19.9 ms). | ||
| ↔ Válaszidő 50% szürke és 80% szürke között | ||
| 44 ms ... emelkedés és süllyedés ↘ kombinálva | ↗ 19.6 ms emelkedés | 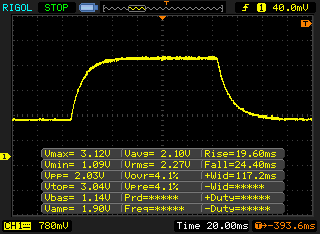 |
| ↘ 24.4 ms ősz | ||
| A képernyő lassú reakciósebességet mutat tesztjeinkben, és nem lesz kielégítő a játékosok számára. Összehasonlításképpen, az összes tesztelt eszköz 0.165 (minimum) és 636 (maximum) ms között mozog. » 73 % of all devices are better. Ez azt jelenti, hogy a mért válaszidő rosszabb, mint az összes vizsgált eszköz átlaga (31.1 ms). | ||
Képernyő villogása / PWM (impulzusszélesség-moduláció)
| Képernyő villogása / PWM észlelve | 922 Hz | ≤ 20 % fényerő beállítása | 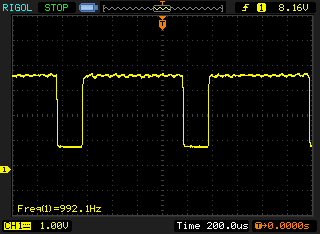 |
A kijelző háttérvilágítása 922 Hz-en villog (a legrosszabb esetben, pl. PWM használatával) Villódzás észlelve a 20 % vagy annál kisebb fényerő-beállításnál. E fényerő-beállítás felett nem lehet villogás vagy PWM. A 922 Hz frekvenciája meglehetősen magas, így a legtöbb PWM-re érzékeny felhasználó nem észlel semmilyen villogást. Összehasonlításképpen: az összes tesztelt eszköz 52 %-a nem használja a PWM-et a kijelző elsötétítésére. Ha PWM-et észleltek, akkor átlagosan 7791 (minimum: 5 - maximum: 343500) Hz-t mértek. | |||

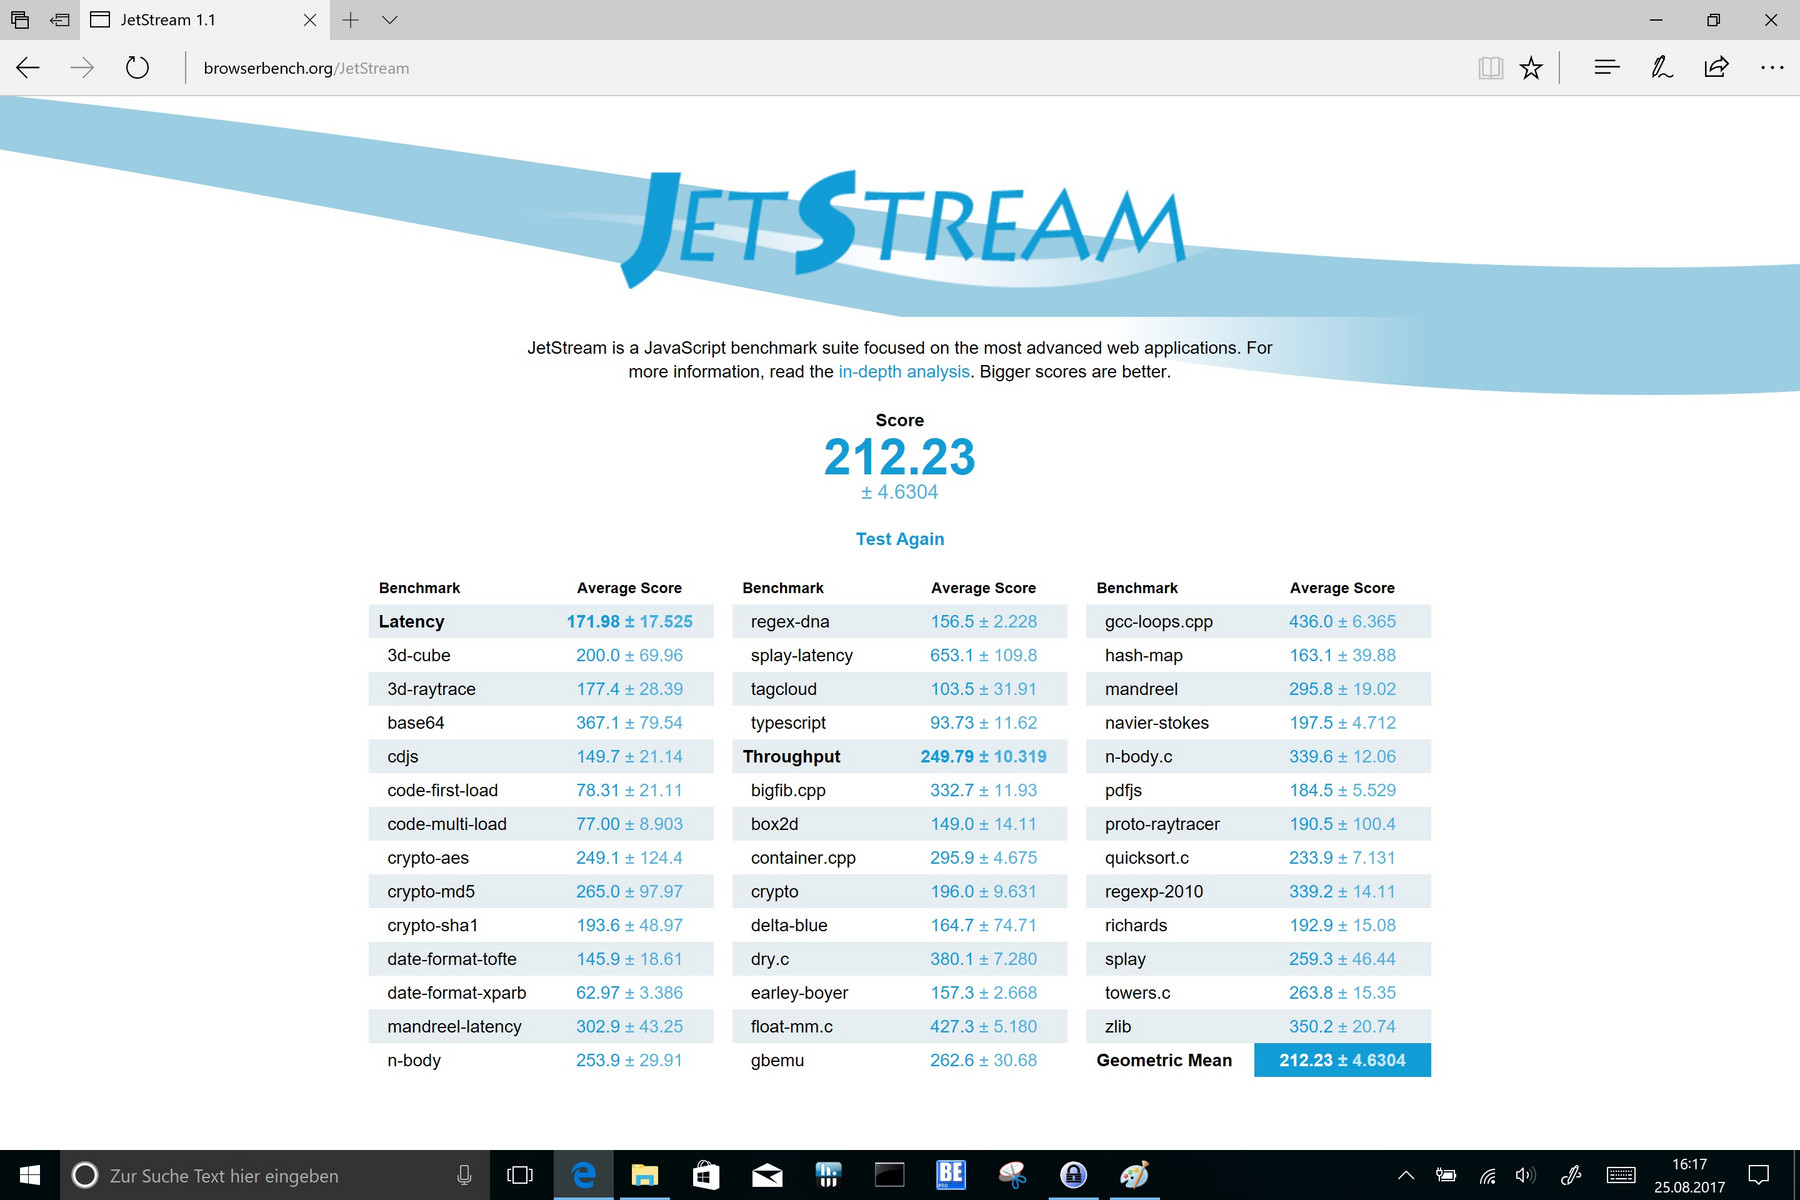
| JetStream 1.1 - 1.1 Total | |
| Lenovo ThinkPad X1 Yoga 2017 20JES03T00 | |
| Toshiba Portege X20W-D-10R | |
| Acer Switch 5 SW512-52-5819 | |
| Microsoft Surface Pro (2017) i5 | |
| Dell Latitude 7285 | |
| HP Elite x2 1012 G1 | |
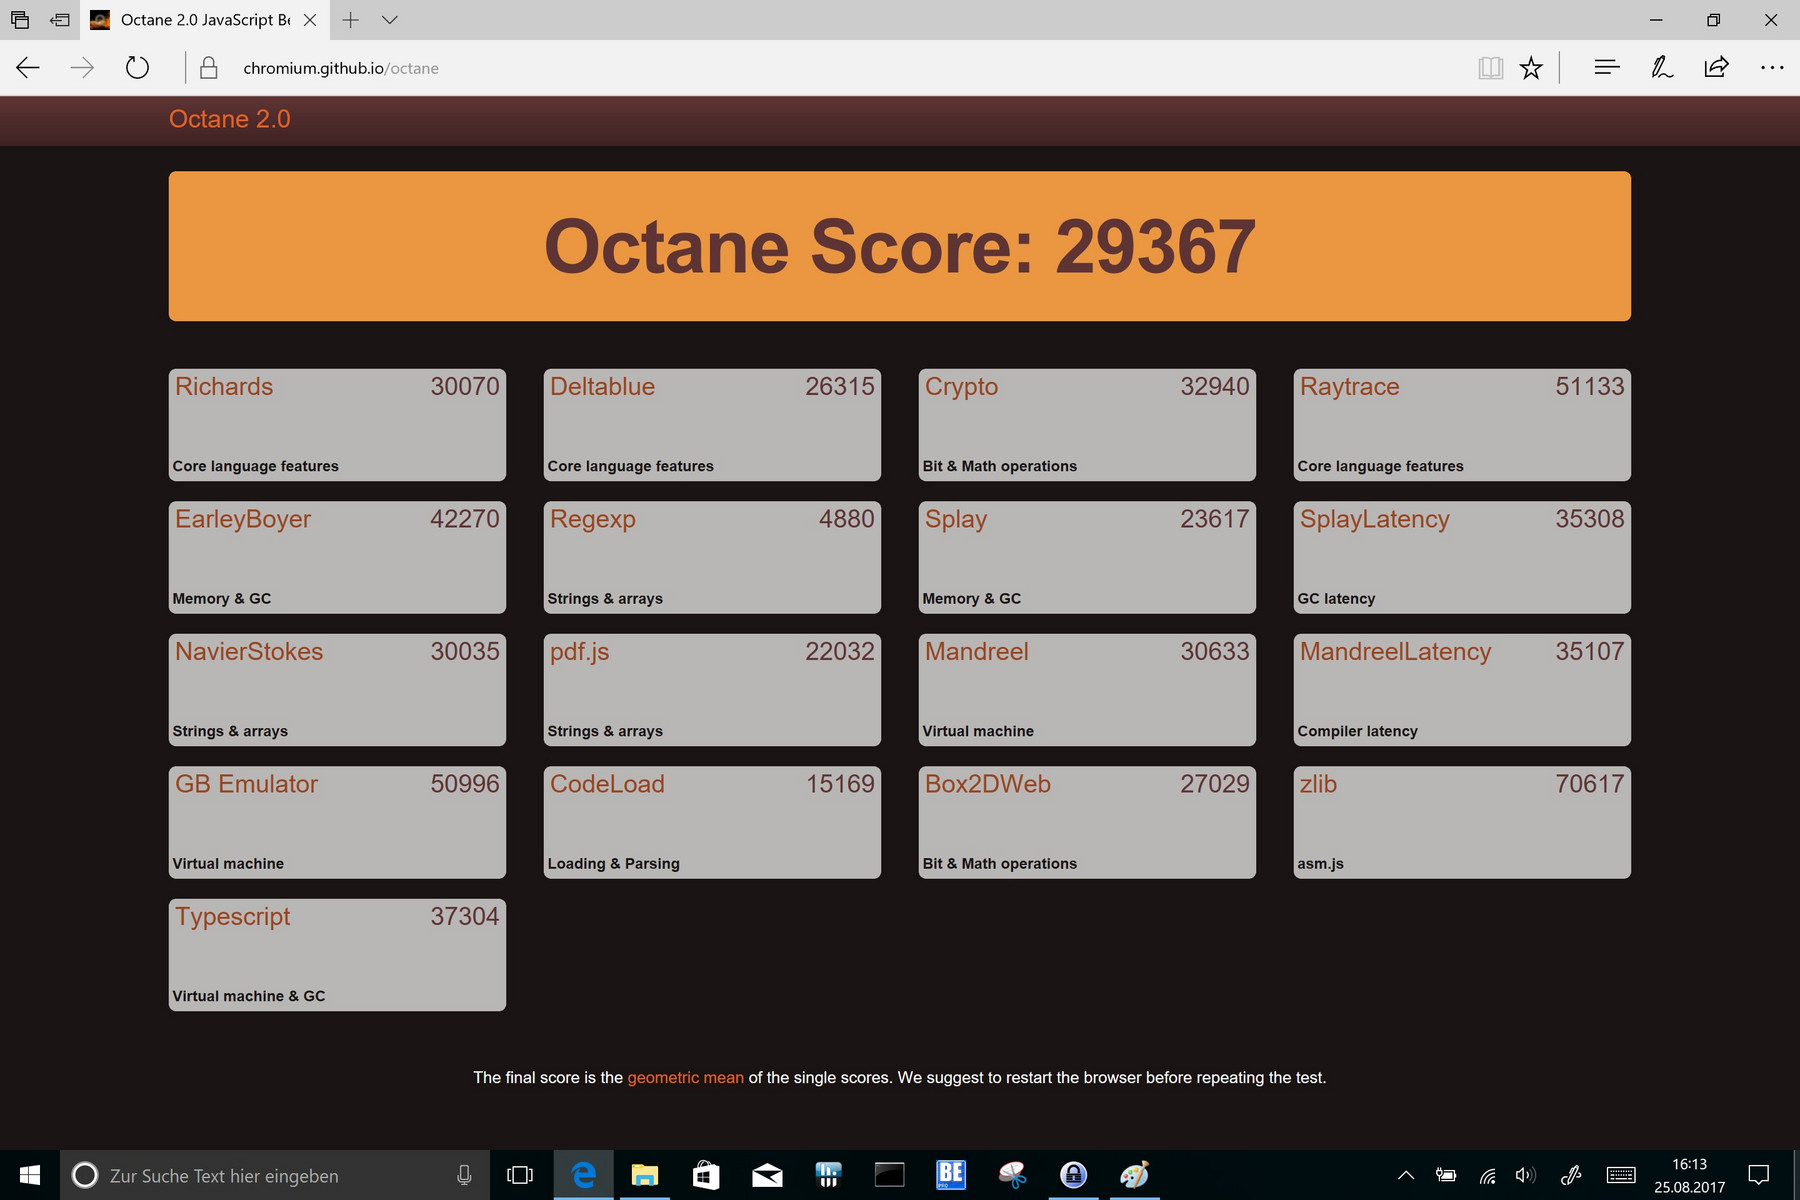
| Octane V2 - Total Score | |
| Toshiba Portege X20W-D-10R | |
| Microsoft Surface Pro (2017) i5 | |
| Acer Switch 5 SW512-52-5819 | |
| Lenovo ThinkPad X1 Yoga 2017 20JES03T00 | |
| Dell Latitude 7285 | |
| HP Elite x2 1012 G1 | |
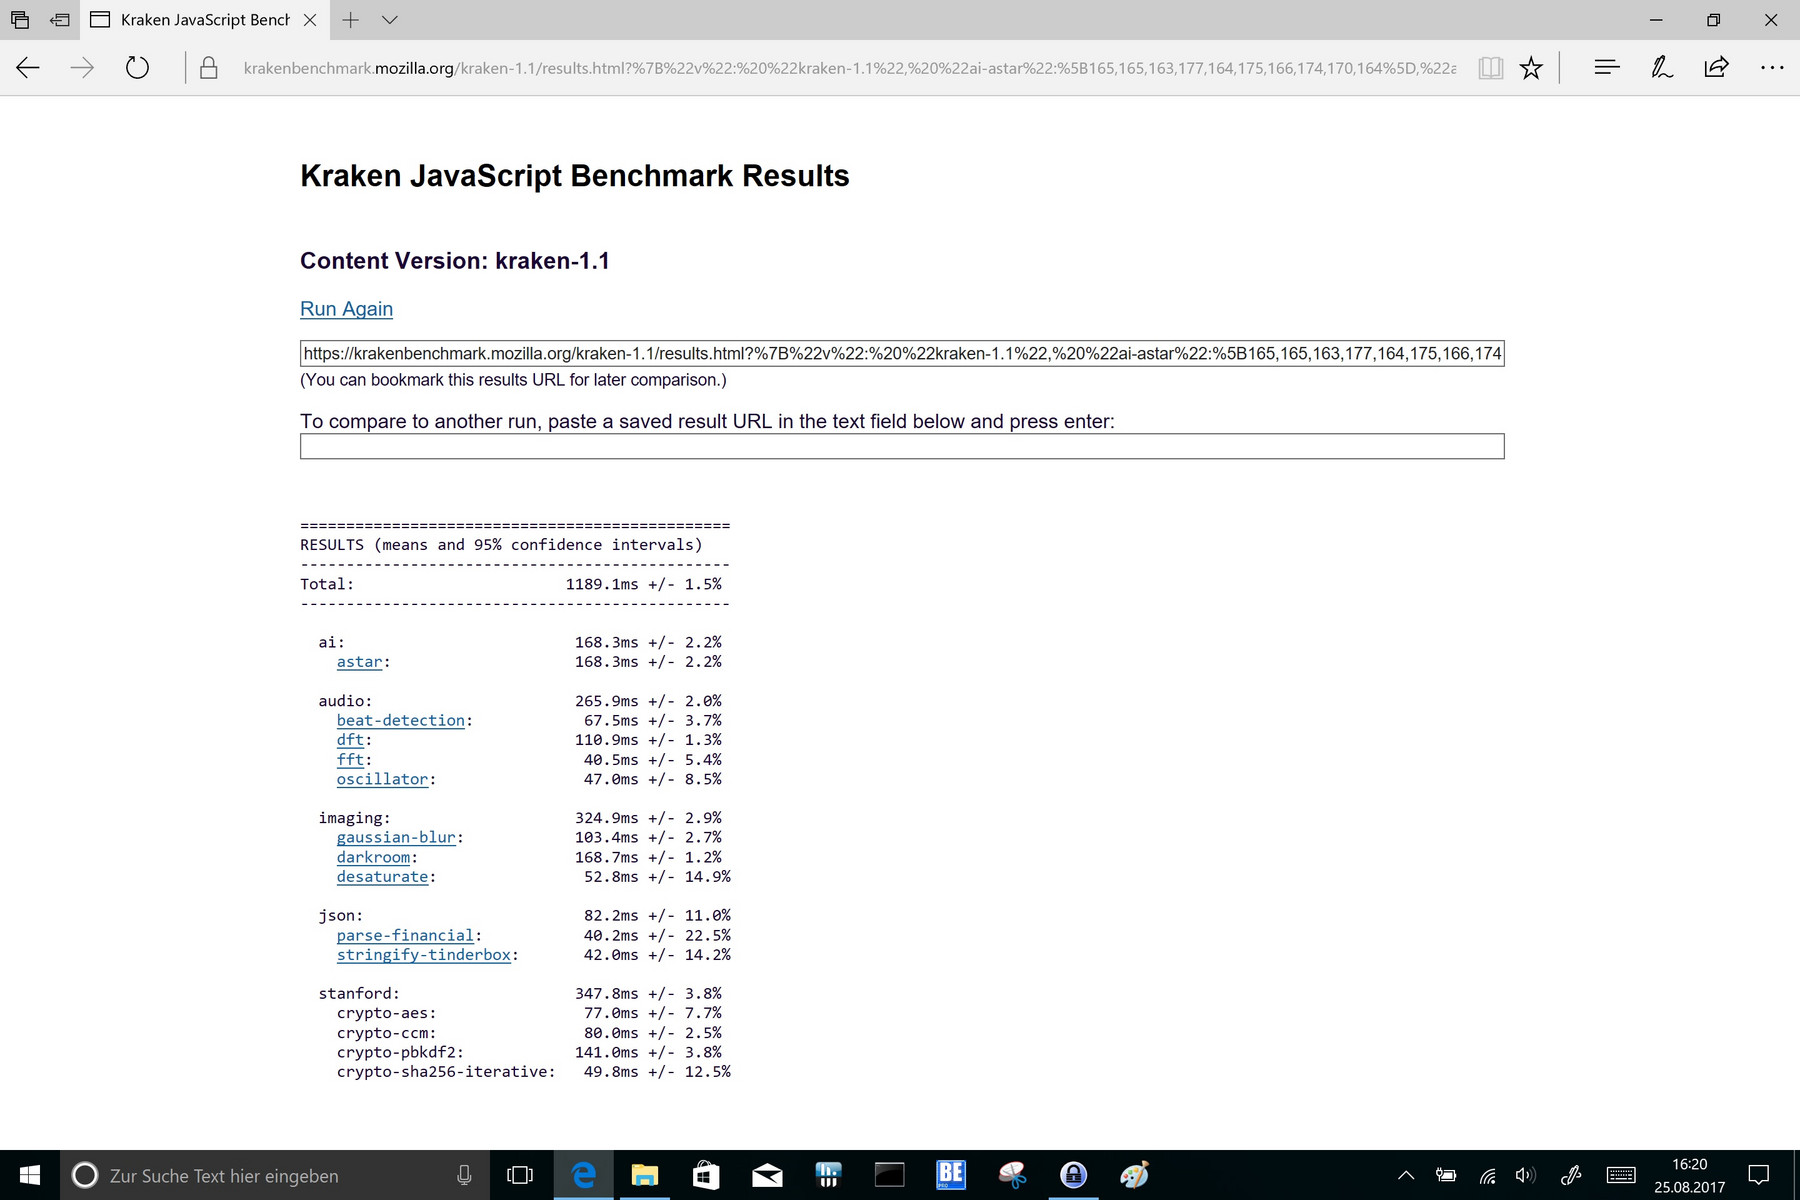
| Mozilla Kraken 1.1 - Total | |
| HP Elite x2 1012 G1 | |
| Dell Latitude 7285 | |
| Acer Switch 5 SW512-52-5819 | |
| Toshiba Portege X20W-D-10R | |
| Lenovo ThinkPad X1 Yoga 2017 20JES03T00 | |
* ... a kisebb jobb

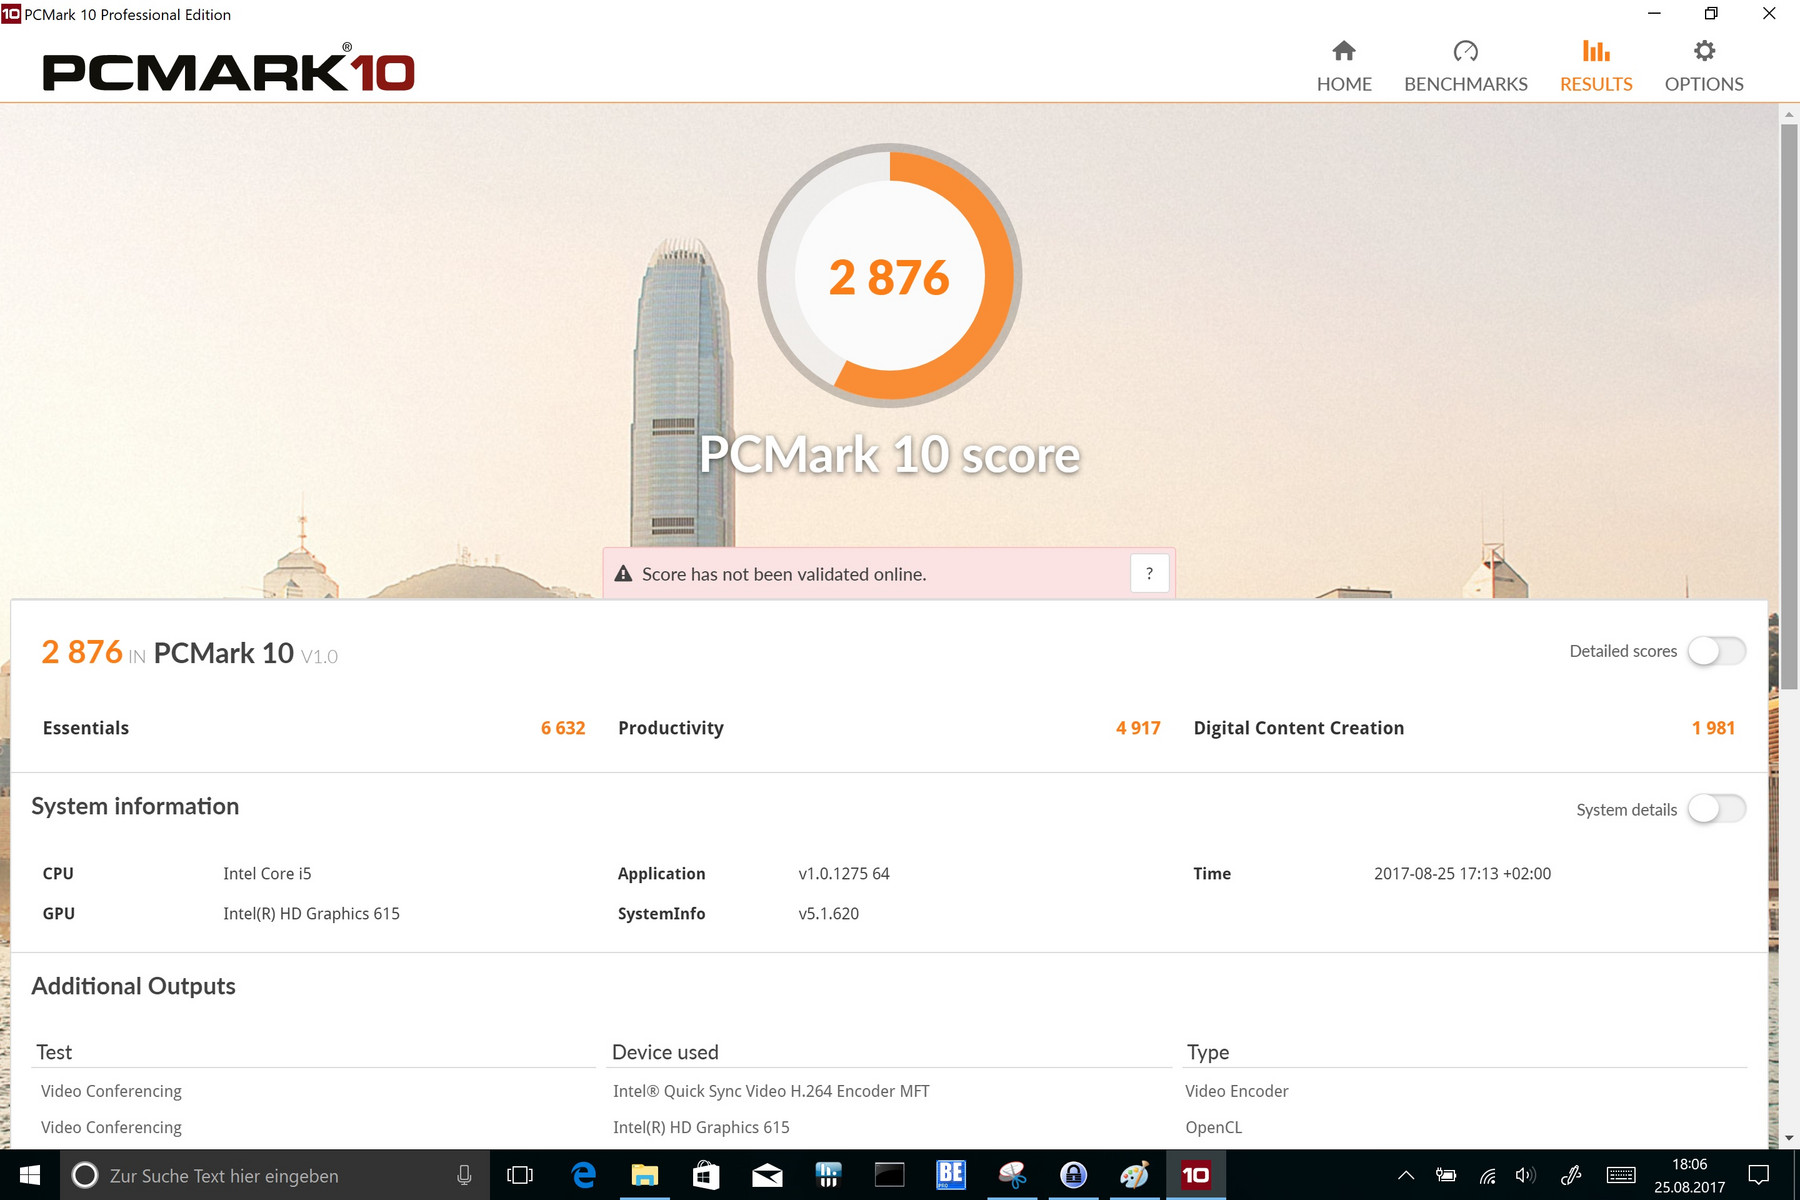
| PCMark 10 | |
| Score | |
| Acer Switch 5 SW512-52-5819 | |
| Microsoft Surface Pro (2017) i5 | |
| Dell Latitude 7285 | |
| Productivity | |
| Acer Switch 5 SW512-52-5819 | |
| Microsoft Surface Pro (2017) i5 | |
| Dell Latitude 7285 | |
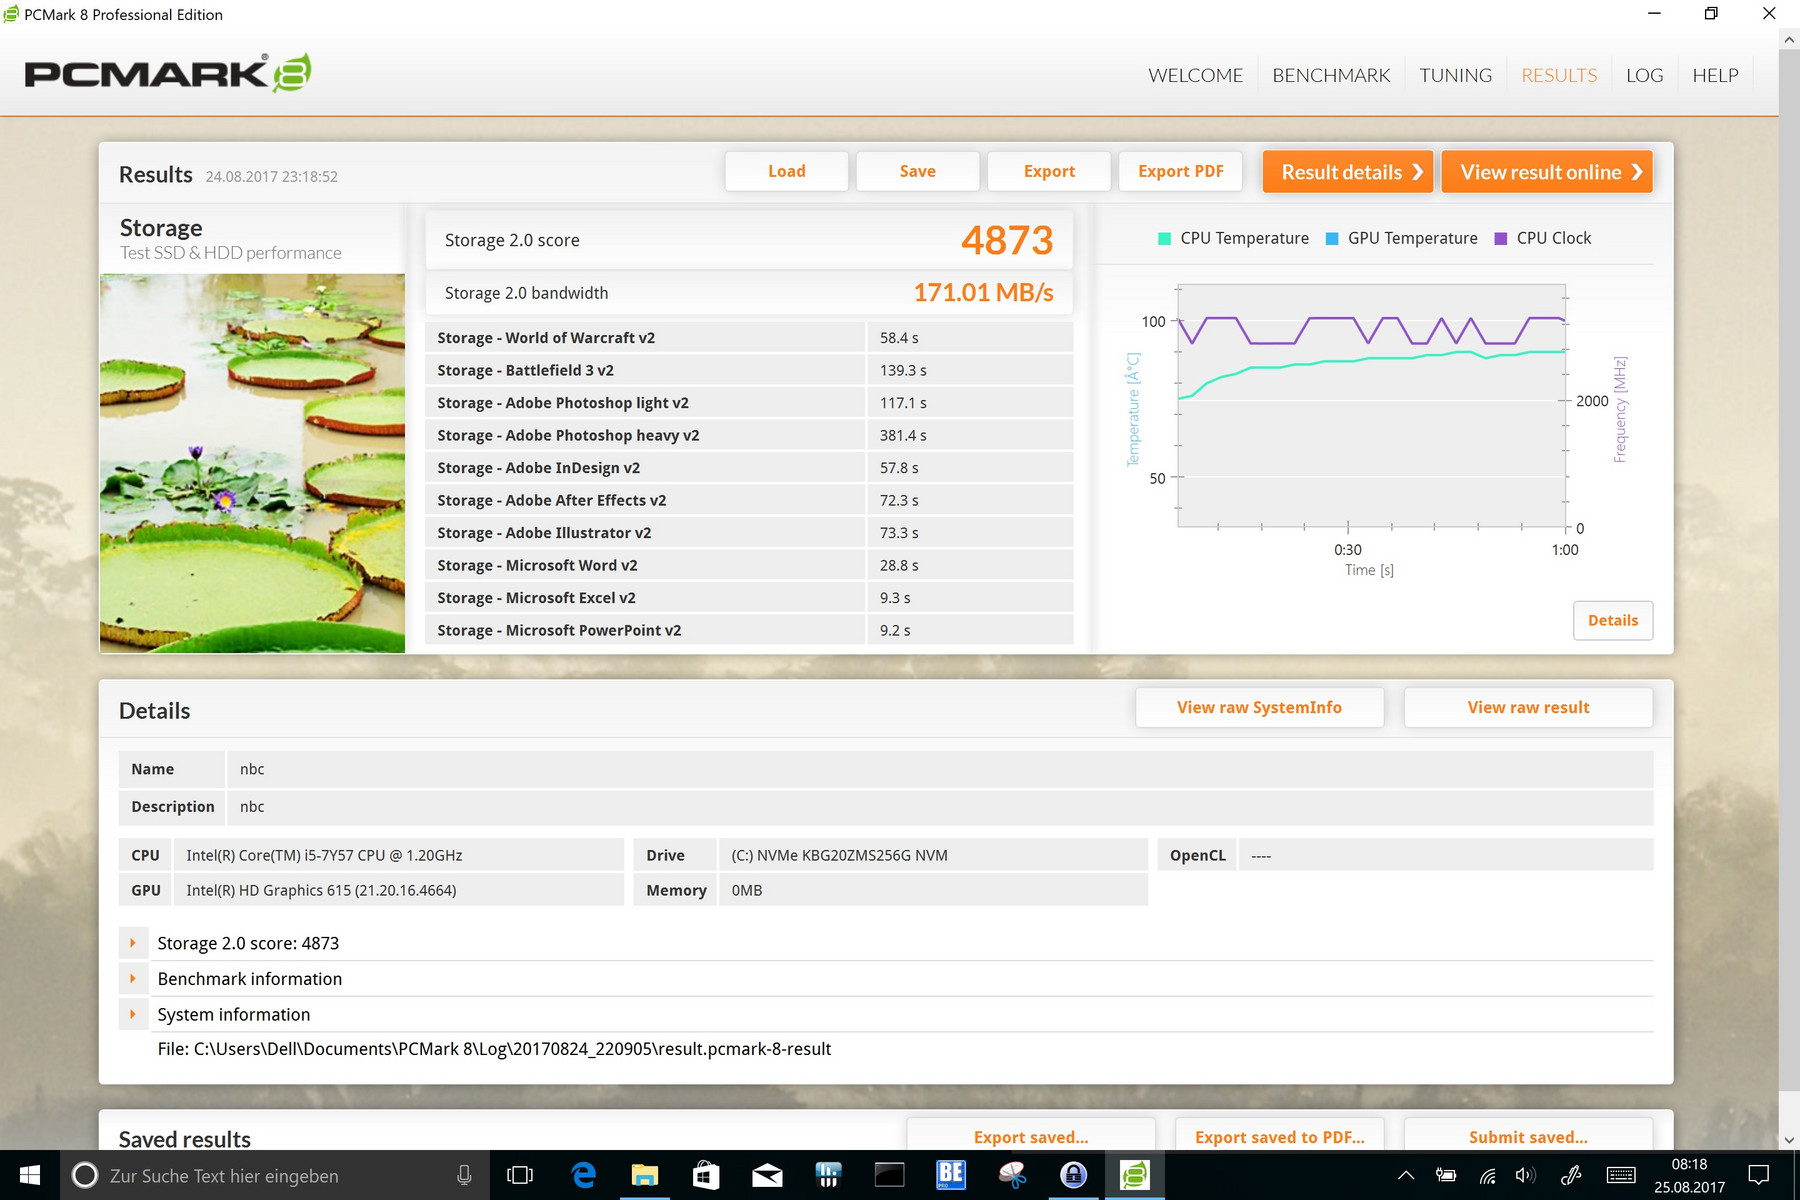
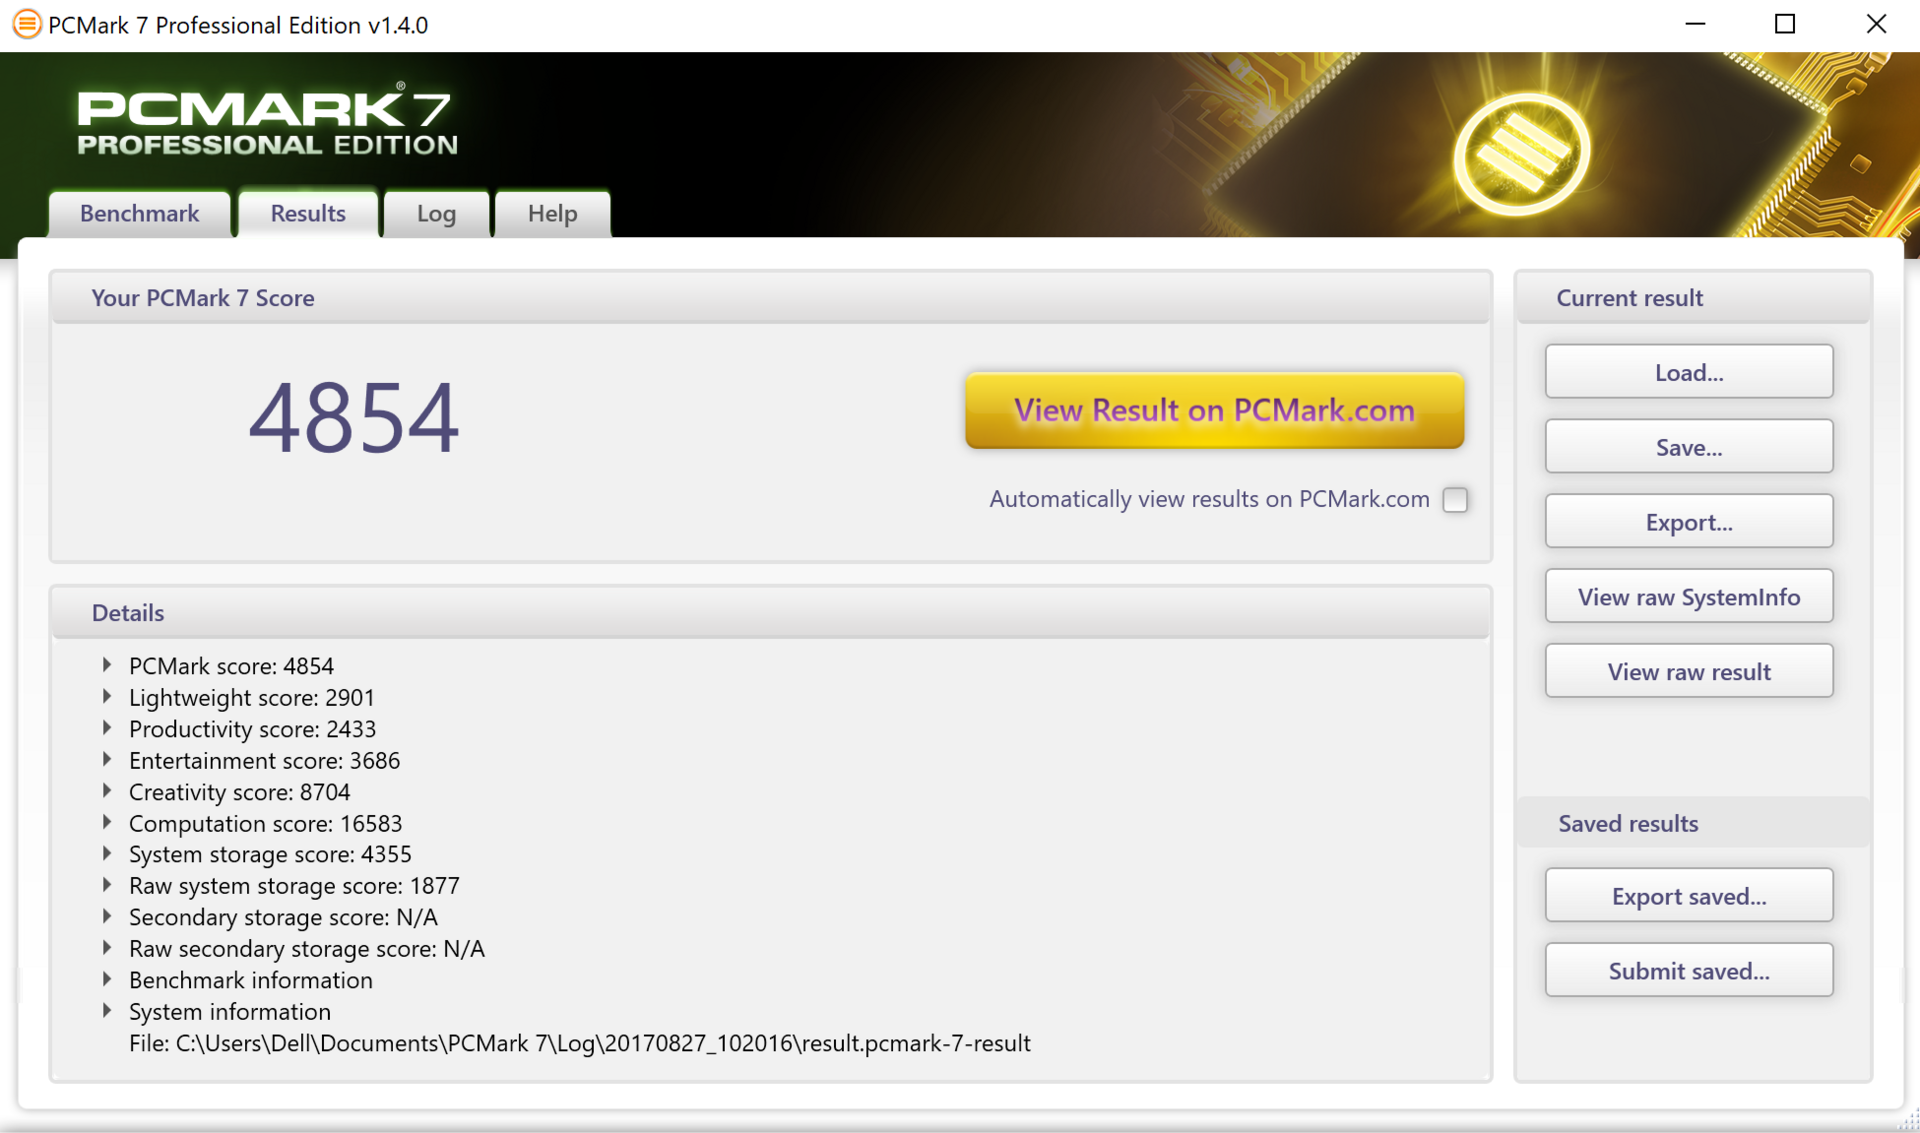
| PCMark 7 Score | 4854 pontok | |
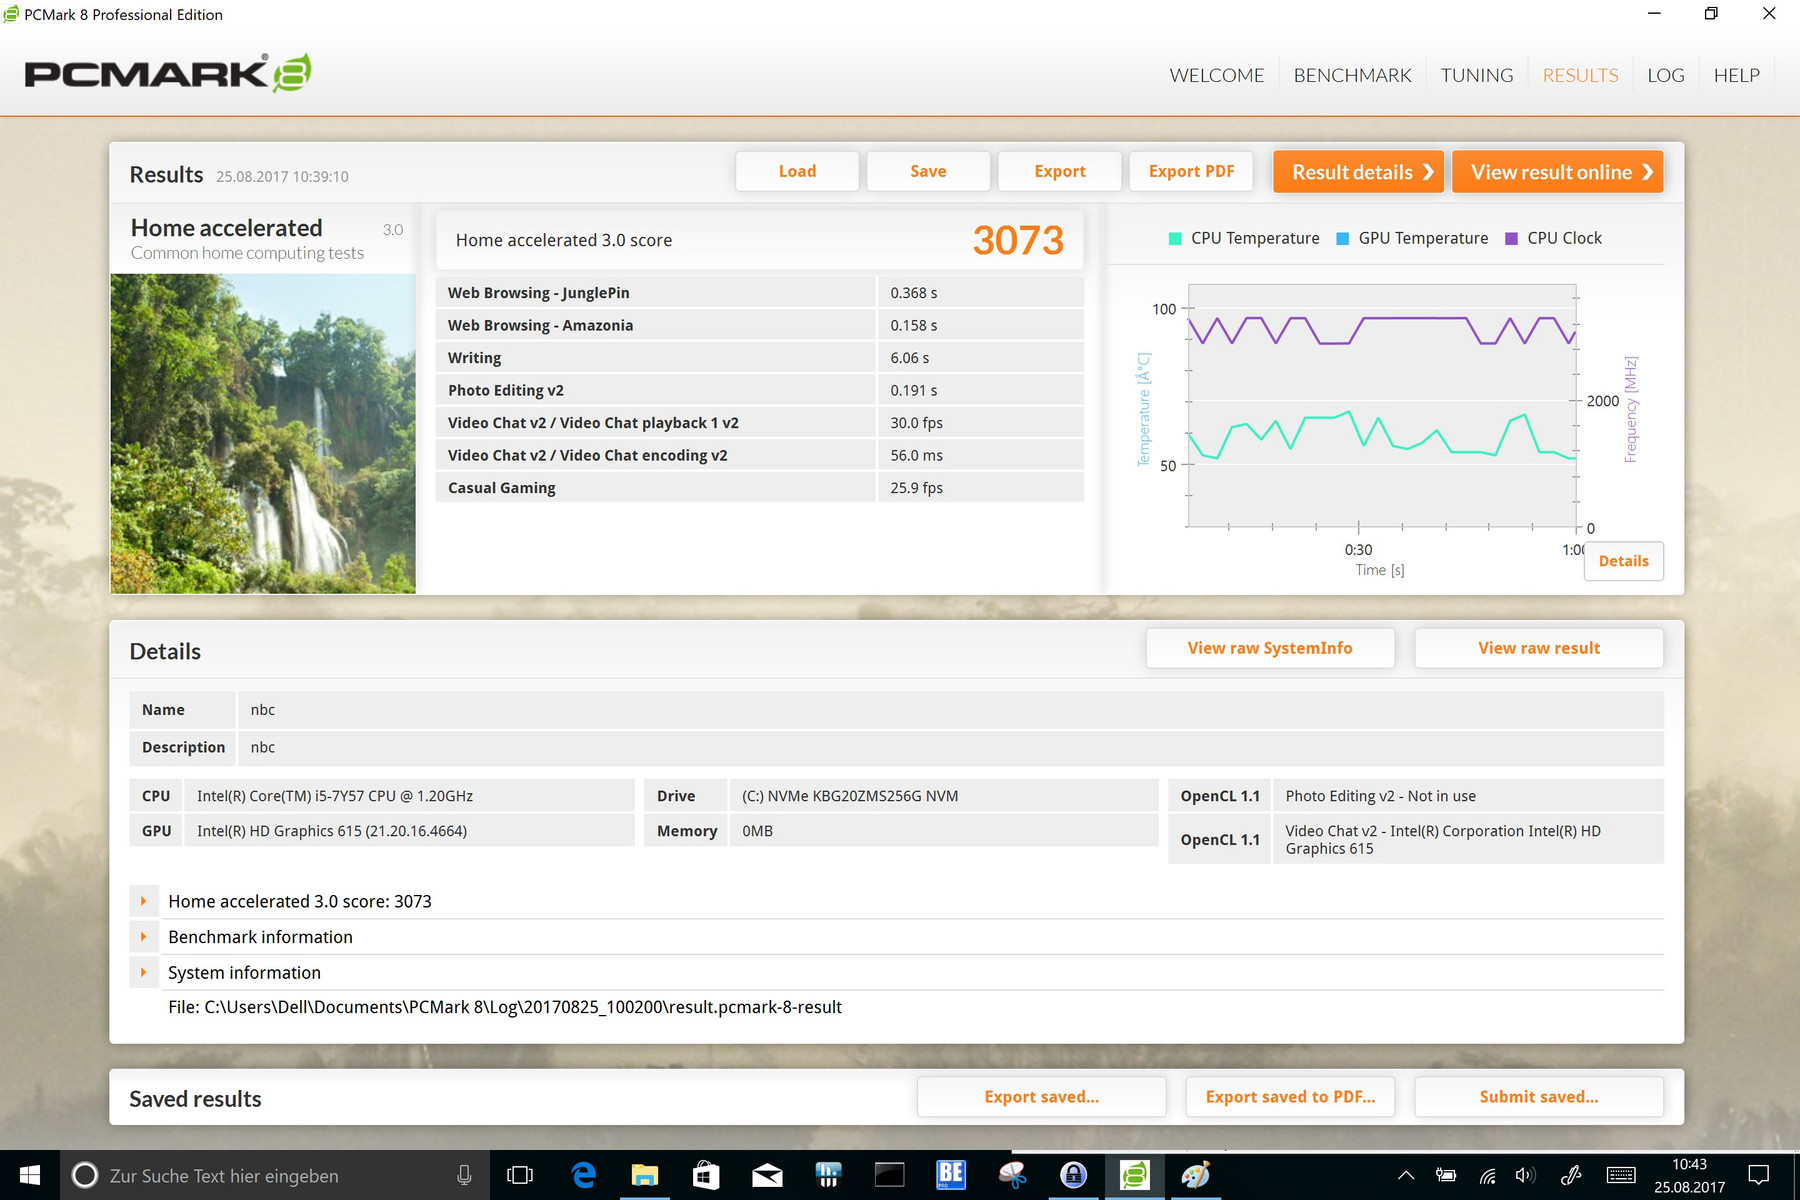
| PCMark 8 Home Score Accelerated v2 | 3073 pontok | |
| PCMark 8 Creative Score Accelerated v2 | 4137 pontok | |
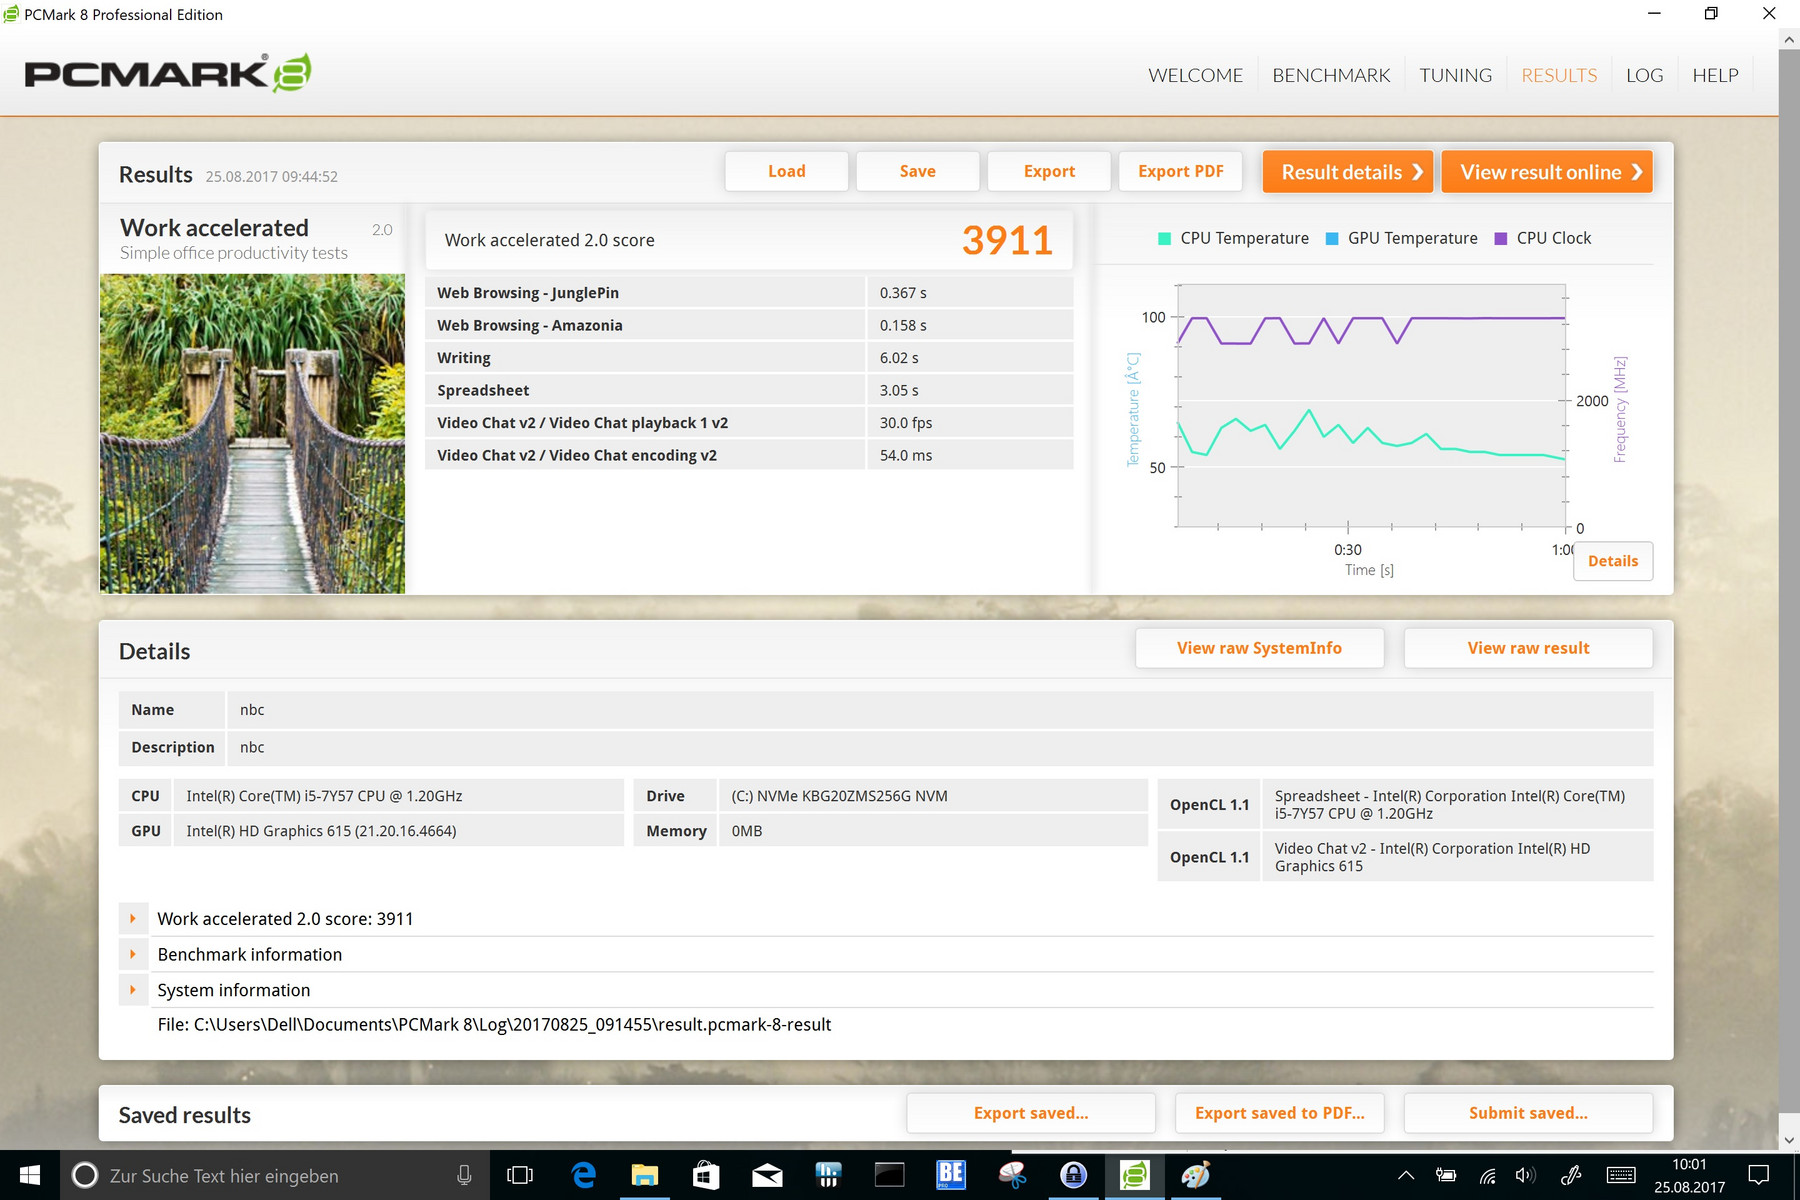
| PCMark 8 Work Score Accelerated v2 | 3911 pontok | |
| PCMark 10 Score | 2876 pontok | |
Segítség | ||
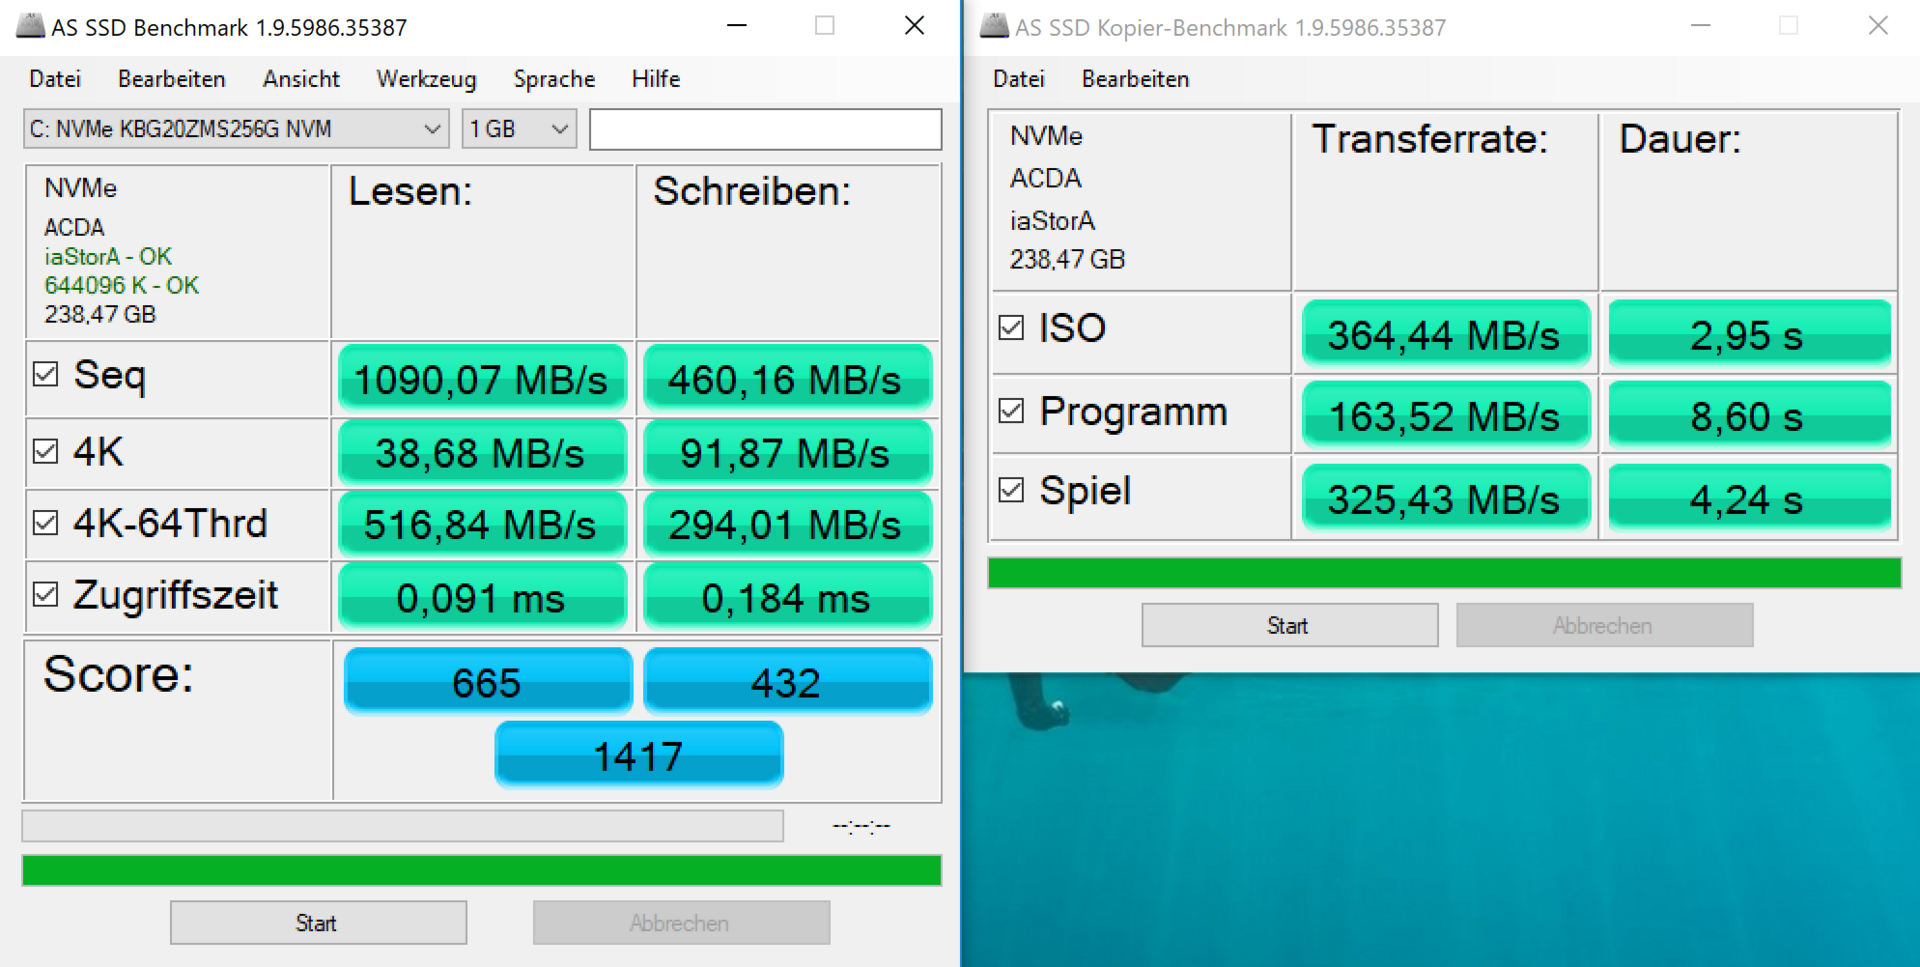
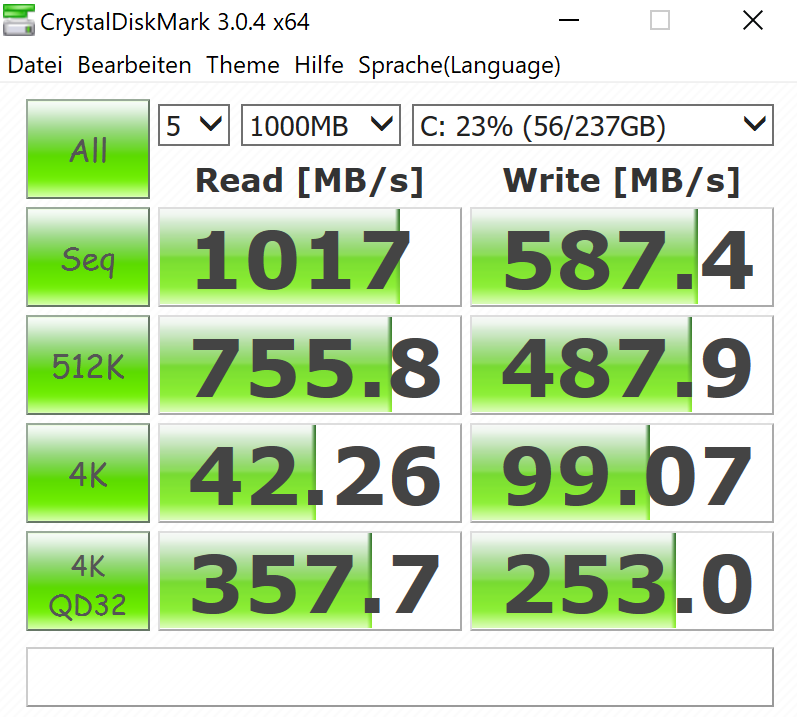
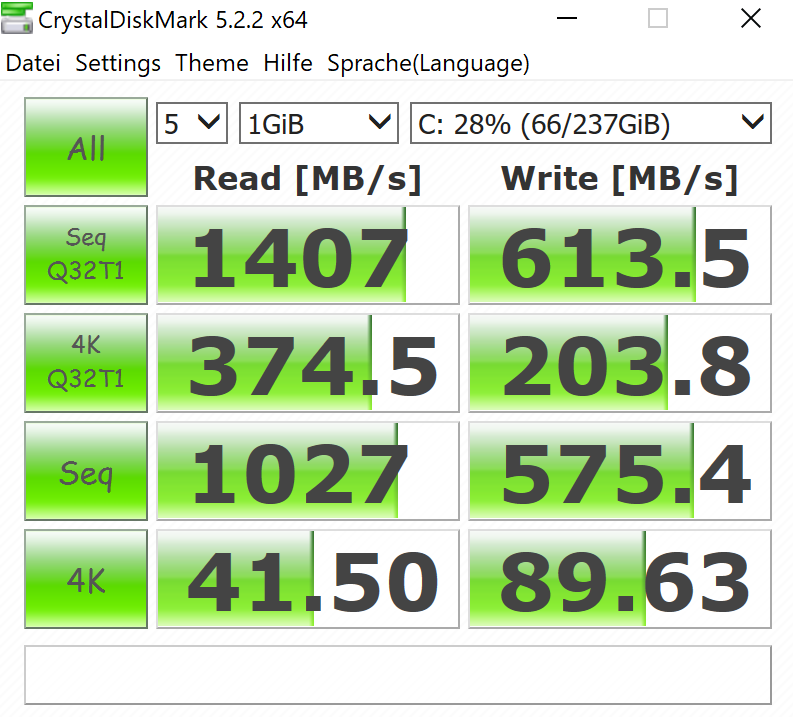
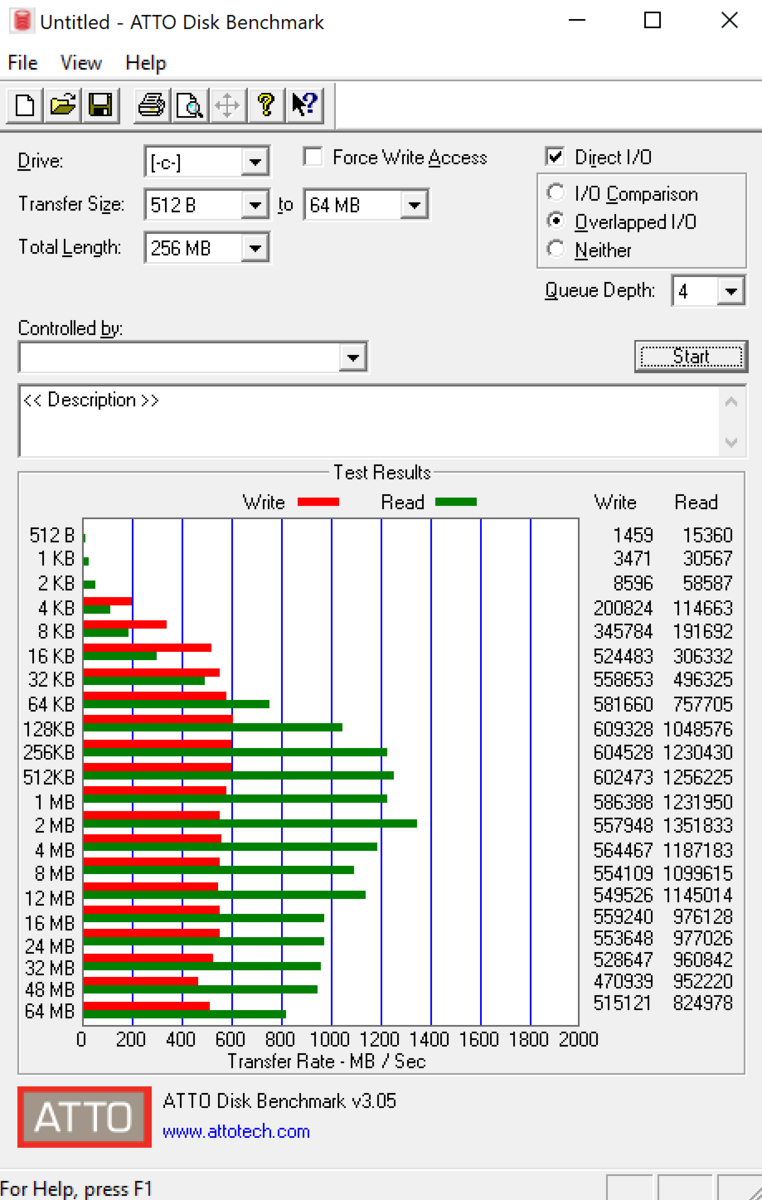
| Dell Latitude 7285 Toshiba KBG20ZMS256G | Microsoft Surface Pro (2017) i5 Samsung PM971 KUS030202M | Lenovo ThinkPad X1 Yoga 2017 20JES03T00 Samsung SSD PM961 1TB M.2 PCIe 3.0 x4 NVMe (MZVLW1T0) | Dell Latitude 12 5285 2-in-1 Samsung PM961 MZVLW256HEHP | Acer Switch 5 SW512-52-5819 Intel SSD 600p SSDPEKKW512G7 | Toshiba Portege X20W-D-10R Toshiba SG5 THNSNK512GVN8 | HP Elite x2 1012 G1 Liteon L8H-256V2G | |
|---|---|---|---|---|---|---|---|
| CrystalDiskMark 3.0 | 4% | 97% | 13% | 13% | -35% | -32% | |
| Read Seq (MB/s) | 1017 | 723 -29% | 2004 97% | 1294 27% | 1066 5% | 469 -54% | 501 -51% |
| Write Seq (MB/s) | 587 | 853 45% | 1693 188% | 865 47% | 593 1% | 277.3 -53% | 297.2 -49% |
| Read 512 (MB/s) | 756 | 225 -70% | 1040 38% | 406 -46% | 653 -14% | 404.4 -47% | 351.7 -53% |
| Write 512 (MB/s) | 487.9 | 445 -9% | 1292 165% | 589 21% | 535 10% | 266.6 -45% | 295.7 -39% |
| Read 4k (MB/s) | 45.26 | 46 2% | 58.2 29% | 31.75 -30% | 35.92 -21% | 25.24 -44% | 28.31 -37% |
| Write 4k (MB/s) | 99.1 | 125 26% | 182.2 84% | 72.2 -27% | 128.3 29% | 89.4 -10% | 90.3 -9% |
| Read 4k QD32 (MB/s) | 357.7 | 423 18% | 632 77% | 493.3 38% | 460.6 29% | 322.5 -10% | 285 -20% |
| Write 4k QD32 (MB/s) | 253 | 373 47% | 507 100% | 434.5 72% | 425.4 68% | 208.1 -18% | 268.4 6% |

| 3DMark 11 - 1280x720 Performance GPU | |
| Lenovo ThinkPad X1 Yoga 2017 20JES03T00 | |
| Acer Switch 5 SW512-52-5819 | |
| Dell Latitude 12 5285 2-in-1 | |
| Toshiba Portege X20W-D-10R | |
| Dell Latitude 7285 | |
| HP Elite x2 1012 G1 | |
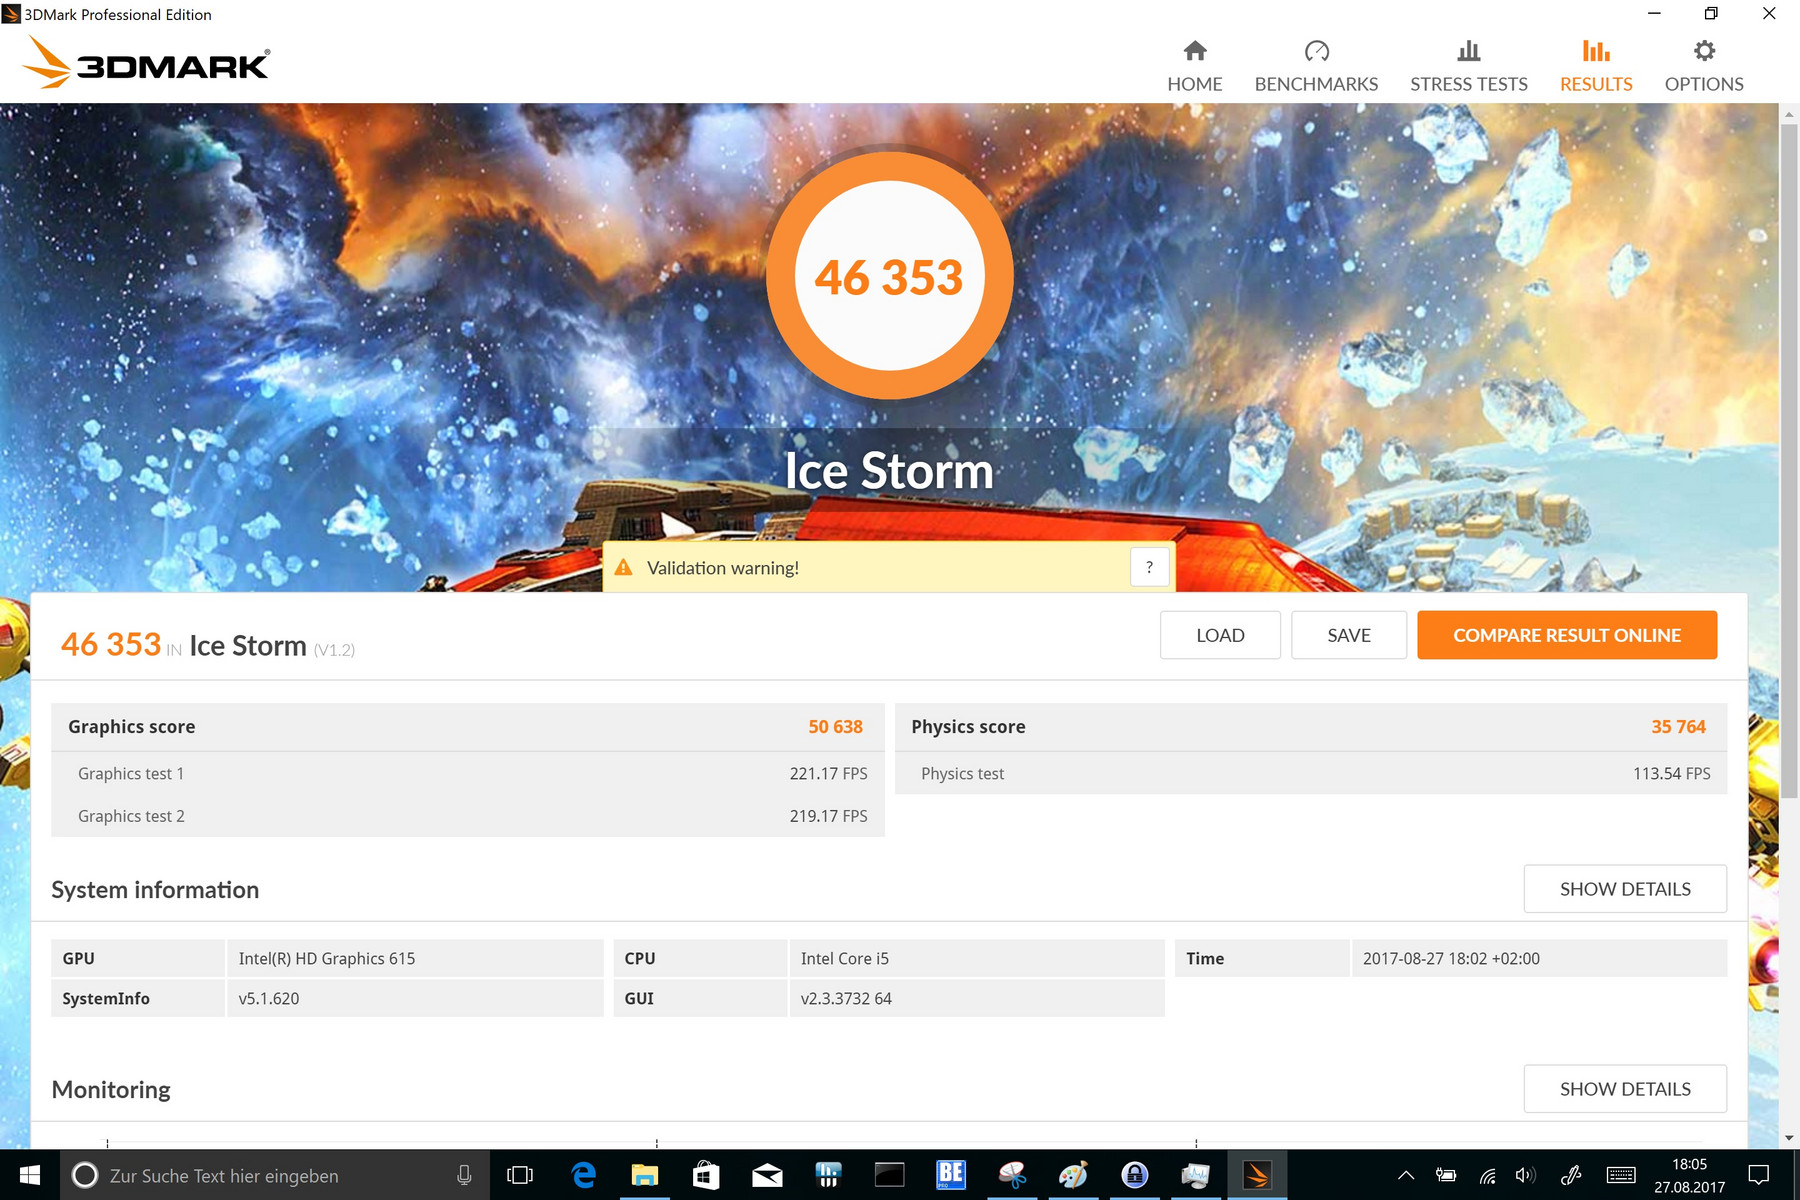
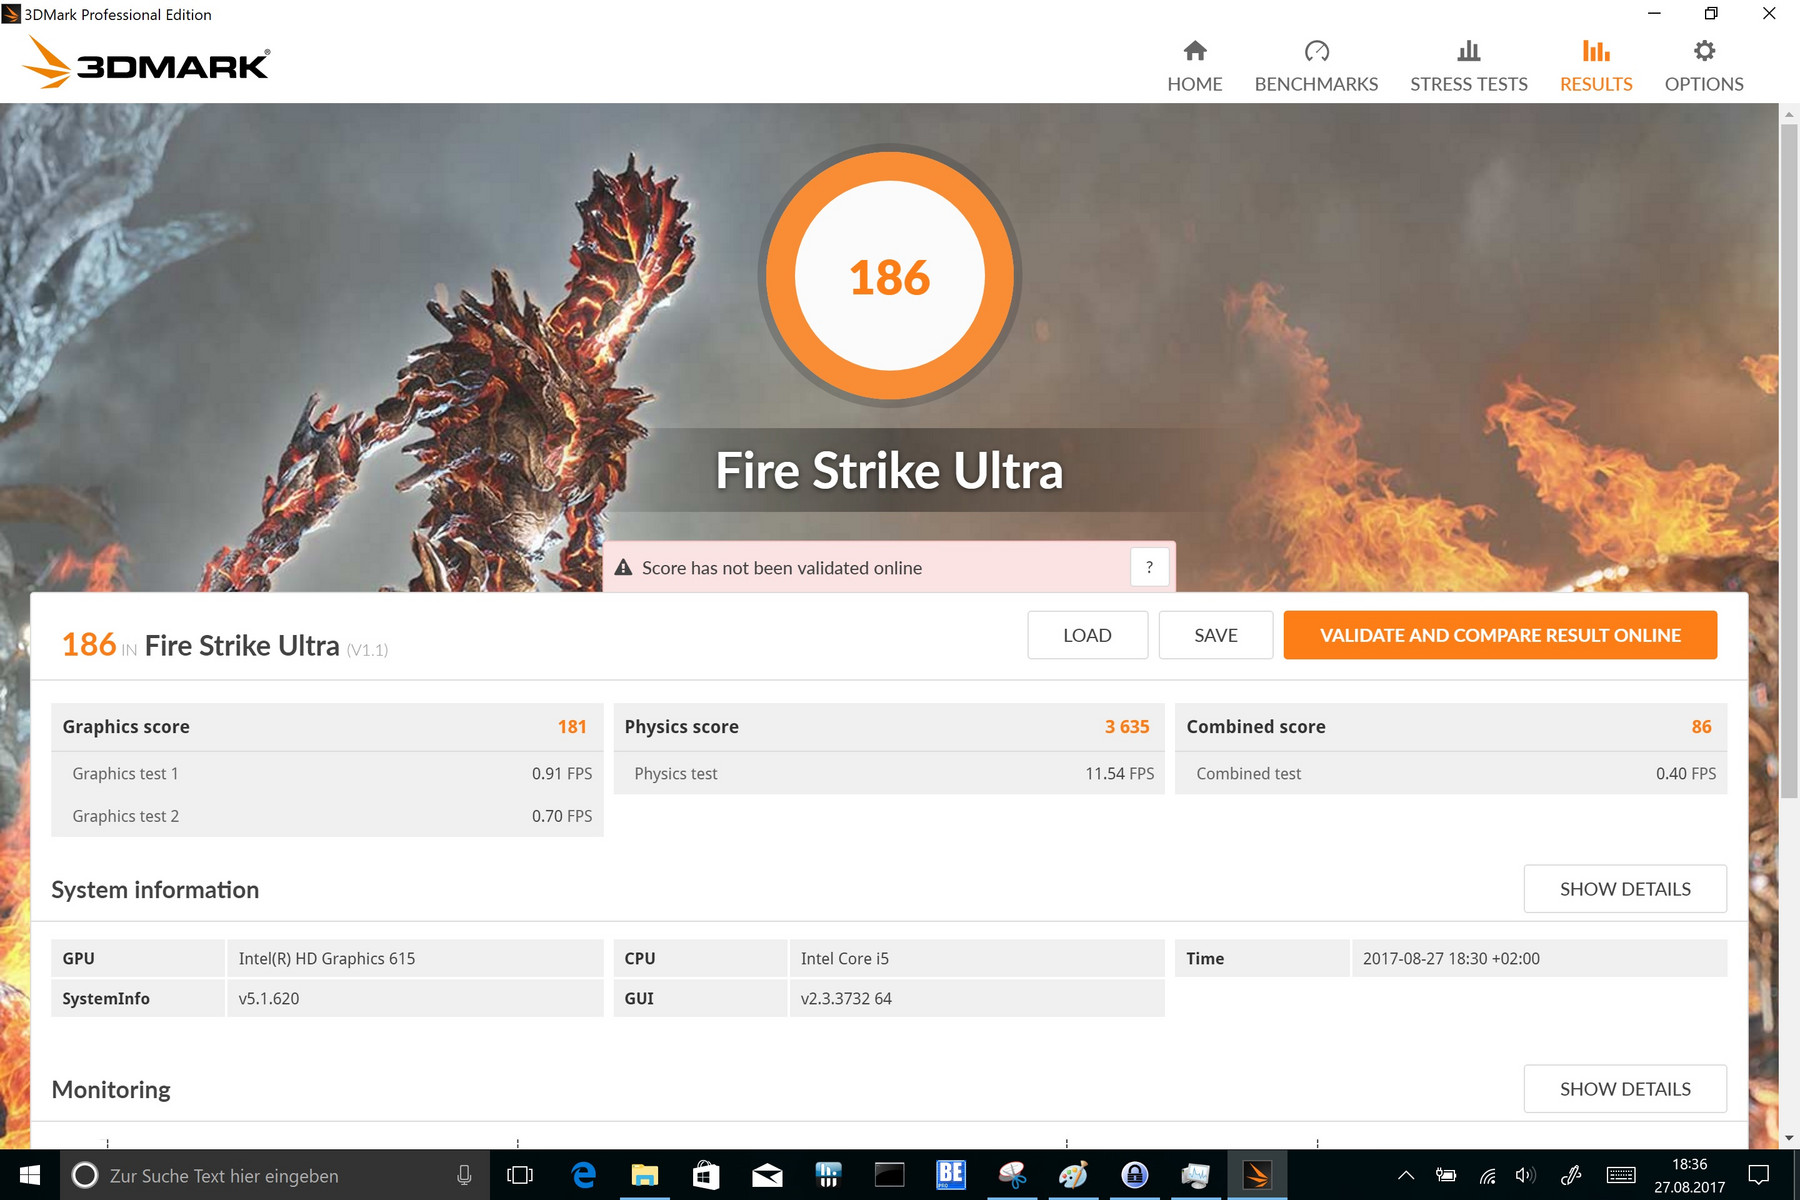
| 3DMark 06 Standard Score | 7909 pontok | |
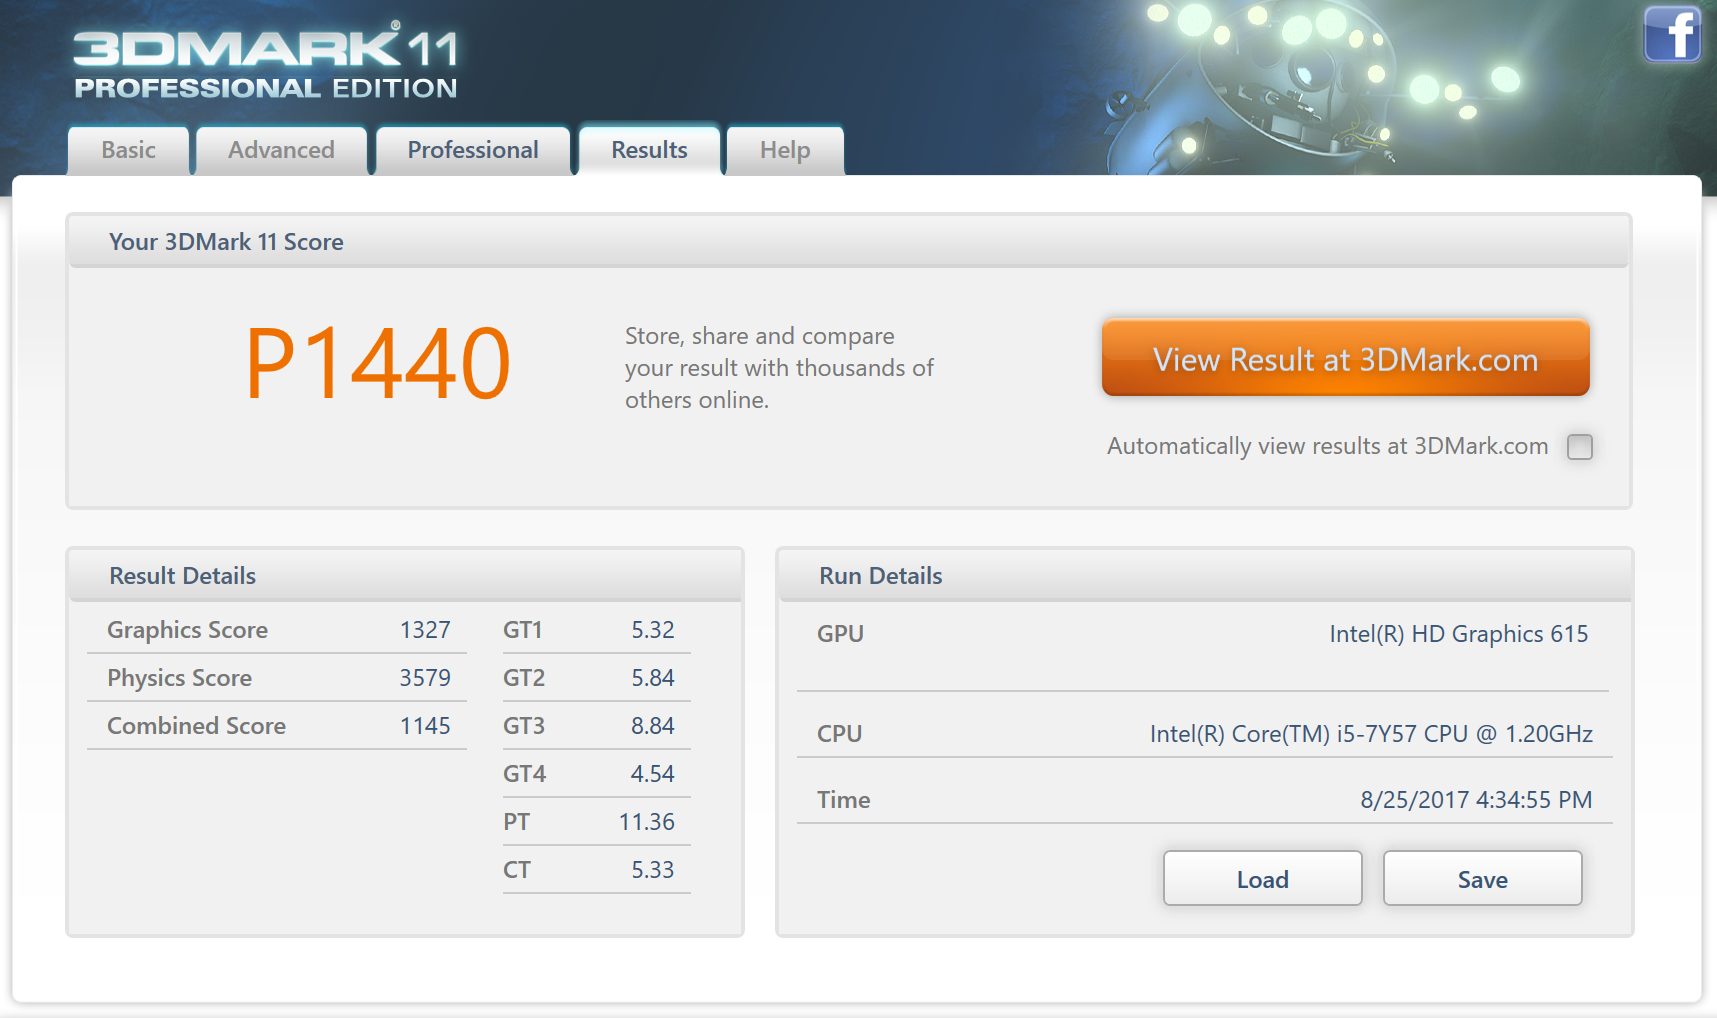
| 3DMark 11 Performance | 1440 pontok | |
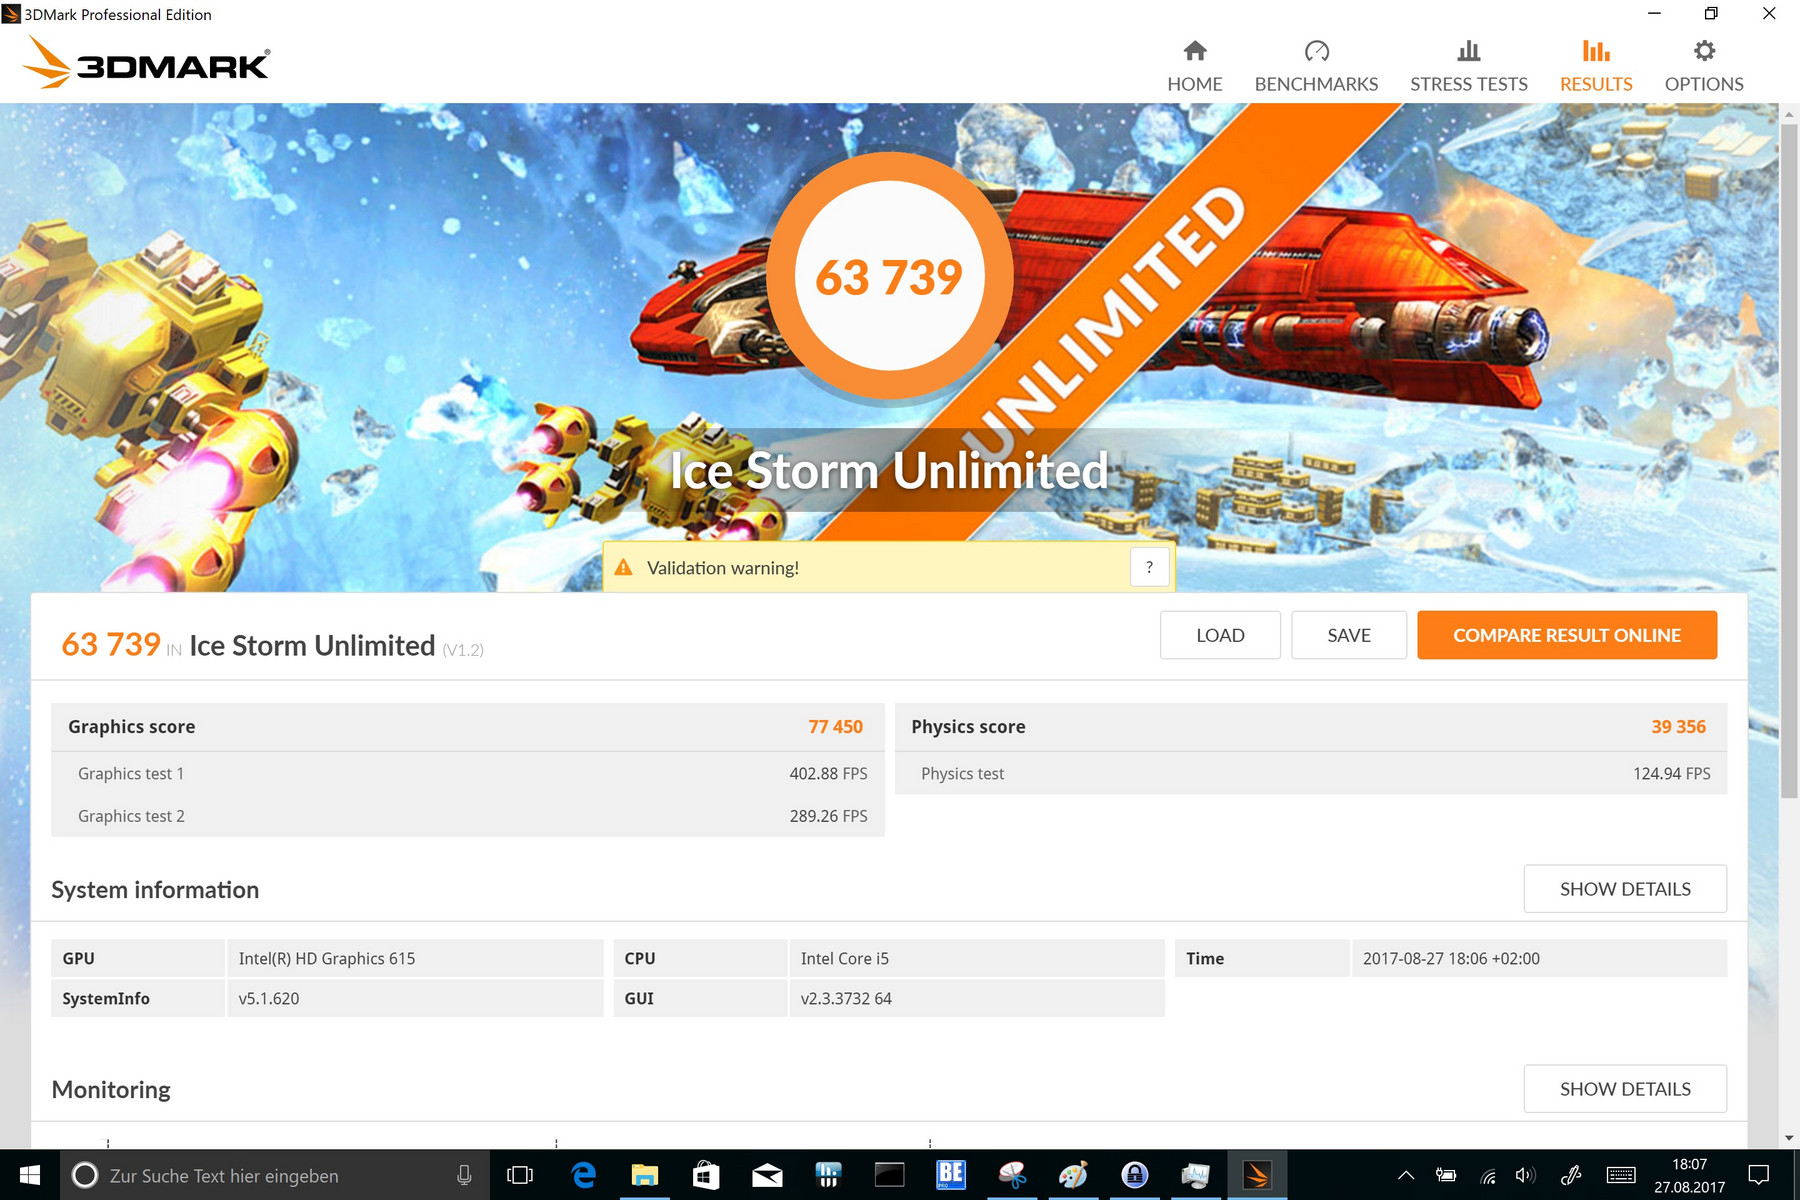
| 3DMark Ice Storm Standard Score | 46353 pontok | |
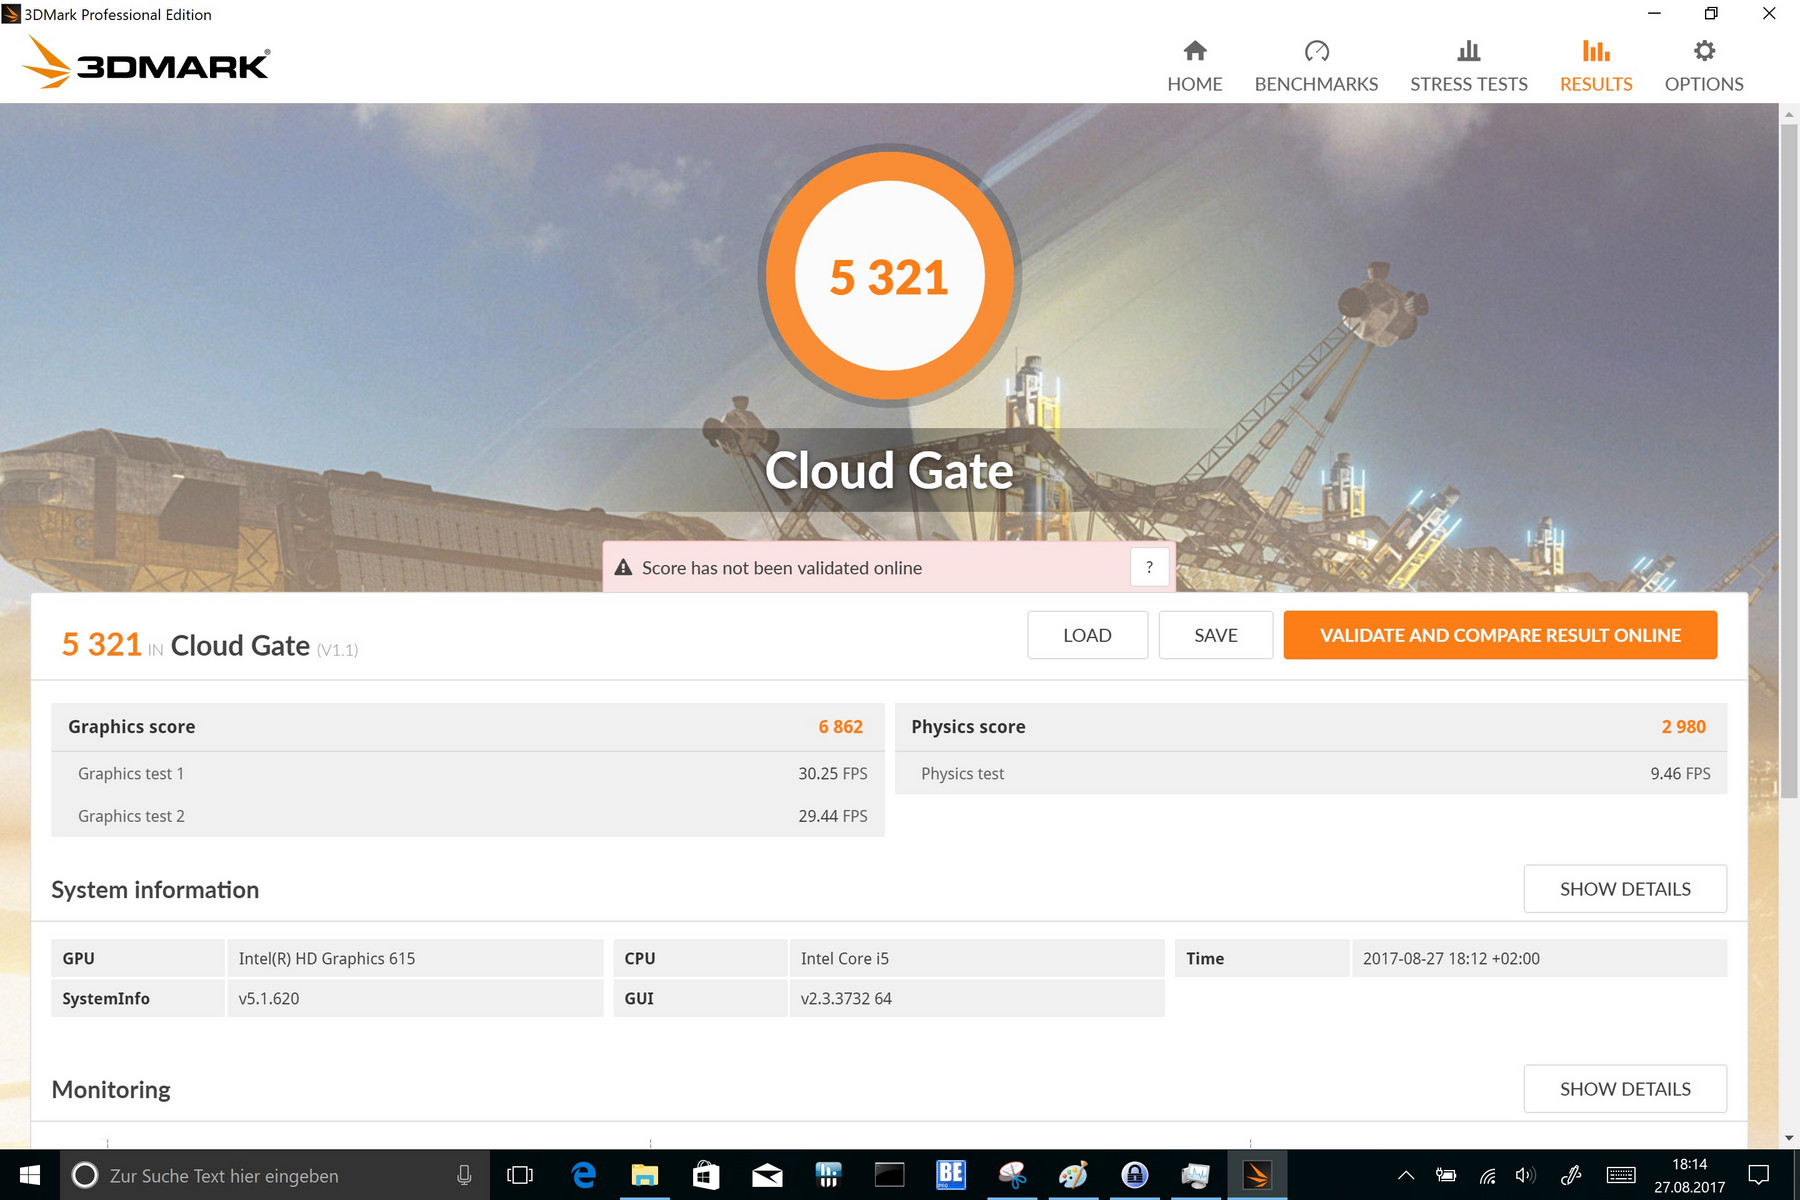
| 3DMark Cloud Gate Standard Score | 5321 pontok | |
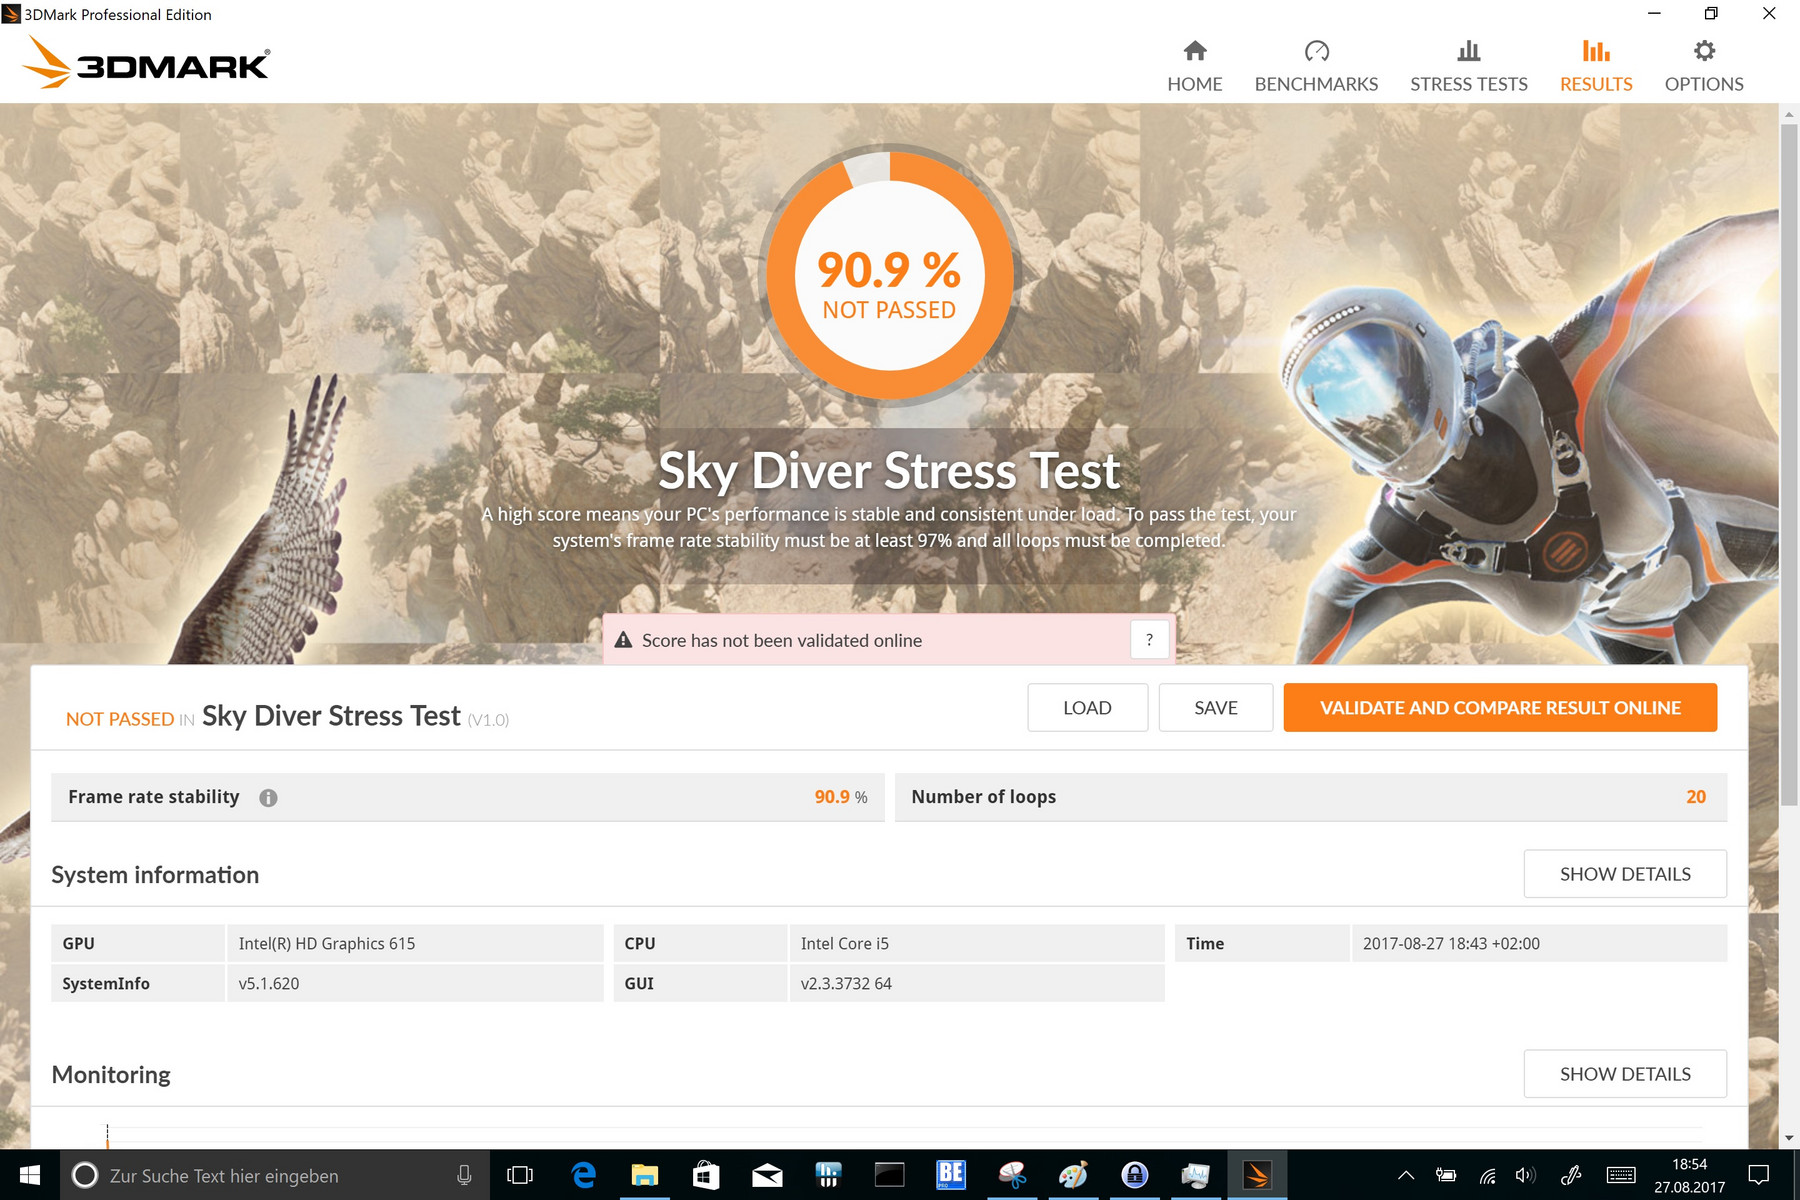
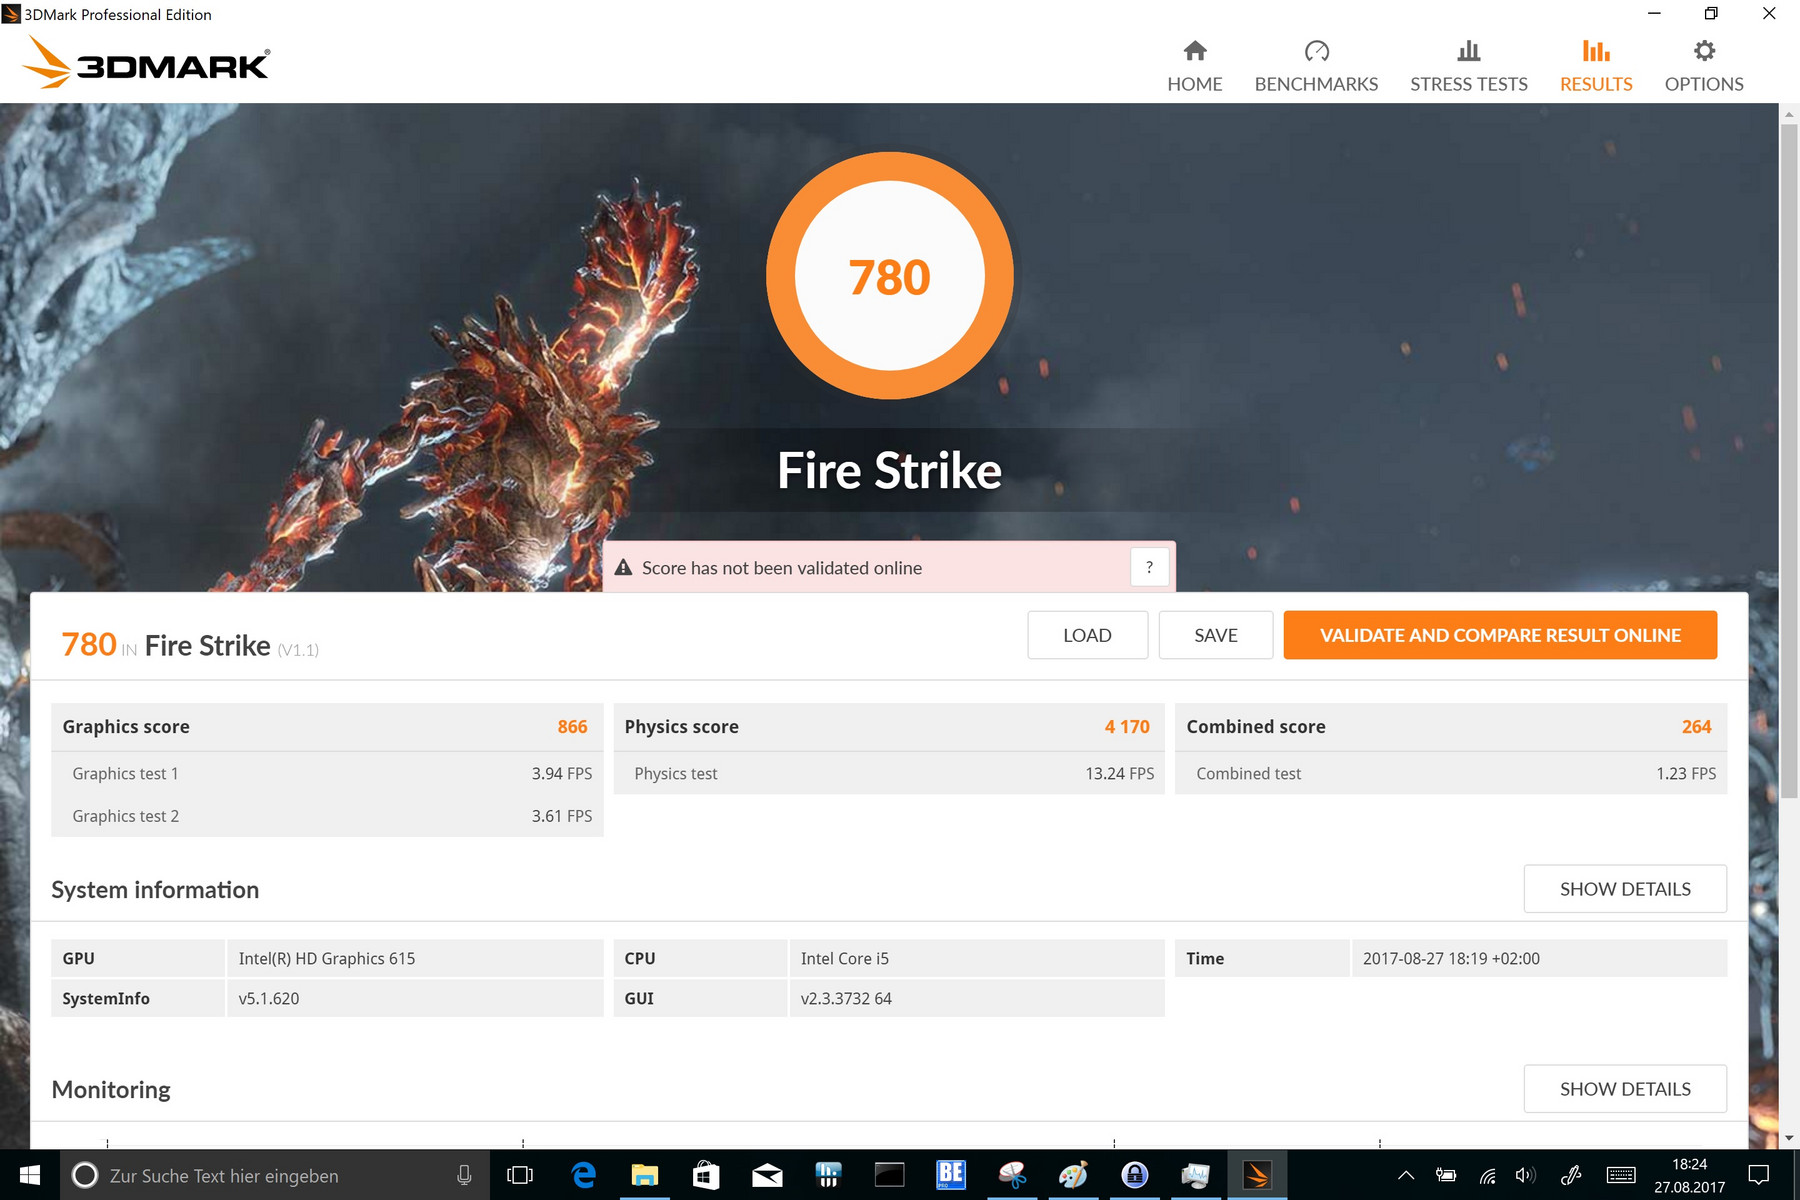
| 3DMark Fire Strike Score | 780 pontok | |
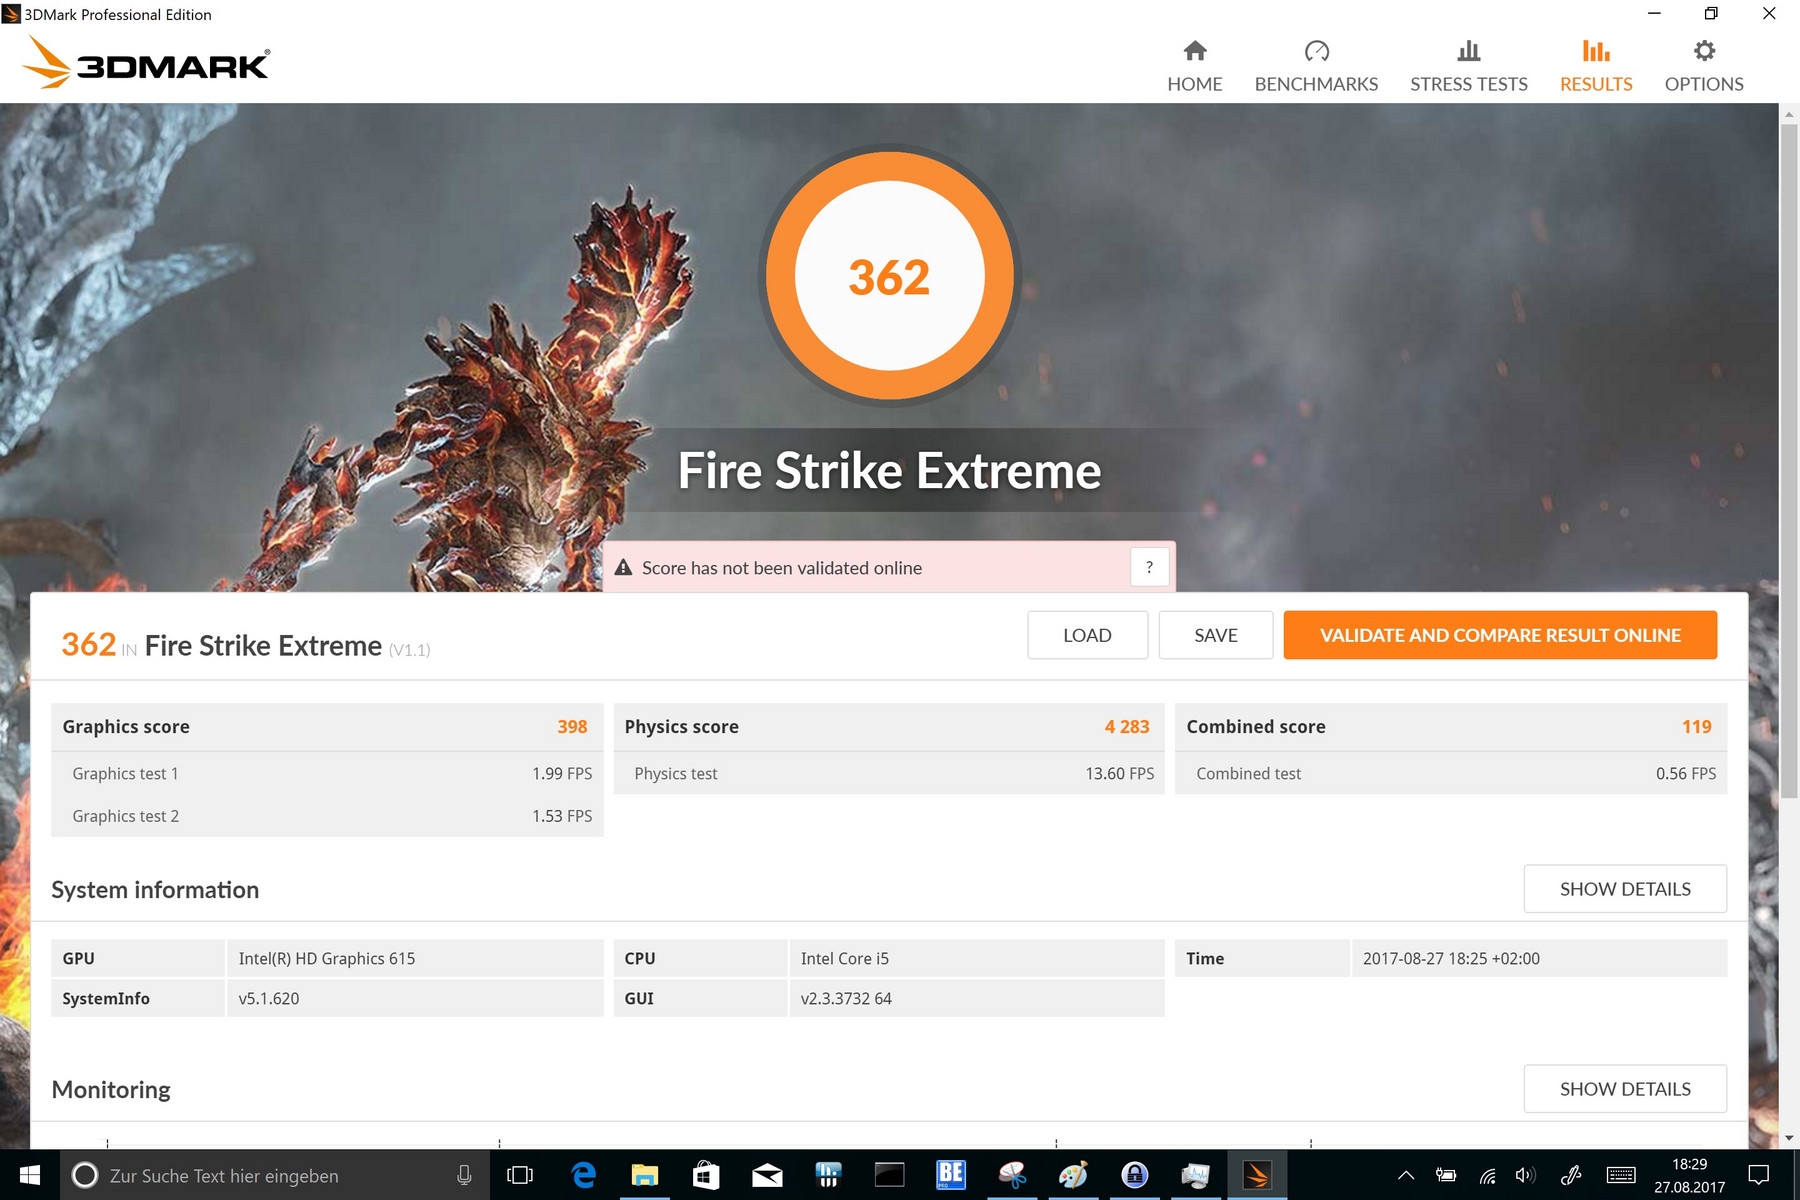
| 3DMark Fire Strike Extreme Score | 362 pontok | |
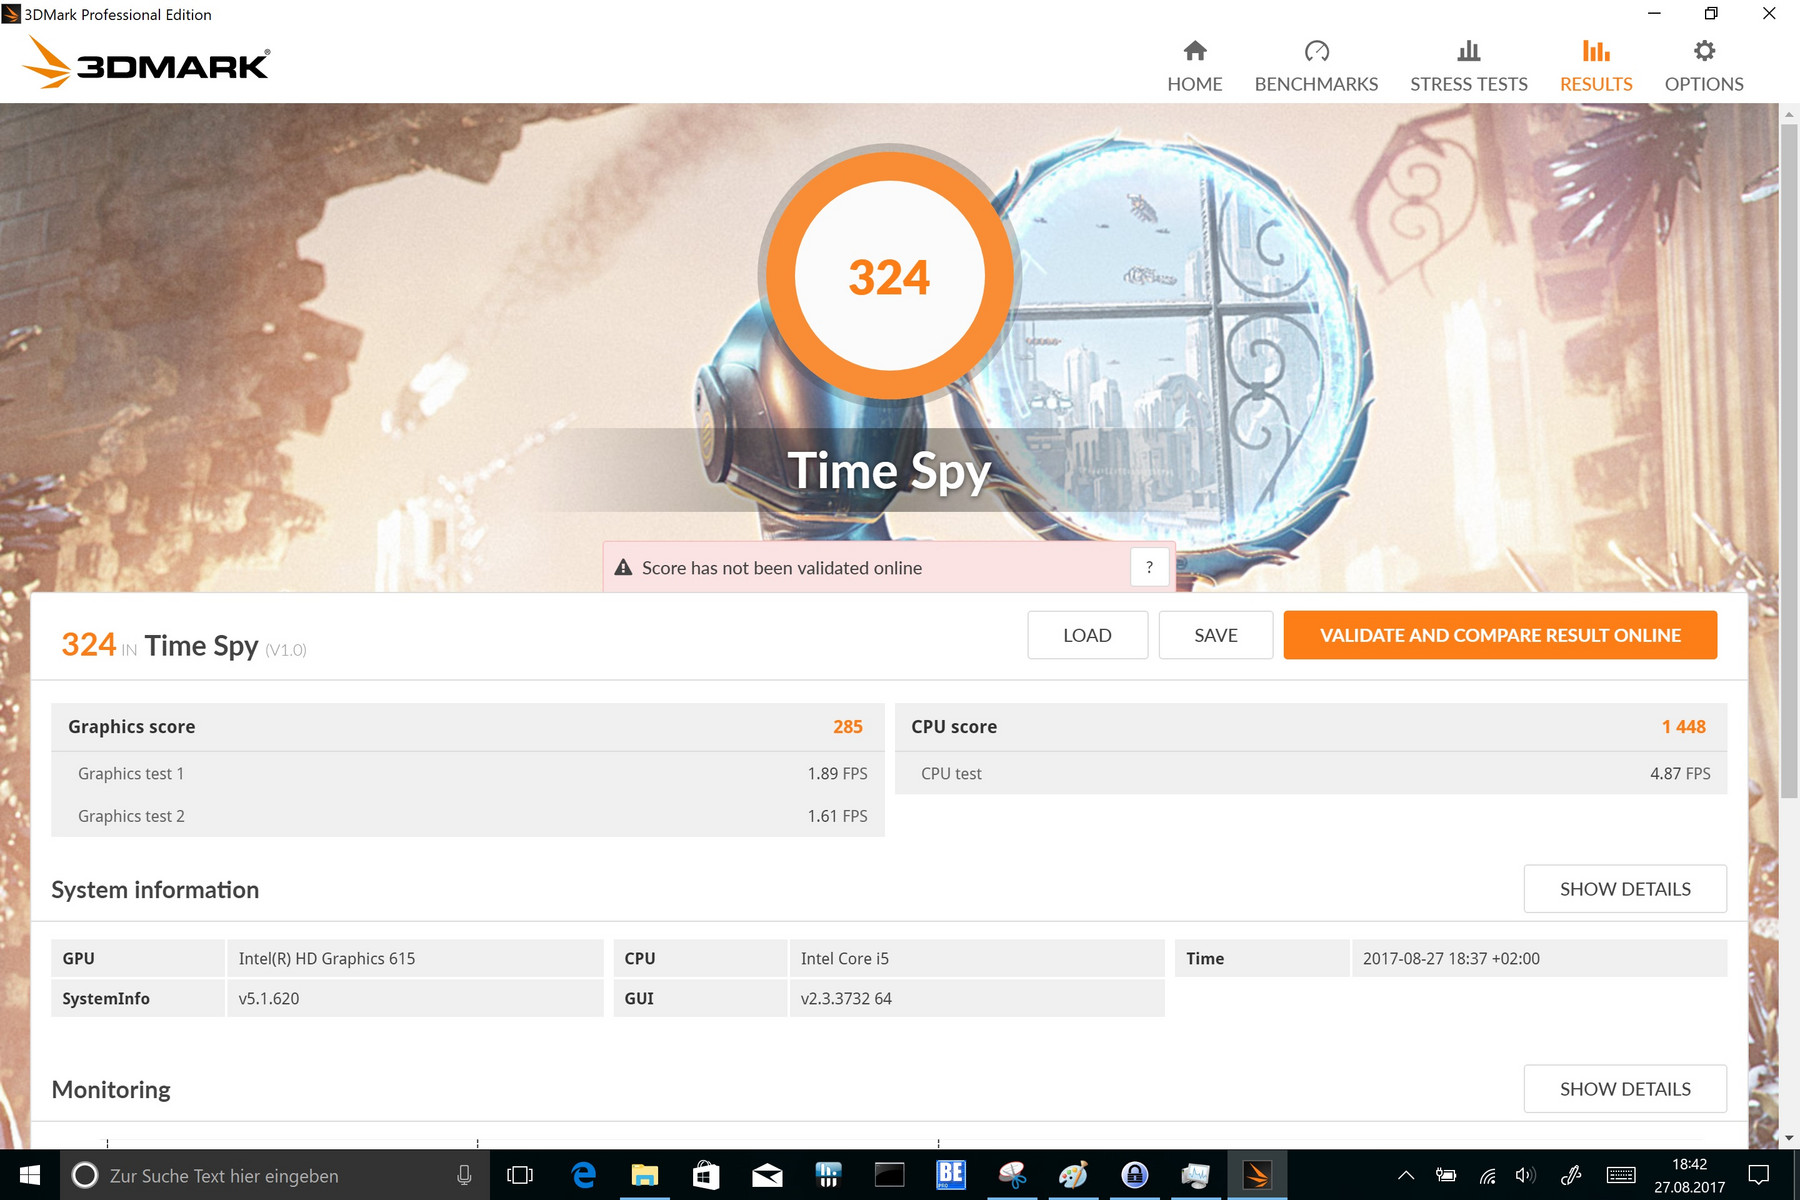
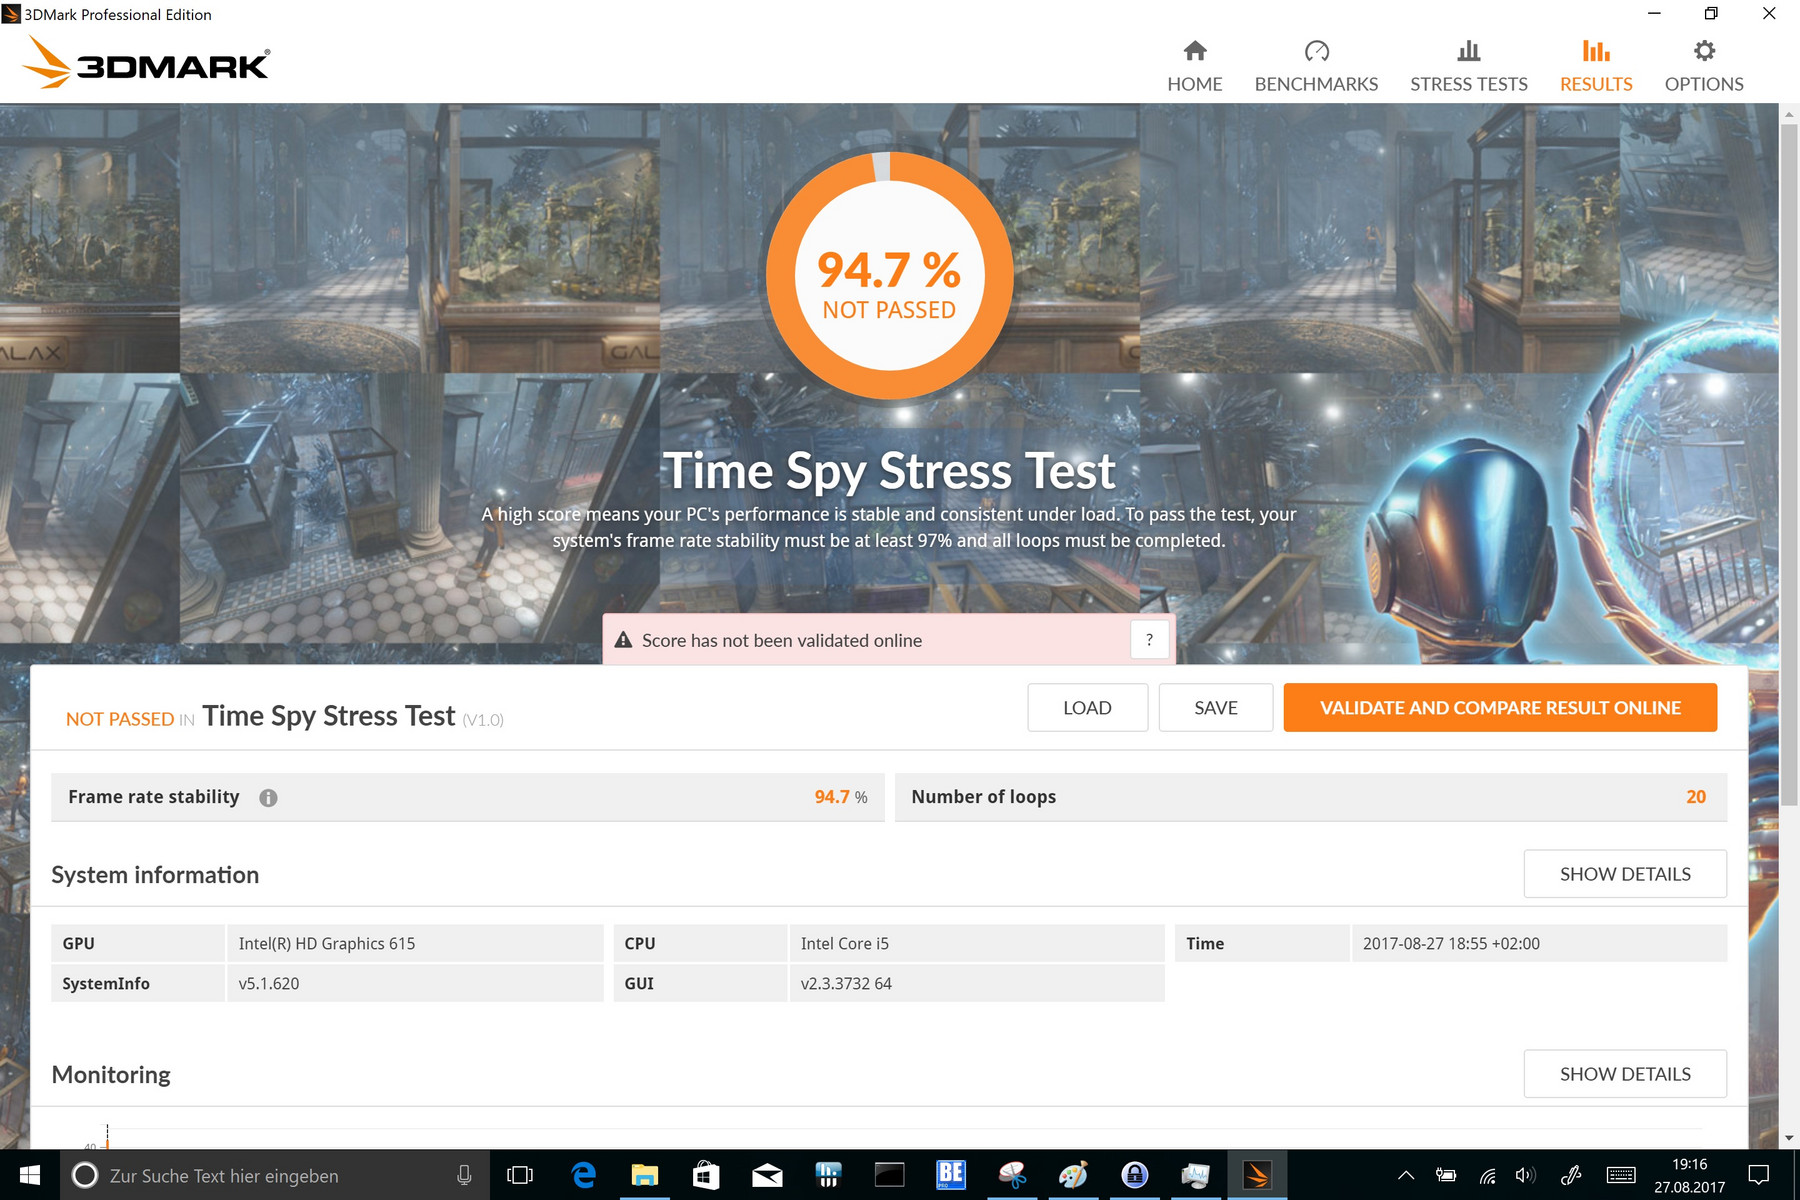
| 3DMark Time Spy Score | 324 pontok | |
Segítség | ||
| alacsony | közepes | magas | ultra | |
|---|---|---|---|---|
| BioShock Infinite (2013) | 40.4 | 25.8 | 21.7 | 6.4 |
| Battlefield 4 (2013) | 32.7 | 19.8 | 18.3 | |
| Rise of the Tomb Raider (2016) | 13.8 | 9.1 |
(-) A felső oldalon a maximális hőmérséklet 46.8 °C / 116 F, összehasonlítva a 35.4 °C / 96 F átlagával , 19.6 és 60 °C között a Convertible osztálynál.
(-) Az alsó maximum 49.6 °C / 121 F-ig melegszik fel, összehasonlítva a 36.9 °C / 98 F átlagával
(+) Üresjáratban a felső oldal átlagos hőmérséklete 28 °C / 82 F, összehasonlítva a 30.3 °C / ### eszközátlaggal class_avg_f### F.
(-) A csuklótámasz és az érintőpad tapintásra nagyon felforrósodhat, maximum 42.1 °C / 107.8 F.
(-) A hasonló eszközök csuklótámasz területének átlagos hőmérséklete 28 °C / 82.4 F volt (-14.1 °C / -25.4 F).
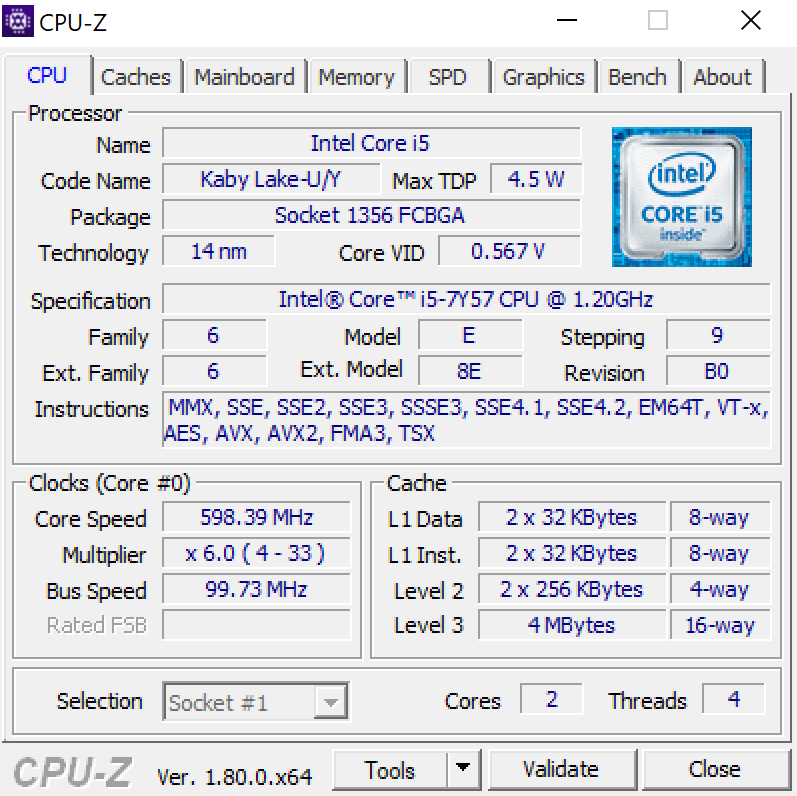
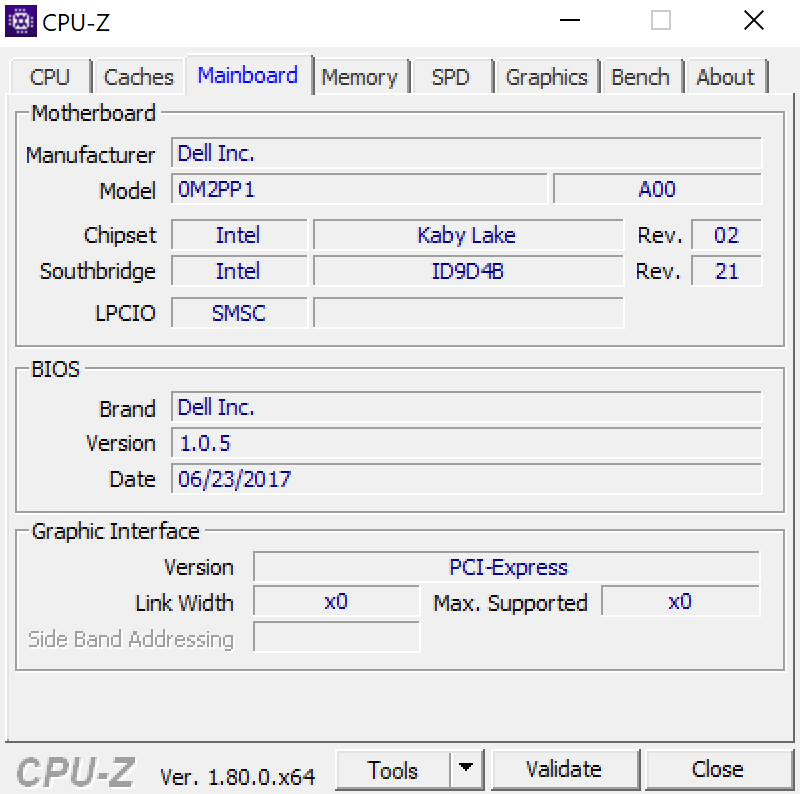
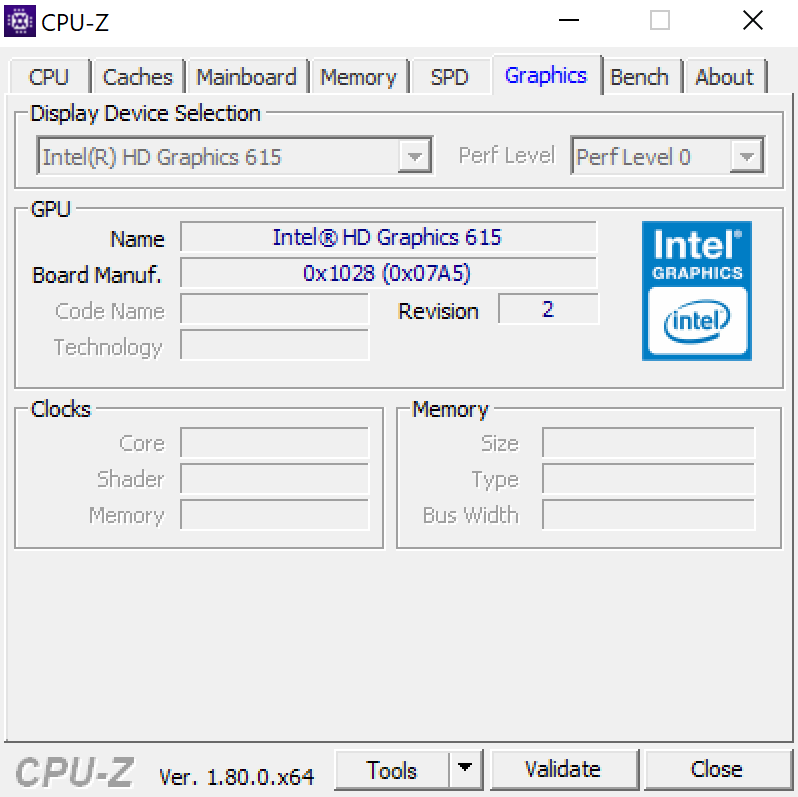
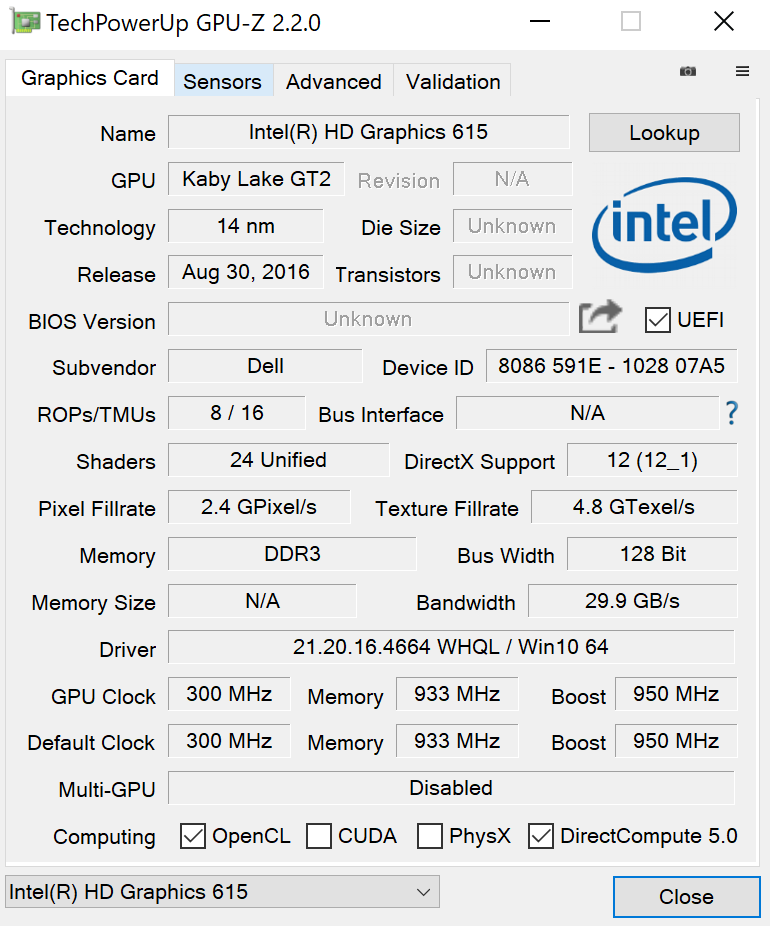
| Dell Latitude 7285 i5-7Y57, HD Graphics 615 | Microsoft Surface Pro (2017) i5 i5-7300U, HD Graphics 620 | Lenovo ThinkPad X1 Yoga 2017 20JES03T00 i7-7600U, HD Graphics 620 | Dell Latitude 12 5285 2-in-1 i7-7600U, HD Graphics 620 | Acer Switch 5 SW512-52-5819 i7-7500U, HD Graphics 620 | Toshiba Portege X20W-D-10R i7-7600U, HD Graphics 620 | HP Elite x2 1012 G1 6Y54, HD Graphics 515 | |
|---|---|---|---|---|---|---|---|
| Heat | -0% | 11% | 5% | 0% | 28% | 8% | |
| Maximum Upper Side * (°C) | 46.8 | 39.2 16% | 47.5 -1% | 38.2 18% | 44.7 4% | 35.7 24% | 39 17% |
| Maximum Bottom * (°C) | 49.6 | 40.3 19% | 44.8 10% | 48.6 2% | 47.5 4% | 24.2 51% | 41.2 17% |
| Idle Upper Side * (°C) | 30.1 | 37 -23% | 23.7 21% | 29.6 2% | 29.7 1% | 23.4 22% | 29.5 2% |
| Idle Bottom * (°C) | 28.5 | 32.3 -13% | 24.6 14% | 28.8 -1% | 30.7 -8% | 24.2 15% | 29.8 -5% |
* ... a kisebb jobb
Dell Latitude 7285 hangelemzés
(-) | nem túl hangos hangszórók (69.1 dB)
Basszus 100 - 315 Hz
(±) | csökkentett basszus – átlagosan 13.6%-kal alacsonyabb, mint a medián
(±) | a basszus linearitása átlagos (8.1% delta az előző frekvenciához)
Közepes 400-2000 Hz
(+) | kiegyensúlyozott középpontok – csak 3.4% választja el a mediántól
(+) | a középpontok lineárisak (5.9% delta az előző frekvenciához)
Maximum 2-16 kHz
(+) | kiegyensúlyozott csúcsok – csak 0.9% választja el a mediántól
(+) | a csúcsok lineárisak (4% delta az előző frekvenciához képest)
Összességében 100 - 16.000 Hz
(±) | az általános hang linearitása átlagos (17.4% eltérés a mediánhoz képest)
Ugyanazon osztályhoz képest
» 33%Ebben az osztályban az összes tesztelt eszköz %-a jobb volt, 8% hasonló, 59%-kal rosszabb
» A legjobb delta értéke 6%, az átlag 20%, a legrosszabb 57% volt
Az összes tesztelt eszközzel összehasonlítva
» 33% az összes tesztelt eszköz jobb volt, 8% hasonló, 59%-kal rosszabb
» A legjobb delta értéke 4%, az átlag 24%, a legrosszabb 134% volt
Lenovo ThinkPad X1 Yoga 2017 20JES03T00 hangelemzés
(±) | a hangszóró hangereje átlagos, de jó (73.3 dB)
Basszus 100 - 315 Hz
(-) | szinte nincs basszus – átlagosan 19.1%-kal alacsonyabb a mediánnál
(±) | a basszus linearitása átlagos (8.6% delta az előző frekvenciához)
Közepes 400-2000 Hz
(+) | kiegyensúlyozott középpontok – csak 2.6% választja el a mediántól
(±) | a középpontok linearitása átlagos (8% delta az előző gyakorisághoz)
Maximum 2-16 kHz
(+) | kiegyensúlyozott csúcsok – csak 2.6% választja el a mediántól
(+) | a csúcsok lineárisak (6.6% delta az előző frekvenciához képest)
Összességében 100 - 16.000 Hz
(±) | az általános hang linearitása átlagos (21.7% eltérés a mediánhoz képest)
Ugyanazon osztályhoz képest
» 59%Ebben az osztályban az összes tesztelt eszköz %-a jobb volt, 10% hasonló, 31%-kal rosszabb
» A legjobb delta értéke 6%, az átlag 20%, a legrosszabb 57% volt
Az összes tesztelt eszközzel összehasonlítva
» 61% az összes tesztelt eszköz jobb volt, 7% hasonló, 31%-kal rosszabb
» A legjobb delta értéke 4%, az átlag 24%, a legrosszabb 134% volt
| Kikapcsolt állapot / Készenlét | |
| Üresjárat | |
| Terhelés |
|
Kulcs:
min: | |
| Dell Latitude 7285 i5-7Y57, HD Graphics 615, Toshiba KBG20ZMS256G, IPS LED, 2880x1920, 12.3" | Microsoft Surface Pro (2017) i5 i5-7300U, HD Graphics 620, Samsung PM971 KUS030202M, IPS, 2736x1824, 12.3" | Lenovo ThinkPad X1 Yoga 2017 20JES03T00 i7-7600U, HD Graphics 620, Samsung SSD PM961 1TB M.2 PCIe 3.0 x4 NVMe (MZVLW1T0), OLED, 2560x1440, 14" | Dell Latitude 12 5285 2-in-1 i7-7600U, HD Graphics 620, Samsung PM961 MZVLW256HEHP, IPS, 1920x1280, 12.3" | Acer Switch 5 SW512-52-5819 i7-7500U, HD Graphics 620, Intel SSD 600p SSDPEKKW512G7, IPS, 2160x1440, 12" | Toshiba Portege X20W-D-10R i7-7600U, HD Graphics 620, Toshiba SG5 THNSNK512GVN8, IPS, 1920x1080, 12.5" | HP Elite x2 1012 G1 6Y54, HD Graphics 515, Liteon L8H-256V2G, IPS, 1920x1280, 12.1" | |
|---|---|---|---|---|---|---|---|
| Power Consumption | 21% | -11% | 16% | 18% | 35% | 22% | |
| Idle Minimum * (Watt) | 6.6 | 3.6 45% | 4.9 26% | 2.85 57% | 3.86 42% | 3.4 48% | 3.7 44% |
| Idle Average * (Watt) | 9.3 | 8.1 13% | 7.6 18% | 6.76 27% | 6.4 31% | 5.8 38% | 6.8 27% |
| Idle Maximum * (Watt) | 10.2 | 8.7 15% | 13.8 -35% | 6.91 32% | 7.17 30% | 6.7 34% | 7.6 25% |
| Load Average * (Watt) | 25.1 | 25.5 -2% | 33.4 -33% | 32.88 -31% | 30.5 -22% | 21.4 15% | 22.5 10% |
| Load Maximum * (Watt) | 36.1 | 23.5 35% | 46.5 -29% | 37.41 -4% | 32.4 10% | 21.6 40% | 34.5 4% |
* ... a kisebb jobb
| Dell Latitude 7285 i5-7Y57, HD Graphics 615, 54 Wh | Microsoft Surface Pro (2017) i5 i5-7300U, HD Graphics 620, 45 Wh | Lenovo ThinkPad X1 Yoga 2017 20JES03T00 i7-7600U, HD Graphics 620, 56 Wh | Dell Latitude 12 5285 2-in-1 i7-7600U, HD Graphics 620, 42 Wh | Acer Switch 5 SW512-52-5819 i7-7500U, HD Graphics 620, Wh | Toshiba Portege X20W-D-10R i7-7600U, HD Graphics 620, 44 Wh | HP Elite x2 1012 G1 6Y54, HD Graphics 515, 37 Wh | |
|---|---|---|---|---|---|---|---|
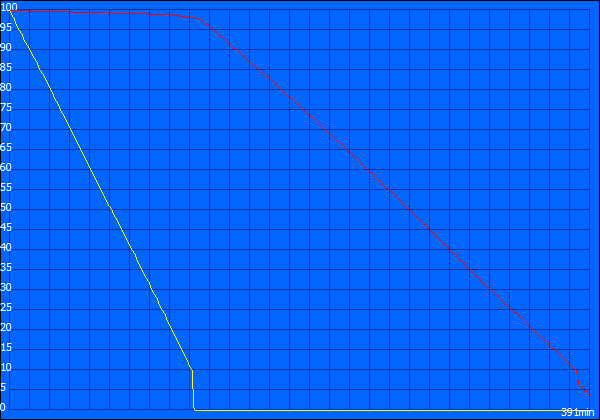
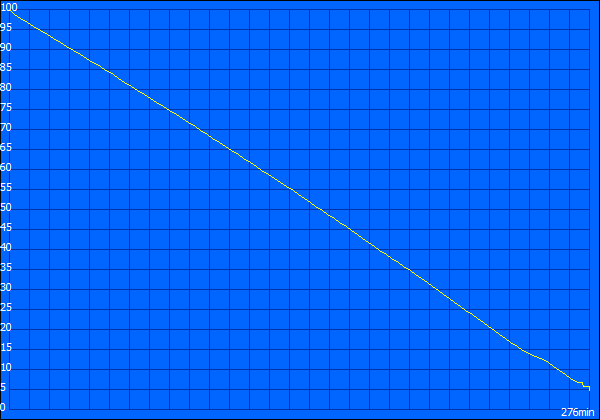
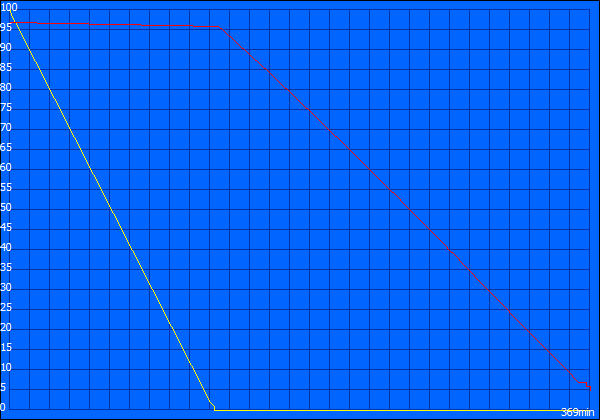
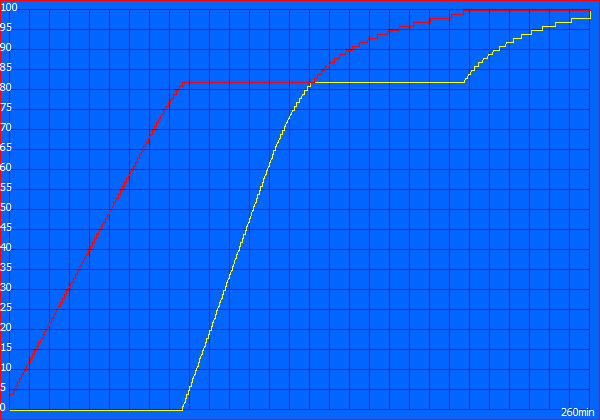
| Akkumulátor üzemidő | 32% | -12% | -1% | -27% | 25% | -5% | |
| Reader / Idle (h) | 17.2 | 17.6 2% | 13.1 -24% | 17.9 4% | 11.9 -31% | 16.7 -3% | 12.2 -29% |
| H.264 (h) | 6.2 | 6.8 10% | 7.2 16% | ||||
| WiFi v1.3 (h) | 6.5 | 12.4 91% | 6.1 -6% | 8.1 25% | 5.9 -9% | 12 85% | 7.4 14% |
| Load (h) | 2.7 | 2.8 4% | 2 -26% | 1.8 -33% | 1.6 -41% | 2.5 -7% | 2.2 -19% |
Pro
Kontra

A Dell Latitude 7285 egy kiváló minőségű átalakítható gép, modern alkatrészekkel. Az Intel Core i5-7Y57 stabil teljesítményt nyújt, amely elegendő a mindennapi irodai feladatokra, de multimédia alkalmazásokhoz is. A takarékos processzor általában könnyedén lépést tud tartani a gyorsabb ULV procikkal is. 2300 eurós (~$2740) árával a tesztpéldány nem éppen olcsó. A vásárlók ezért azonban egy hibátlanul összerakott, minden téren remek minőséget tükröző készüléket kapnak.
Az ár elsőre ijesztőnek tűnhet, de a Dell egy nagyon jól összerakott gépet kínál egy első osztályú, 3K kijelzővel, és egy sor modern csatlakozóval. A tableten kívül pedig még egy billentyűzet dokkolót, egy Dell Active Pen-t és 36 hónap garanciát is kapunk.
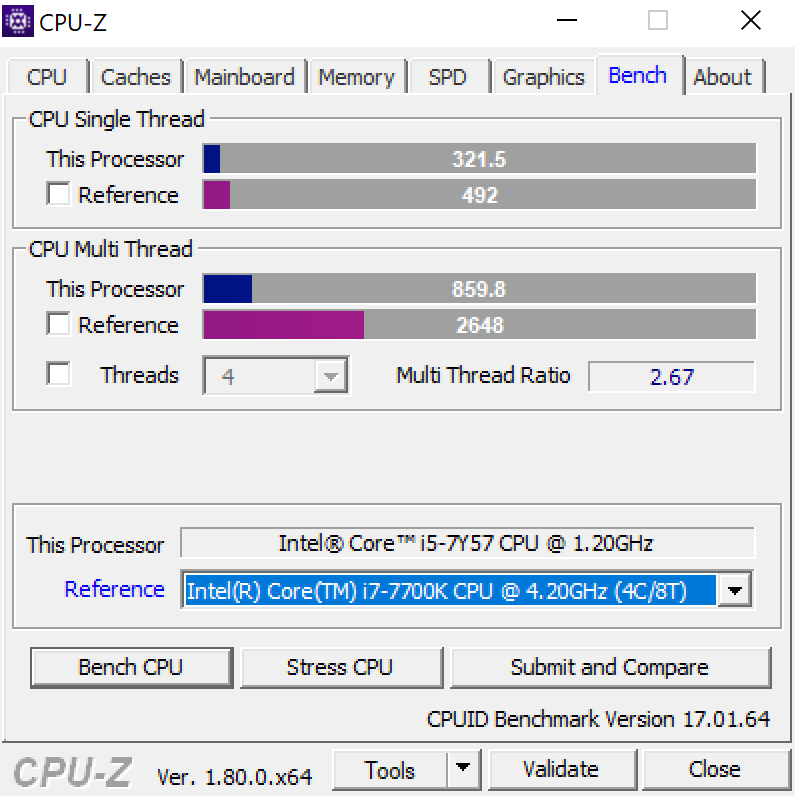
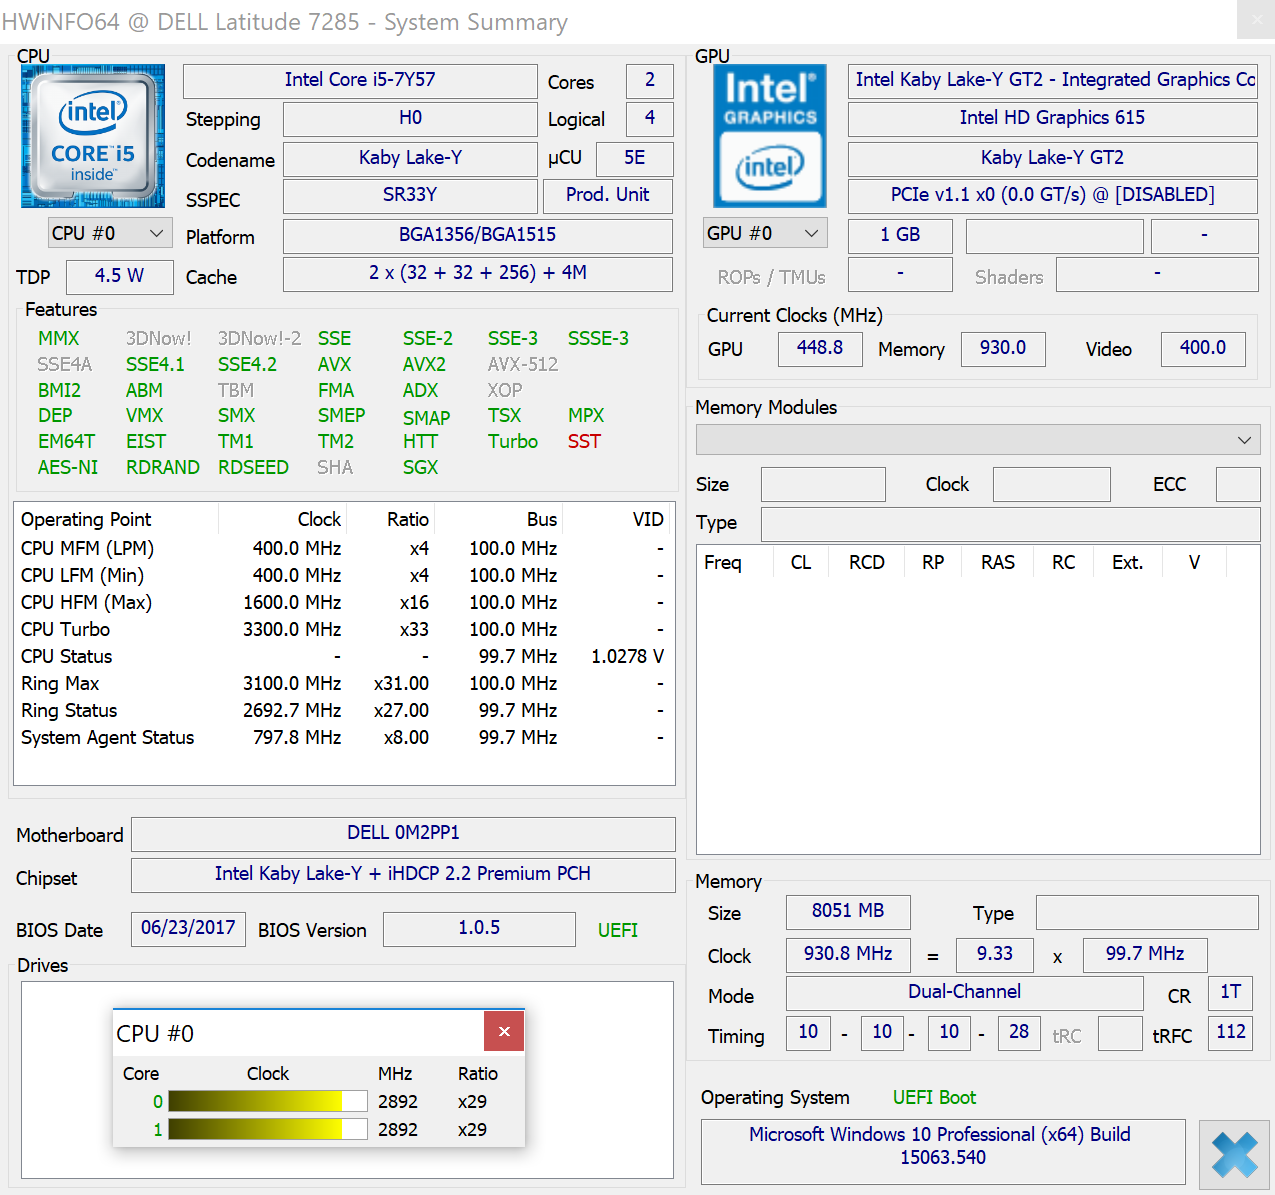
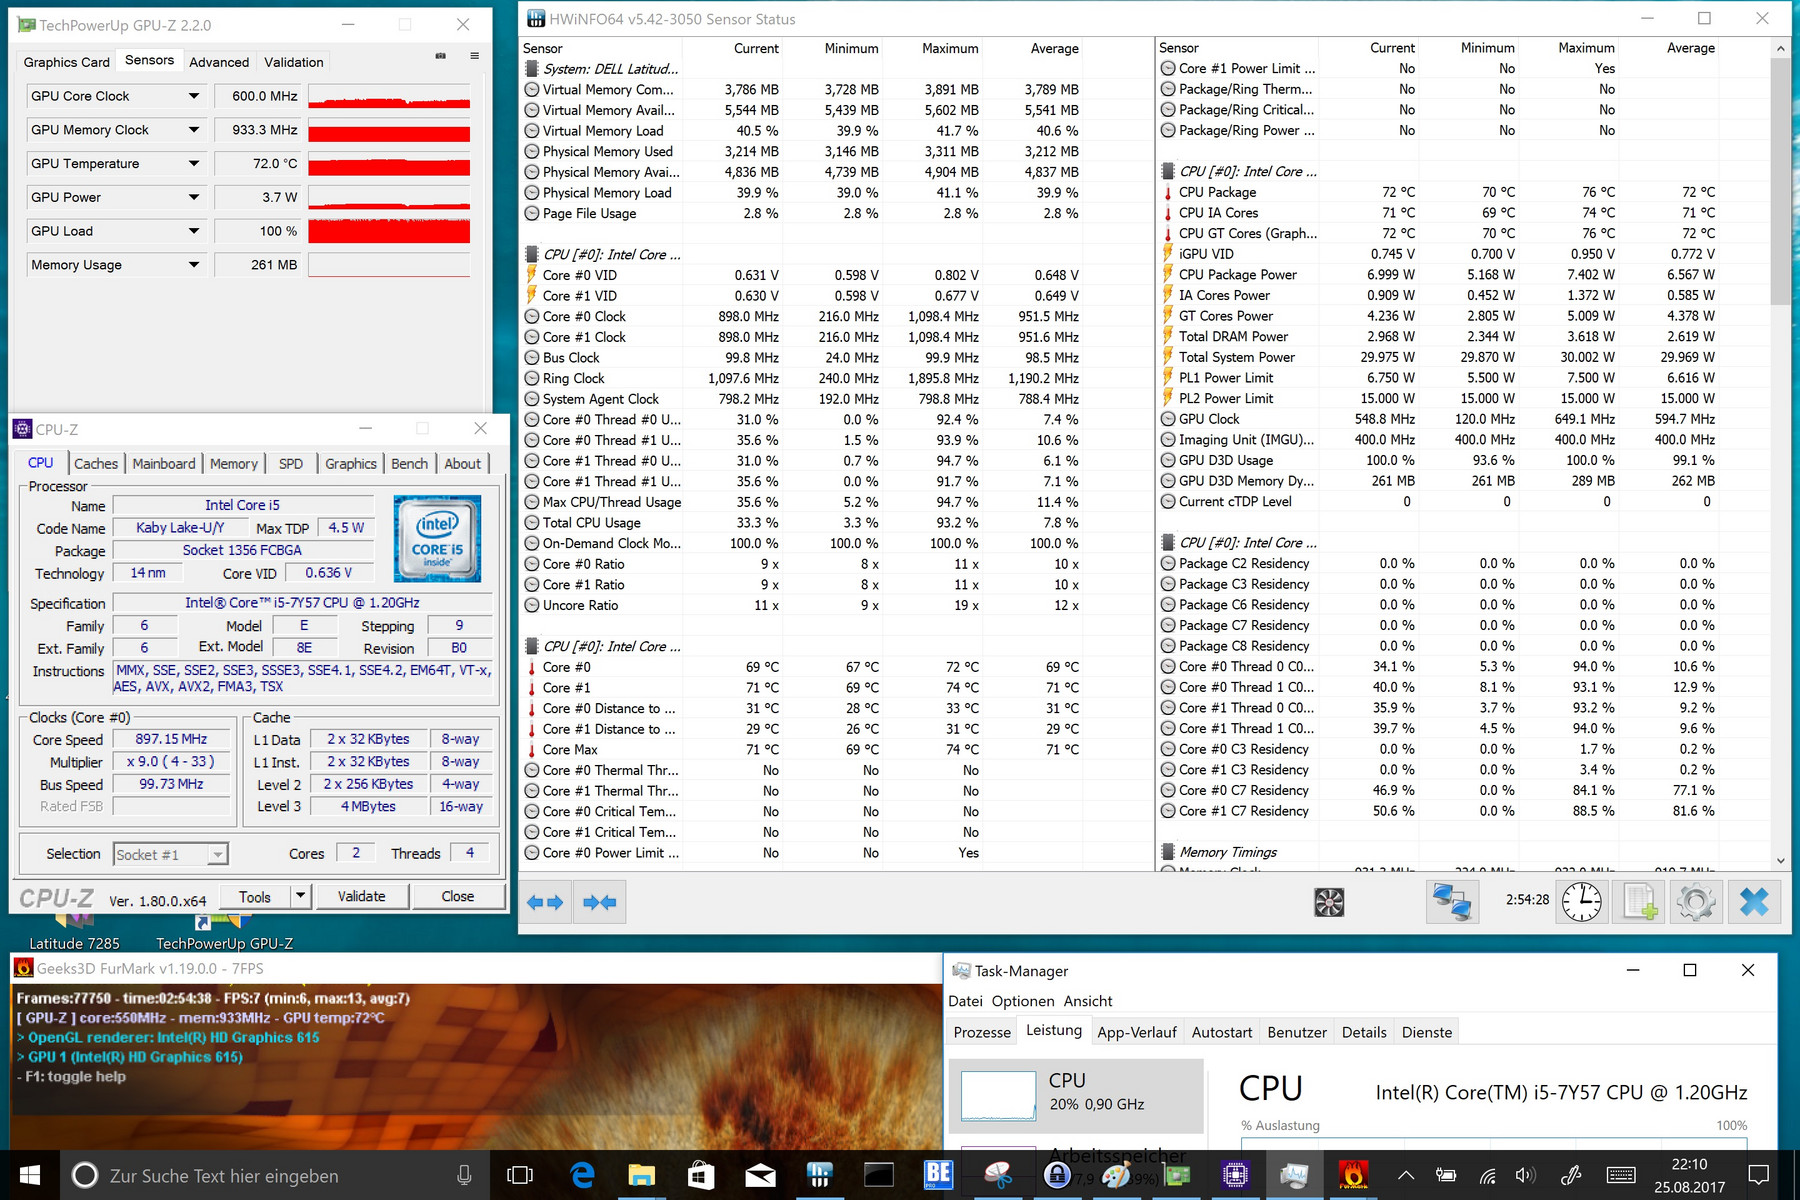
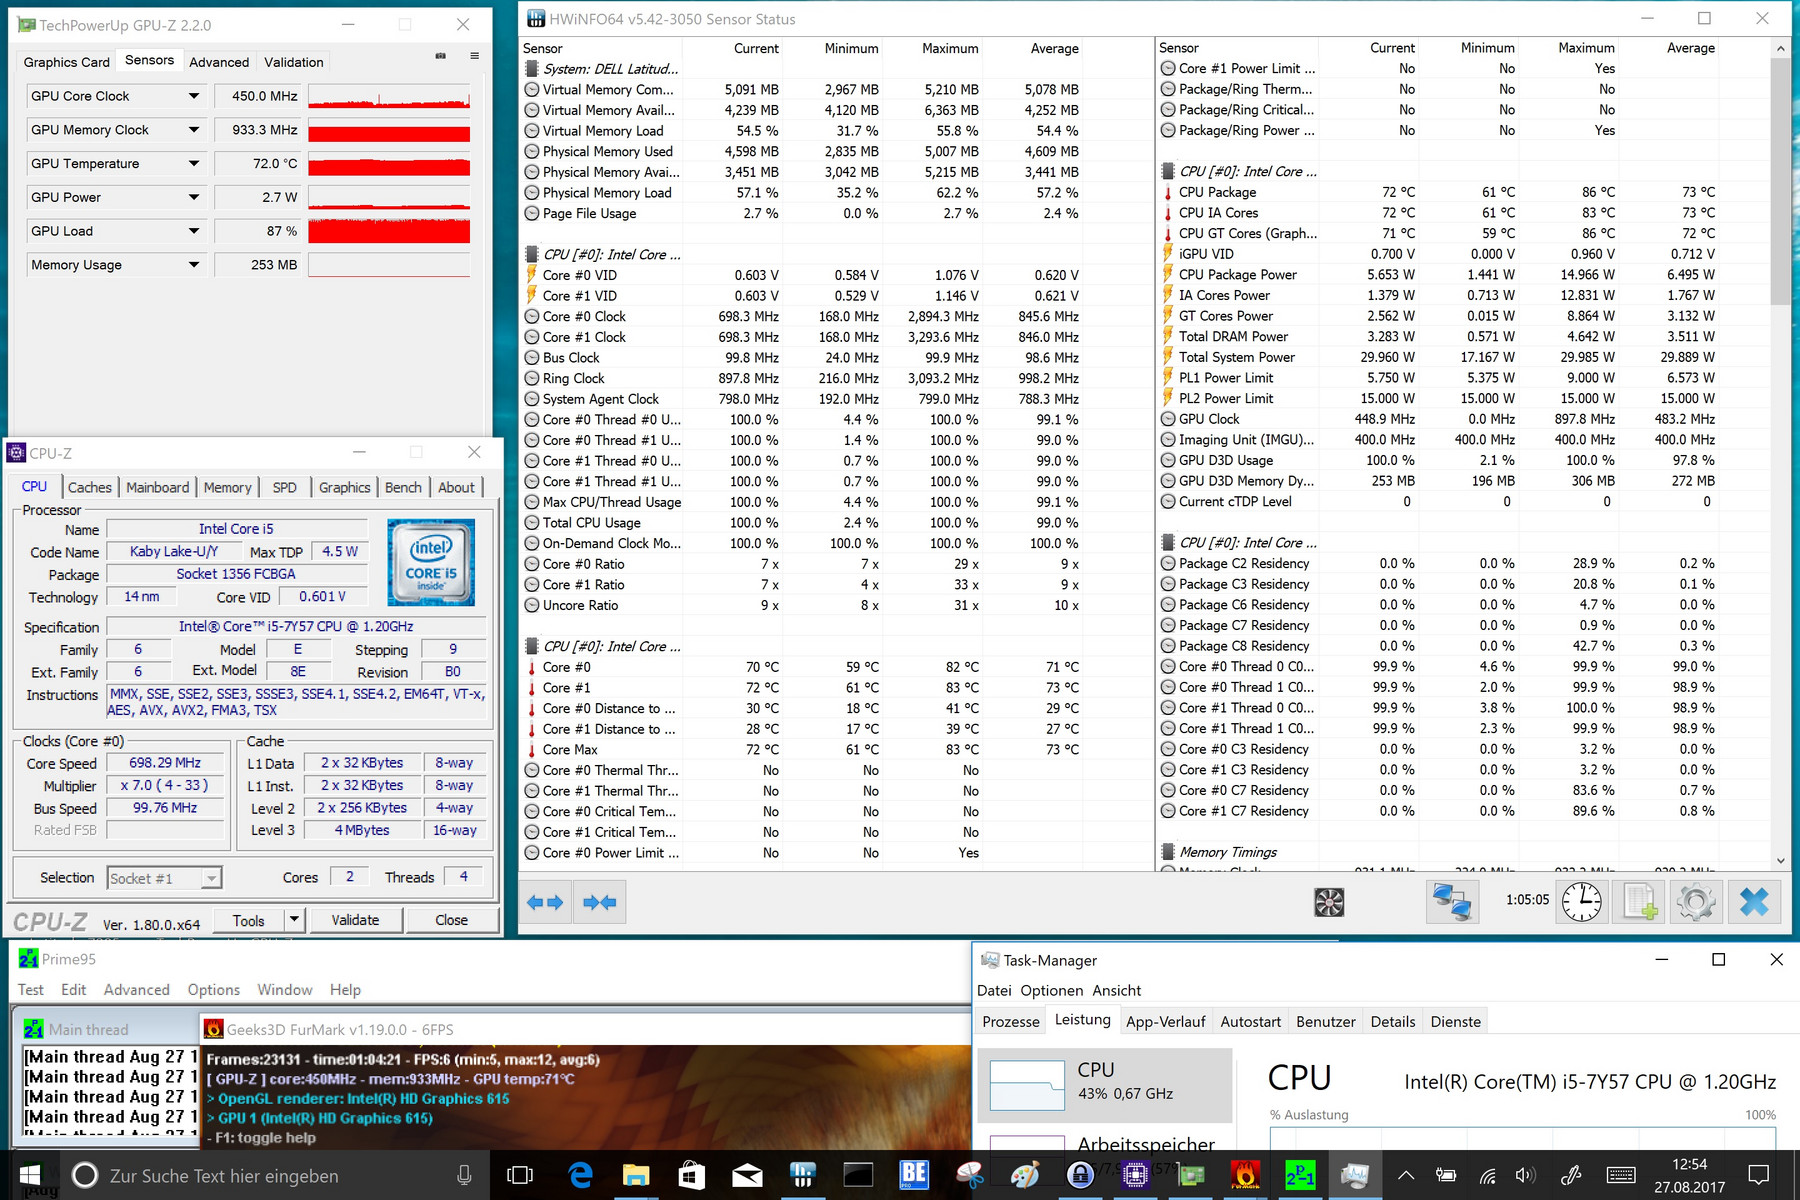
A jó anyaghasználat és a visszafogott design szimpatikus. A Dell Latitude 7285 kijelzője is nagyon jó pontszámot kapott, mivel fényereje és színlefedettsége is kiváló. A processzortól kisebb teljesítményt vártunk, de mivel a Dell nem a szokványos 4.5 wattos TDP-re korlátozta, ezért felülmúlta a várakozásunkat. Az összes teszt eredménye azt mutatta, hogy a Dell Latitude 7285 az Intel Core i5-7Y57-tel, lépést tud tartani a versenytársakkal.
A készülék fogyasztása miatt azonban kissé csalódottak vagyunk, mivel a takarékos alkotóelemek miatt sokkal jobbra számítottunk. Ez az üzemidőre is kihatott, és csak a második telep jelenléte mentette meg a készüléket attól, hogy nagyon rossz pontszámot kapjon ezen a téren.
Ez az eredeti értékelés rövidített változata. A teljes, angol nyelvű cikk itt olvasható.
Dell Latitude 7285
- 09/06/2017 v6 (old)
Sebastian Bade