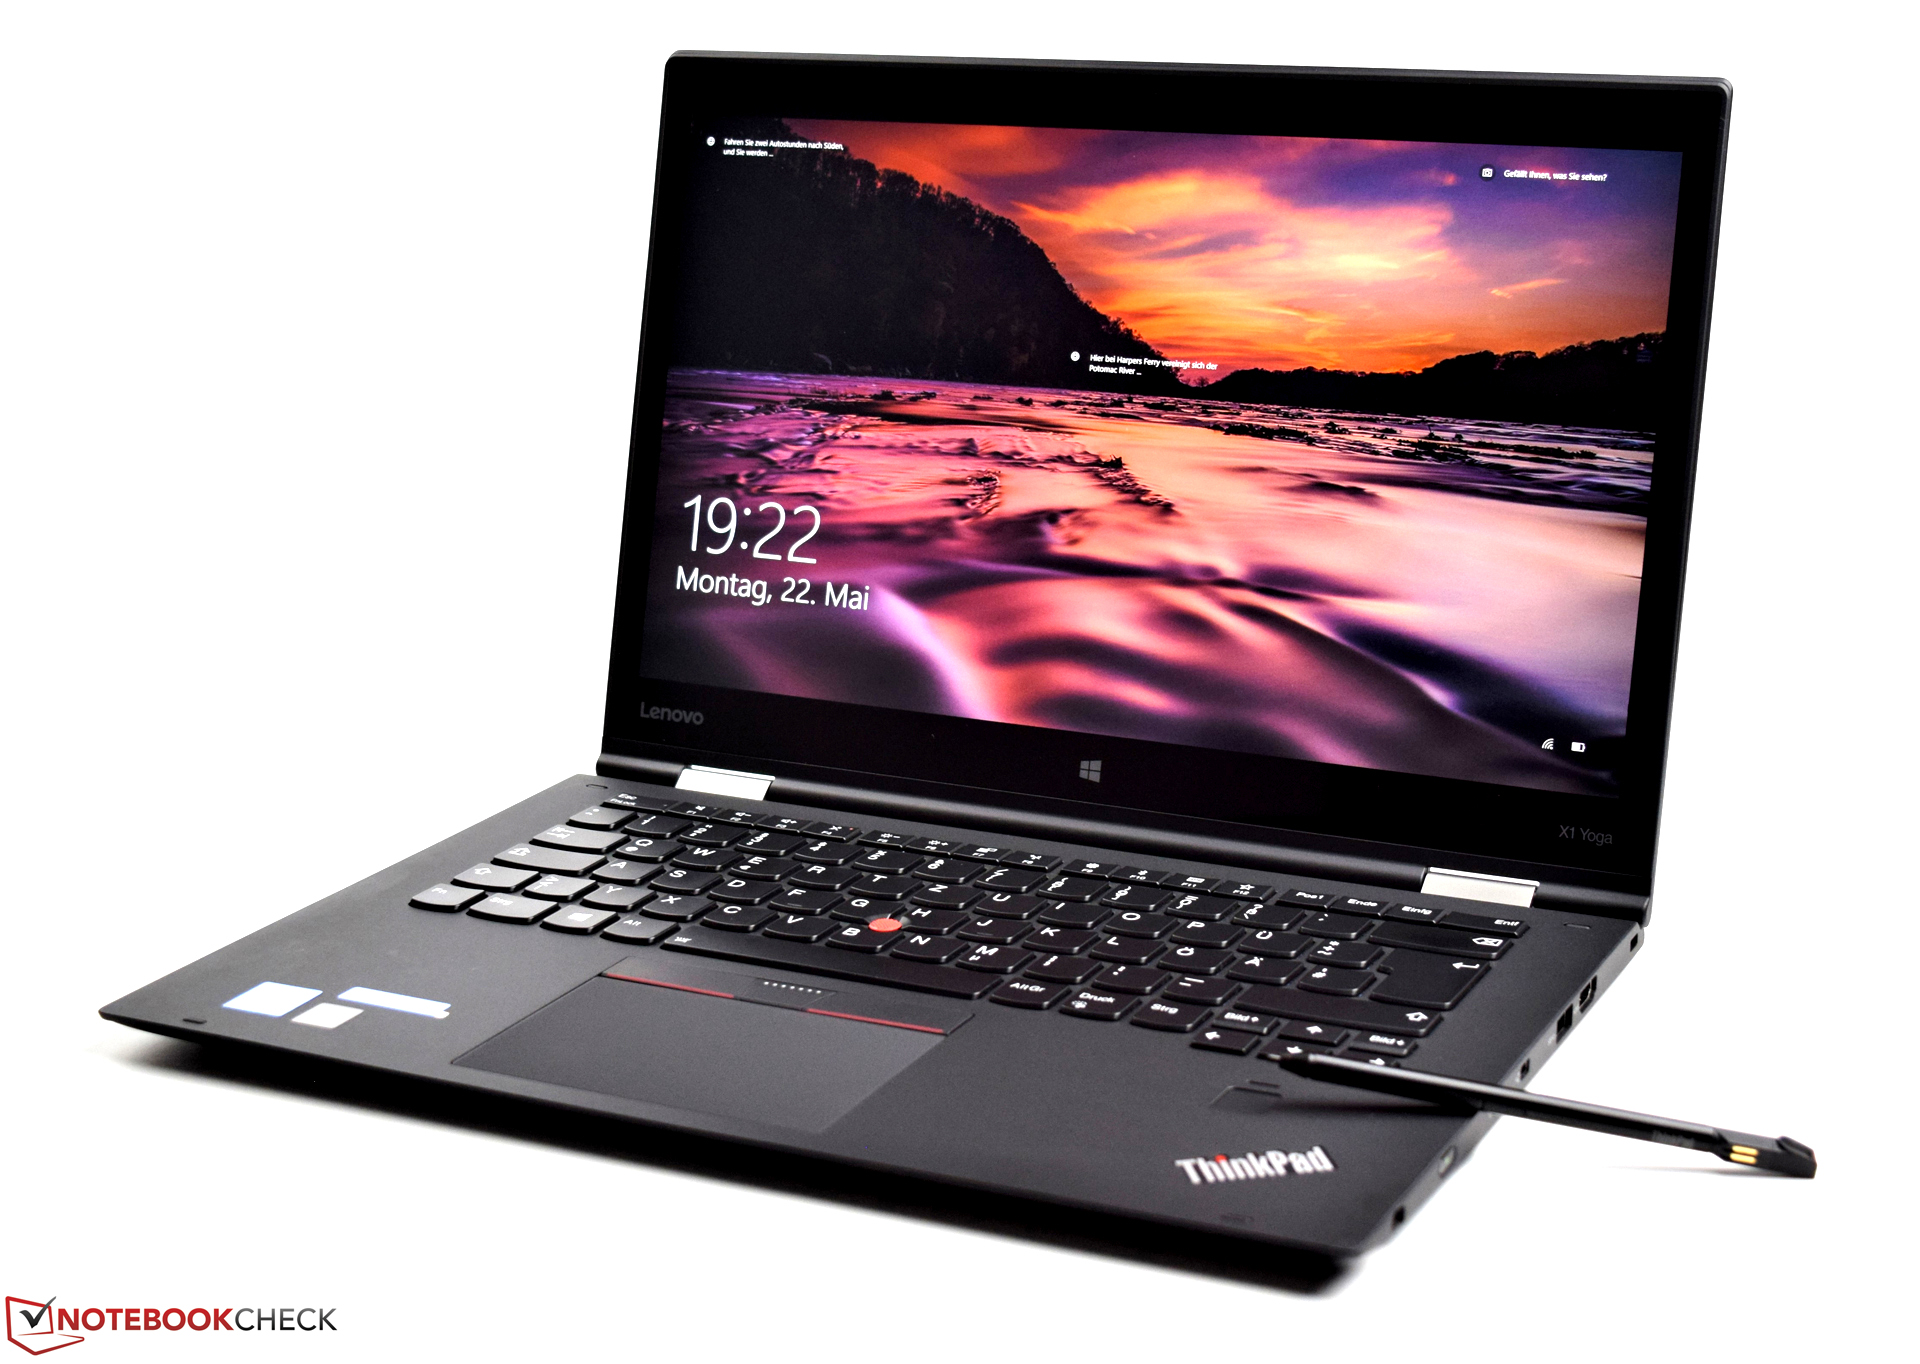
Lenovo ThinkPad X1 Yoga 2017 (Core i7, OLED) Convertible rövid értékelés


| SD Card Reader | |
| average JPG Copy Test (av. of 3 runs) | |
| Microsoft Surface Book with Performance Base | |
| Lenovo ThinkPad X1 Yoga 2017 20JES03T00 | |
| Dell Latitude 12 5285 2-in-1 | |
| maximum AS SSD Seq Read Test (1GB) | |
| Microsoft Surface Book with Performance Base | |
| Lenovo ThinkPad X1 Yoga 2017 20JES03T00 | |
| Dell Latitude 12 5285 2-in-1 | |
| |||||||||||||||||||||||||
Fényerő megoszlás: 95 %
Centrumban: 242 cd/m²
Kontraszt: ∞:1 (Fekete: 0 cd/m²)
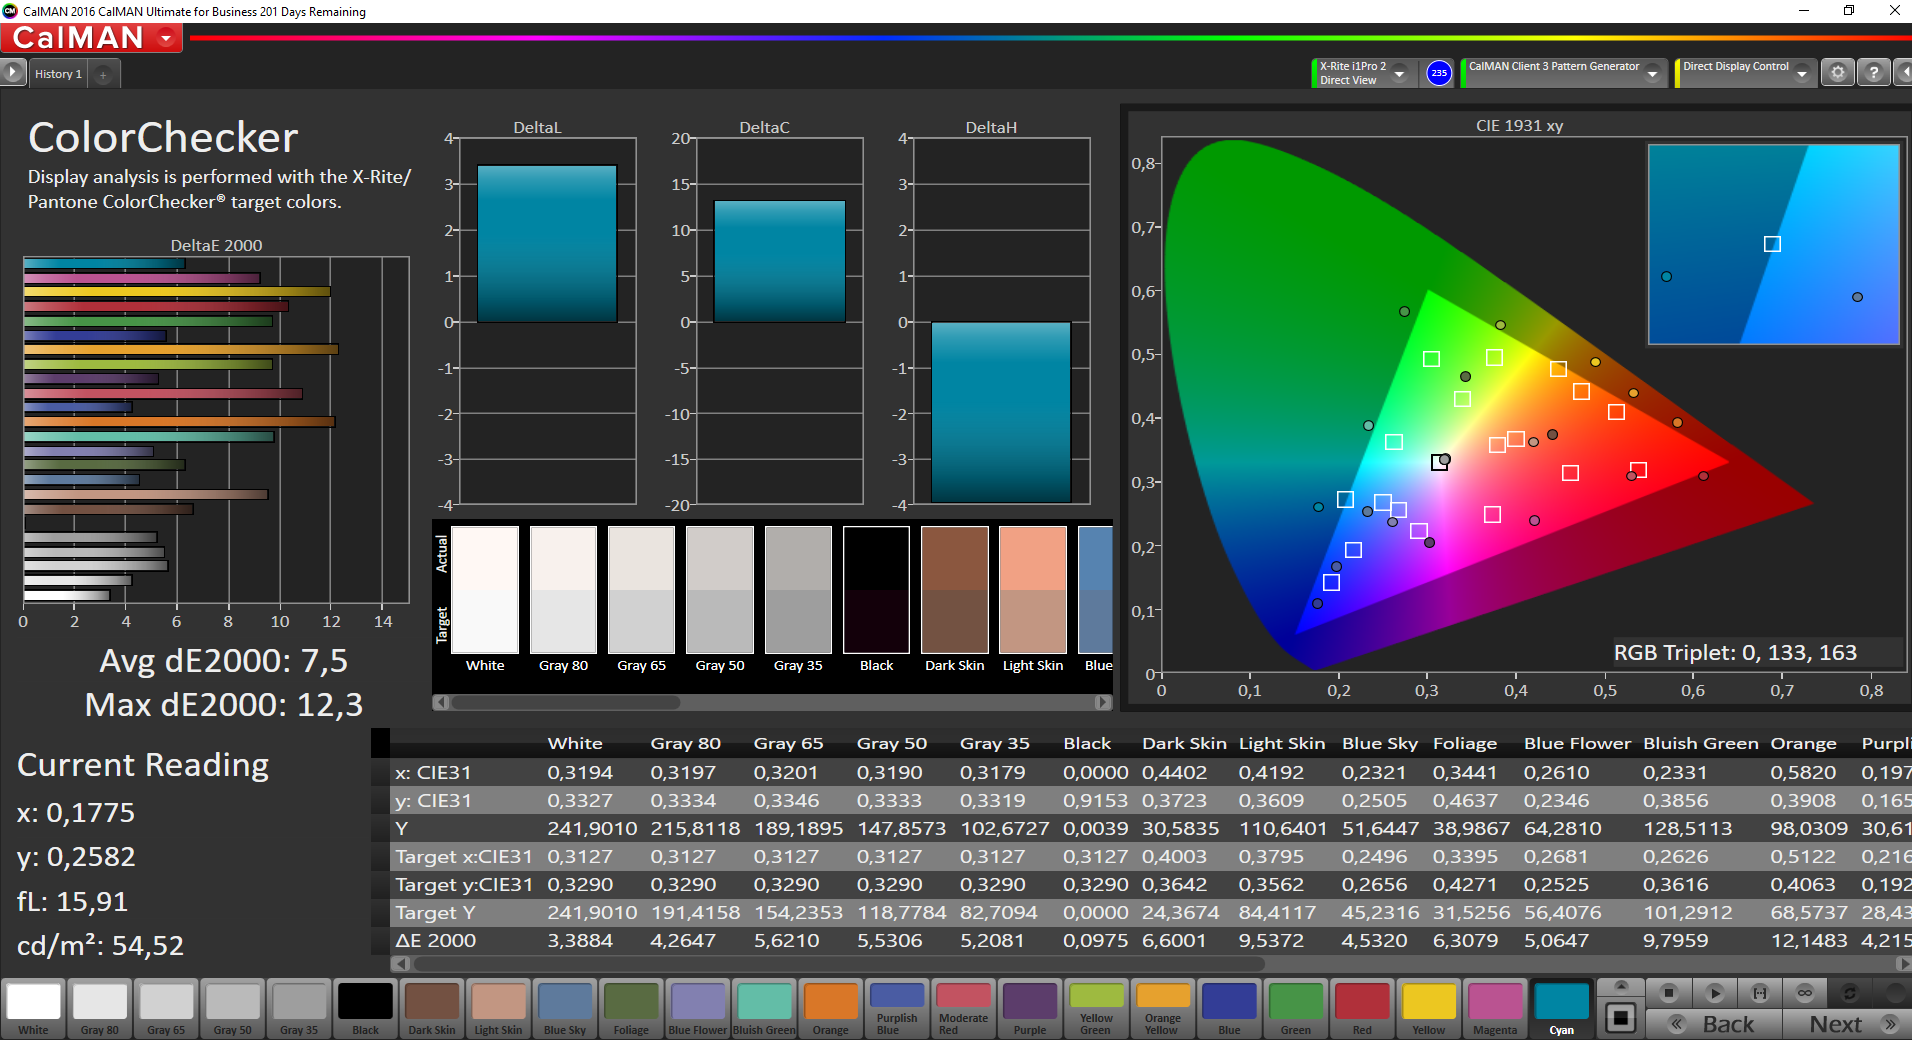
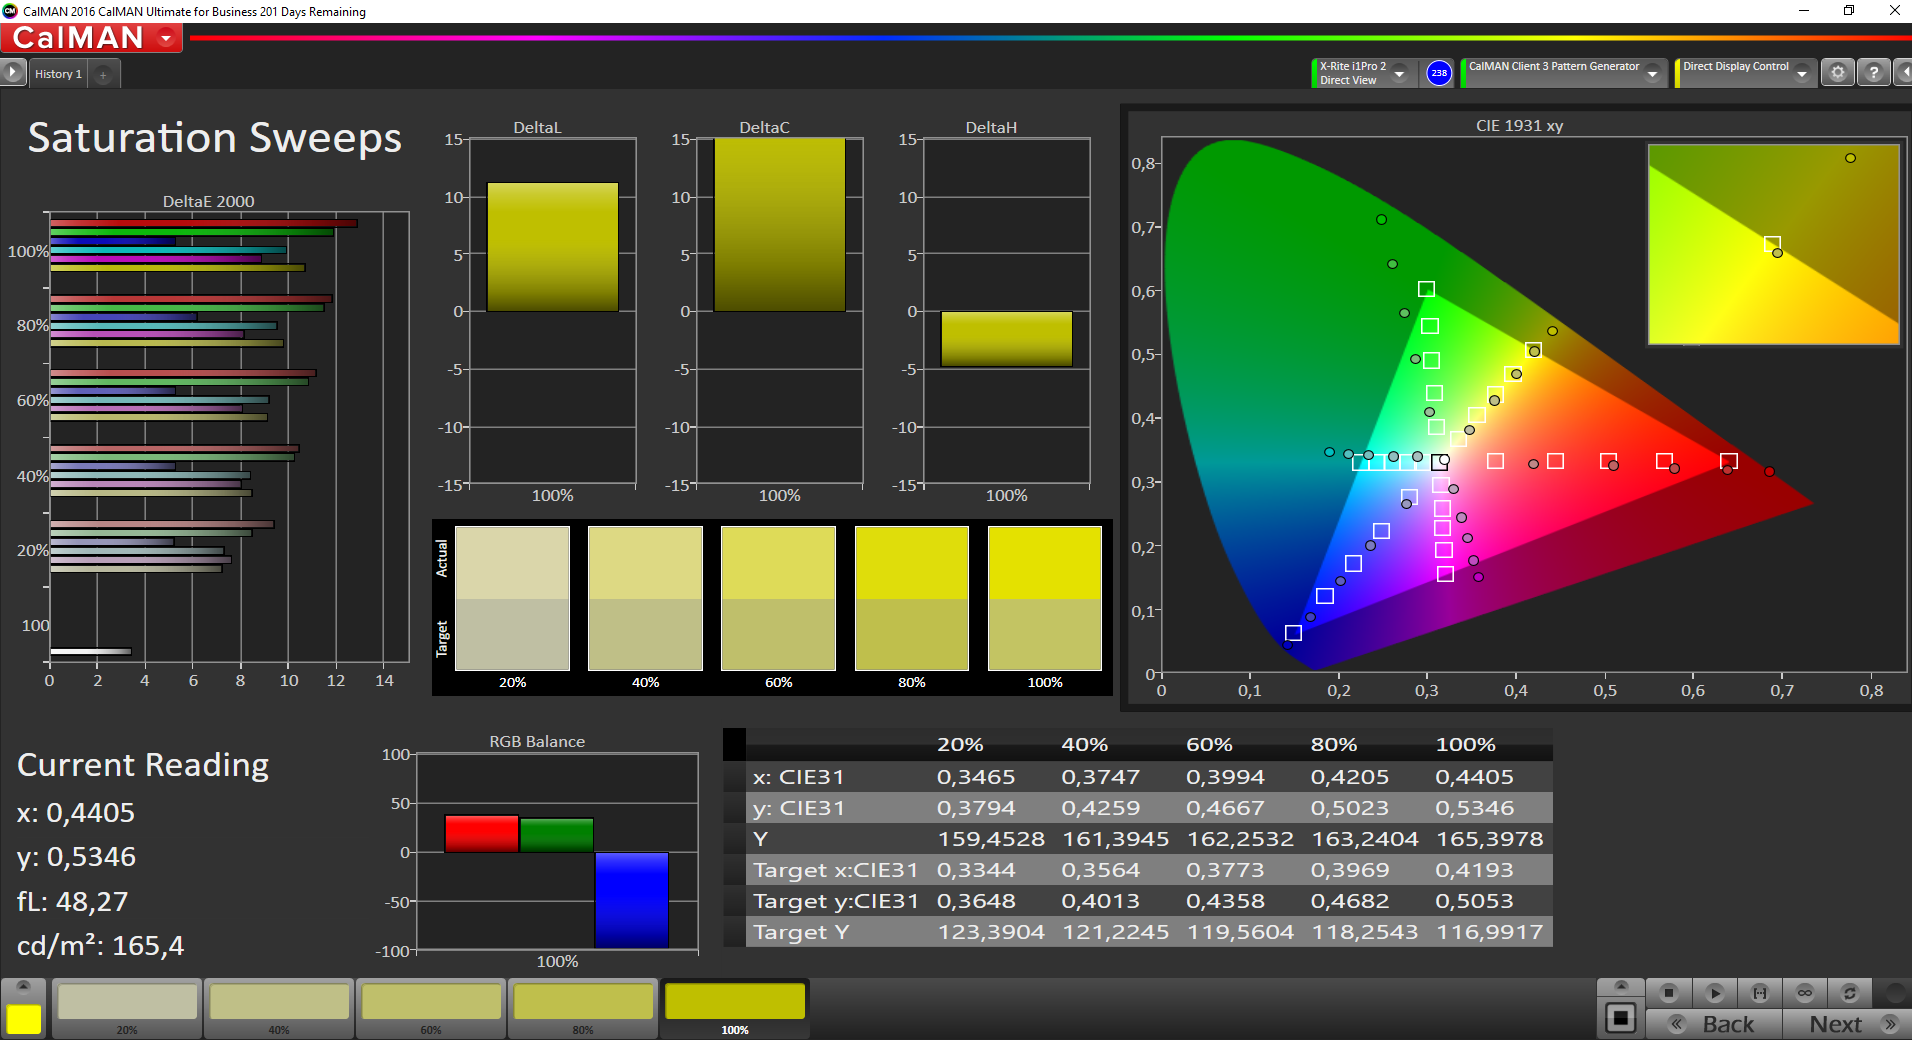
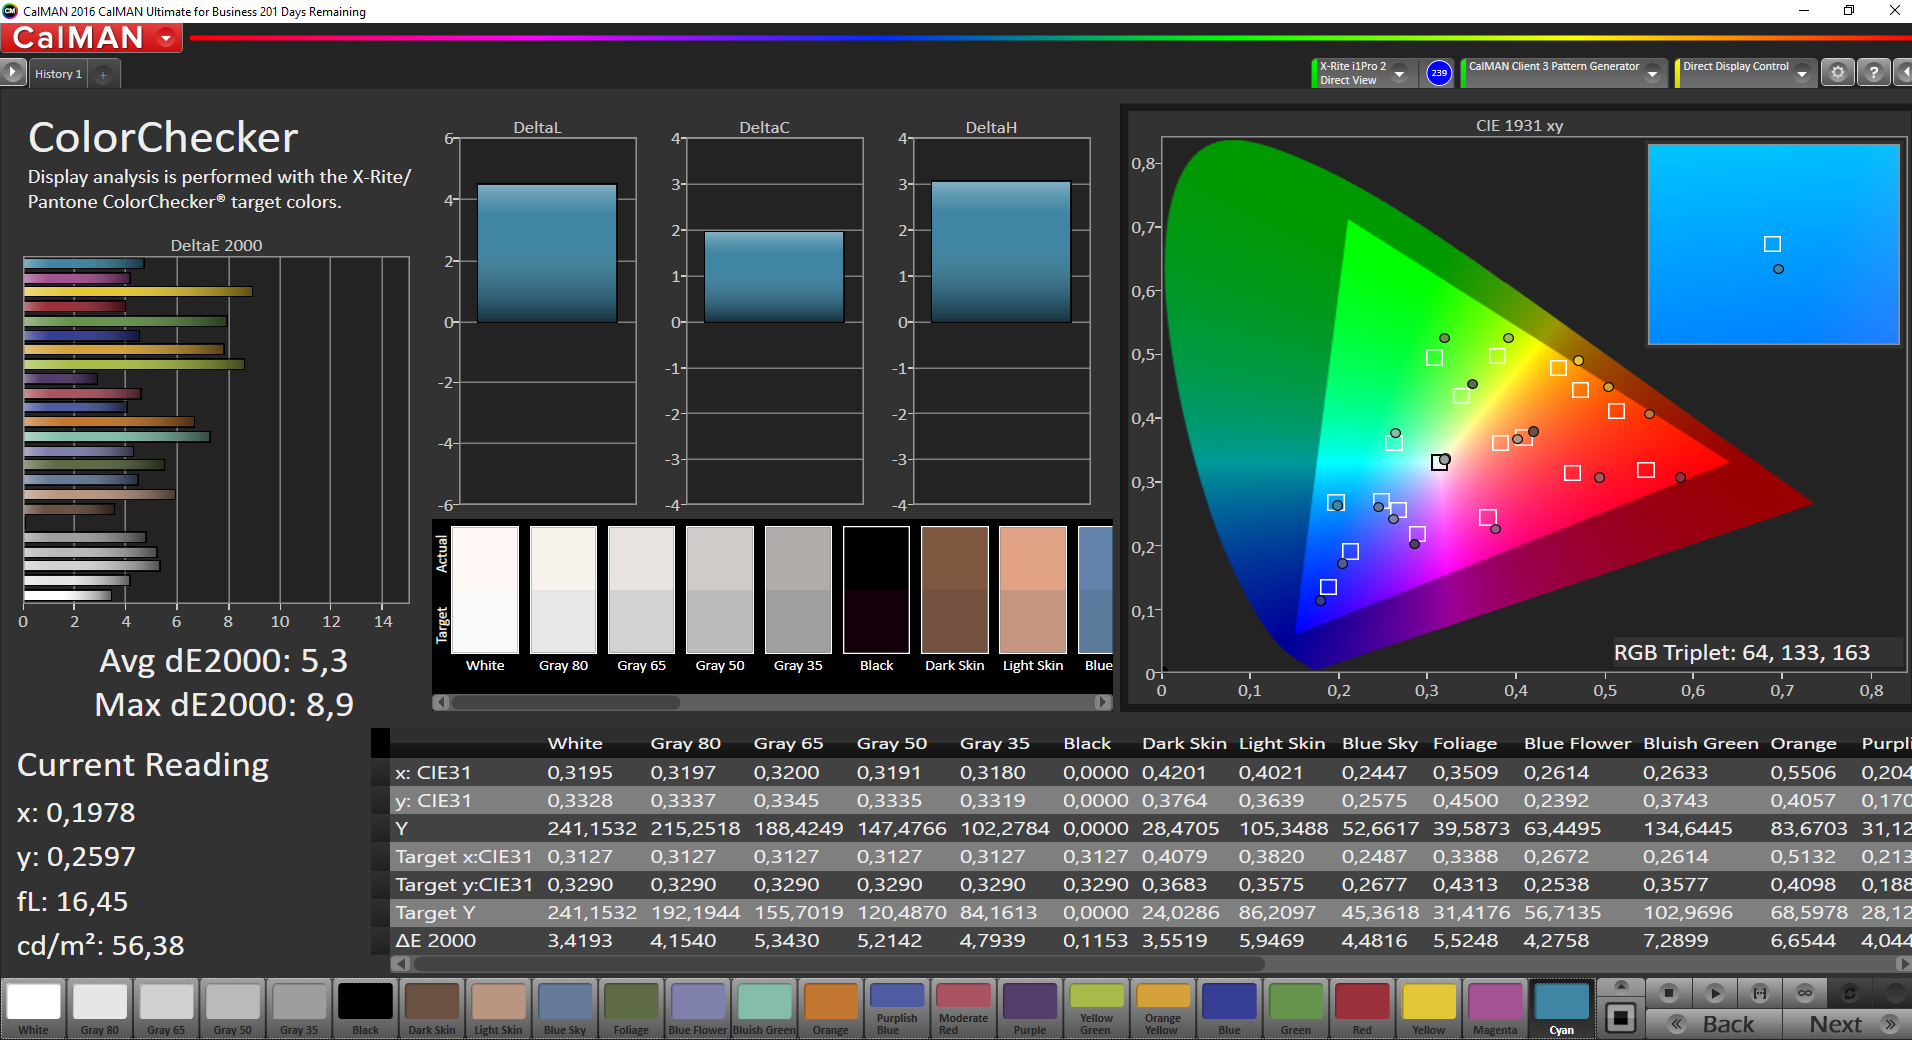
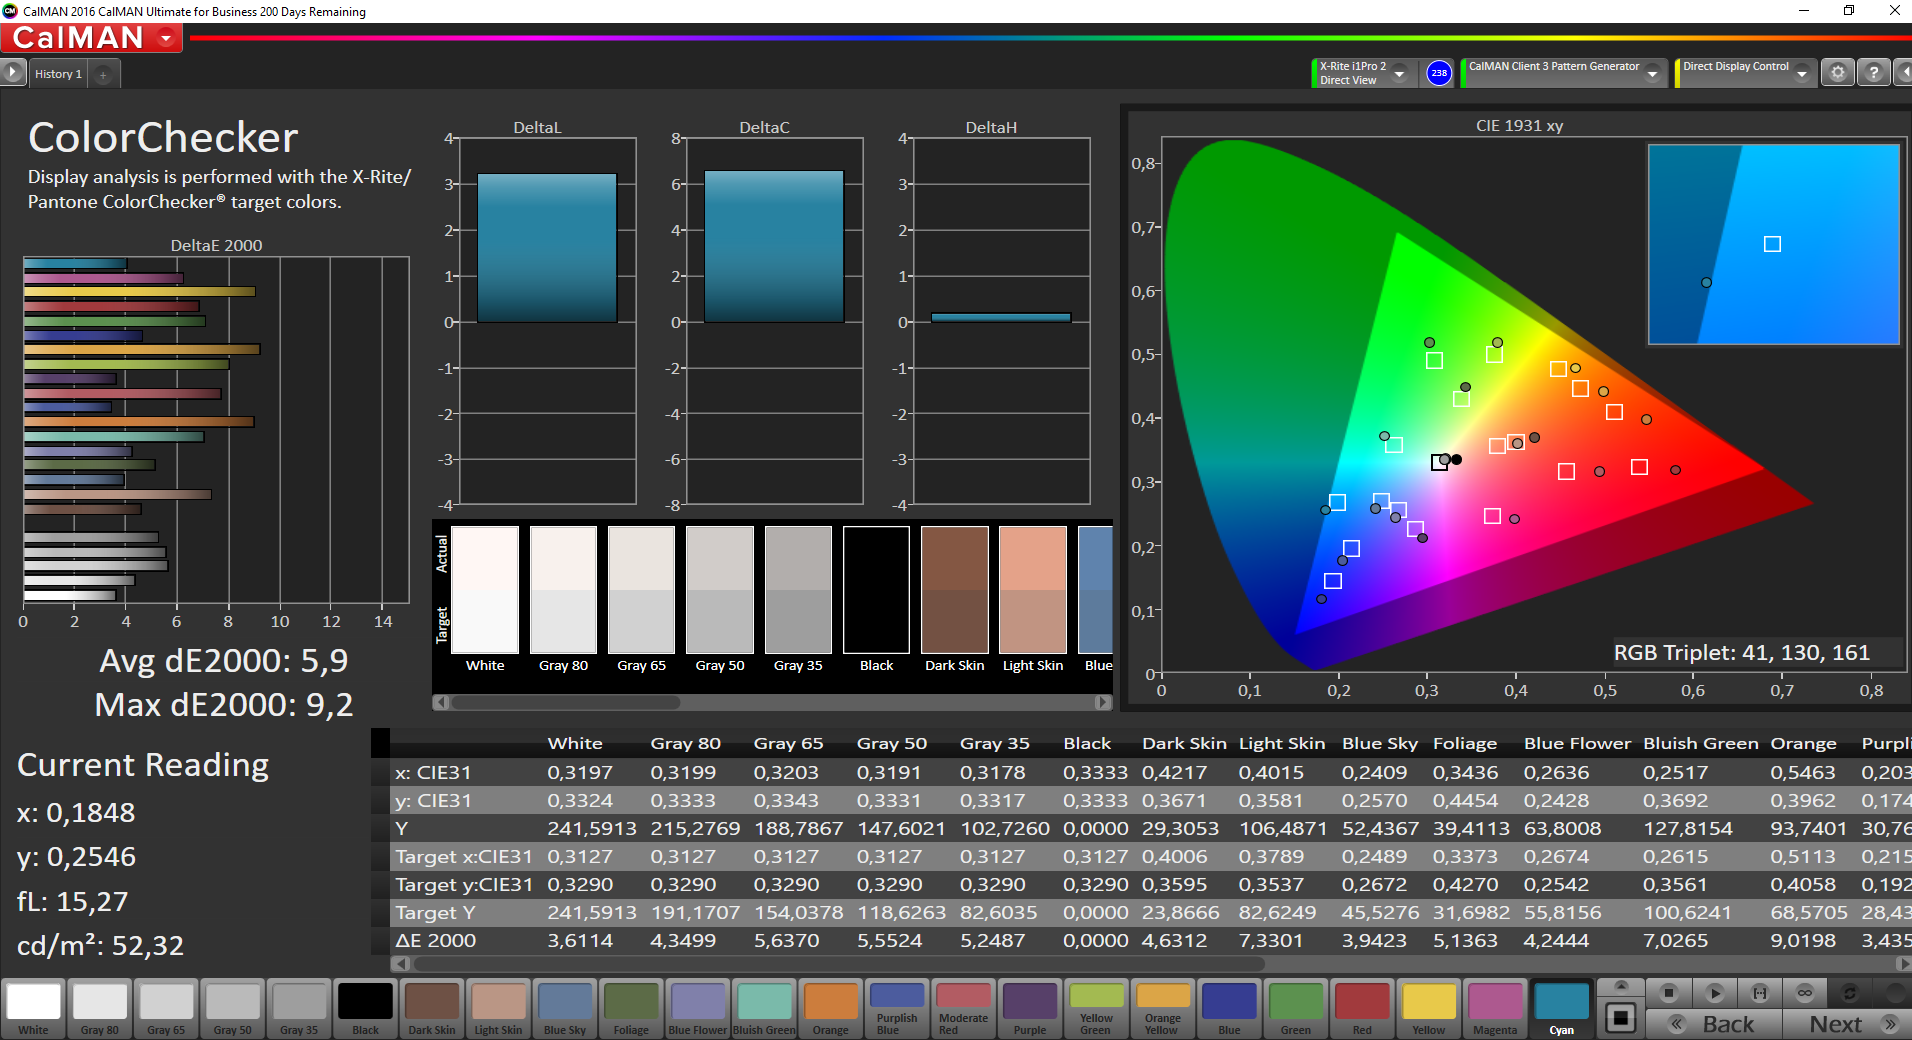
ΔE ColorChecker Calman: 5.3 | ∀{0.5-29.43 Ø4.71}
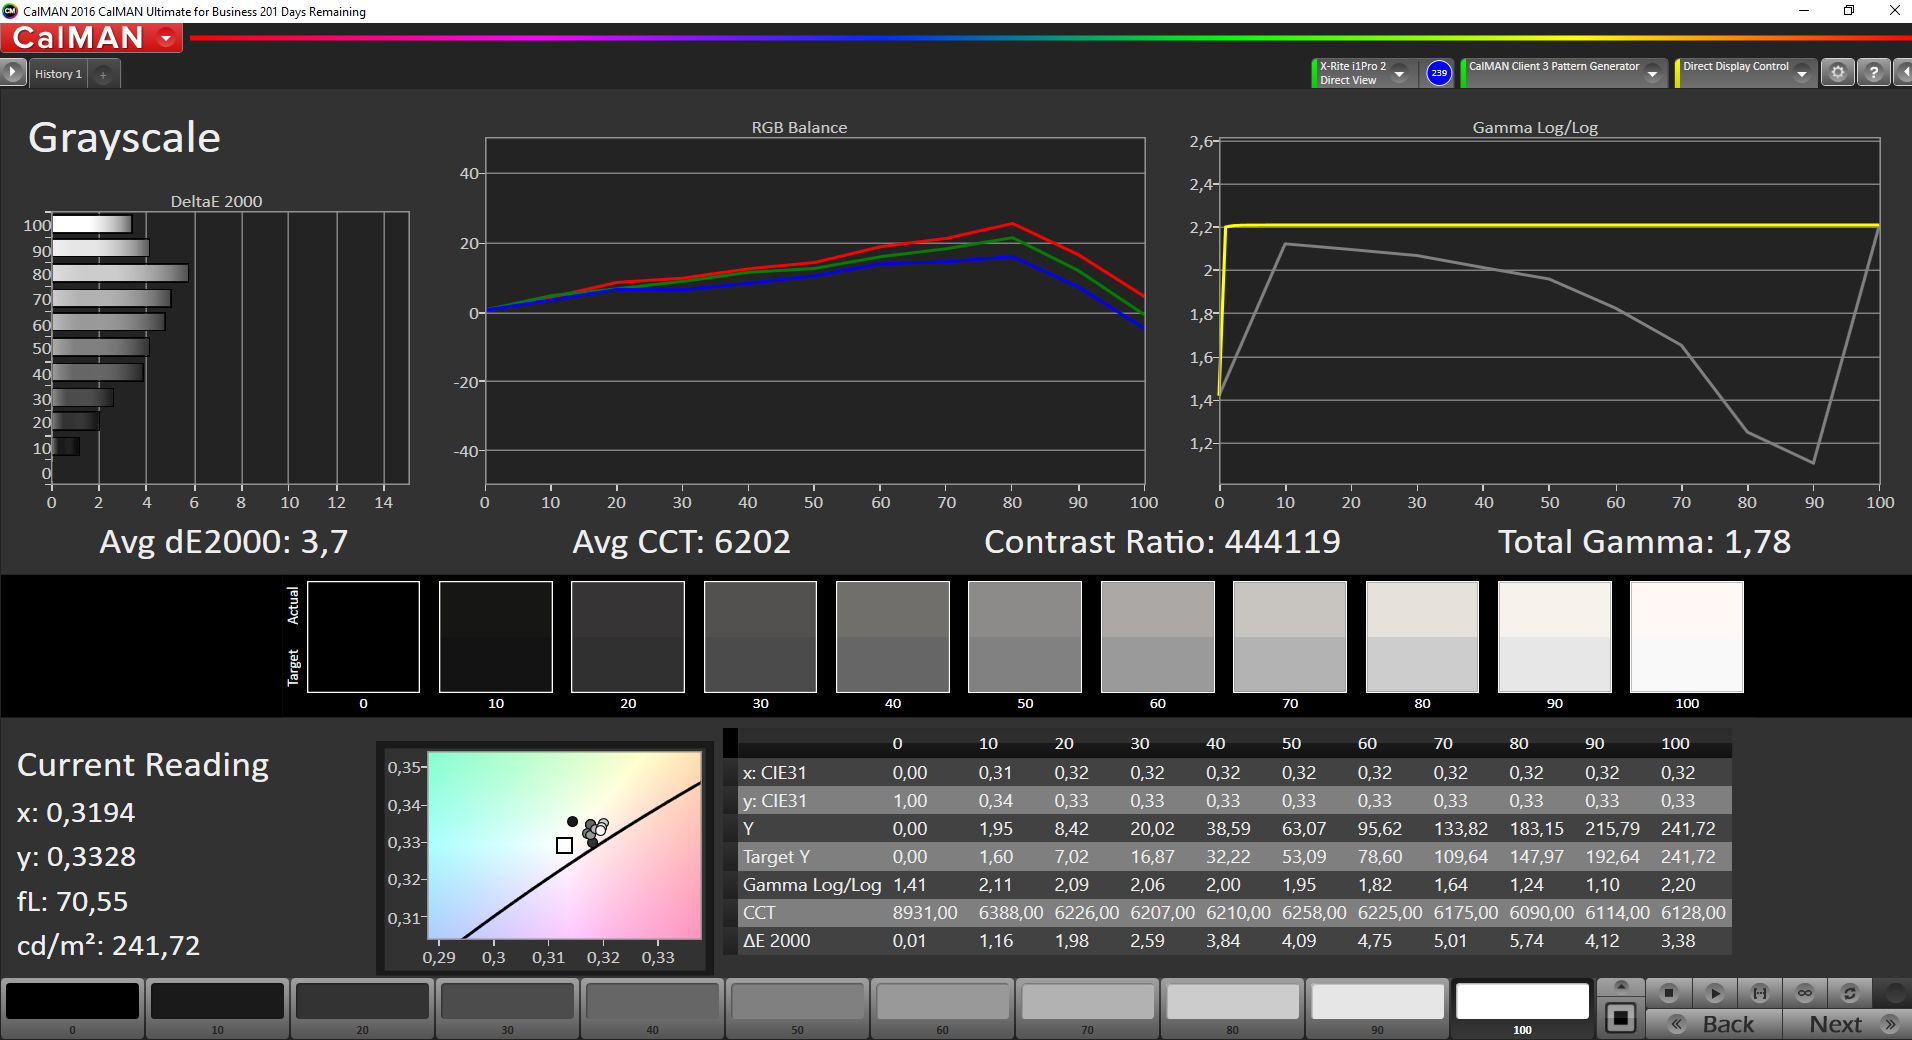
ΔE Greyscale Calman: 3.7 | ∀{0.09-98 Ø4.96}
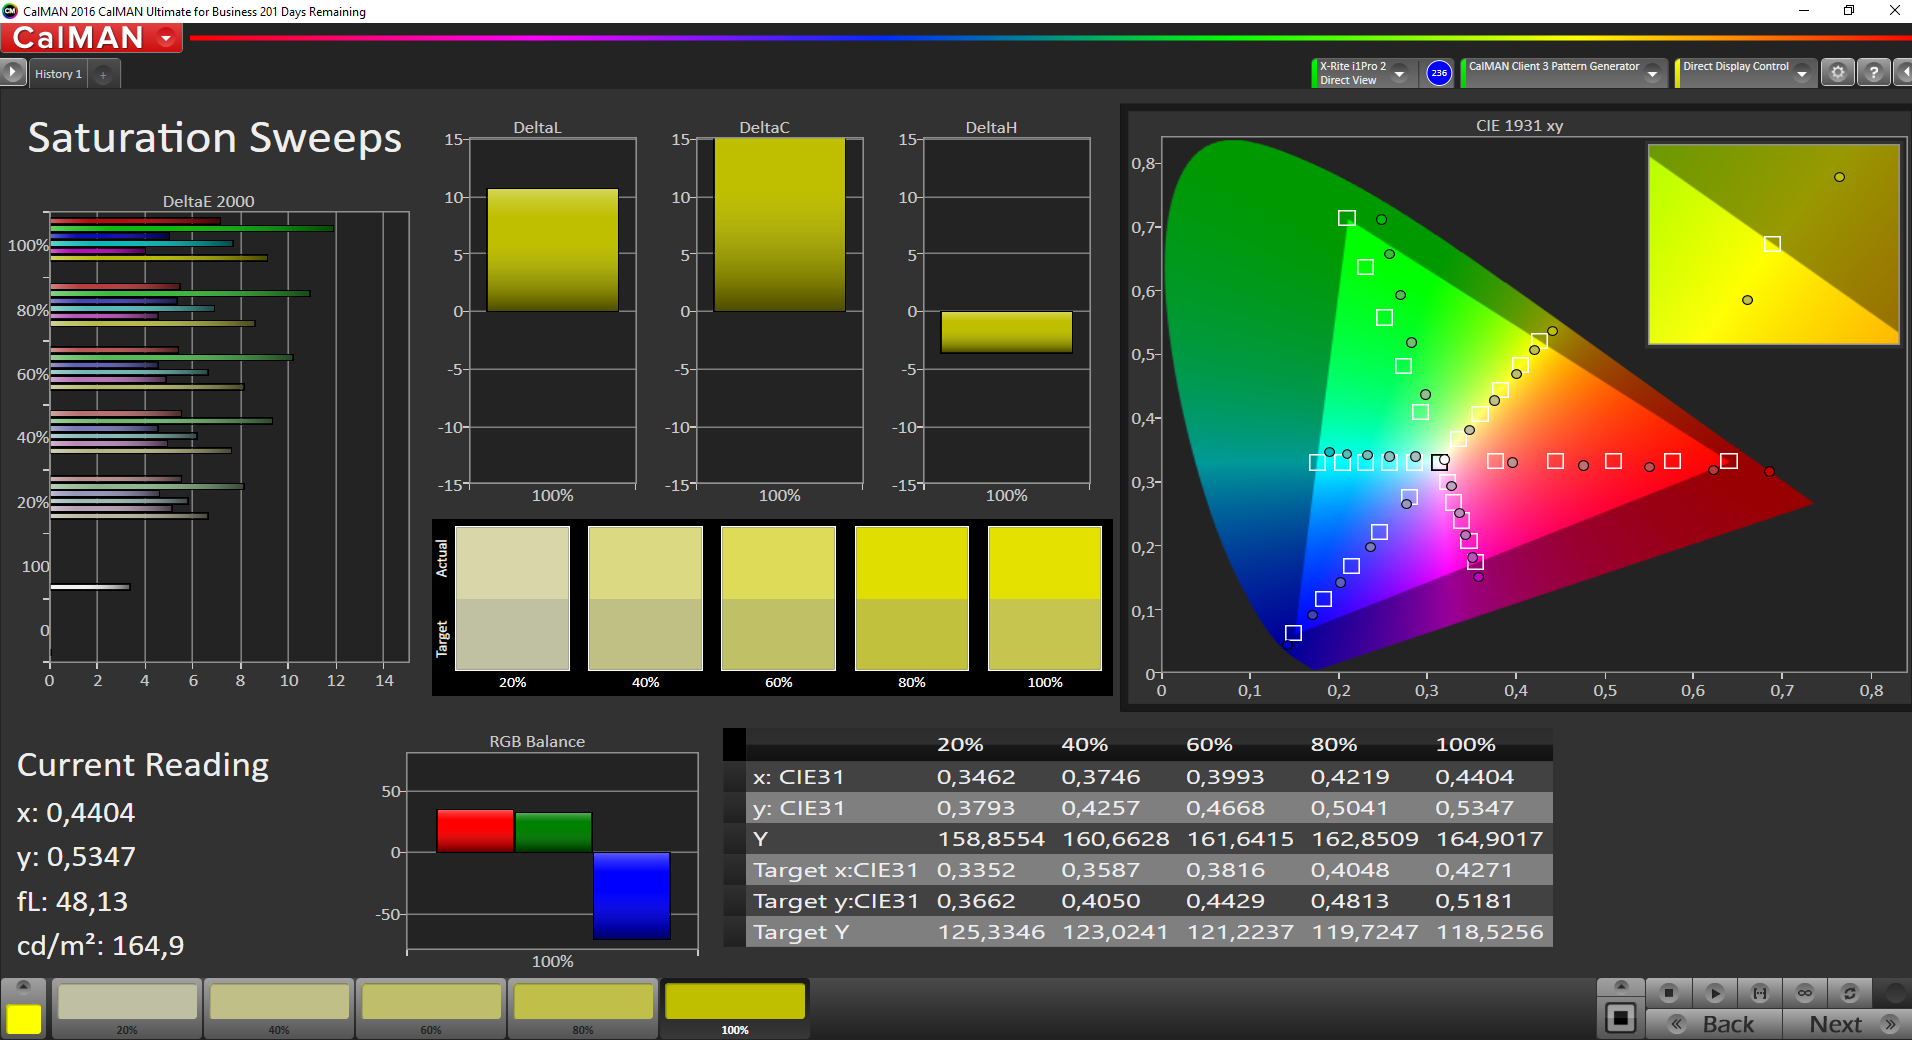
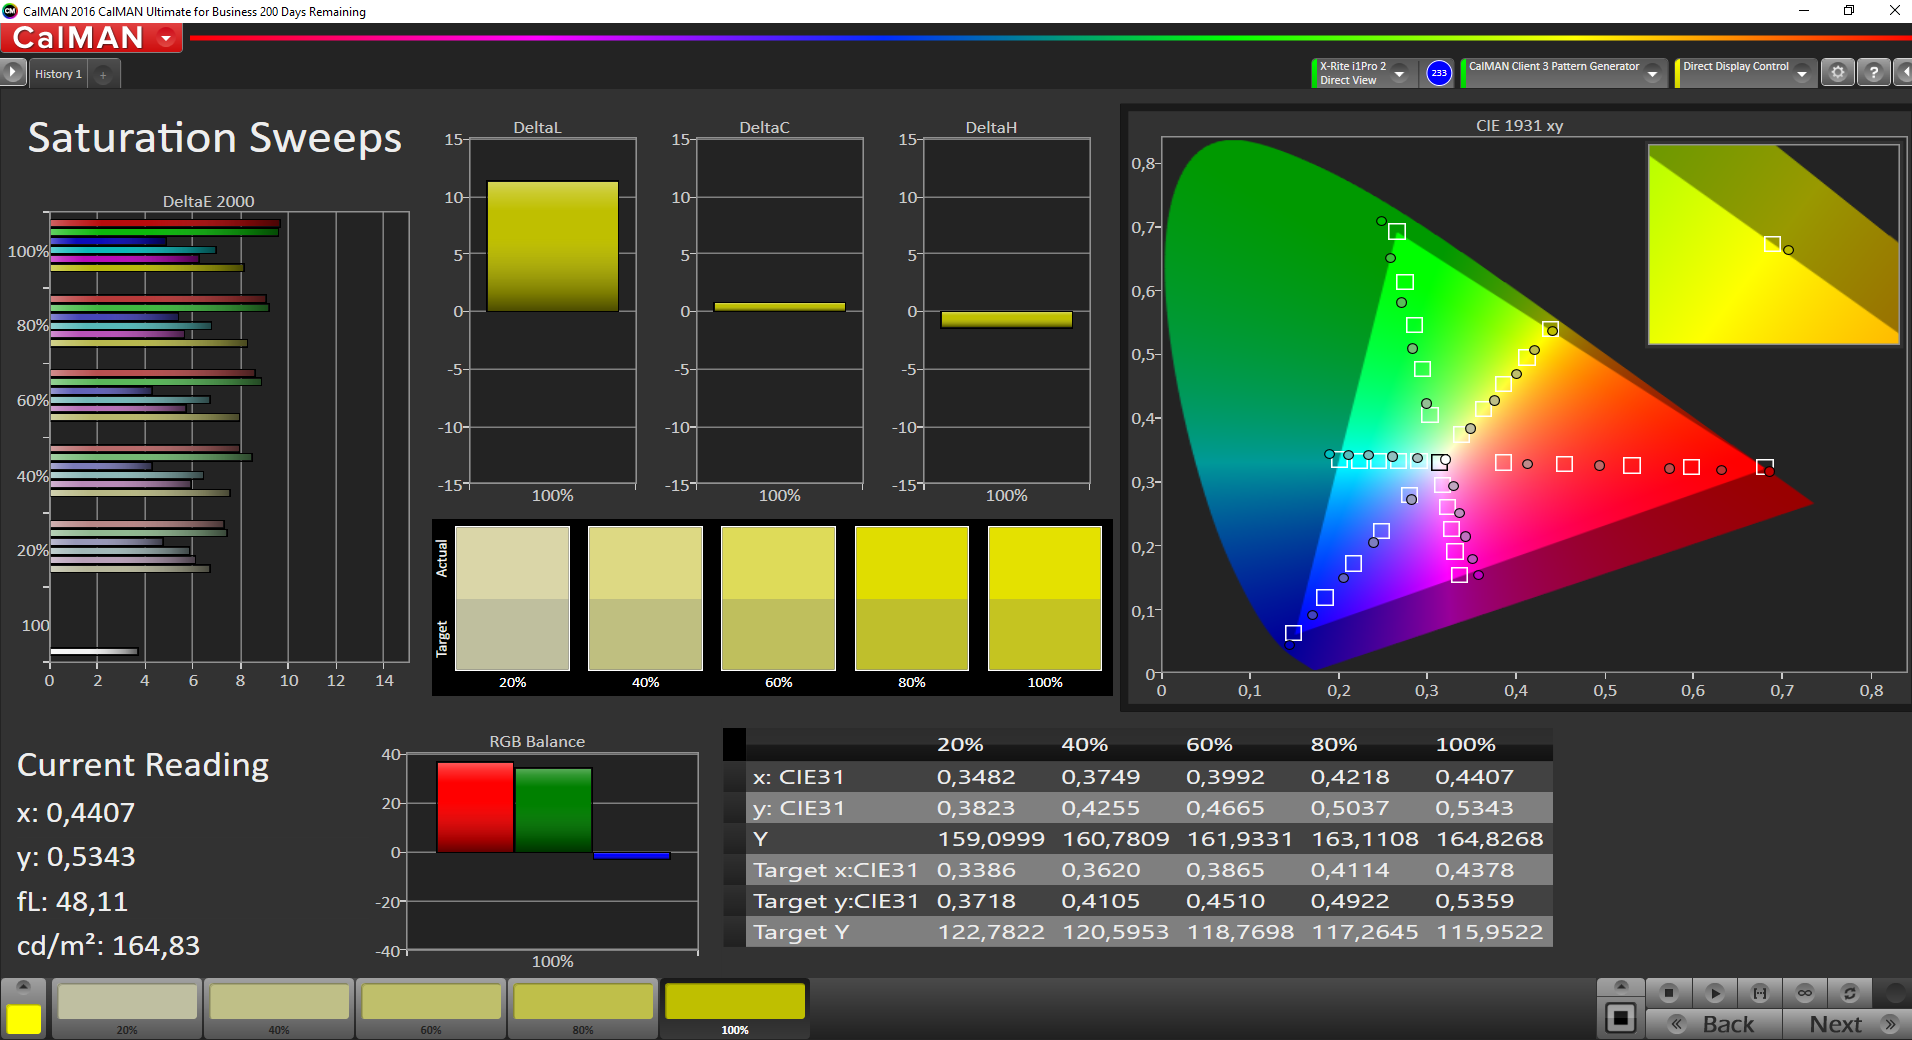
100% sRGB (Argyll 1.6.3 3D)
84.8% AdobeRGB 1998 (Argyll 1.6.3 3D)
Gamma: 1.78
CCT: 6202 K
| Lenovo ThinkPad X1 Yoga 2017 20JES03T00 LEN4140, , 2560x1440, 14" | Lenovo ThinkPad X1 Yoga-20FRS1VS00 Samsung ATNA40JU01-0, , 2560x1440, 14" | HP EliteBook x360 1030 G2 CMN1374, , 1920x1080, 13.3" | Toshiba Portege X20W-D-10R Toshiba TOS508F, , 1920x1080, 12.5" | Dell Latitude 12 5285 2-in-1 BOE06DC, , 1920x1280, 12.3" | Microsoft Surface Book with Performance Base Panasonic MEI96A2, , 3000x2000, 13.5" | |
|---|---|---|---|---|---|---|
| Display | ||||||
| Display P3 Coverage (%) | 65.5 | 68.7 | 62.8 | 66.4 | ||
| sRGB Coverage (%) | 88.8 | 96.8 | 94 | 95.4 | ||
| AdobeRGB 1998 Coverage (%) | 64.9 | 70.4 | 64.7 | 67.6 | ||
| Response Times | 71% | -1092% | -1440% | -971% | -1325% | |
| Response Time Grey 50% / Grey 80% * (ms) | 3.6 ? | 1 ? 72% | 55.2 ? -1433% | 67 ? -1761% | 42.4 ? -1078% | 61 ? -1594% |
| Response Time Black / White * (ms) | 3.2 ? | 1 ? 69% | 27.2 ? -750% | 39 ? -1119% | 30.8 ? -863% | 37 ? -1056% |
| PWM Frequency (Hz) | 240.4 ? | 240 ? | 210.1 ? | |||
| Screen | 1% | -14% | -4% | 22% | 34% | |
| Brightness middle (cd/m²) | 243 | 279 15% | 262 8% | 442 82% | 523.2 115% | 459 89% |
| Brightness (cd/m²) | 240 | 277 15% | 256 7% | 410 71% | 522 117% | 423 76% |
| Brightness Distribution (%) | 95 | 91 -4% | 83 -13% | 86 -9% | 88 -7% | 86 -9% |
| Black Level * (cd/m²) | 0.25 | 0.22 | 0.42 | 0.37 | ||
| Colorchecker dE 2000 * | 5.3 | 5.15 3% | 5.13 3% | 5.22 2% | 4 25% | 2.28 57% |
| Colorchecker dE 2000 max. * | 8.9 | 8.28 7% | 9.46 -6% | 11.84 -33% | 8.6 3% | 3.61 59% |
| Greyscale dE 2000 * | 3.7 | 5.44 -47% | 6.23 -68% | 7.88 -113% | 5.5 -49% | 2.48 33% |
| Gamma | 1.78 124% | 2.28 96% | 2.45 90% | 2.51 88% | 2.16 102% | 2.5 88% |
| CCT | 6202 105% | 5686 114% | 6413 101% | 6756 96% | 7546 86% | 8602 76% |
| Color Space (Percent of AdobeRGB 1998) (%) | 84.8 | 98 16% | 57.84 -32% | 64 -25% | 64.86 -24% | 62 -27% |
| Color Space (Percent of sRGB) (%) | 100 | 100 0% | 88.57 -11% | 97 -3% | 93.97 -6% | 96 -4% |
| Contrast (:1) | 1048 | 2009 | 1246 | 1241 | ||
| Teljes átlag (program / beállítások) | 36% /
15% | -553% /
-230% | -722% /
-291% | -475% /
-177% | -646% /
-238% |
* ... a kisebb jobb


Megjelenítési válaszidők
| ↔ Válaszidő Fekete-fehér | ||
|---|---|---|
| 3.2 ms ... emelkedés és süllyedés ↘ kombinálva | ↗ 2 ms emelkedés | 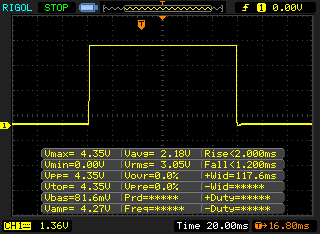 |
| ↘ 1.2 ms ősz | ||
| A képernyő tesztjeinkben nagyon gyors reakciósebességet mutatott, és nagyon jól használható gyors tempójú játékokhoz. Összehasonlításképpen, az összes tesztelt eszköz 0.1 (minimum) és 240 (maximum) ms között mozog. » 15 % of all devices are better. Ez azt jelenti, hogy a mért válaszidő jobb, mint az összes vizsgált eszköz átlaga (19.8 ms). | ||
| ↔ Válaszidő 50% szürke és 80% szürke között | ||
| 3.6 ms ... emelkedés és süllyedés ↘ kombinálva | ↗ 1.6 ms emelkedés | 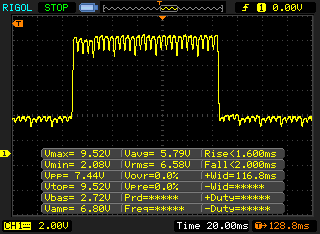 |
| ↘ 2 ms ősz | ||
| A képernyő tesztjeinkben nagyon gyors reakciósebességet mutatott, és nagyon jól használható gyors tempójú játékokhoz. Összehasonlításképpen, az összes tesztelt eszköz 0.165 (minimum) és 636 (maximum) ms között mozog. » 14 % of all devices are better. Ez azt jelenti, hogy a mért válaszidő jobb, mint az összes vizsgált eszköz átlaga (31 ms). | ||
Képernyő villogása / PWM (impulzusszélesség-moduláció)
| Képernyő villogása / PWM észlelve | 240.4 Hz | ≤ 80 % fényerő beállítása | 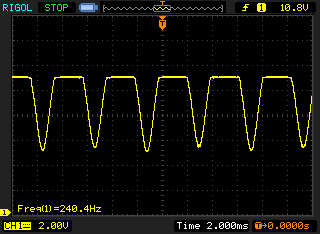 |
A kijelző háttérvilágítása 240.4 Hz-en villog (a legrosszabb esetben, pl. PWM használatával) Villódzás észlelve a 80 % vagy annál kisebb fényerő-beállításnál. E fényerő-beállítás felett nem lehet villogás vagy PWM. A 240.4 Hz frekvenciája viszonylag alacsony, így az érzékeny felhasználók valószínűleg villogást észlelnek, és megerőltetik a szemüket a megadott és az alatti fényerő-beállítás mellett. Összehasonlításképpen: az összes tesztelt eszköz 52 %-a nem használja a PWM-et a kijelző elsötétítésére. Ha PWM-et észleltek, akkor átlagosan 7757 (minimum: 5 - maximum: 343500) Hz-t mértek. | |||
| Cinebench R15 | |
| CPU Single 64Bit | |
| Lenovo ThinkPad X1 Yoga 2017 20JES03T00 | |
| Toshiba Portege X20W-D-10R | |
| Dell Latitude 12 5285 2-in-1 | |
| HP EliteBook x360 1030 G2 | |
| Microsoft Surface Book with Performance Base | |
| Lenovo ThinkPad X1 Yoga-20FRS1VS00 | |
| CPU Multi 64Bit | |
| Lenovo ThinkPad X1 Yoga 2017 20JES03T00 | |
| HP EliteBook x360 1030 G2 | |
| Dell Latitude 12 5285 2-in-1 | |
| Microsoft Surface Book with Performance Base | |
| Toshiba Portege X20W-D-10R | |
| Lenovo ThinkPad X1 Yoga-20FRS1VS00 | |
| Cinebench R11.5 | |
| CPU Multi 64Bit | |
| Lenovo ThinkPad X1 Yoga 2017 20JES03T00 | |
| Dell Latitude 12 5285 2-in-1 | |
| HP EliteBook x360 1030 G2 | |
| Lenovo ThinkPad X1 Yoga-20FRS1VS00 | |
| CPU Single 64Bit | |
| Lenovo ThinkPad X1 Yoga 2017 20JES03T00 | |
| Dell Latitude 12 5285 2-in-1 | |
| HP EliteBook x360 1030 G2 | |
| Lenovo ThinkPad X1 Yoga-20FRS1VS00 | |
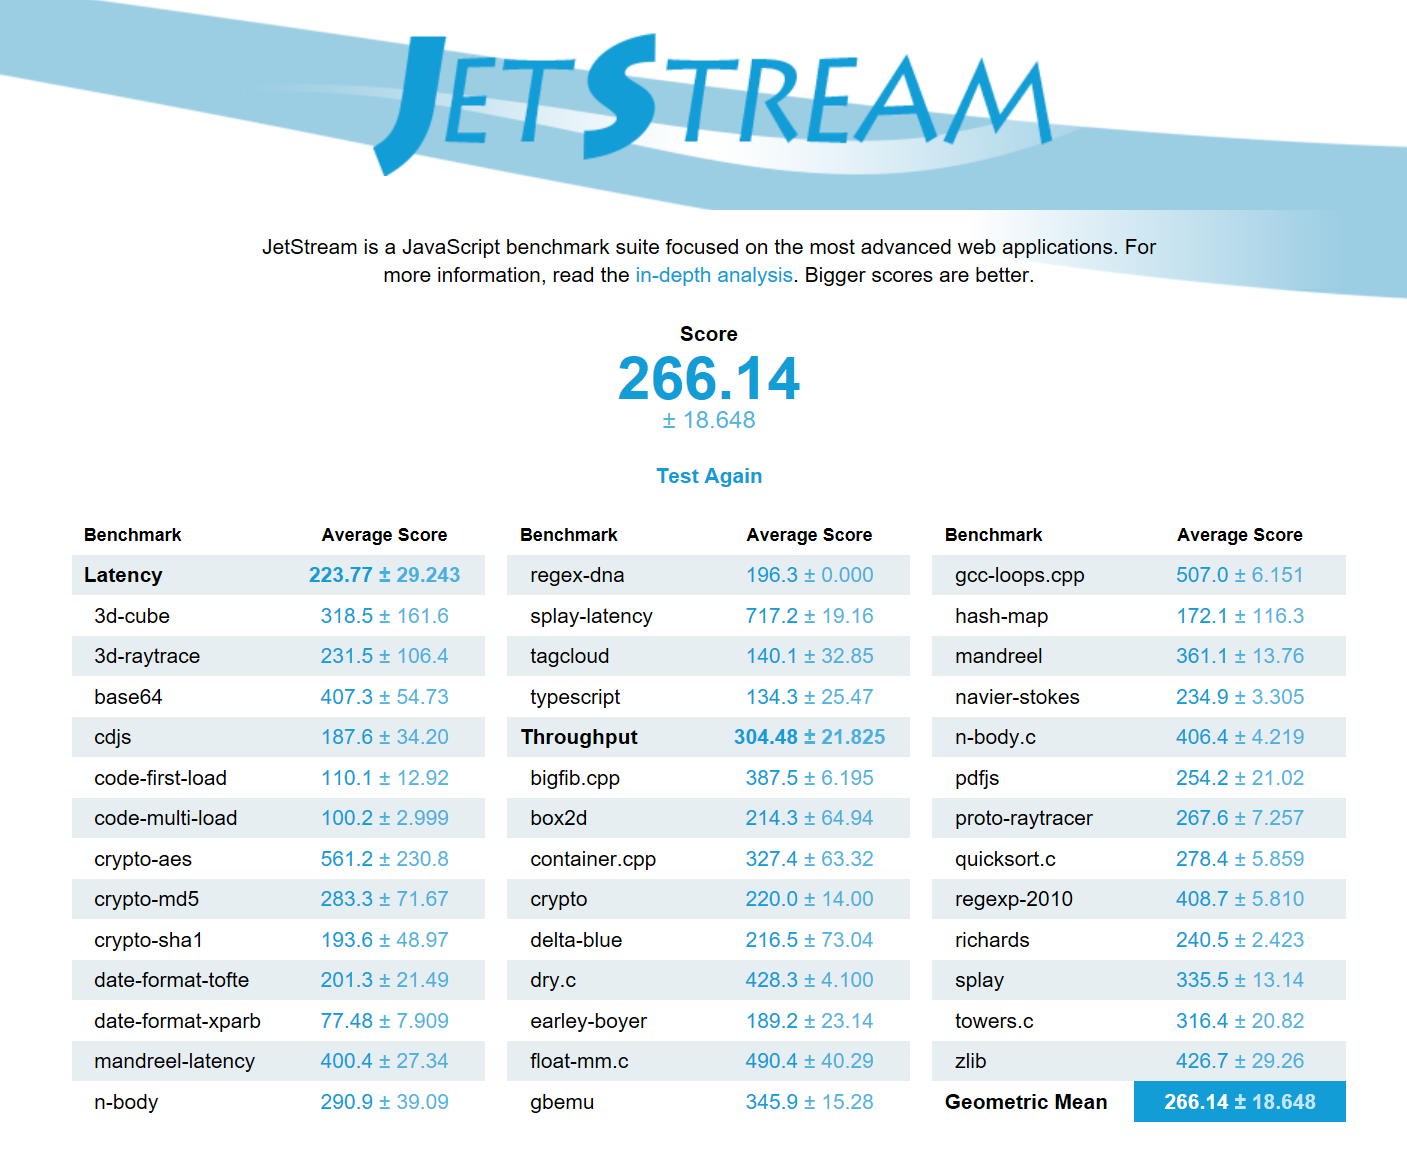
| JetStream 1.1 - 1.1 Total | |
| Lenovo ThinkPad X1 Yoga 2017 20JES03T00 | |
| Toshiba Portege X20W-D-10R | |
| Microsoft Surface Book with Performance Base | |
| HP EliteBook x360 1030 G2 | |
| Lenovo ThinkPad X1 Yoga-20FRS1VS00 | |
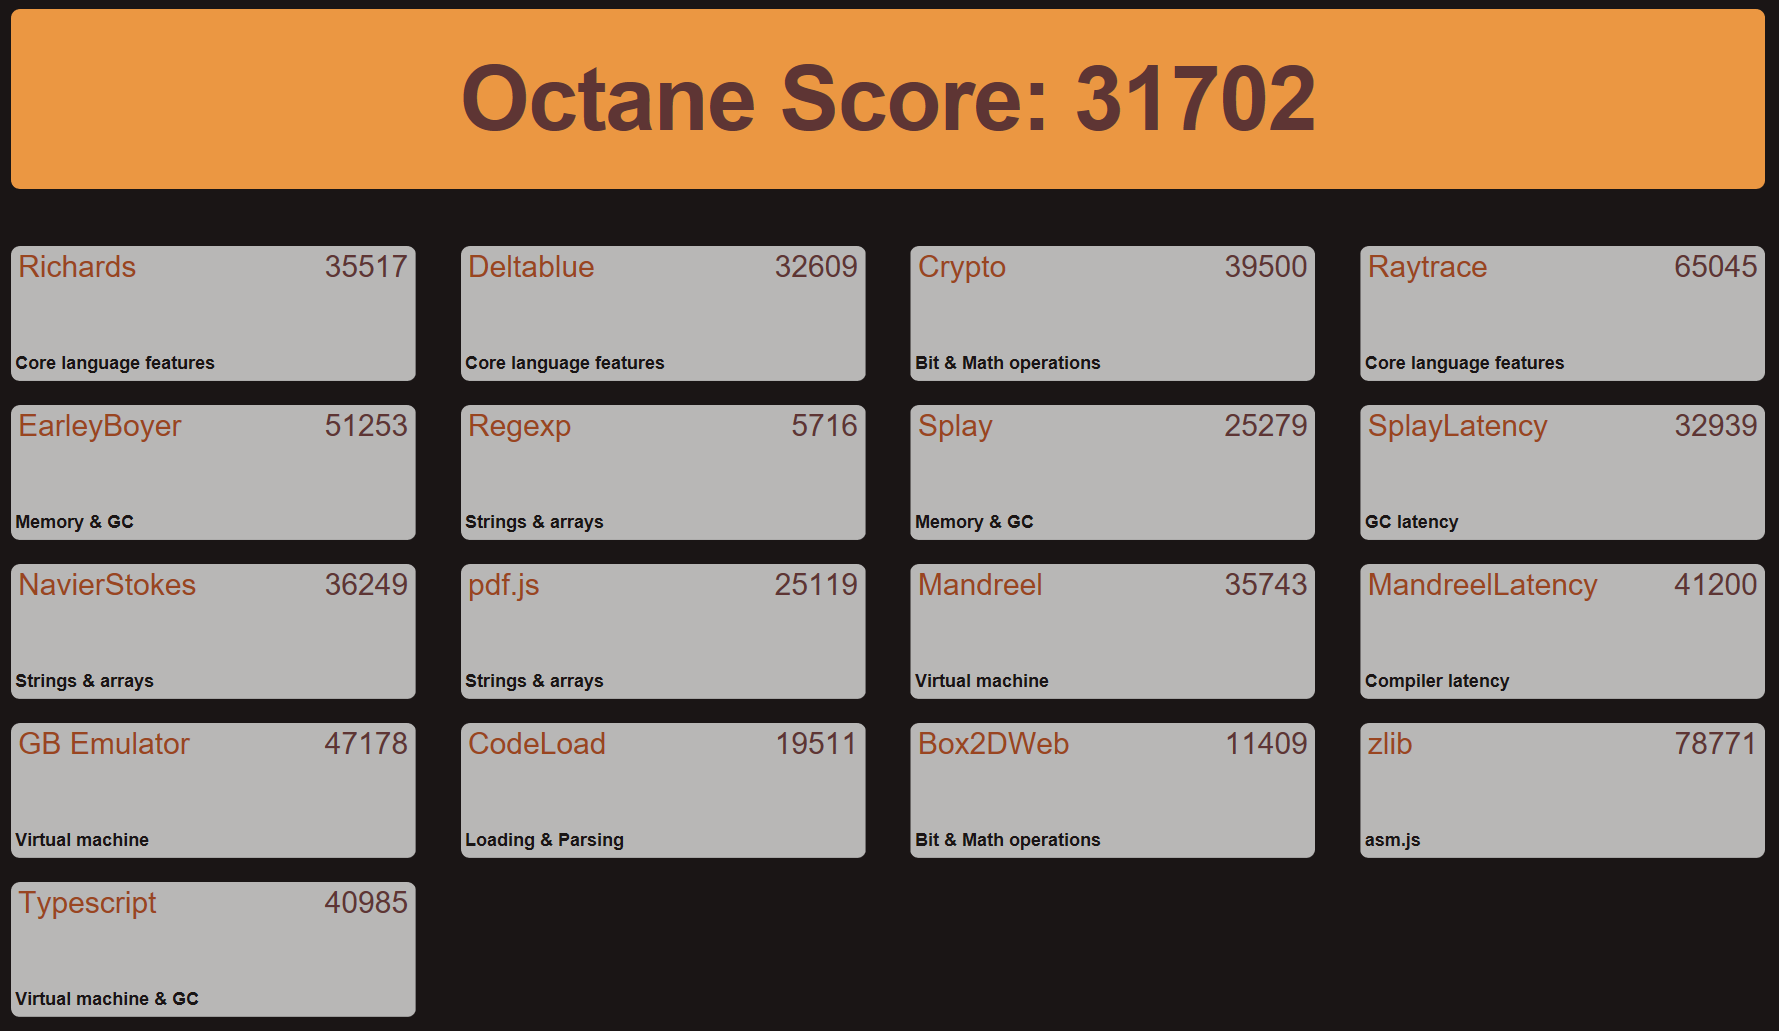
| Octane V2 - Total Score | |
| Toshiba Portege X20W-D-10R | |
| HP EliteBook x360 1030 G2 | |
| Microsoft Surface Book with Performance Base | |
| Lenovo ThinkPad X1 Yoga 2017 20JES03T00 | |
| Lenovo ThinkPad X1 Yoga-20FRS1VS00 | |
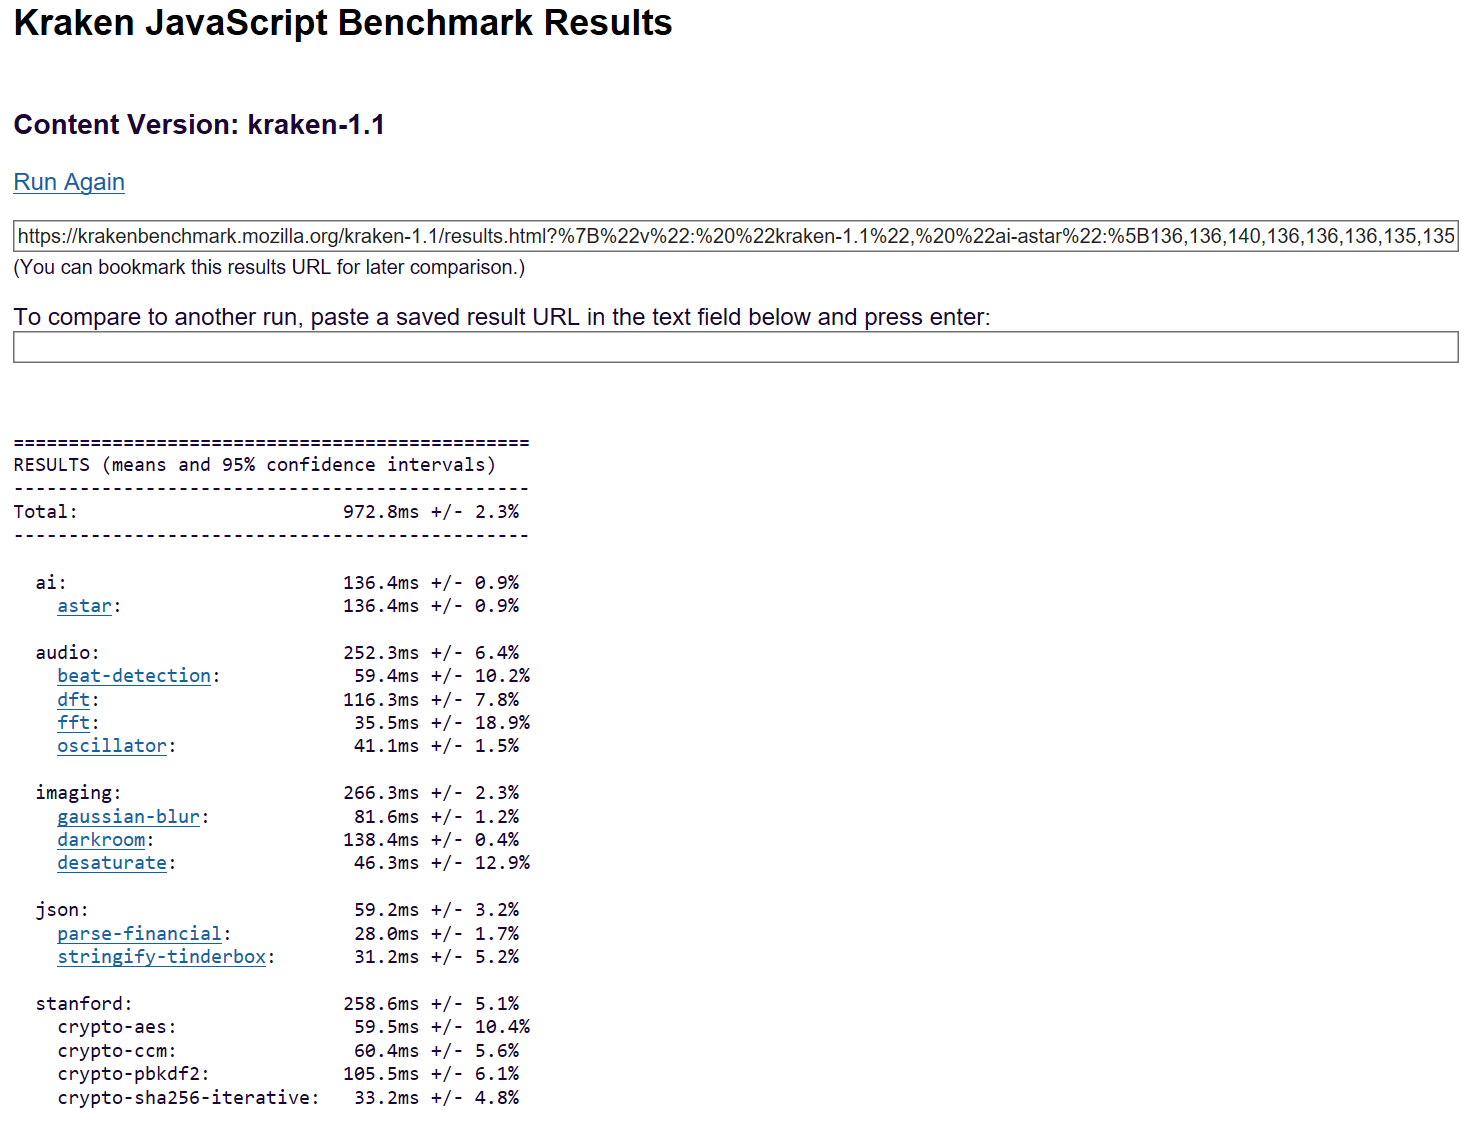
| Mozilla Kraken 1.1 - Total | |
| Lenovo ThinkPad X1 Yoga-20FRS1VS00 | |
| Microsoft Surface Book with Performance Base | |
| HP EliteBook x360 1030 G2 | |
| Toshiba Portege X20W-D-10R | |
| Lenovo ThinkPad X1 Yoga 2017 20JES03T00 | |
* ... a kisebb jobb
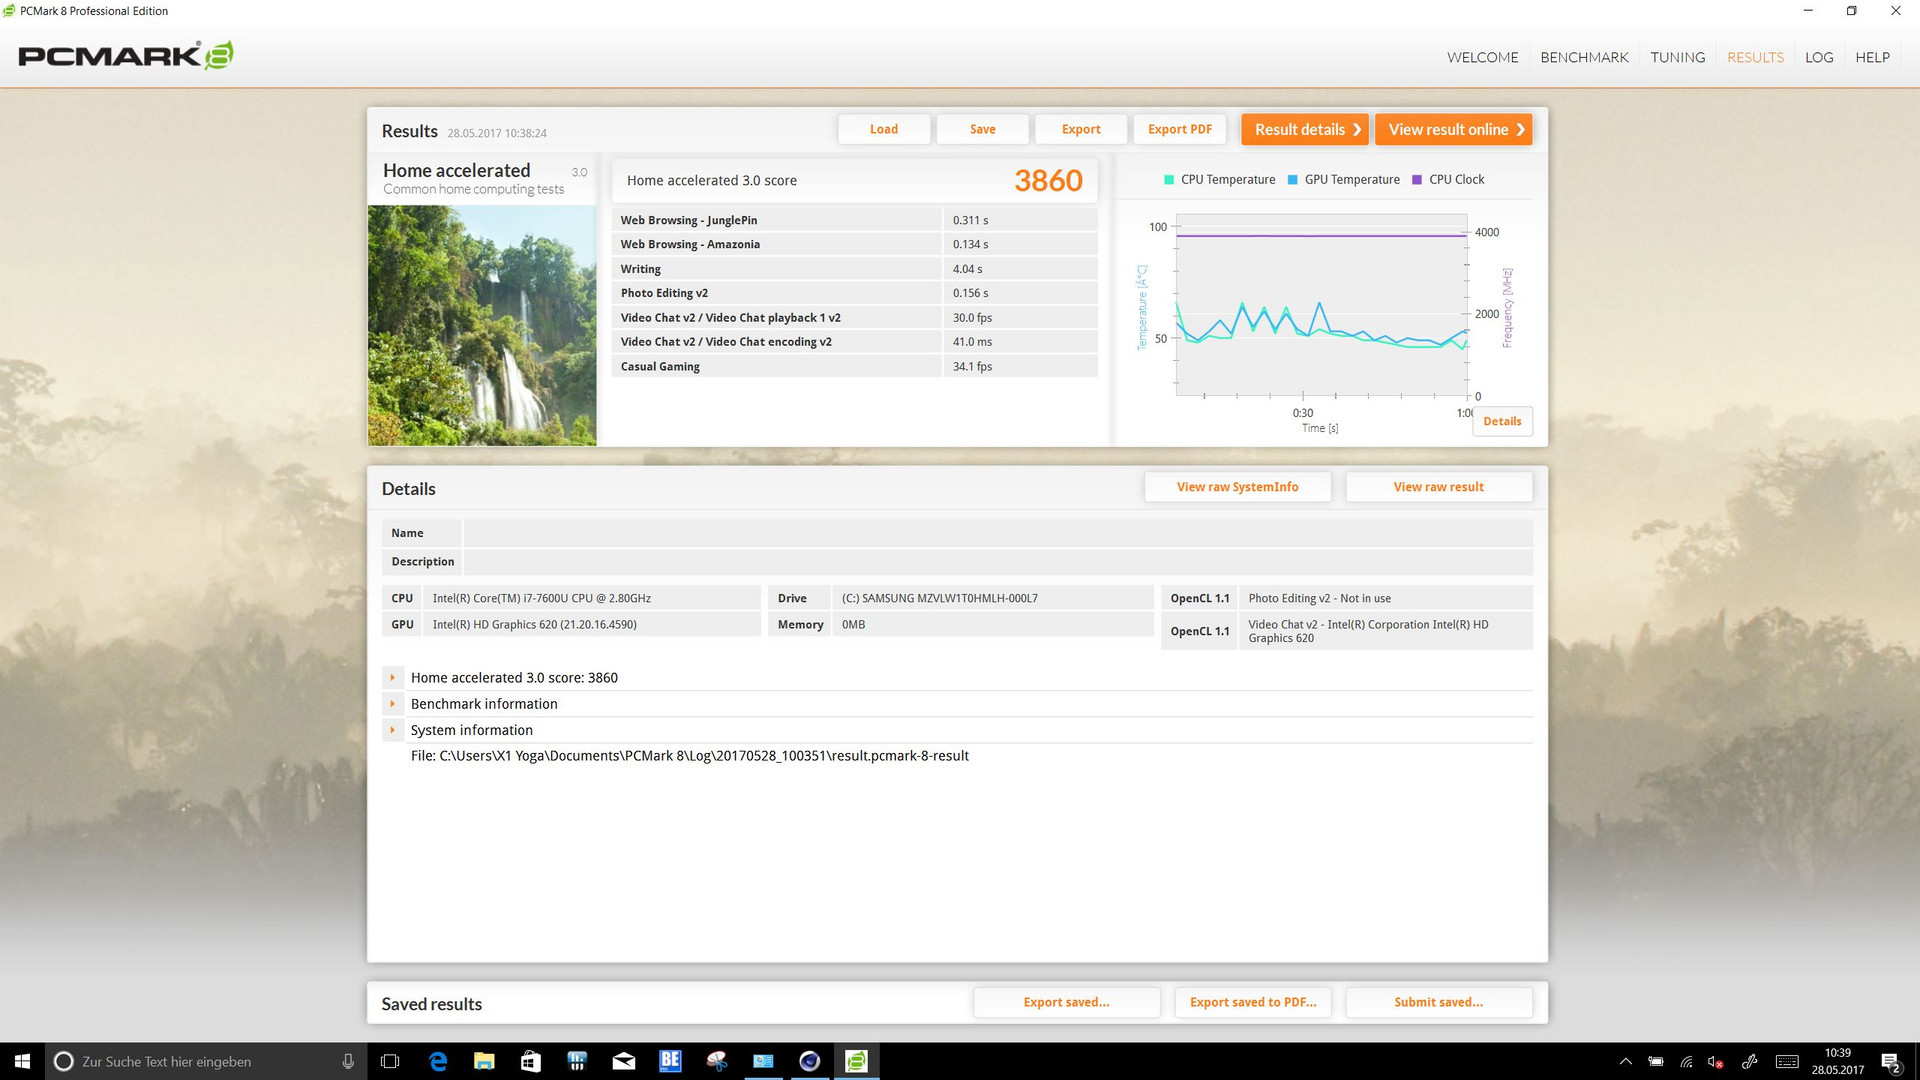
| PCMark 8 | |
| Home Score Accelerated v2 | |
| Dell Latitude 12 5285 2-in-1 | |
| Lenovo ThinkPad X1 Yoga 2017 20JES03T00 | |
| HP EliteBook x360 1030 G2 | |
| Toshiba Portege X20W-D-10R | |
| Lenovo ThinkPad X1 Yoga-20FRS1VS00 | |
| Microsoft Surface Book with Performance Base | |
| Work Score Accelerated v2 | |
| Lenovo ThinkPad X1 Yoga 2017 20JES03T00 | |
| HP EliteBook x360 1030 G2 | |
| Toshiba Portege X20W-D-10R | |
| Lenovo ThinkPad X1 Yoga-20FRS1VS00 | |
| Microsoft Surface Book with Performance Base | |
| Dell Latitude 12 5285 2-in-1 | |
| Creative Score Accelerated v2 | |
| Lenovo ThinkPad X1 Yoga 2017 20JES03T00 | |
| HP EliteBook x360 1030 G2 | |
| Dell Latitude 12 5285 2-in-1 | |
| Microsoft Surface Book with Performance Base | |
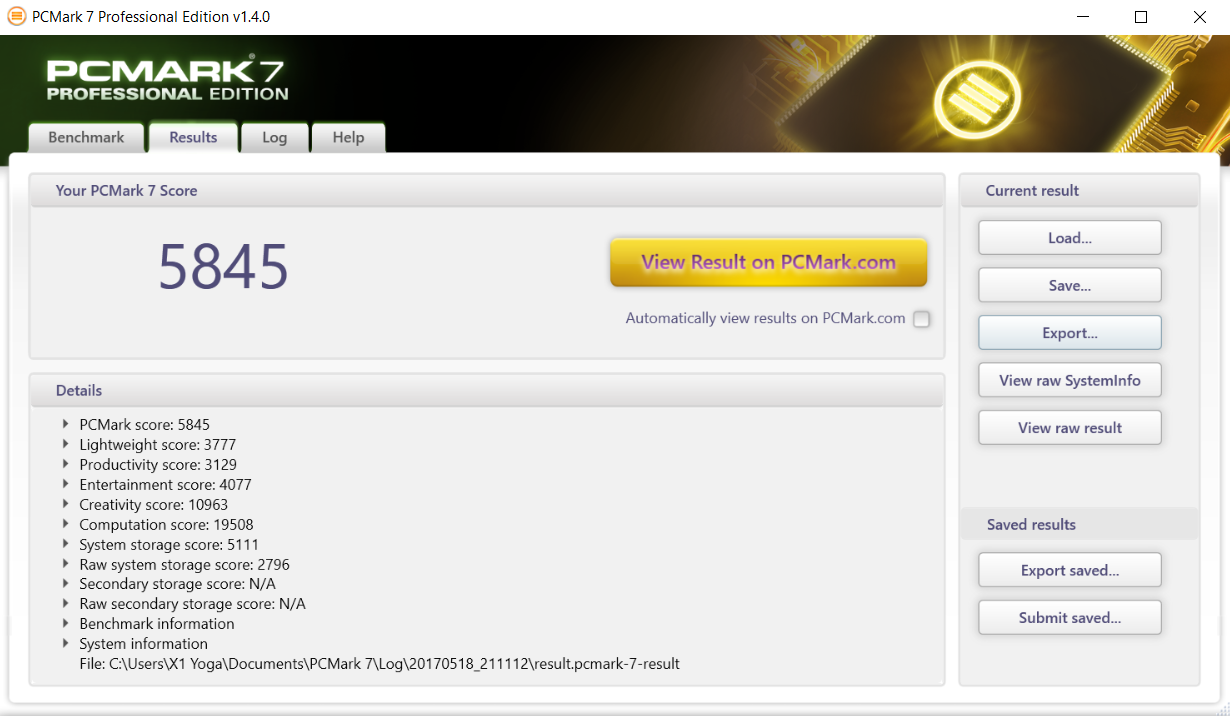
| PCMark 7 Score | 5845 pontok | |
| PCMark 8 Home Score Accelerated v2 | 3860 pontok | |
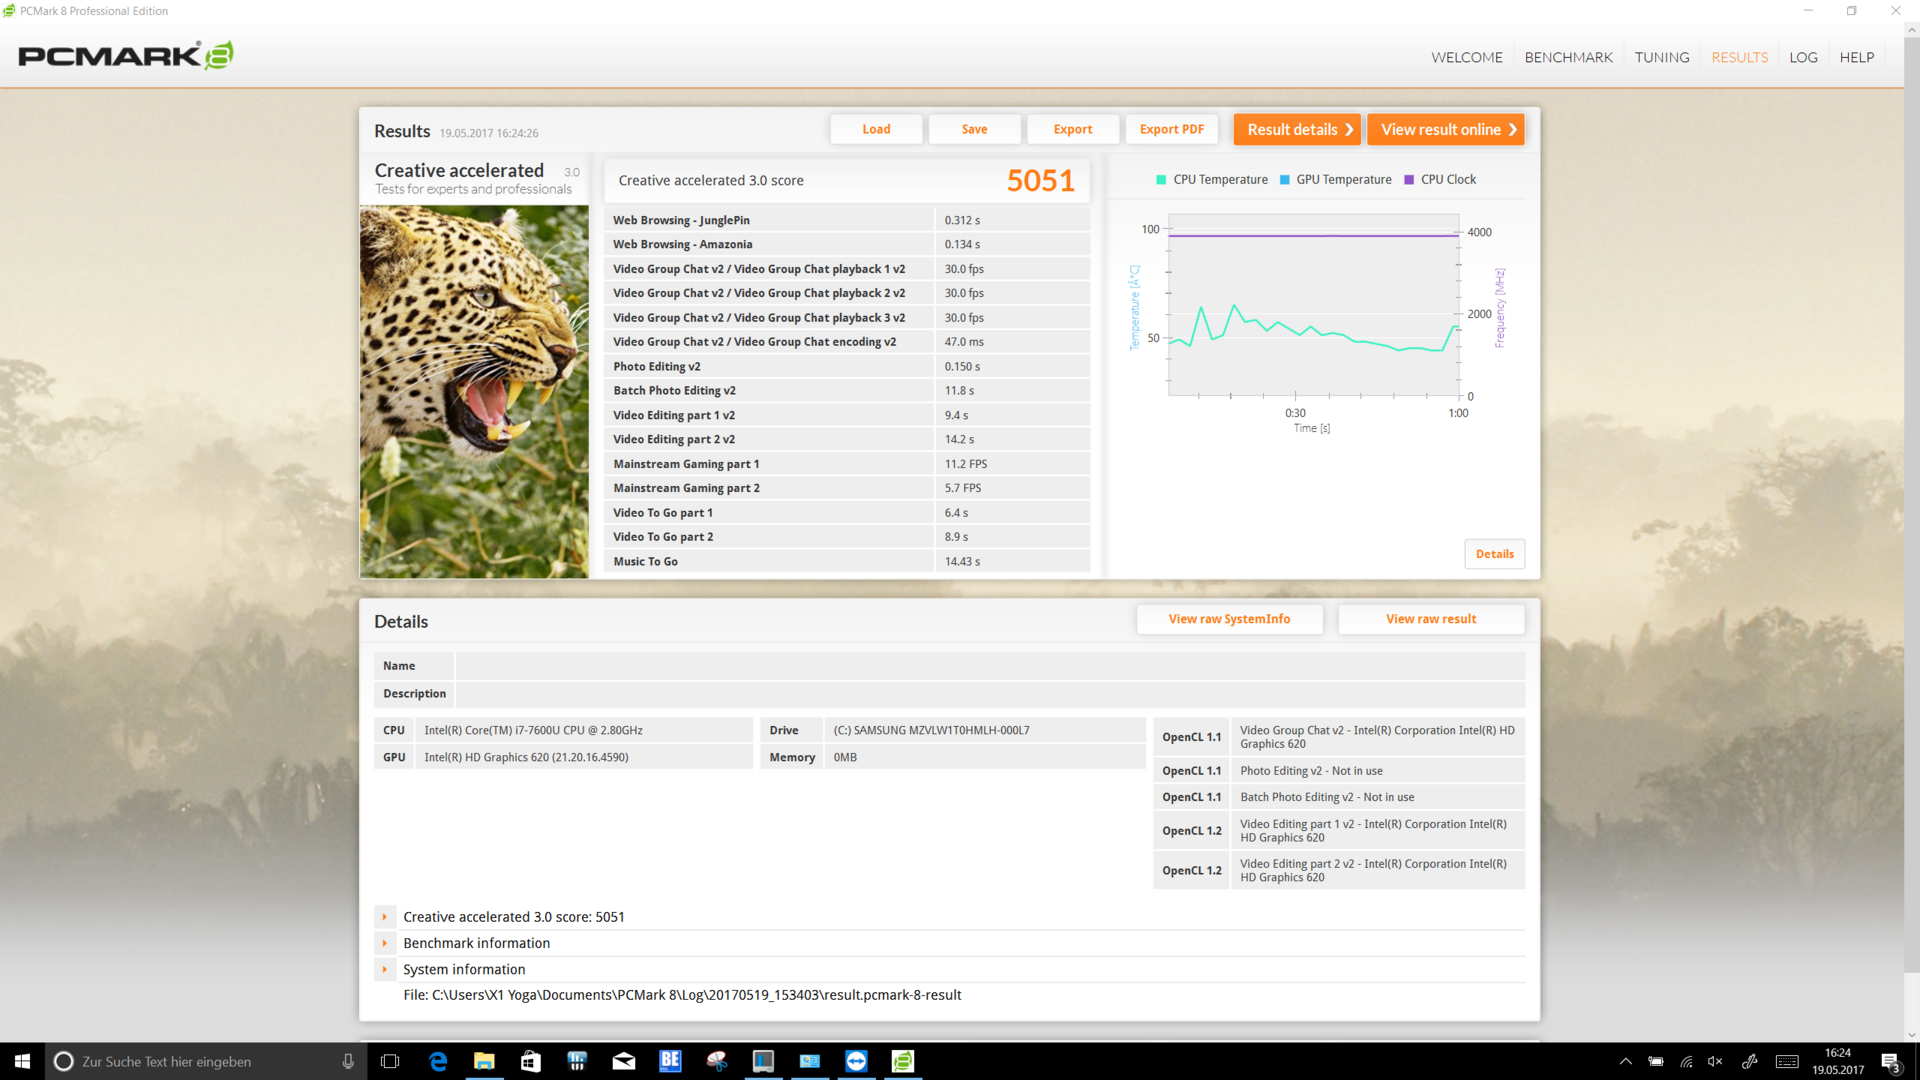
| PCMark 8 Creative Score Accelerated v2 | 5051 pontok | |
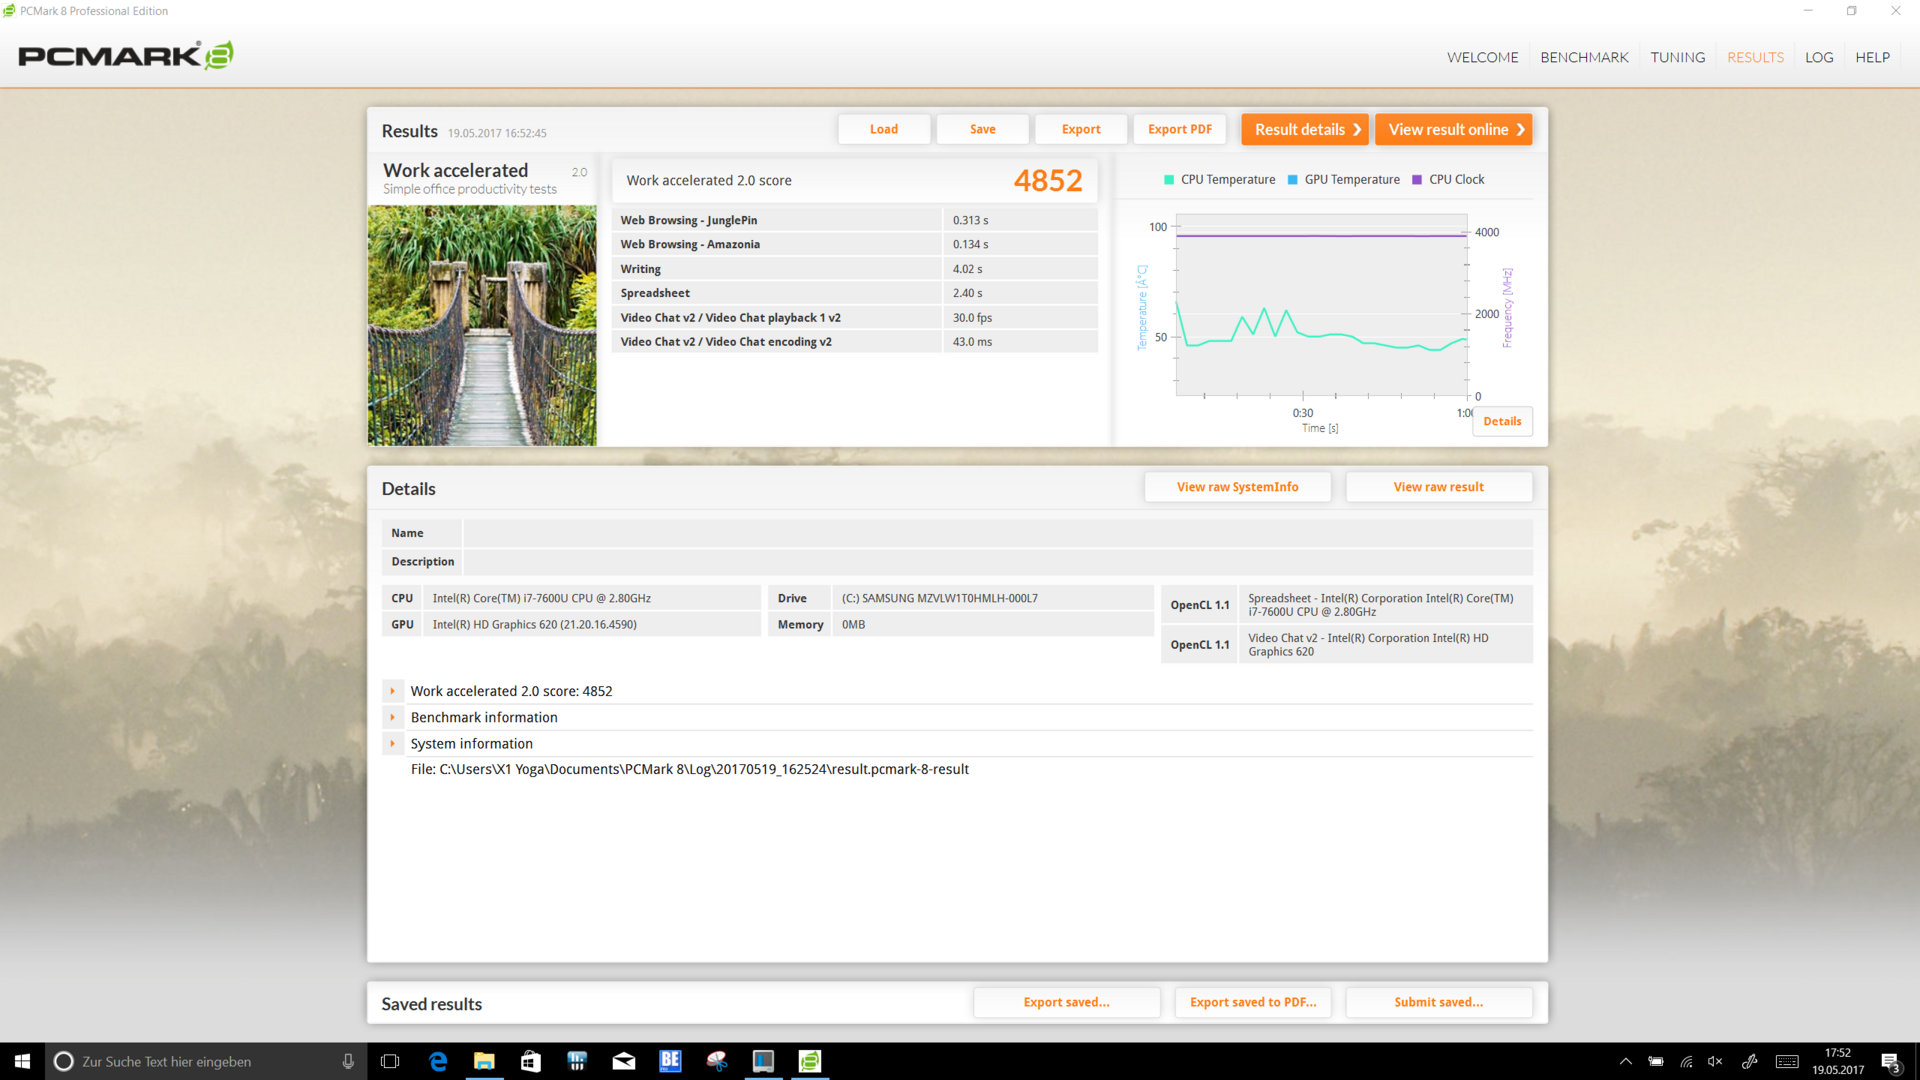
| PCMark 8 Work Score Accelerated v2 | 4852 pontok | |
Segítség | ||
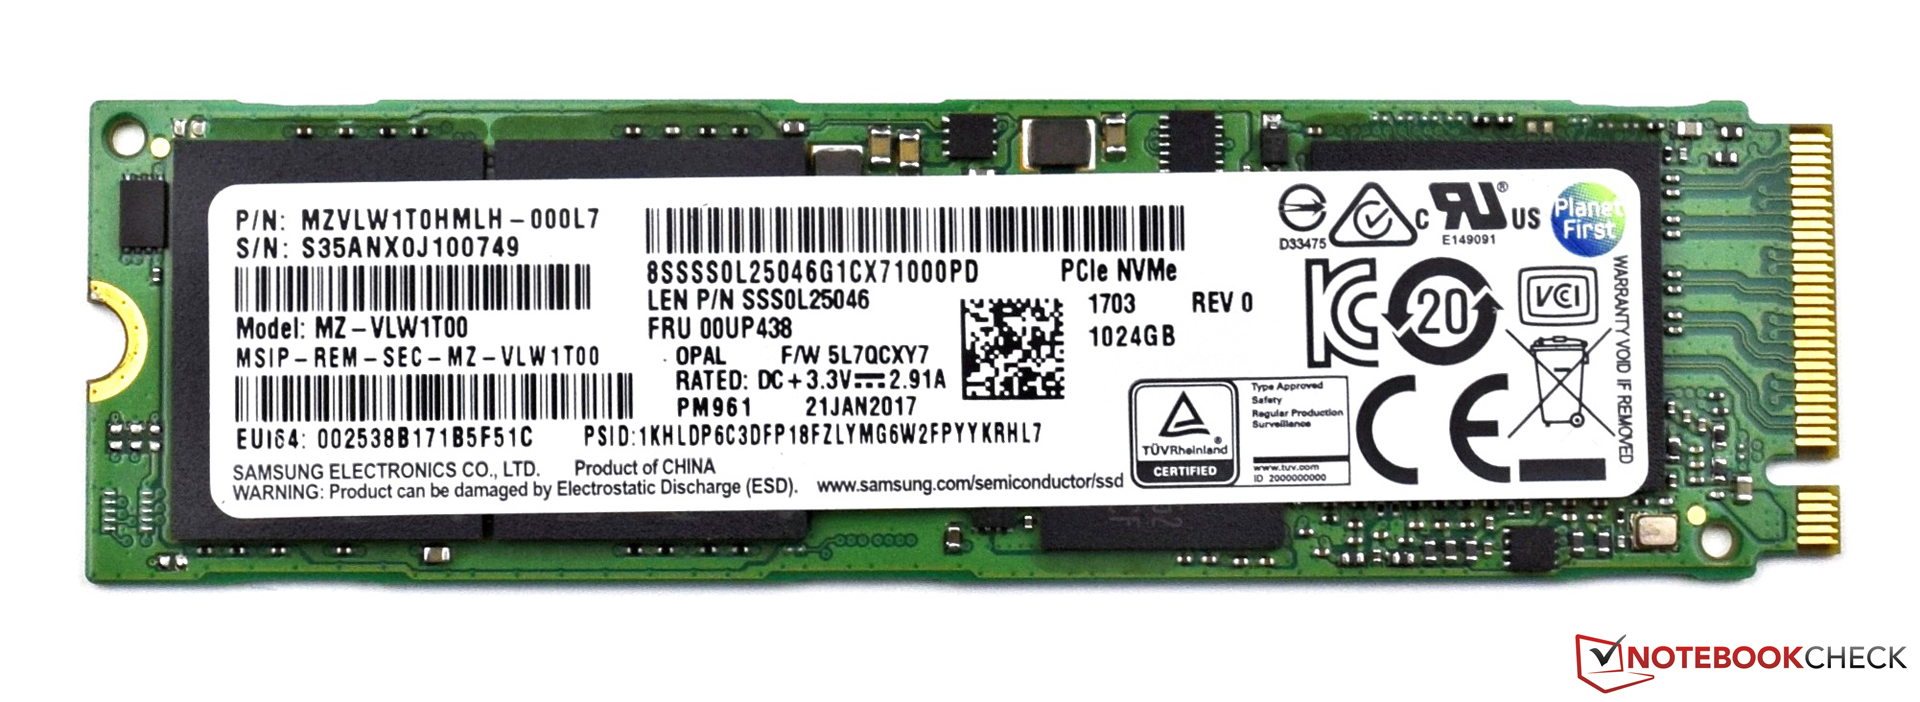
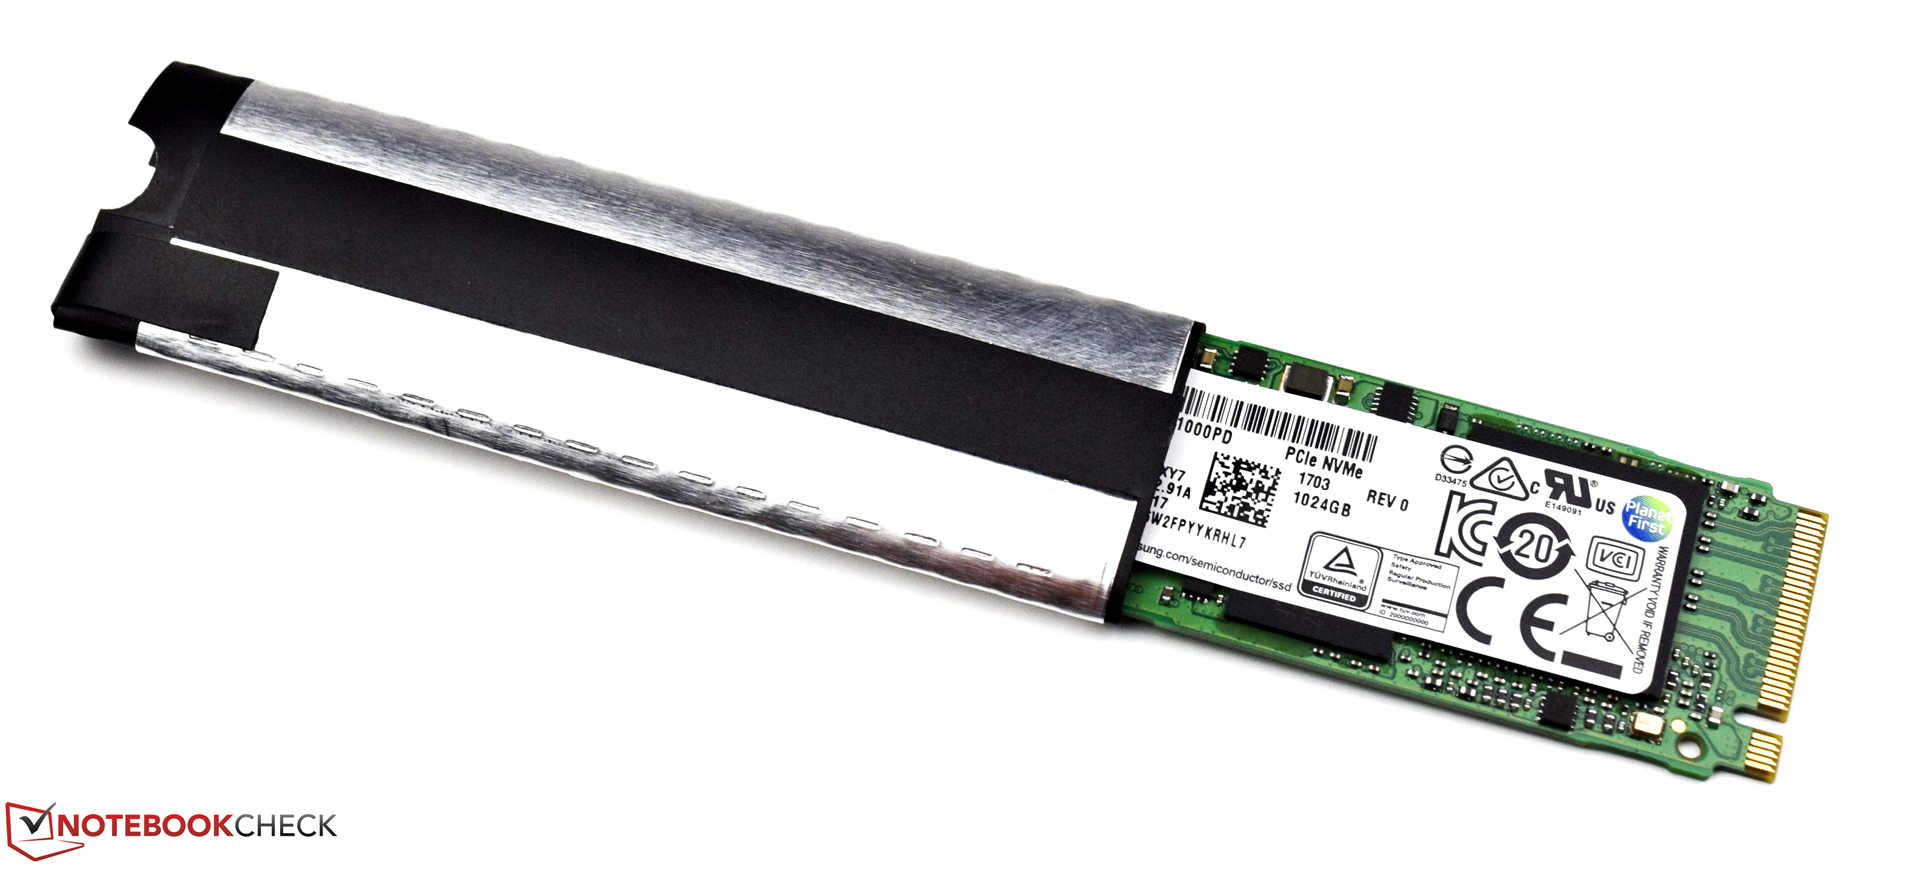
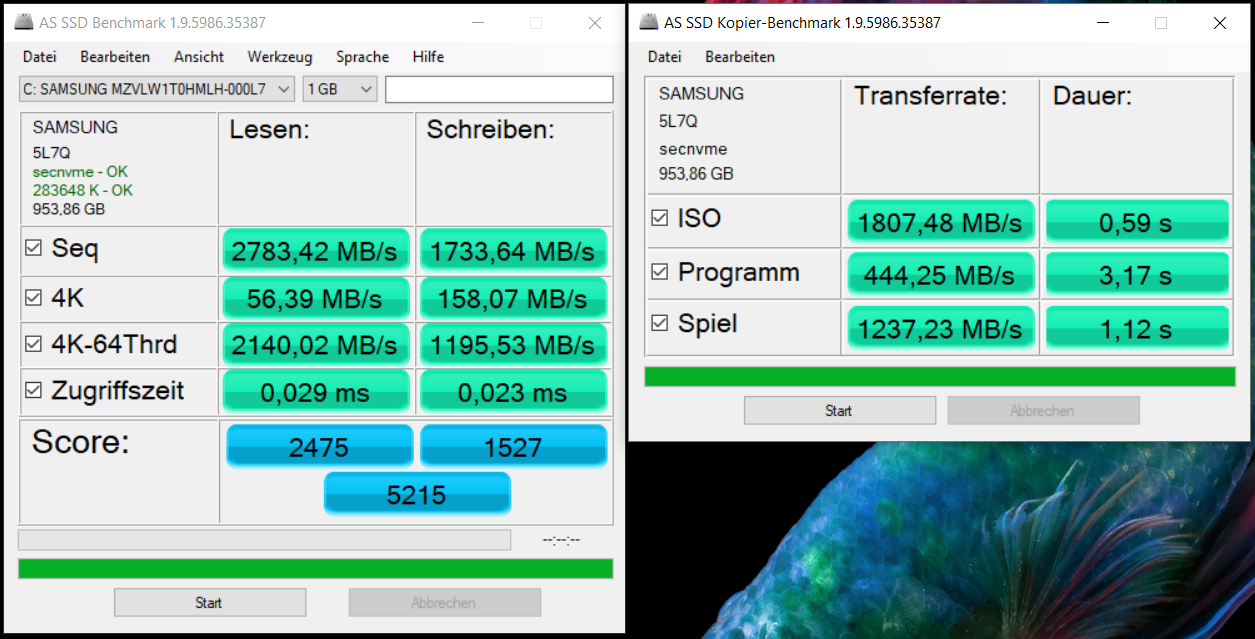
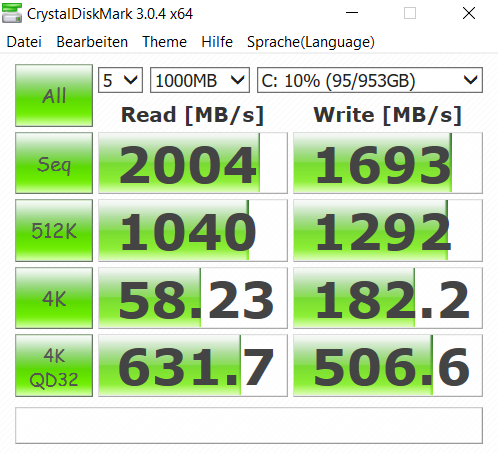
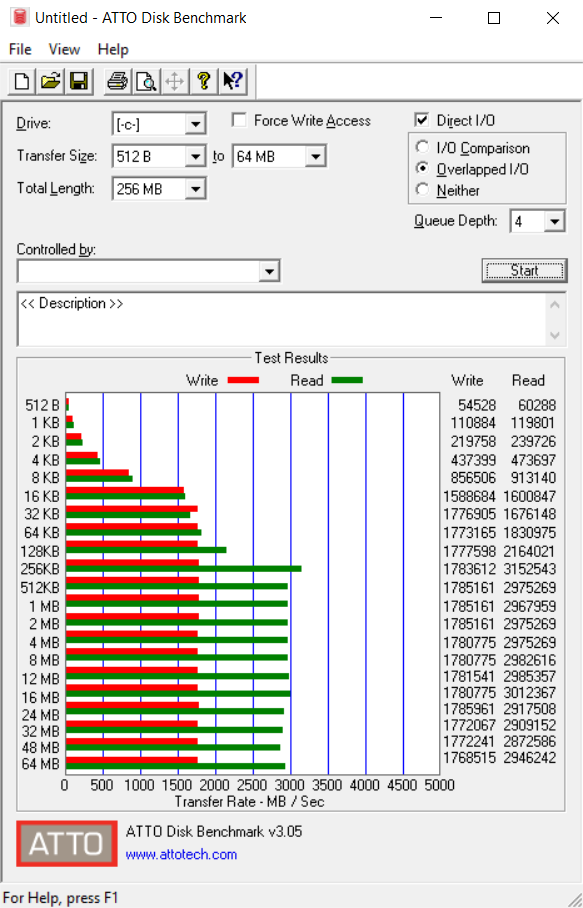
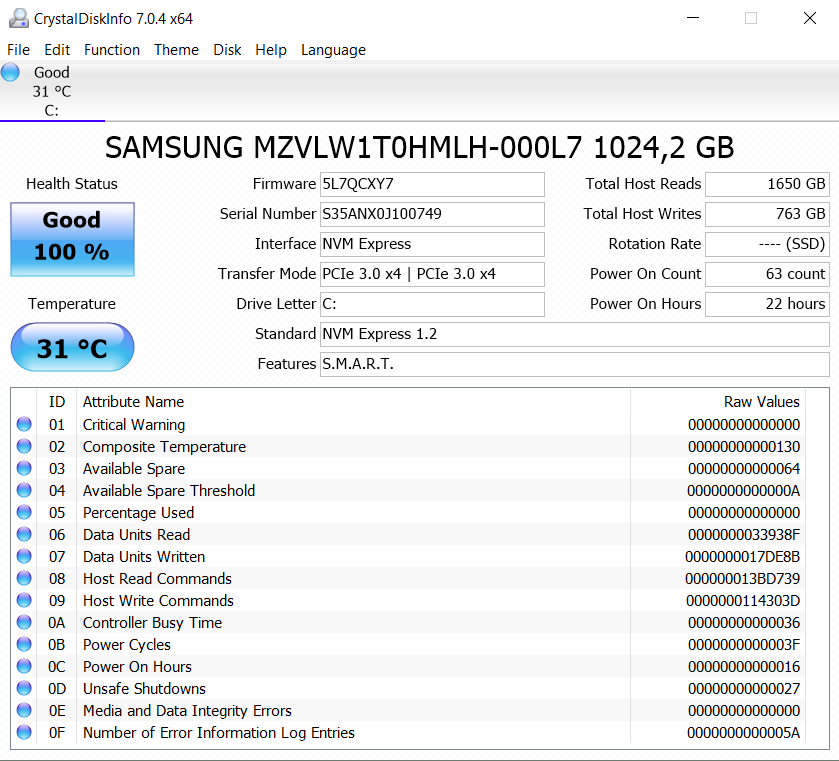
| Lenovo ThinkPad X1 Yoga 2017 20JES03T00 Samsung SSD PM961 1TB M.2 PCIe 3.0 x4 NVMe (MZVLW1T0) | Lenovo ThinkPad X1 Yoga-20FRS1VS00 Samsung SSD PM961 1TB M.2 PCIe 3.0 x4 NVMe (MZSLW1T0) | HP EliteBook x360 1030 G2 Sandisk SD8TN8U-256G-1006 | Toshiba Portege X20W-D-10R Toshiba SG5 THNSNK512GVN8 | Dell Latitude 12 5285 2-in-1 Samsung PM961 MZVLW256HEHP | Microsoft Surface Book with Performance Base Toshiba NVMe THNSN5256GPU7 | Apple MacBook 12 (Early 2016) 1.1 GHz Apple SSD AP0256 | |
|---|---|---|---|---|---|---|---|
| CrystalDiskMark 3.0 | -33% | -65% | -65% | -43% | -41% | -55% | |
| Read Seq (MB/s) | 2004 | 1510 -25% | 467.1 -77% | 469 -77% | 1294 -35% | 1017 -49% | 754 -62% |
| Write Seq (MB/s) | 1693 | 1193 -30% | 443.6 -74% | 277.3 -84% | 865 -49% | 861 -49% | 638 -62% |
| Read 512 (MB/s) | 1040 | 312.3 -70% | 404.4 -61% | 406 -61% | 687 -34% | 616 -41% | |
| Write 512 (MB/s) | 1292 | 372.5 -71% | 266.6 -79% | 589 -54% | 698 -46% | 678 -48% | |
| Read 4k (MB/s) | 58.2 | 37 -36% | 29.43 -49% | 25.24 -57% | 31.75 -45% | 40.91 -30% | 14.6 -75% |
| Write 4k (MB/s) | 182.2 | 126 -31% | 56.5 -69% | 89.4 -51% | 72.2 -60% | 108.6 -40% | 20.5 -89% |
| Read 4k QD32 (MB/s) | 632 | 404 -36% | 311.3 -51% | 322.5 -49% | 493.3 -22% | 326.9 -48% | 464 -27% |
| Write 4k QD32 (MB/s) | 507 | 319 -37% | 225.2 -56% | 208.1 -59% | 434.5 -14% | 347.1 -32% | 315 -38% |

| 3DMark | |
| 1280x720 Cloud Gate Standard Graphics | |
| Microsoft Surface Book with Performance Base | |
| Dell Latitude 12 5285 2-in-1 | |
| HP EliteBook x360 1030 G2 | |
| Lenovo ThinkPad X1 Yoga 2017 20JES03T00 | |
| Lenovo ThinkPad X1 Yoga-20FRS1VS00 | |
| Toshiba Portege X20W-D-10R | |
| 1920x1080 Fire Strike Graphics | |
| Microsoft Surface Book with Performance Base | |
| Dell Latitude 12 5285 2-in-1 | |
| Lenovo ThinkPad X1 Yoga 2017 20JES03T00 | |
| HP EliteBook x360 1030 G2 | |
| Lenovo ThinkPad X1 Yoga-20FRS1VS00 | |
| 3DMark 11 - 1280x720 Performance GPU | |
| Microsoft Surface Book with Performance Base | |
| Lenovo ThinkPad X1 Yoga 2017 20JES03T00 | |
| Dell Latitude 12 5285 2-in-1 | |
| Toshiba Portege X20W-D-10R | |
| HP EliteBook x360 1030 G2 | |
| Lenovo ThinkPad X1 Yoga-20FRS1VS00 | |
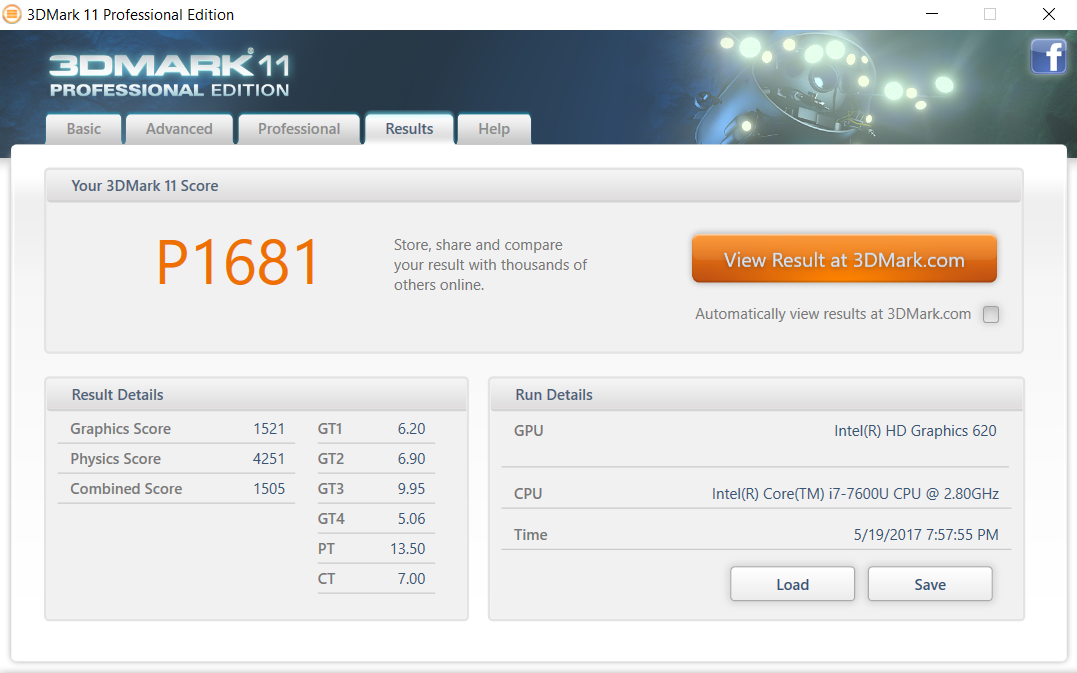
| 3DMark 11 Performance | 1794 pontok | |
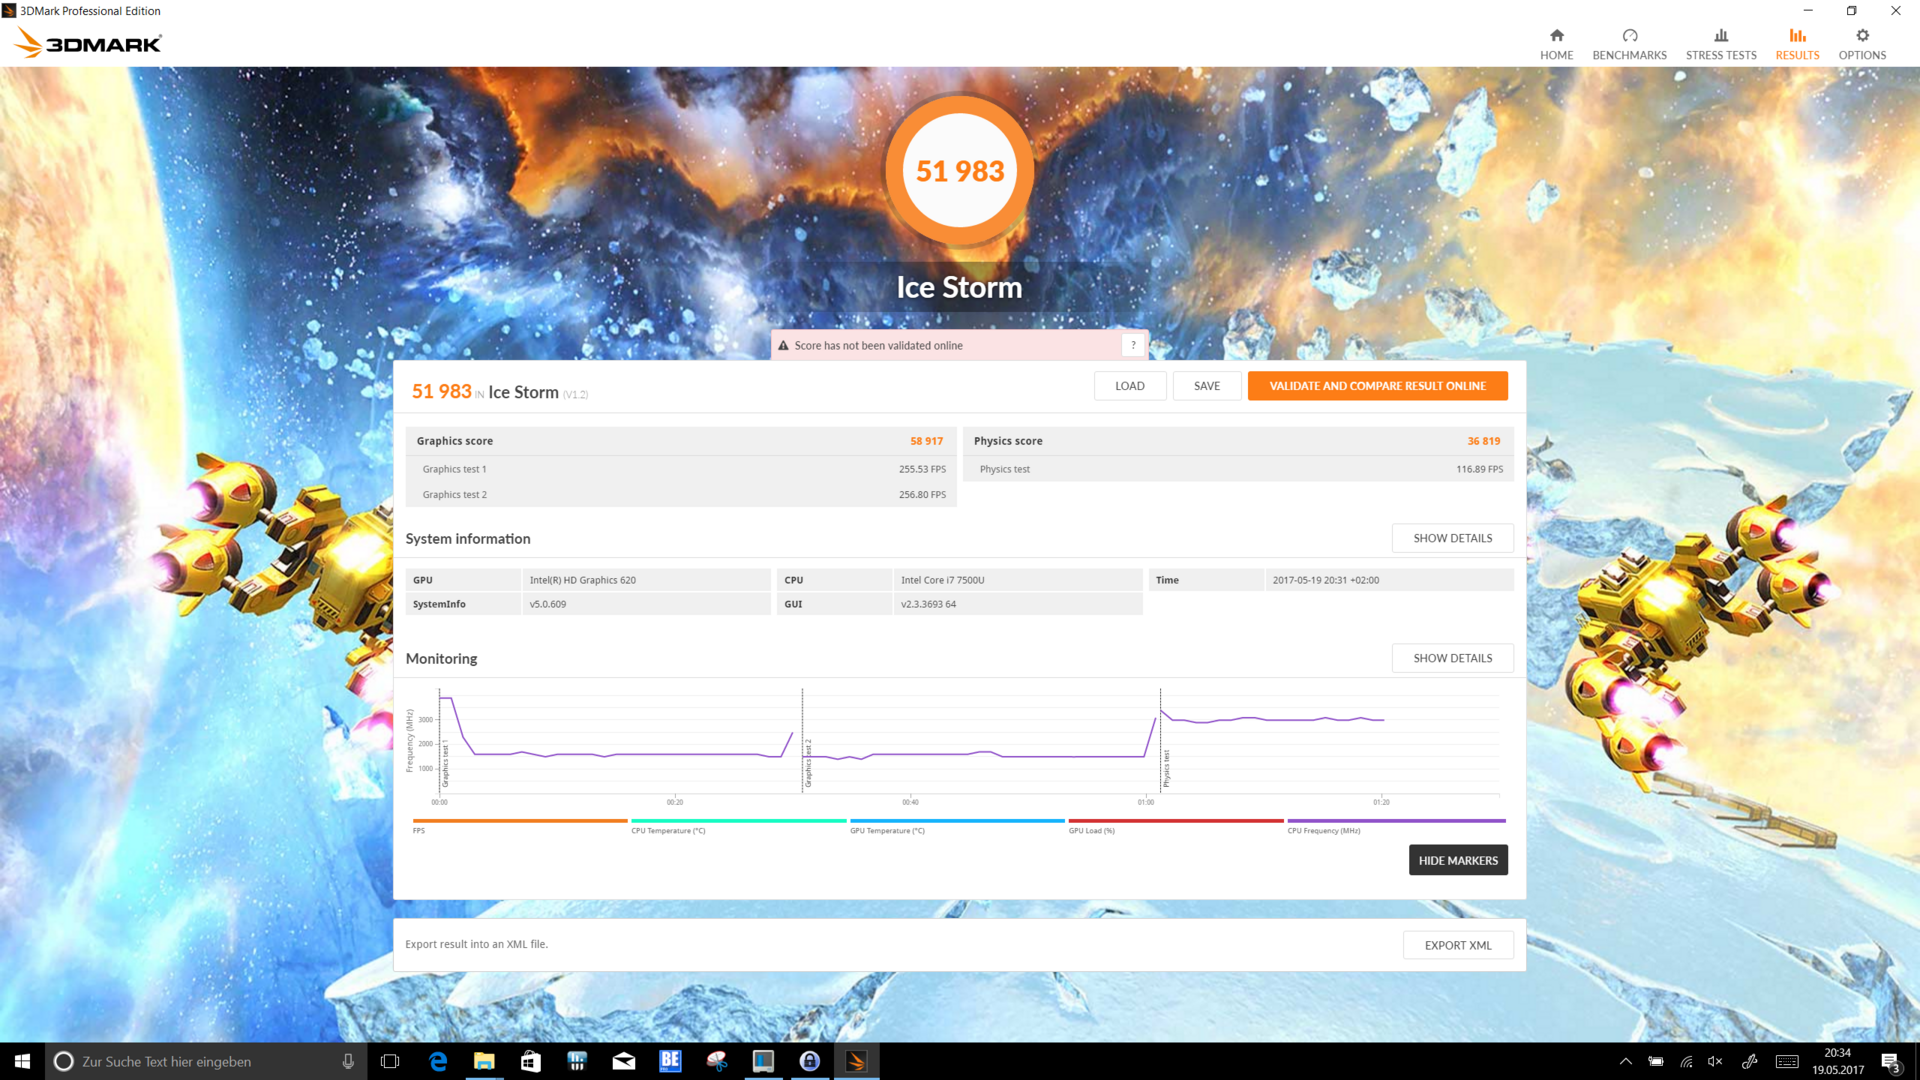
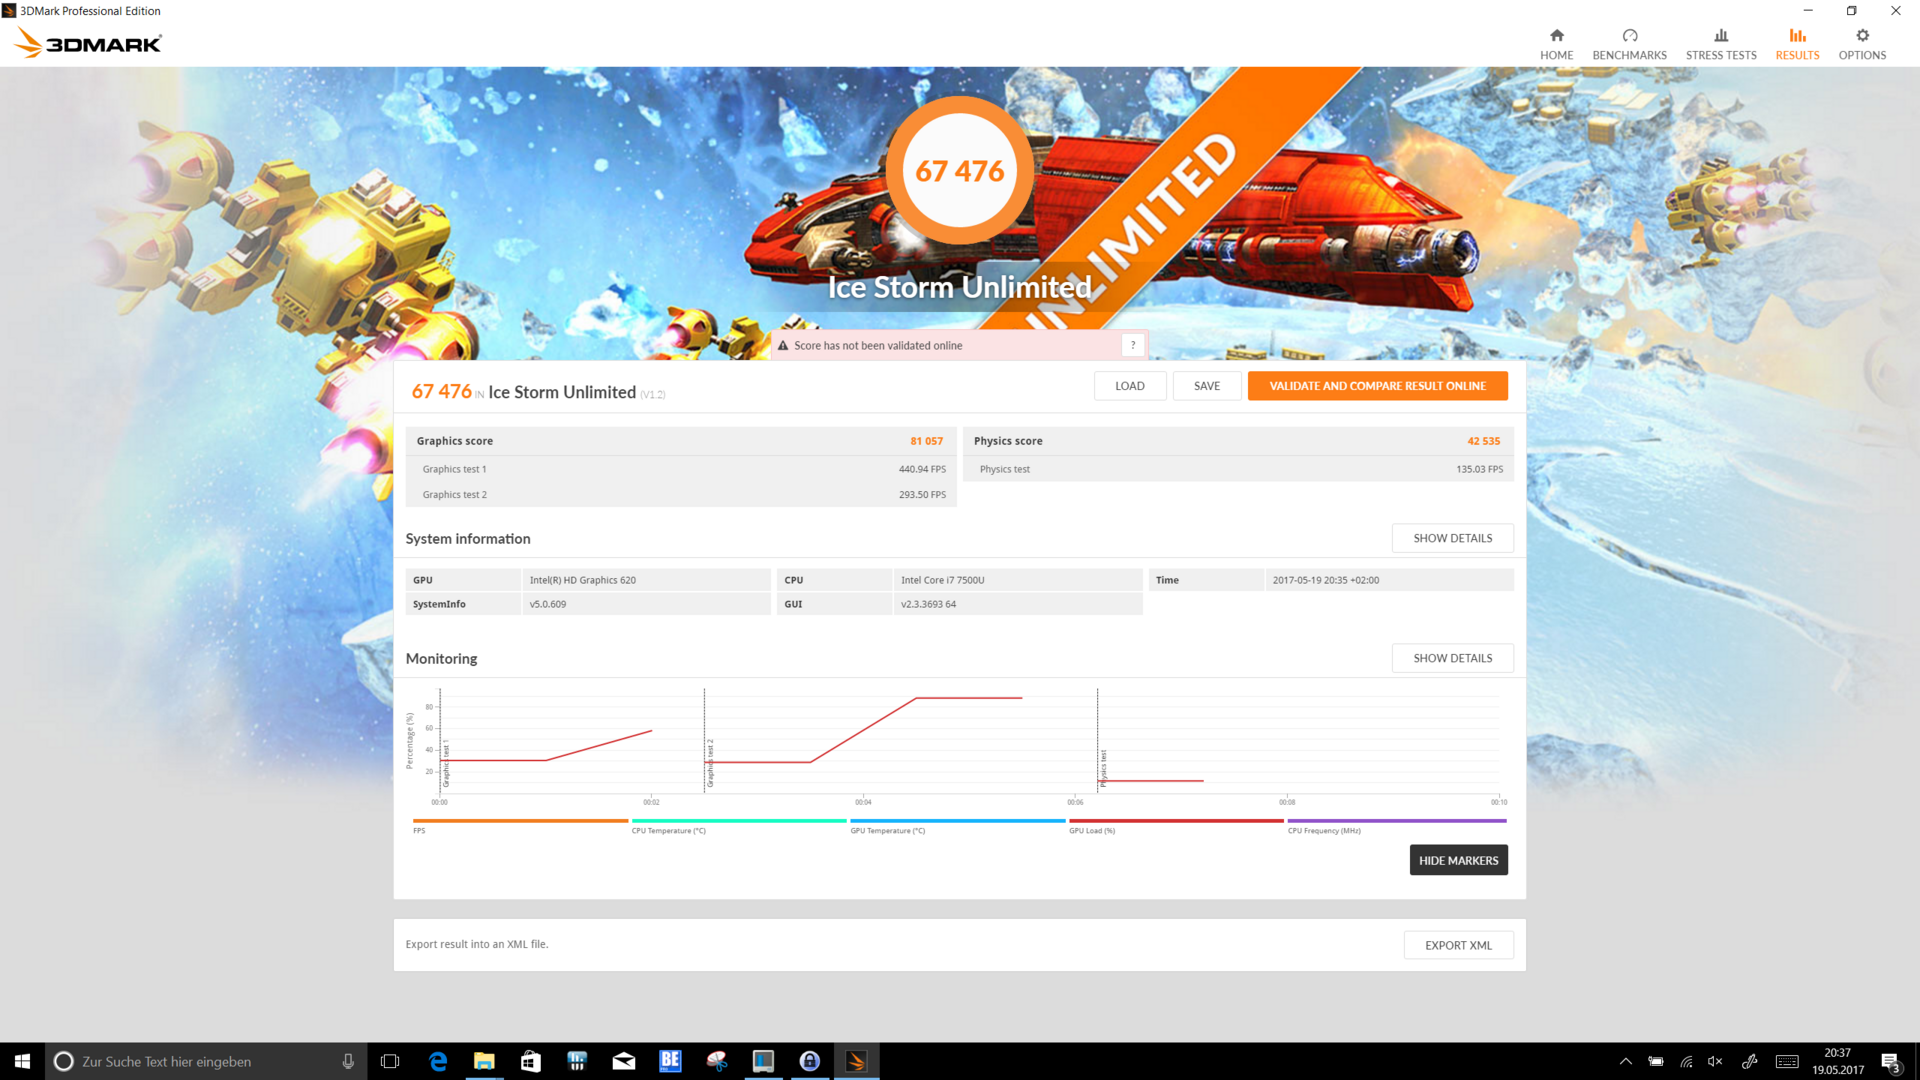
| 3DMark Ice Storm Standard Score | 51983 pontok | |
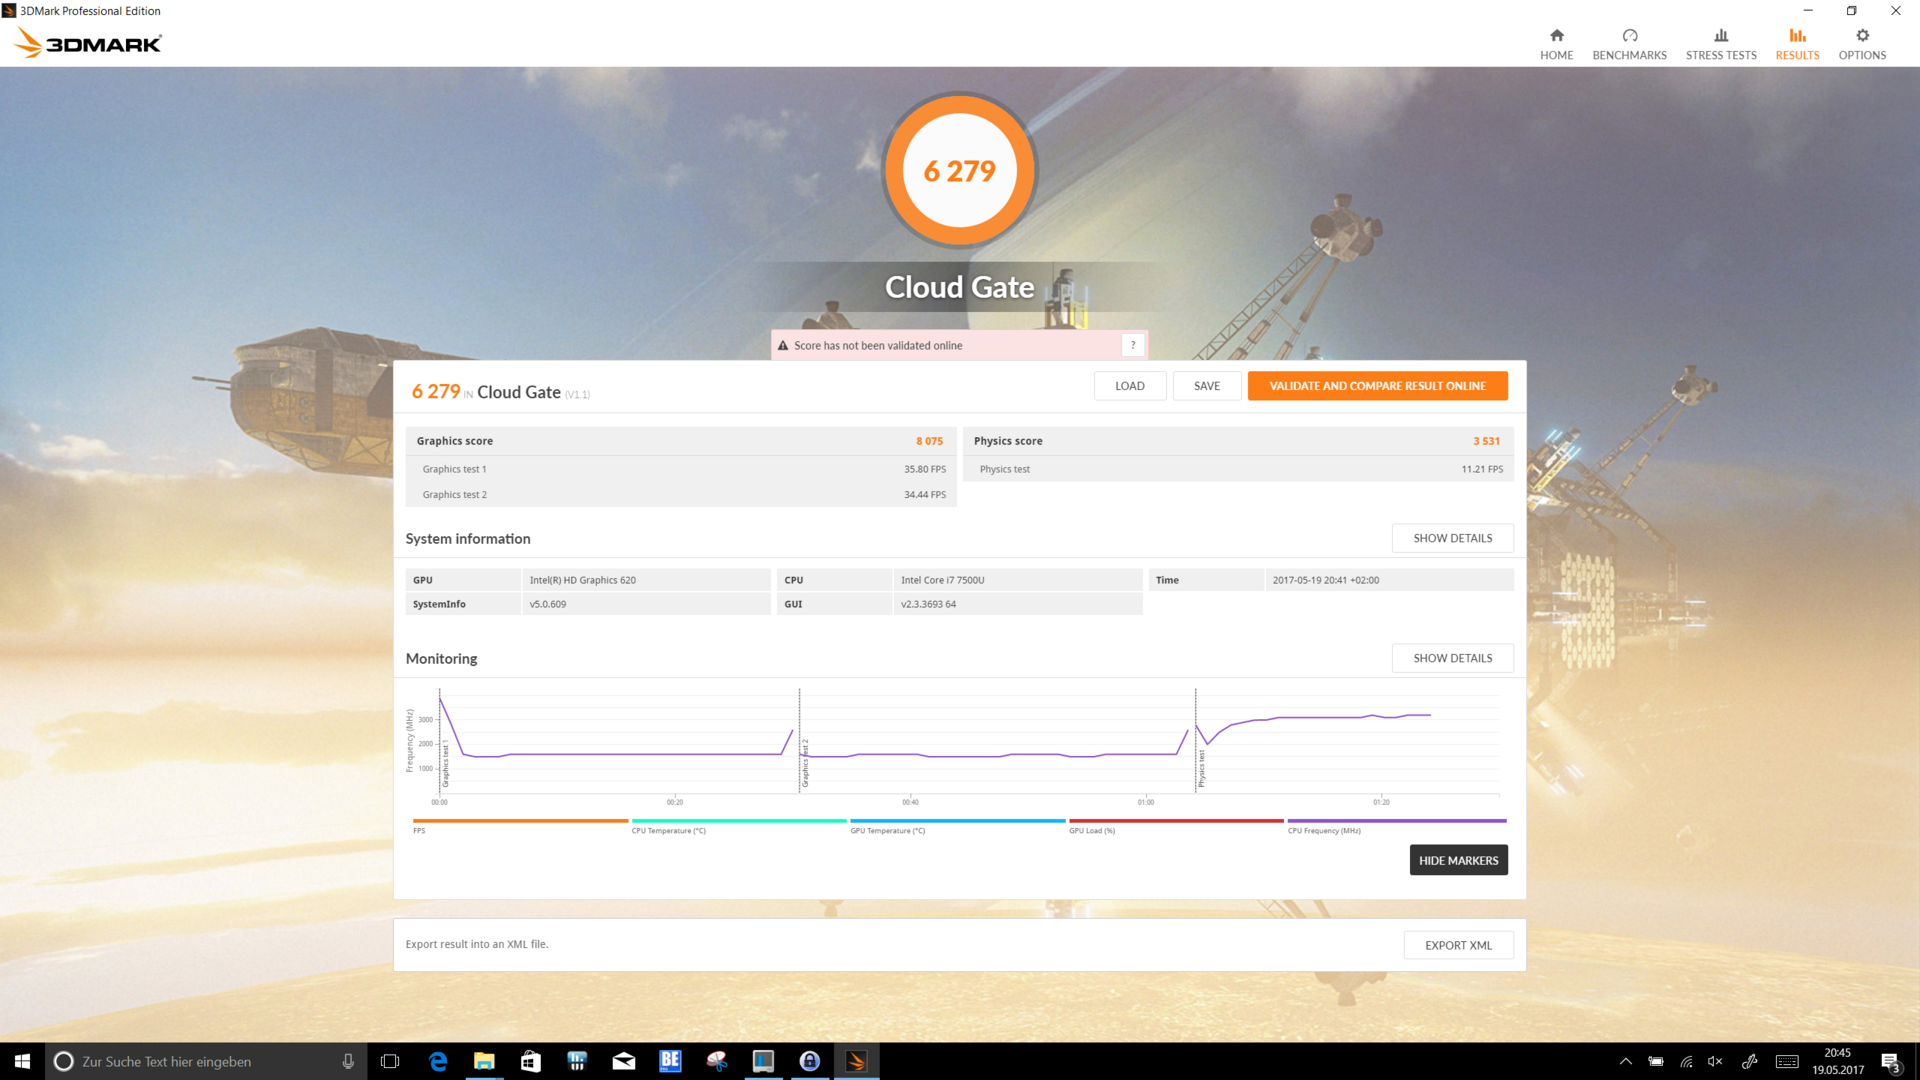
| 3DMark Cloud Gate Standard Score | 6279 pontok | |
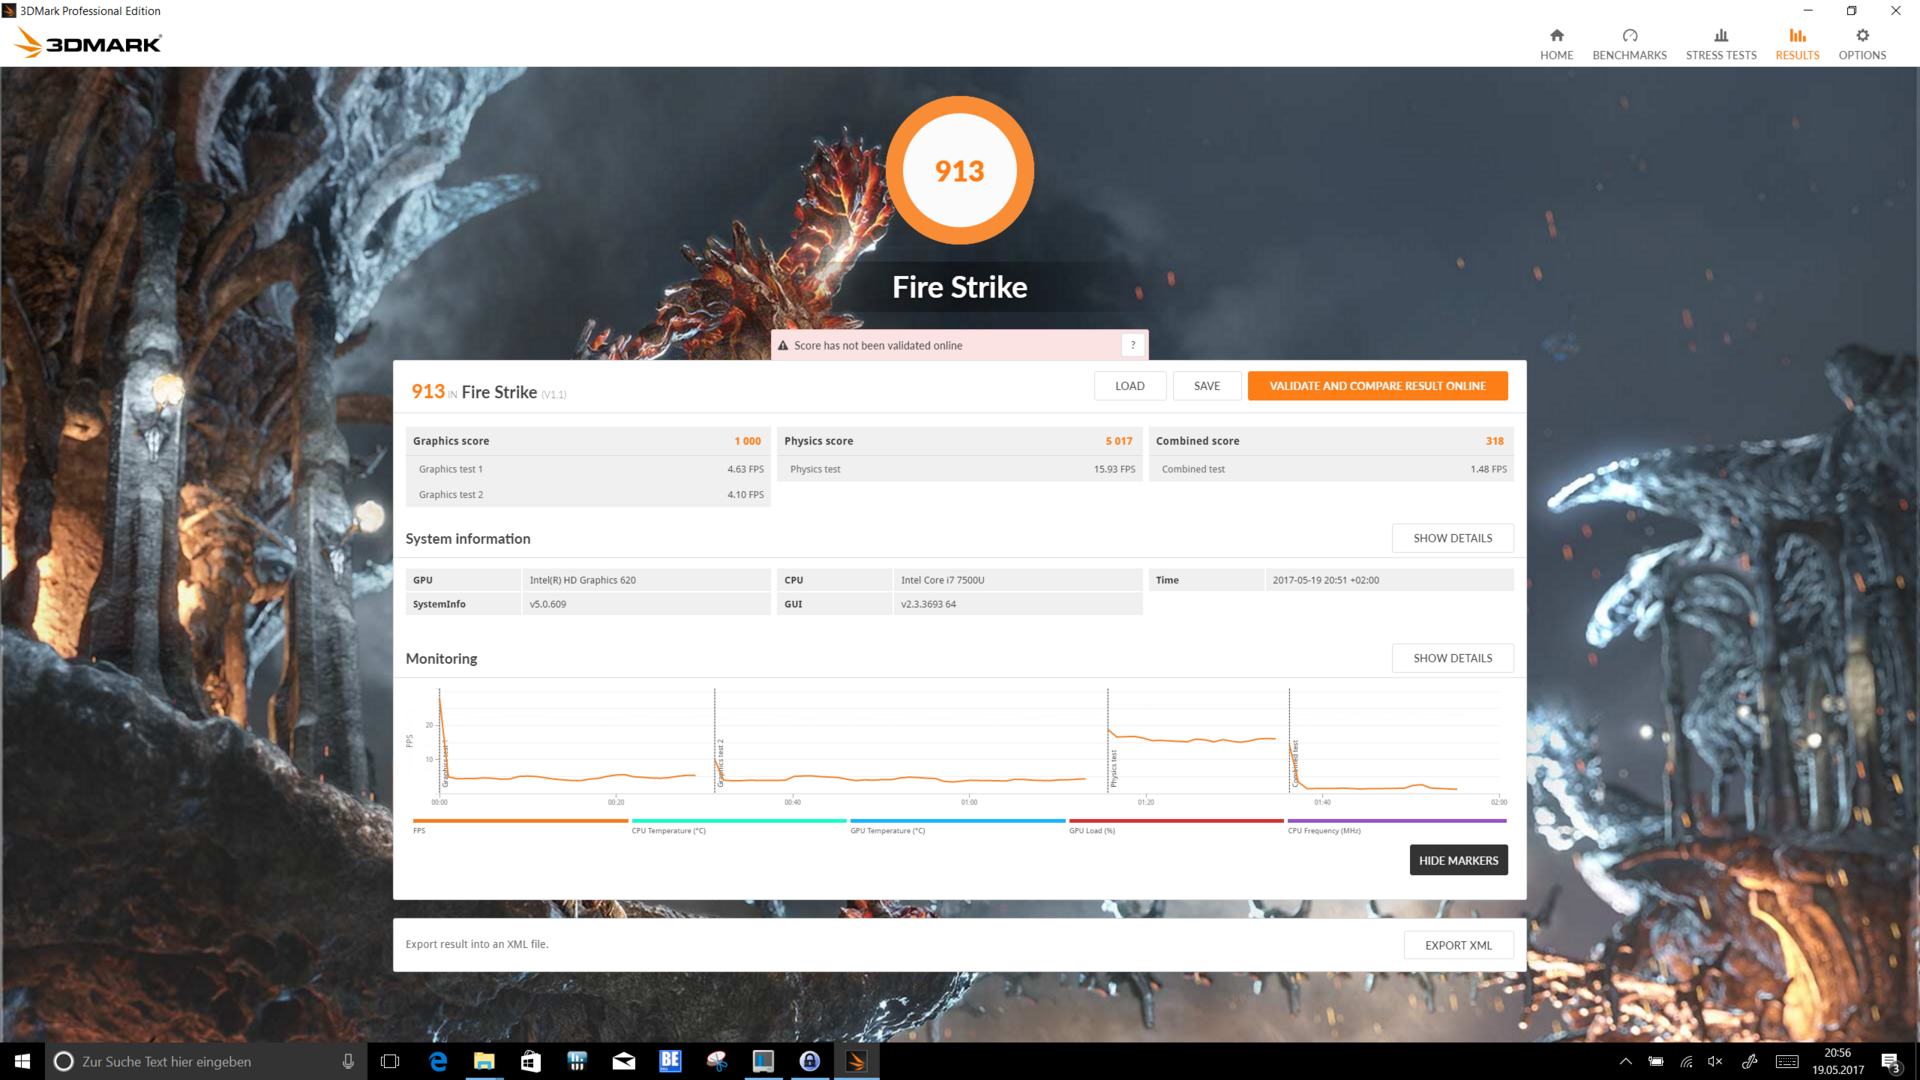
| 3DMark Fire Strike Score | 913 pontok | |
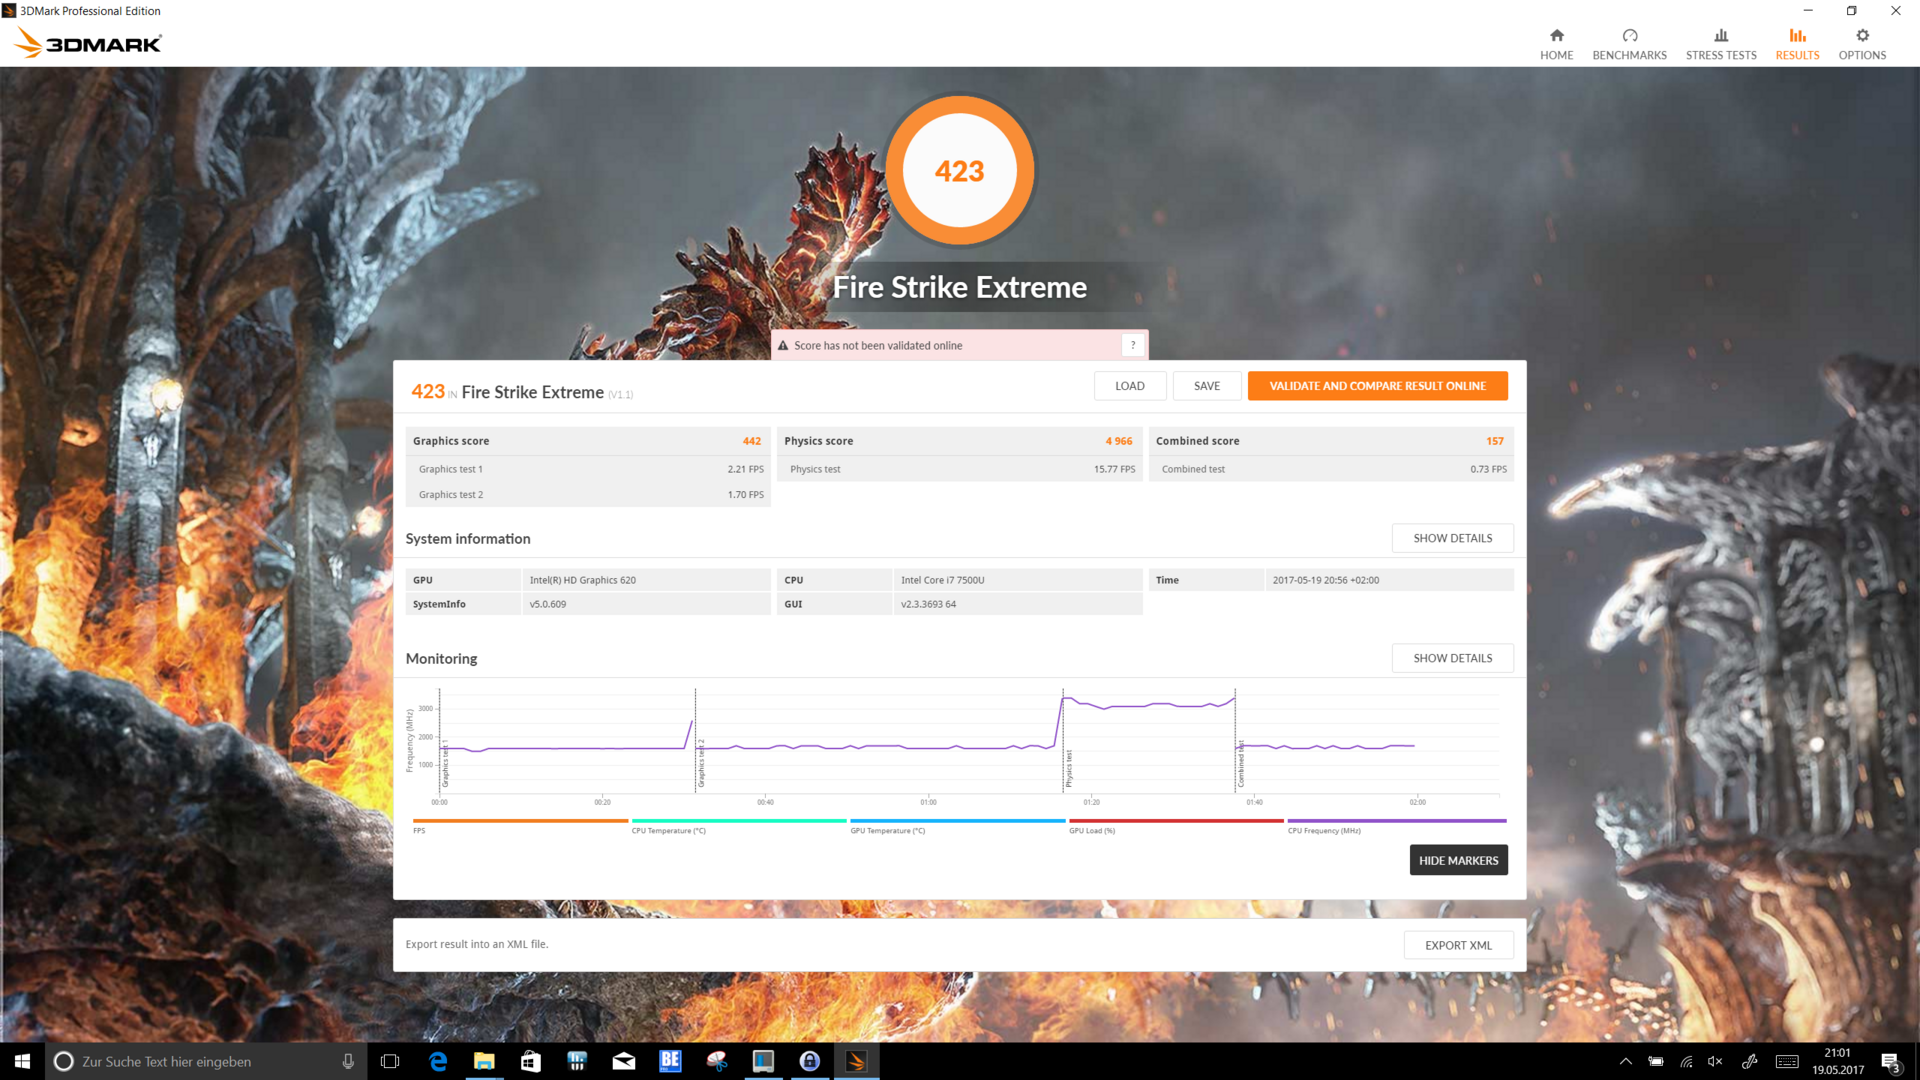
| 3DMark Fire Strike Extreme Score | 423 pontok | |
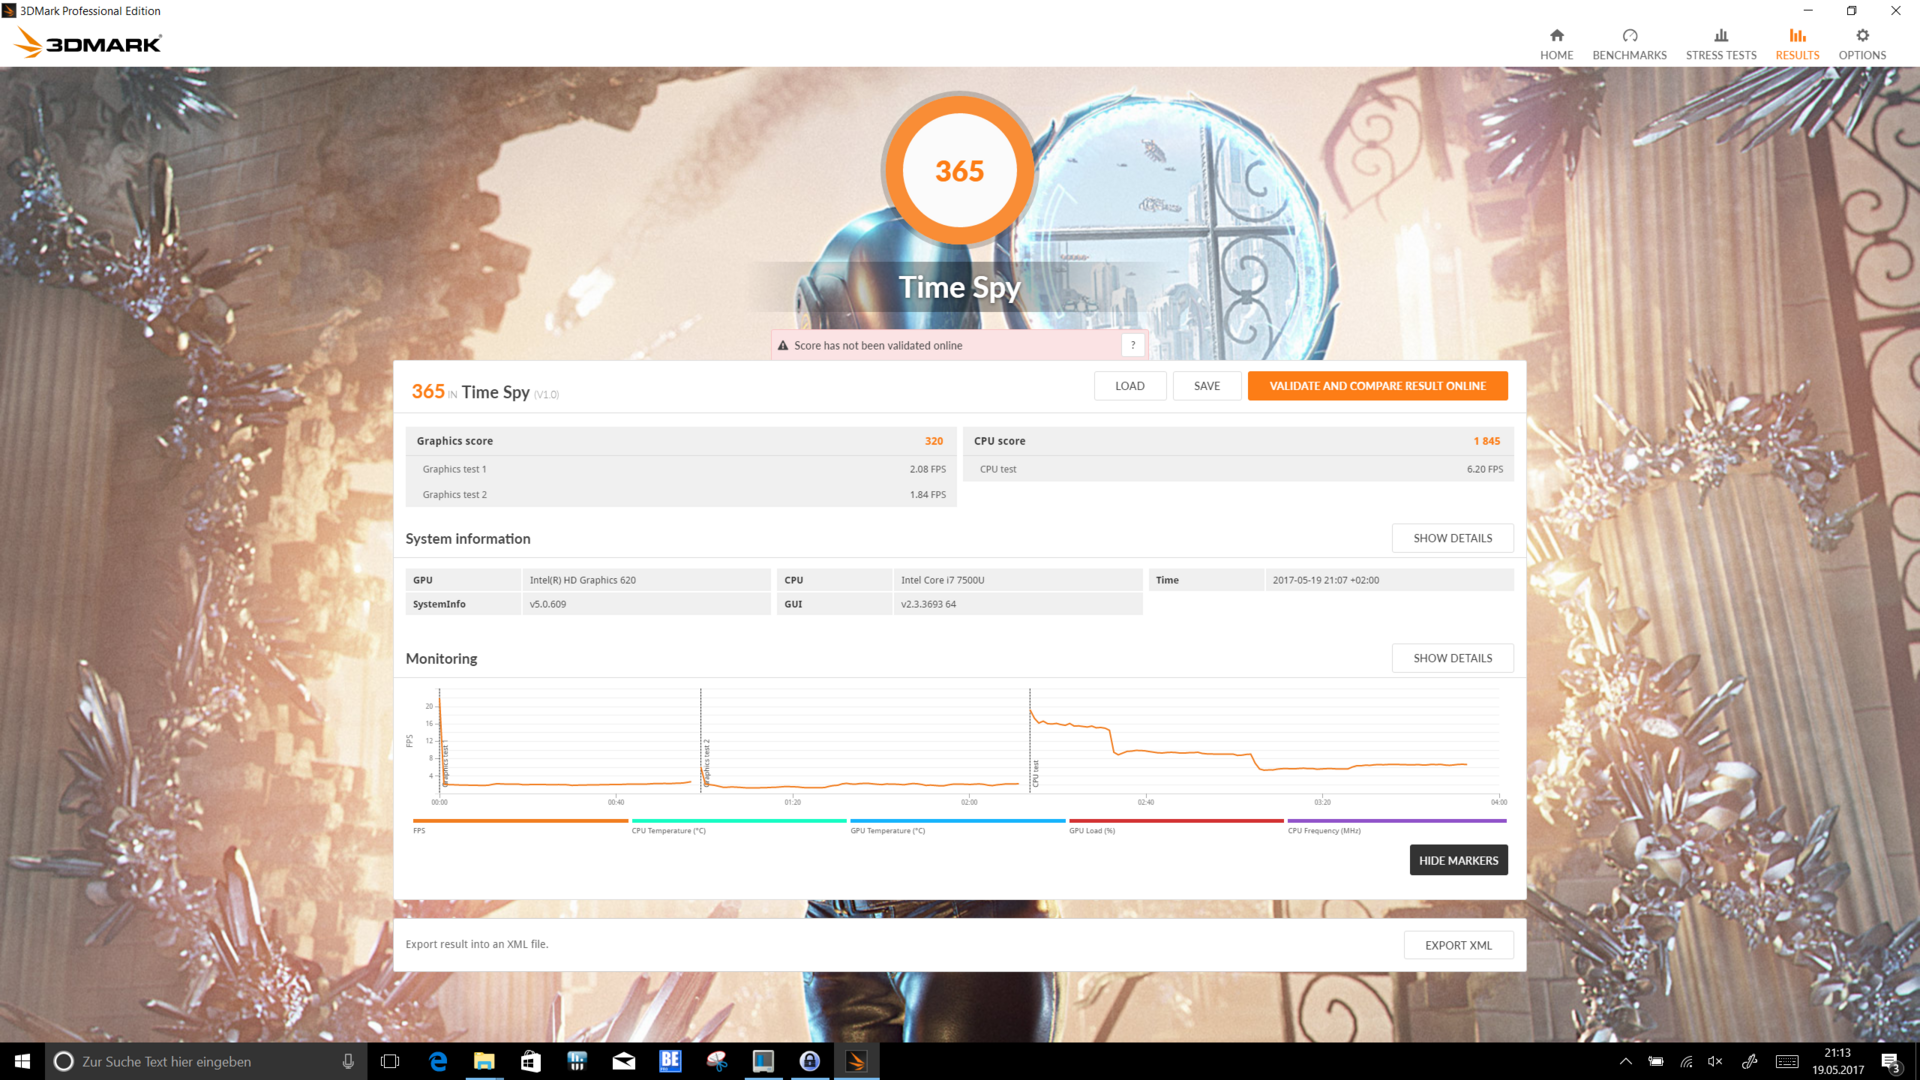
| 3DMark Time Spy Score | 365 pontok | |
Segítség | ||
| alacsony | közepes | magas | ultra | |
|---|---|---|---|---|
| BioShock Infinite (2013) | 54.7 | 31 | 26.3 | 8.2 |
| Battlefield 4 (2013) | 35.3 | 29.1 | 20.1 | 6.3 |
| Rise of the Tomb Raider (2016) | 17.8 | 11.6 | 6.4 |
Zajszint
| Üresjárat |
| 29.3 / 31.1 / 33.3 dB(A) |
| Terhelés |
| 33.3 / 38.9 dB(A) |
 | ||
30 dB csendes 40 dB(A) hallható 50 dB(A) hangos |
||
min: | ||
| Lenovo ThinkPad X1 Yoga 2017 20JES03T00 i7-7600U, HD Graphics 620 | Lenovo ThinkPad X1 Yoga-20FRS1VS00 6600U, HD Graphics 520 | HP EliteBook x360 1030 G2 i5-7300U, HD Graphics 620 | Toshiba Portege X20W-D-10R i7-7600U, HD Graphics 620 | Dell Latitude 12 5285 2-in-1 i7-7600U, HD Graphics 620 | Microsoft Surface Book with Performance Base 6600U, GeForce GTX 965M | |
|---|---|---|---|---|---|---|
| Noise | 3% | 5% | 5% | 9% | -1% | |
| off / környezet * (dB) | 29.3 | 28.9 1% | 29 1% | 30.4 -4% | 28.2 4% | 29.4 -0% |
| Idle Minimum * (dB) | 29.3 | 28.9 1% | 29 1% | 30.5 -4% | 28.2 4% | 29.4 -0% |
| Idle Average * (dB) | 31.1 | 28.9 7% | 29 7% | 30.5 2% | 28.2 9% | 29.4 5% |
| Idle Maximum * (dB) | 33.3 | 28.9 13% | 29 13% | 30.5 8% | 28.2 15% | 29.7 11% |
| Load Average * (dB) | 33.3 | 35.3 -6% | 33.6 -1% | 31.2 6% | 30.4 9% | 39 -17% |
| Load Maximum * (dB) | 38.9 | 38.9 -0% | 35.8 8% | 31.3 20% | 34 13% | 40.2 -3% |
| Witcher 3 ultra * (dB) | 39.5 |
* ... a kisebb jobb
| Lenovo ThinkPad X1 Yoga 2017 20JES03T00 i7-7600U, HD Graphics 620 | Lenovo ThinkPad X1 Yoga-20FRS1VS00 6600U, HD Graphics 520 | HP EliteBook x360 1030 G2 i5-7300U, HD Graphics 620 | Toshiba Portege X20W-D-10R i7-7600U, HD Graphics 620 | Dell Latitude 12 5285 2-in-1 i7-7600U, HD Graphics 620 | Microsoft Surface Book with Performance Base 6600U, GeForce GTX 965M | |
|---|---|---|---|---|---|---|
| Heat | -17% | 5% | 19% | -8% | -16% | |
| Maximum Upper Side * (°C) | 47.5 | 45.5 4% | 36.1 24% | 35.7 25% | 38.2 20% | 47 1% |
| Maximum Bottom * (°C) | 44.8 | 47.1 -5% | 36.7 18% | 24.2 46% | 48.6 -8% | 47 -5% |
| Idle Upper Side * (°C) | 23.7 | 31.1 -31% | 26.8 -13% | 23.4 1% | 29.6 -25% | 34.4 -45% |
| Idle Bottom * (°C) | 24.6 | 33.1 -35% | 26.5 -8% | 24.2 2% | 28.8 -17% | 27.7 -13% |
* ... a kisebb jobb
(-) A felső oldalon a maximális hőmérséklet 47.5 °C / 118 F, összehasonlítva a 35.4 °C / 96 F átlagával , 19.6 és 60 °C között a Convertible osztálynál.
(±) Az alsó maximum 44.8 °C / 113 F-ig melegszik fel, összehasonlítva a 36.9 °C / 98 F átlagával
(+) Üresjáratban a felső oldal átlagos hőmérséklete 22.9 °C / 73 F, összehasonlítva a 30.3 °C / ### eszközátlaggal class_avg_f### F.
(+) A csuklótámasz és az érintőpad hűvösebb, mint a bőr hőmérséklete, maximum 30.2 °C / 86.4 F, ezért hűvös tapintású.
(-) A hasonló eszközök csuklótámasz területének átlagos hőmérséklete 28 °C / 82.4 F volt (-2.2 °C / -4 F).
Lenovo ThinkPad X1 Yoga 2017 20JES03T00 hangelemzés
(±) | a hangszóró hangereje átlagos, de jó (73.3 dB)
Basszus 100 - 315 Hz
(-) | szinte nincs basszus – átlagosan 19.1%-kal alacsonyabb a mediánnál
(±) | a basszus linearitása átlagos (8.6% delta az előző frekvenciához)
Közepes 400-2000 Hz
(+) | kiegyensúlyozott középpontok – csak 2.6% választja el a mediántól
(±) | a középpontok linearitása átlagos (8% delta az előző gyakorisághoz)
Maximum 2-16 kHz
(+) | kiegyensúlyozott csúcsok – csak 2.6% választja el a mediántól
(+) | a csúcsok lineárisak (6.6% delta az előző frekvenciához képest)
Összességében 100 - 16.000 Hz
(±) | az általános hang linearitása átlagos (21.7% eltérés a mediánhoz képest)
Ugyanazon osztályhoz képest
» 60%Ebben az osztályban az összes tesztelt eszköz %-a jobb volt, 9% hasonló, 31%-kal rosszabb
» A legjobb delta értéke 6%, az átlag 20%, a legrosszabb 57% volt
Az összes tesztelt eszközzel összehasonlítva
» 62% az összes tesztelt eszköz jobb volt, 7% hasonló, 31%-kal rosszabb
» A legjobb delta értéke 4%, az átlag 23%, a legrosszabb 134% volt
Toshiba Portege X20W-D-10R hangelemzés
(-) | nem túl hangos hangszórók (64 dB)
Basszus 100 - 315 Hz
(-) | szinte nincs basszus – átlagosan 24.3%-kal alacsonyabb a mediánnál
(±) | a basszus linearitása átlagos (11.3% delta az előző frekvenciához)
Közepes 400-2000 Hz
(+) | kiegyensúlyozott középpontok – csak 3.5% választja el a mediántól
(±) | a középpontok linearitása átlagos (7.9% delta az előző gyakorisághoz)
Maximum 2-16 kHz
(+) | kiegyensúlyozott csúcsok – csak 4.8% választja el a mediántól
(+) | a csúcsok lineárisak (6.2% delta az előző frekvenciához képest)
Összességében 100 - 16.000 Hz
(±) | az általános hang linearitása átlagos (27% eltérés a mediánhoz képest)
Ugyanazon osztályhoz képest
» 83%Ebben az osztályban az összes tesztelt eszköz %-a jobb volt, 3% hasonló, 14%-kal rosszabb
» A legjobb delta értéke 6%, az átlag 20%, a legrosszabb 57% volt
Az összes tesztelt eszközzel összehasonlítva
» 83% az összes tesztelt eszköz jobb volt, 4% hasonló, 14%-kal rosszabb
» A legjobb delta értéke 4%, az átlag 23%, a legrosszabb 134% volt
| Kikapcsolt állapot / Készenlét | |
| Üresjárat | |
| Terhelés |
|
Kulcs:
min: | |
| Lenovo ThinkPad X1 Yoga 2017 20JES03T00 i7-7600U, HD Graphics 620, Samsung SSD PM961 1TB M.2 PCIe 3.0 x4 NVMe (MZVLW1T0), OLED, 2560x1440, 14" | Lenovo ThinkPad X1 Yoga-20FRS1VS00 6600U, HD Graphics 520, Samsung SSD PM961 1TB M.2 PCIe 3.0 x4 NVMe (MZSLW1T0), OLED, 2560x1440, 14" | HP EliteBook x360 1030 G2 i5-7300U, HD Graphics 620, Sandisk SD8TN8U-256G-1006, IPS, 1920x1080, 13.3" | Toshiba Portege X20W-D-10R i7-7600U, HD Graphics 620, Toshiba SG5 THNSNK512GVN8, IPS, 1920x1080, 12.5" | Dell Latitude 12 5285 2-in-1 i7-7600U, HD Graphics 620, Samsung PM961 MZVLW256HEHP, IPS, 1920x1280, 12.3" | Microsoft Surface Book with Performance Base 6600U, GeForce GTX 965M, Toshiba NVMe THNSN5256GPU7, IPS, 3000x2000, 13.5" | |
|---|---|---|---|---|---|---|
| Power Consumption | 1% | 28% | 39% | 25% | -28% | |
| Idle Minimum * (Watt) | 4.9 | 4.7 4% | 3.2 35% | 3.4 31% | 2.85 42% | 4.15 15% |
| Idle Average * (Watt) | 7.6 | 8.6 -13% | 5.5 28% | 5.8 24% | 6.76 11% | 8 -5% |
| Idle Maximum * (Watt) | 13.8 | 12.2 12% | 6.5 53% | 6.7 51% | 6.91 50% | 11.9 14% |
| Load Average * (Watt) | 33.4 | 29.7 11% | 29.7 11% | 21.4 36% | 32.88 2% | 67 -101% |
| Load Maximum * (Watt) | 46.5 | 50.5 -9% | 41.3 11% | 21.6 54% | 37.41 20% | 76 -63% |
| Witcher 3 ultra * (Watt) | 58 |
* ... a kisebb jobb

| Lenovo ThinkPad X1 Yoga 2017 20JES03T00 i7-7600U, HD Graphics 620, 56 Wh | Lenovo ThinkPad X1 Yoga-20FRS1VS00 6600U, HD Graphics 520, 56 Wh | HP EliteBook x360 1030 G2 i5-7300U, HD Graphics 620, 57 Wh | Toshiba Portege X20W-D-10R i7-7600U, HD Graphics 620, 44 Wh | Dell Latitude 12 5285 2-in-1 i7-7600U, HD Graphics 620, 42 Wh | Microsoft Surface Book with Performance Base 6600U, GeForce GTX 965M, 78 Wh | |
|---|---|---|---|---|---|---|
| Akkumulátor üzemidő | 8% | 79% | 50% | 20% | 42% | |
| Reader / Idle (h) | 13.1 | 13.7 5% | 23.1 76% | 16.7 27% | 17.9 37% | 25.5 95% |
| H.264 (h) | 6.8 | 8.7 28% | 11 62% | |||
| WiFi v1.3 (h) | 6.1 | 5.3 -13% | 10.5 72% | 12 97% | 8.1 33% | 9.6 57% |
| Load (h) | 2 | 2.2 10% | 4.1 105% | 2.5 25% | 1.8 -10% | 1.5 -25% |
Pro
Kontra
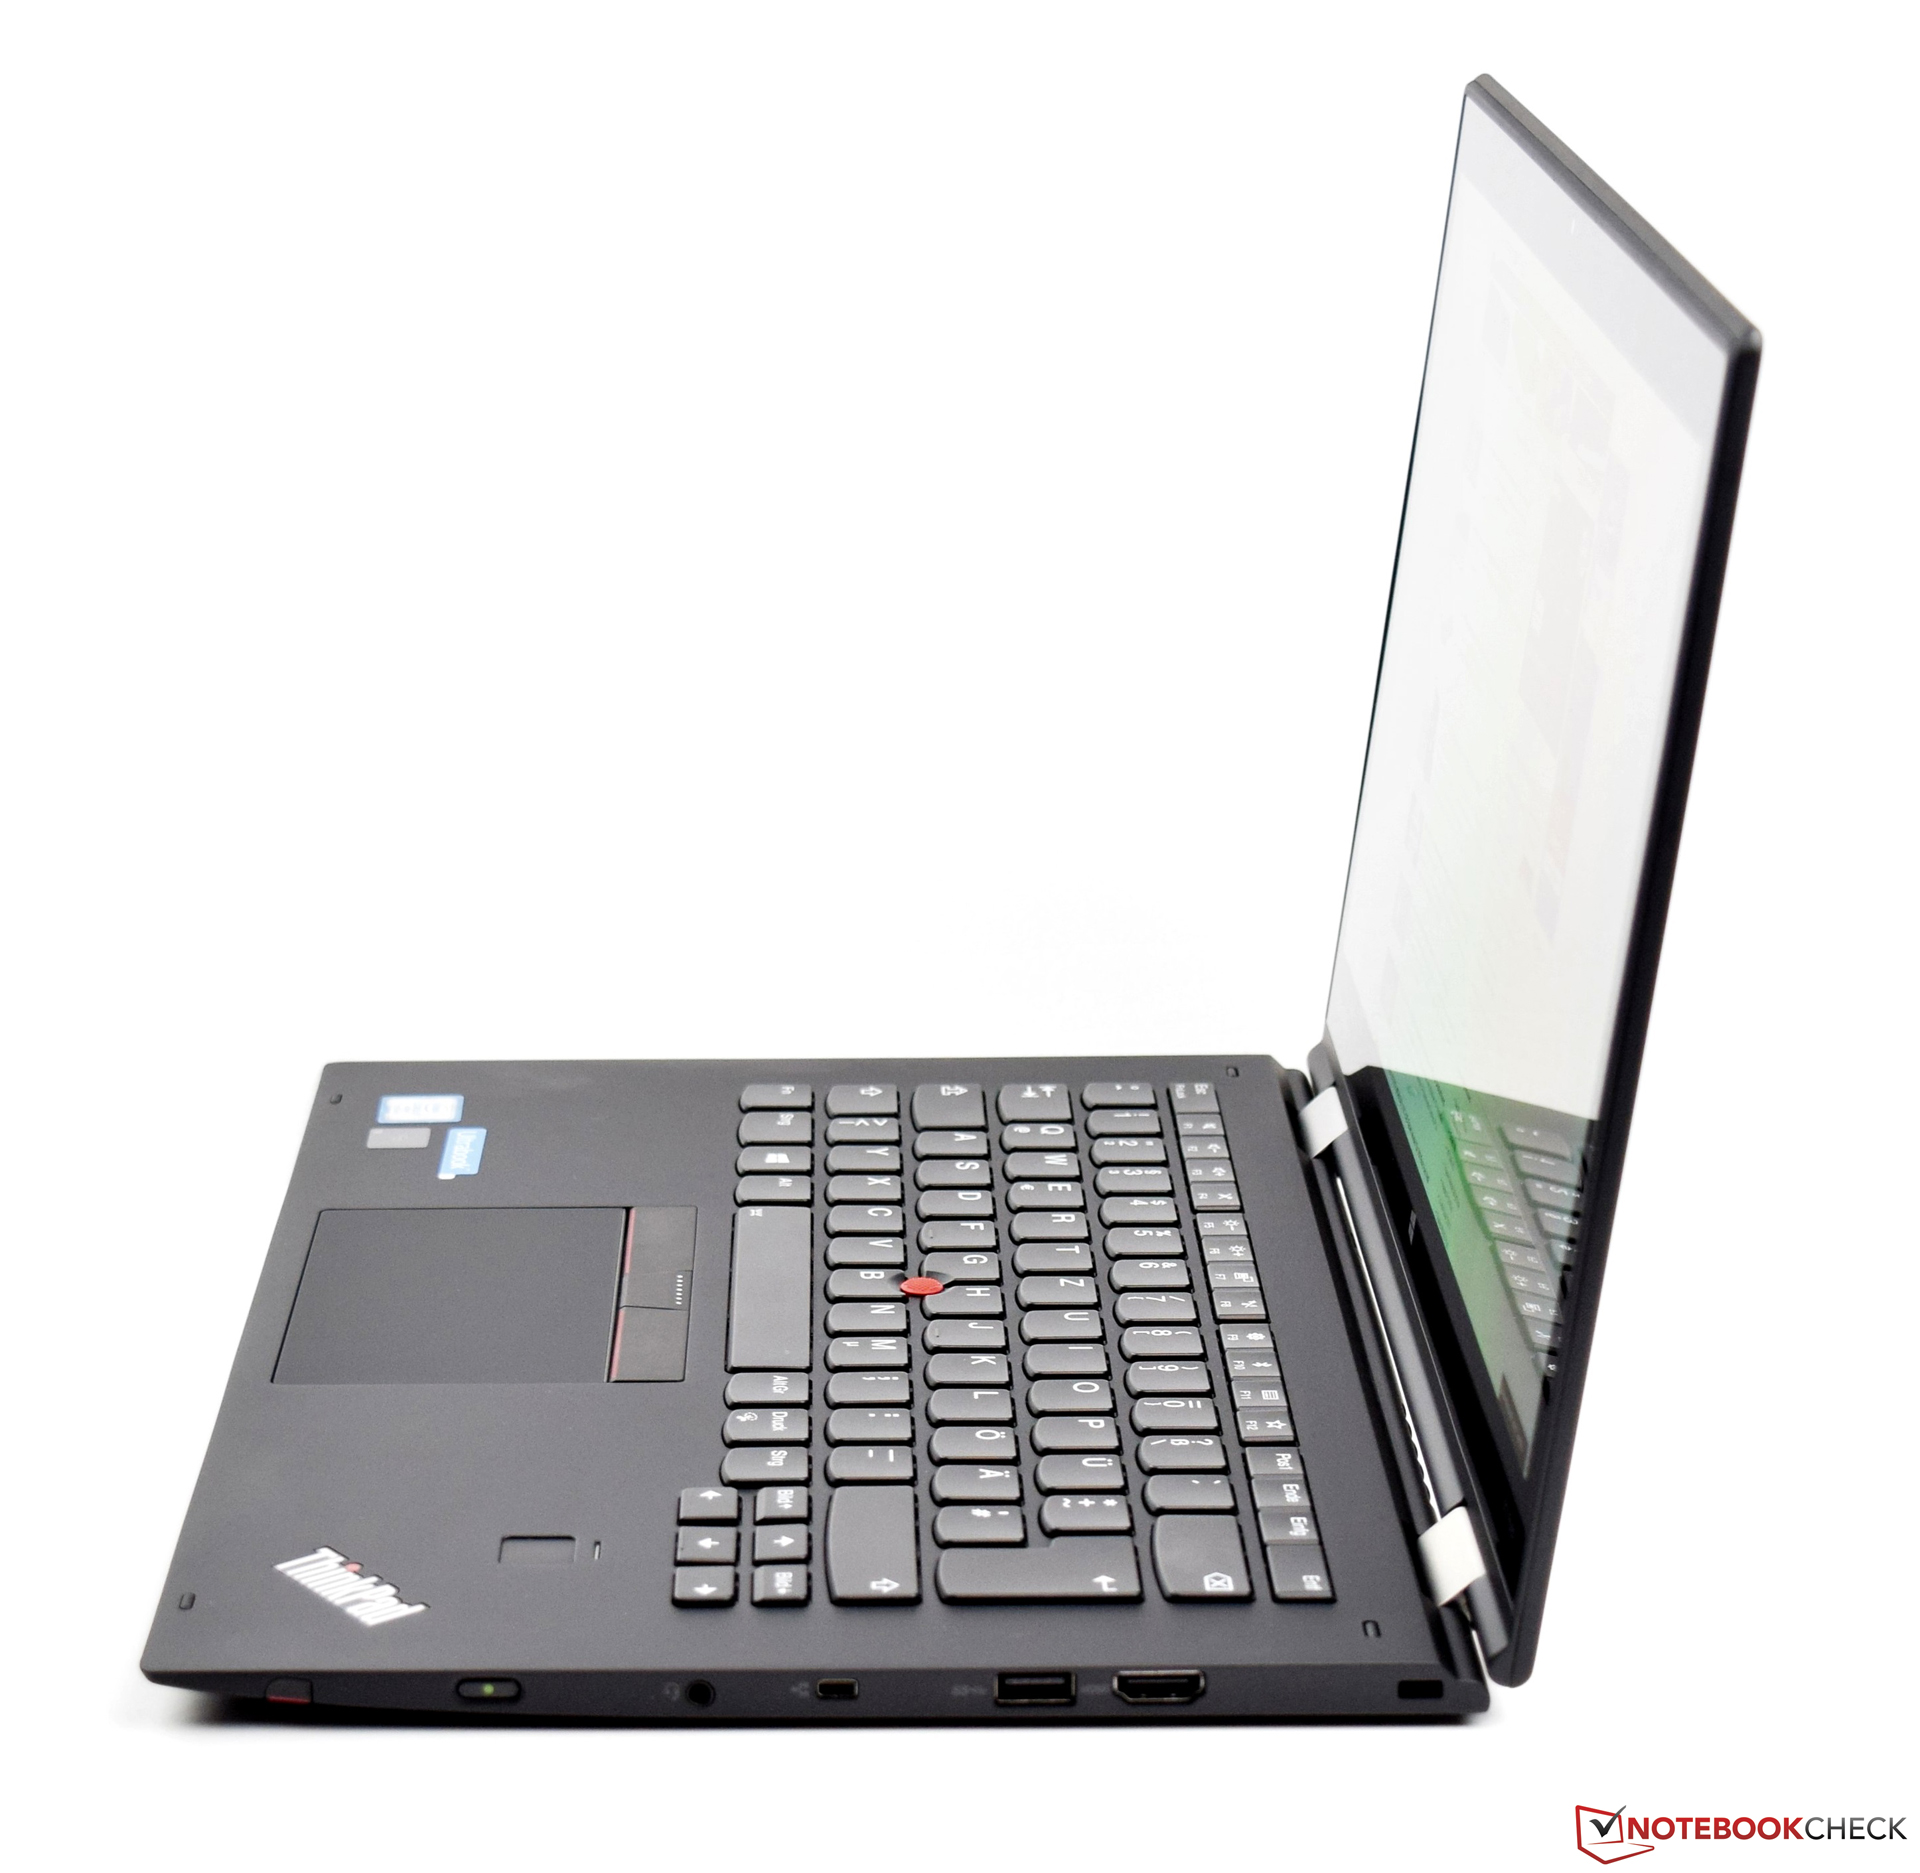
A Lenovo ThinkPad X1 Yoga 2017 izmos, felső kategóriás átalakítható, amely nem csak fantasztikus OLED kijelzőjével emelkedik ki a többiek közül, de a rajta lévő árcédulával is: 3300 eurós árával (~$3720) a ThinkPad X1 Yoga 2017 határozottan nem olcsó készülék. A prémium alkatrészek jól együttműködnek, és a rendszer simán működik. A szintetikus benchmark eredmények alátámasztják a szubjektív benyomásainkat. Az Intel Core i7-7600U erős, és meglehetősen időtállónak is ígérkezik. A tárhely és RAM is bőséges.
Ha a pénz nem akadály, és csak egy "convertible extraordinaire" felel meg - nos, akkor a Lenovo ThinkPad X1 Yoga 2017 kétségtelenül logikus választás. Azt, hogy megéri-e az árát, mindenkinek magának kell eldöntenie.
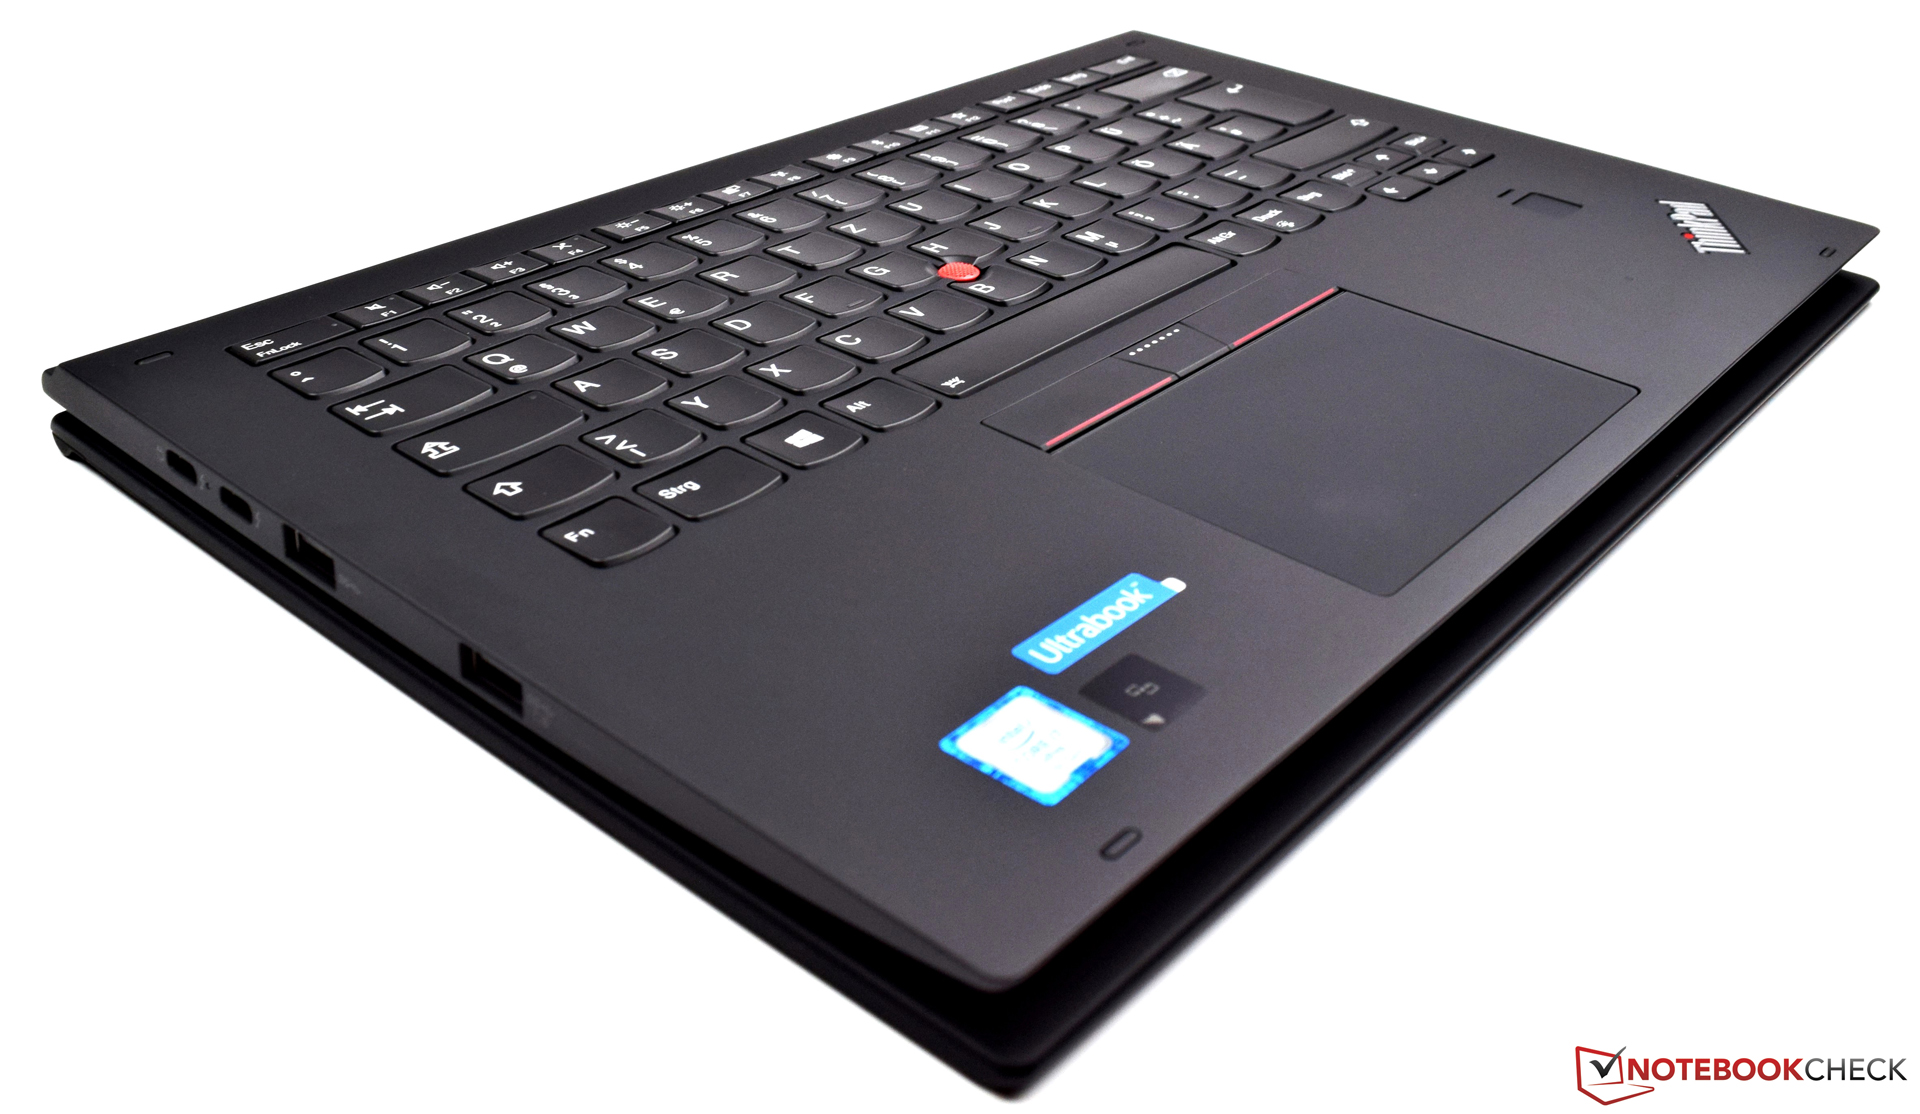
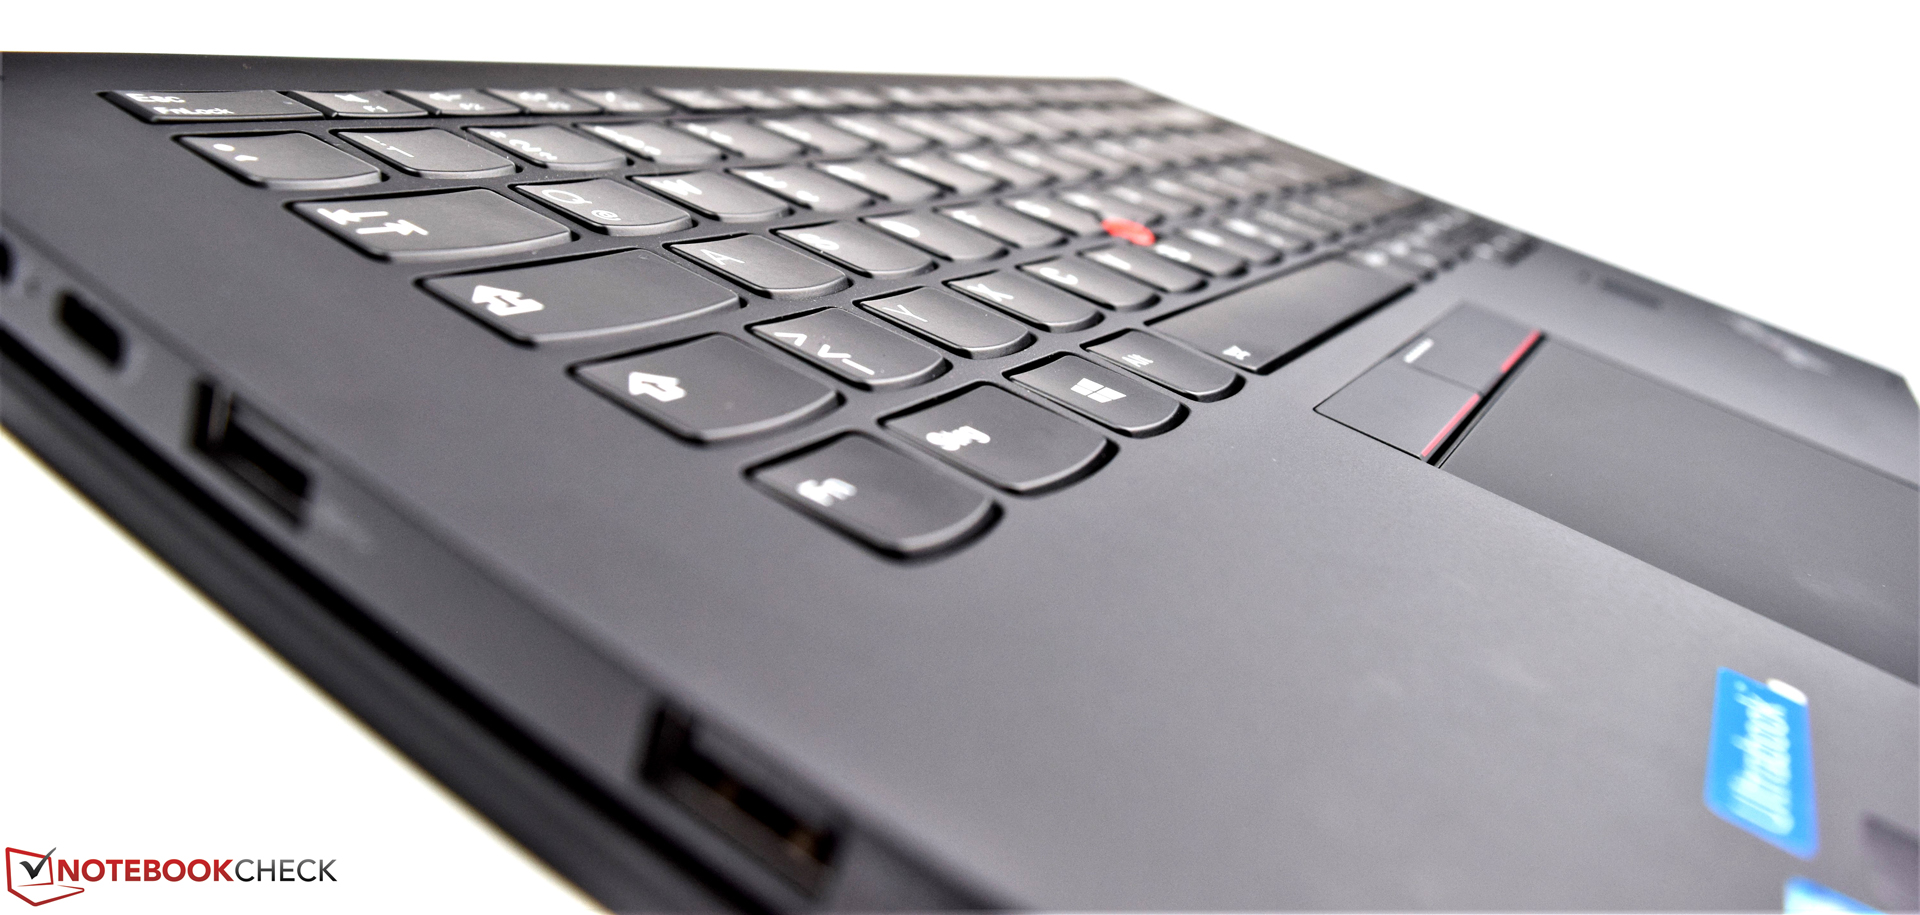
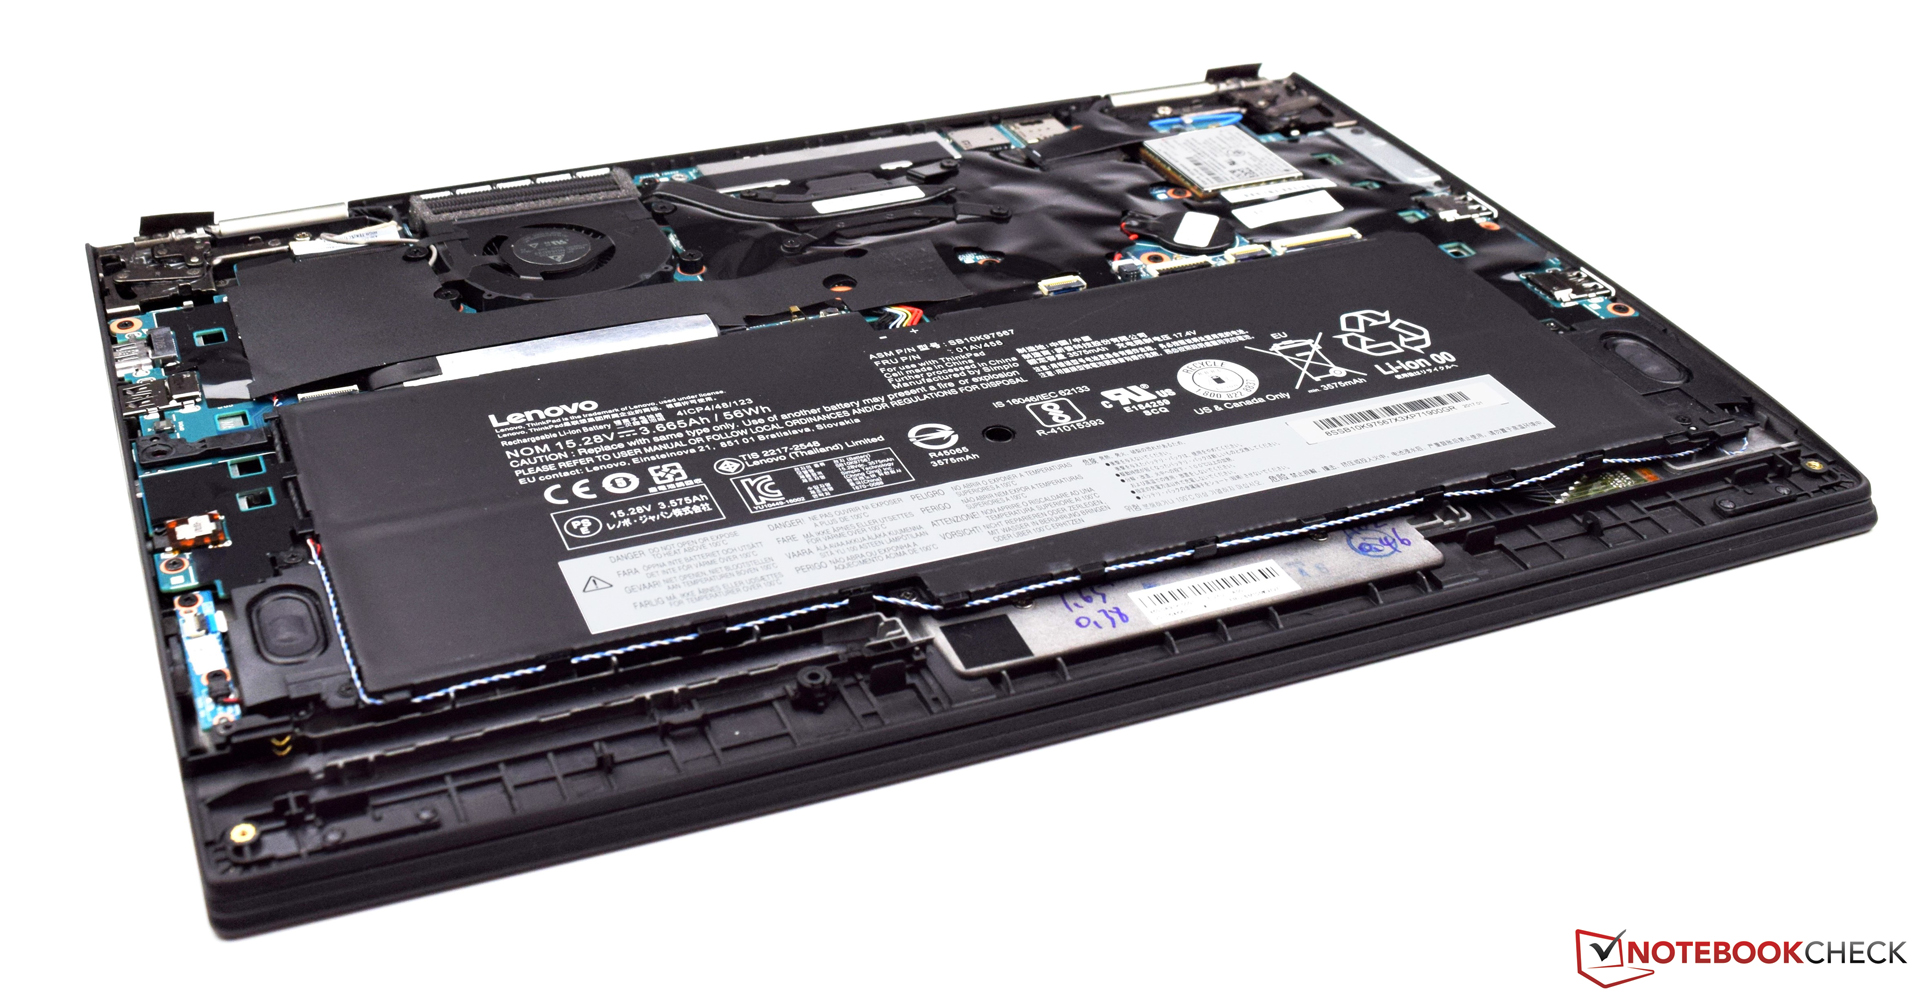
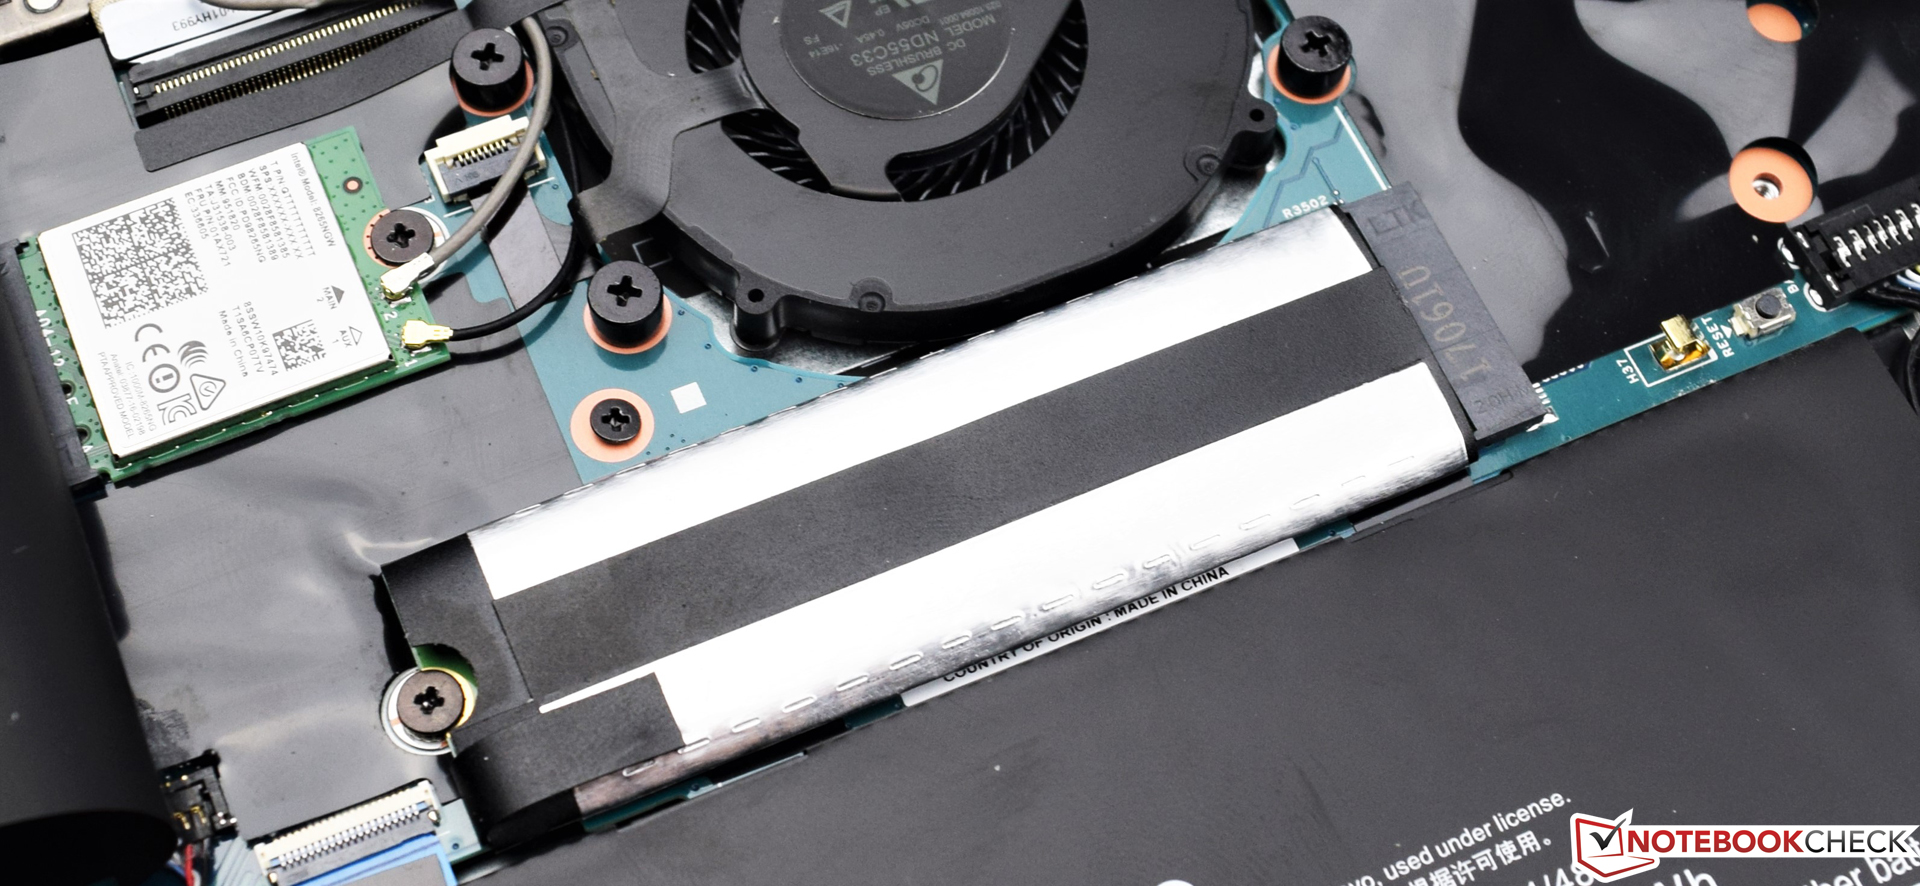
A gépet remekül összerakták, a háznak nincs komolyabb hiányossága. A beviteli eszközök kiválók, meglepődtünk volna, ha a Lenovo ezen a téren csúszik el. Az OLED panel élénk színei lenyűgözőek, de átlagos fényereje már alulmúlta elvárásainkat. Összességében a gép nem a legalkalmasabb kültéri használatra. Ezen kívül örültünk volna, ha a Lenovo némileg több teret hagy a felhasználóknak a gép bővítésére.
Ez az eredeti értékelés rövidített változata. A teljes, angol nyelvű cikk itt olvasható.
Lenovo ThinkPad X1 Yoga 2017 20JES03T00
- 06/18/2017 v6 (old)
Sebastian Bade
Price comparison
