Dell Alienware m15 R3 Laptop rövid értékelés: Gőzkamra a Megoldás
Értékelés | Dátum | Modell | Súly | Magasság | Méret | Felbontás | Legjobb ár |
|---|---|---|---|---|---|---|---|
| 84.8 % v7 (old) | 09/2020 | Alienware m15 R3 P87F i7-10750H, GeForce RTX 2070 Mobile | 2.3 kg | 19.9 mm | 15.60" | 1920x1080 | |
| 82.6 % v7 (old) | Eluktronics RP-15 R7 4800H, GeForce RTX 2060 Mobile | 1.9 kg | 20 mm | 15.60" | 1920x1080 | ||
| 86 % v7 (old) | Razer Blade 15 RZ09-0328 i7-10750H, GeForce RTX 2070 Max-Q | 2.1 kg | 19.9 mm | 15.60" | 3840x2160 | ||
| 81.3 % v7 (old) | 06/2019 | Asus Zephyrus S GX502GW i7-9750H, GeForce RTX 2070 Mobile | 2.1 kg | 19 mm | 15.60" | 1920x1080 | |
| 82.8 % v7 (old) | 07/2020 | MSI GS66 Stealth 10SFS i9-10980HK, GeForce RTX 2070 Super Max-Q | 2.2 kg | 20 mm | 15.60" | 1920x1080 |
| SD Card Reader | |
| average JPG Copy Test (av. of 3 runs) | |
| MSI GS75 10SF-609US (Toshiba Exceria Pro M501 UHS-II) | |
| Dell XPS 15 9500 Core i7 4K UHD (Toshiba Exceria Pro SDXC 64 GB UHS-II) | |
| Gigabyte Aero 15 OLED XA (Toshiba Exceria Pro SDXC 64 GB UHS-II) | |
| Alienware m15 R3 P87F (Toshiba Exceria Pro M501 UHS-II) | |
| Eluktronics RP-15 (Toshiba Exceria Pro SDXC 64 GB UHS-II) | |
| maximum AS SSD Seq Read Test (1GB) | |
| Gigabyte Aero 15 OLED XA (Toshiba Exceria Pro SDXC 64 GB UHS-II) | |
| Alienware m15 R3 P87F (Toshiba Exceria Pro M501 UHS-II) | |
| MSI GS75 10SF-609US (Toshiba Exceria Pro M501 UHS-II) | |
| Dell XPS 15 9500 Core i7 4K UHD (Toshiba Exceria Pro SDXC 64 GB UHS-II) | |
| Eluktronics RP-15 (Toshiba Exceria Pro SDXC 64 GB UHS-II) | |
| Networking | |
| iperf3 transmit AX12 | |
| Eluktronics RP-15 | |
| MSI GS75 10SF-609US | |
| Alienware m15 R3 P87F | |
| Dell XPS 15 9500 Core i7 4K UHD | |
| Gigabyte Aero 15 OLED XA | |
| iperf3 receive AX12 | |
| Eluktronics RP-15 | |
| Dell XPS 15 9500 Core i7 4K UHD | |
| Alienware m15 R3 P87F | |
| MSI GS75 10SF-609US | |
| Gigabyte Aero 15 OLED XA | |

")
")
| |||||||||||||||||||||||||
Fényerő megoszlás: 87 %
Centrumban: 326.7 cd/m²
Kontraszt: 990:1 (Fekete: 0.33 cd/m²)
ΔE ColorChecker Calman: 2.4 | ∀{0.5-29.43 Ø4.71}
calibrated: 1.51
ΔE Greyscale Calman: 3.2 | ∀{0.09-98 Ø4.96}
99.2% sRGB (Argyll 1.6.3 3D)
63.7% AdobeRGB 1998 (Argyll 1.6.3 3D)
69.8% AdobeRGB 1998 (Argyll 3D)
98.9% sRGB (Argyll 3D)
68.6% Display P3 (Argyll 3D)
Gamma: 2.13
CCT: 7129 K
| Alienware m15 R3 P87F AU Optronics B156HAN, IPS, 15.6", 1920x1080 | Alienware m15 P79F Samsung SDCA029, 156WR04, OLED, 15.6", 3840x2160 | Eluktronics RP-15 BOE NV156FHM-N4G, IPS, 15.6", 1920x1080 | Razer Blade 15 RZ09-0328 Samsung SDCA029, AMOLED, 15.6", 3840x2160 | Asus Zephyrus S GX502GW AU Optronics B156HAN08.2 (AUO82ED), IPS, 15.6", 1920x1080 | MSI GS66 Stealth 10SFS AUO B156HAN12.0 (AUO328E), IPS, 15.6", 1920x1080 | |
|---|---|---|---|---|---|---|
| Display | 30% | -7% | 29% | -6% | 1% | |
| Display P3 Coverage (%) | 68.6 | 99.9 46% | 63.7 -7% | 99.9 46% | 64.9 -5% | 69.5 1% |
| sRGB Coverage (%) | 98.9 | 100 1% | 92 -7% | 100 1% | 91 -8% | 99.6 1% |
| AdobeRGB 1998 Coverage (%) | 69.8 | 100 43% | 65.2 -7% | 97.4 40% | 65.9 -6% | 70.8 1% |
| Response Times | 57% | -163% | 54% | -31% | -120% | |
| Response Time Grey 50% / Grey 80% * (ms) | 4 ? | 2.6 ? 35% | 17.2 ? -330% | 2.7 ? 32% | 7.2 ? -80% | 14 ? -250% |
| Response Time Black / White * (ms) | 10.8 ? | 2.3 ? 79% | 10.4 ? 4% | 2.6 ? 76% | 8.8 ? 19% | 9.6 ? 11% |
| PWM Frequency (Hz) | 60.2 ? | 59.5 ? | ||||
| Screen | -17% | -28% | -5% | -5% | 5% | |
| Brightness middle (cd/m²) | 326.7 | 452.1 38% | 298.6 -9% | 366.7 12% | 286 -12% | 316 -3% |
| Brightness (cd/m²) | 316 | 452 43% | 289 -9% | 371 17% | 275 -13% | 311 -2% |
| Brightness Distribution (%) | 87 | 90 3% | 90 3% | 91 5% | 90 3% | 92 6% |
| Black Level * (cd/m²) | 0.33 | 0.35 -6% | 0.37 -12% | 0.21 36% | ||
| Contrast (:1) | 990 | 853 -14% | 773 -22% | 1505 52% | ||
| Colorchecker dE 2000 * | 2.4 | 6.34 -164% | 5.01 -109% | 5.21 -117% | 2.19 9% | 3.03 -26% |
| Colorchecker dE 2000 max. * | 6.06 | 12.97 -114% | 7.06 -17% | 7.92 -31% | 4.4 27% | 7.32 -21% |
| Colorchecker dE 2000 calibrated * | 1.51 | 2.52 -67% | 2.27 -50% | 1.1 27% | ||
| Greyscale dE 2000 * | 3.2 | 2.8 13% | 5.4 -69% | 2 37% | 2.2 31% | 3.9 -22% |
| Gamma | 2.13 103% | 2.21 100% | 2.54 87% | 2.17 101% | 2.41 91% | 2.42 91% |
| CCT | 7129 91% | 6114 106% | 7461 87% | 6514 100% | 6405 101% | 7439 87% |
| Color Space (Percent of AdobeRGB 1998) (%) | 63.7 | 91 43% | 59.1 -7% | 86.6 36% | 59 -7% | 65 2% |
| Color Space (Percent of sRGB) (%) | 99.2 | 100 1% | 91.6 -8% | 100 1% | 91 -8% | 100 1% |
| Teljes átlag (program / beállítások) | 23% /
5% | -66% /
-41% | 26% /
12% | -14% /
-8% | -38% /
-12% |
* ... a kisebb jobb
Megjelenítési válaszidők
| ↔ Válaszidő Fekete-fehér | ||
|---|---|---|
| 10.8 ms ... emelkedés és süllyedés ↘ kombinálva | ↗ 5.2 ms emelkedés | 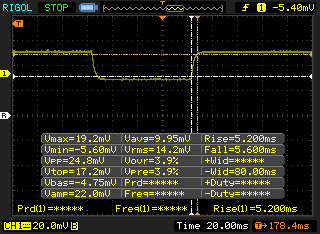 |
| ↘ 5.6 ms ősz | ||
| A képernyő jó reakciósebességet mutat tesztjeinkben, de túl lassú lehet a versenyképes játékosok számára. Összehasonlításképpen, az összes tesztelt eszköz 0.1 (minimum) és 240 (maximum) ms között mozog. » 29 % of all devices are better. Ez azt jelenti, hogy a mért válaszidő jobb, mint az összes vizsgált eszköz átlaga (19.8 ms). | ||
| ↔ Válaszidő 50% szürke és 80% szürke között | ||
| 4 ms ... emelkedés és süllyedés ↘ kombinálva | ↗ 1.6 ms emelkedés | 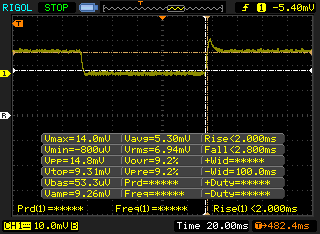 |
| ↘ 2.4 ms ősz | ||
| A képernyő tesztjeinkben nagyon gyors reakciósebességet mutatott, és nagyon jól használható gyors tempójú játékokhoz. Összehasonlításképpen, az összes tesztelt eszköz 0.165 (minimum) és 636 (maximum) ms között mozog. » 15 % of all devices are better. Ez azt jelenti, hogy a mért válaszidő jobb, mint az összes vizsgált eszköz átlaga (31 ms). | ||
Képernyő villogása / PWM (impulzusszélesség-moduláció)
| Képernyő villogása / PWM nem érzékelhető | 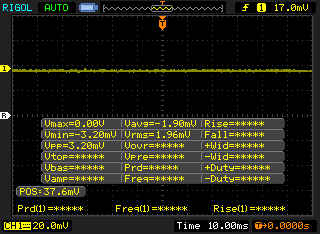 | ||
Összehasonlításképpen: az összes tesztelt eszköz 52 %-a nem használja a PWM-et a kijelző elsötétítésére. Ha PWM-et észleltek, akkor átlagosan 7757 (minimum: 5 - maximum: 343500) Hz-t mértek. | |||
Cinebench R15: CPU Multi 64Bit | CPU Single 64Bit
Blender: v2.79 BMW27 CPU
7-Zip 18.03: 7z b 4 -mmt1 | 7z b 4
Geekbench 5.5: Single-Core | Multi-Core
HWBOT x265 Benchmark v2.2: 4k Preset
LibreOffice : 20 Documents To PDF
R Benchmark 2.5: Overall mean
| Cinebench R20 / CPU (Multi Core) | |
| Intel Core i9-10900K | |
| Dell G5 15 SE 5505 P89F | |
| Asus ROG Strix Scar 15 G532LWS | |
| Gigabyte Aero 15 OLED XB-8DE51B0SP | |
| MSI GE65 Raider 9SF-049US | |
| Alienware m15 R3 P87F | |
| Acer Nitro 5 AN515-44-R5FT | |
| Átlagos Intel Core i7-10750H (1749 - 3325, n=43) | |
| Maingear Vector 15 | |
| MSI GE63 Raider 8SG | |
| Asus Zephyrus GX501 | |
| Cinebench R20 / CPU (Single Core) | |
| Intel Core i9-10900K | |
| Gigabyte Aero 15 OLED XB-8DE51B0SP | |
| Asus ROG Strix Scar 15 G532LWS | |
| Dell G5 15 SE 5505 P89F | |
| Alienware m15 R3 P87F | |
| MSI GE65 Raider 9SF-049US | |
| Átlagos Intel Core i7-10750H (431 - 504, n=43) | |
| Maingear Vector 15 | |
| Acer Nitro 5 AN515-44-R5FT | |
| MSI GE63 Raider 8SG | |
| Asus Zephyrus GX501 | |
| Cinebench R15 / CPU Multi 64Bit | |
| Intel Core i9-10900K | |
| Dell G5 15 SE 5505 P89F | |
| Gigabyte Aero 15 OLED XB-8DE51B0SP | |
| Asus ROG Strix Scar 15 G532LWS | |
| MSI GE65 Raider 9SF-049US | |
| Acer Nitro 5 AN515-44-R5FT | |
| Alienware m15 R3 P87F | |
| Maingear Vector 15 | |
| Átlagos Intel Core i7-10750H (804 - 1418, n=50) | |
| MSI GE63 Raider 8SG | |
| Asus Zephyrus GX501 | |
| Cinebench R15 / CPU Single 64Bit | |
| Intel Core i9-10900K | |
| Gigabyte Aero 15 OLED XB-8DE51B0SP | |
| Asus ROG Strix Scar 15 G532LWS | |
| Alienware m15 R3 P87F | |
| MSI GE65 Raider 9SF-049US | |
| Átlagos Intel Core i7-10750H (184 - 213, n=45) | |
| Dell G5 15 SE 5505 P89F | |
| Maingear Vector 15 | |
| Acer Nitro 5 AN515-44-R5FT | |
| MSI GE63 Raider 8SG | |
| Asus Zephyrus GX501 | |
| Blender / v2.79 BMW27 CPU | |
| Átlagos Intel Core i7-10750H (322 - 587, n=43) | |
| Acer Nitro 5 AN515-44-R5FT | |
| Alienware m15 R3 P87F | |
| Gigabyte Aero 15 OLED XB-8DE51B0SP | |
| Asus ROG Strix Scar 15 G532LWS | |
| Dell G5 15 SE 5505 P89F | |
| Intel Core i9-10900K | |
| 7-Zip 18.03 / 7z b 4 -mmt1 | |
| Intel Core i9-10900K | |
| Asus ROG Strix Scar 15 G532LWS | |
| Gigabyte Aero 15 OLED XB-8DE51B0SP | |
| Átlagos Intel Core i7-10750H (4504 - 5470, n=43) | |
| Dell G5 15 SE 5505 P89F | |
| Alienware m15 R3 P87F | |
| Acer Nitro 5 AN515-44-R5FT | |
| 7-Zip 18.03 / 7z b 4 | |
| Intel Core i9-10900K | |
| Dell G5 15 SE 5505 P89F | |
| Asus ROG Strix Scar 15 G532LWS | |
| Gigabyte Aero 15 OLED XB-8DE51B0SP | |
| Acer Nitro 5 AN515-44-R5FT | |
| Alienware m15 R3 P87F | |
| Átlagos Intel Core i7-10750H (26040 - 37345, n=43) | |
| Geekbench 5.5 / Single-Core | |
| Intel Core i9-10900K | |
| Asus ROG Strix Scar 15 G532LWS | |
| Gigabyte Aero 15 OLED XB-8DE51B0SP | |
| Alienware m15 R3 P87F | |
| Átlagos Intel Core i7-10750H (1114 - 1333, n=43) | |
| Dell G5 15 SE 5505 P89F | |
| Acer Nitro 5 AN515-44-R5FT | |
| Geekbench 5.5 / Multi-Core | |
| Intel Core i9-10900K | |
| Asus ROG Strix Scar 15 G532LWS | |
| Gigabyte Aero 15 OLED XB-8DE51B0SP | |
| Dell G5 15 SE 5505 P89F | |
| Alienware m15 R3 P87F | |
| Átlagos Intel Core i7-10750H (4443 - 6674, n=43) | |
| Acer Nitro 5 AN515-44-R5FT | |
| HWBOT x265 Benchmark v2.2 / 4k Preset | |
| Intel Core i9-10900K | |
| Gigabyte Aero 15 OLED XB-8DE51B0SP | |
| Asus ROG Strix Scar 15 G532LWS | |
| Dell G5 15 SE 5505 P89F | |
| Alienware m15 R3 P87F | |
| Átlagos Intel Core i7-10750H (5.54 - 11.6, n=43) | |
| Acer Nitro 5 AN515-44-R5FT | |
| LibreOffice / 20 Documents To PDF | |
| Intel Core i9-10900K | |
| Dell G5 15 SE 5505 P89F | |
| Acer Nitro 5 AN515-44-R5FT | |
| Alienware m15 R3 P87F | |
| Átlagos Intel Core i7-10750H (43.1 - 99.2, n=43) | |
| Gigabyte Aero 15 OLED XB-8DE51B0SP | |
| Asus ROG Strix Scar 15 G532LWS | |
| R Benchmark 2.5 / Overall mean | |
| Alienware m15 R3 P87F | |
| Acer Nitro 5 AN515-44-R5FT | |
| Átlagos Intel Core i7-10750H (0.578 - 0.708, n=42) | |
| Dell G5 15 SE 5505 P89F | |
| Asus ROG Strix Scar 15 G532LWS | |
| Gigabyte Aero 15 OLED XB-8DE51B0SP | |
| Intel Core i9-10900K | |
* ... a kisebb jobb
| PCMark 10 | |
| Score | |
| MSI GS66 Stealth 10SFS | |
| Alienware m15 R3 P87F | |
| Átlagos Intel Core i7-10750H, NVIDIA GeForce RTX 2070 Mobile (5179 - 6255, n=4) | |
| Eluktronics RP-15 | |
| Asus Zephyrus S GX502GW | |
| Alienware m15 P79F | |
| Razer Blade 15 RZ09-0328 | |
| Essentials | |
| Razer Blade 15 RZ09-0328 | |
| MSI GS66 Stealth 10SFS | |
| Eluktronics RP-15 | |
| Átlagos Intel Core i7-10750H, NVIDIA GeForce RTX 2070 Mobile (9509 - 10017, n=4) | |
| Alienware m15 R3 P87F | |
| Asus Zephyrus S GX502GW | |
| Alienware m15 P79F | |
| Productivity | |
| MSI GS66 Stealth 10SFS | |
| Átlagos Intel Core i7-10750H, NVIDIA GeForce RTX 2070 Mobile (7860 - 8826, n=4) | |
| Razer Blade 15 RZ09-0328 | |
| Alienware m15 R3 P87F | |
| Asus Zephyrus S GX502GW | |
| Eluktronics RP-15 | |
| Alienware m15 P79F | |
| Digital Content Creation | |
| Alienware m15 R3 P87F | |
| MSI GS66 Stealth 10SFS | |
| Alienware m15 P79F | |
| Asus Zephyrus S GX502GW | |
| Eluktronics RP-15 | |
| Átlagos Intel Core i7-10750H, NVIDIA GeForce RTX 2070 Mobile (4872 - 8855, n=4) | |
| Razer Blade 15 RZ09-0328 | |
| PCMark 8 | |
| Home Score Accelerated v2 | |
| Alienware m15 R3 P87F | |
| Eluktronics RP-15 | |
| Átlagos Intel Core i7-10750H, NVIDIA GeForce RTX 2070 Mobile (3372 - 5702, n=4) | |
| Razer Blade 15 RZ09-0328 | |
| Alienware m15 P79F | |
| Work Score Accelerated v2 | |
| Alienware m15 R3 P87F | |
| Eluktronics RP-15 | |
| Átlagos Intel Core i7-10750H, NVIDIA GeForce RTX 2070 Mobile (5678 - 6224, n=4) | |
| Razer Blade 15 RZ09-0328 | |
| Alienware m15 P79F | |
| PCMark 8 Home Score Accelerated v2 | 5702 pontok | |
| PCMark 8 Work Score Accelerated v2 | 6224 pontok | |
| PCMark 10 Score | 6255 pontok | |
Segítség | ||
| DPC Latencies / LatencyMon - interrupt to process latency (max), Web, Youtube, Prime95 | |
| Dell G5 15 SE 5505 P89F | |
| MSI GS66 Stealth 10SFS | |
| Gigabyte Aero 15 OLED XB-8DE51B0SP | |
| Asus ROG Strix Scar 15 G532LWS | |
| Alienware m15 R3 P87F | |
| MSI GS66 Stealth 10SE-045 | |
| Acer Nitro 5 AN515-44-R5FT | |
| Razer Blade 15 RZ09-0328 | |
| Eluktronics RP-15 | |
| MSI GS75 10SF-609US | |
* ... a kisebb jobb
| Alienware m15 R3 P87F 2x Micron 2200S 512 GB (RAID 0) | Alienware m15 P79F Toshiba XG5 KXG50ZNV512G | Razer Blade 15 RZ09-0328 Lite-On CA5-8D512 | Asus Zephyrus S GX502GW 2x Intel SSD 660p SSDPEKNW512G8 (RAID 0) | MSI GS66 Stealth 10SFS Samsung SSD PM981 MZVLB1T0HALR | |
|---|---|---|---|---|---|
| AS SSD | -9% | 4% | 2% | 25% | |
| Seq Read (MB/s) | 2058 | 1937 -6% | 2021 -2% | 2506 22% | 1065 -48% |
| Seq Write (MB/s) | 2316 | 1066 -54% | 2090 -10% | 1712 -26% | 2360 2% |
| 4K Read (MB/s) | 39.72 | 31.76 -20% | 47.71 20% | 48.32 22% | 48.09 21% |
| 4K Write (MB/s) | 62.9 | 102.6 63% | 101.1 61% | 103.6 65% | 110.7 76% |
| 4K-64 Read (MB/s) | 1334 | 1140 -15% | 856 -36% | 624 -53% | 1635 23% |
| 4K-64 Write (MB/s) | 1271 | 938 -26% | 1041 -18% | 1253 -1% | 1829 44% |
| Access Time Read * (ms) | 0.062 | 0.058 6% | 0.052 16% | 0.08 -29% | 0.071 -15% |
| Access Time Write * (ms) | 0.388 | 0.04 90% | 0.111 71% | 0.04 90% | 0.034 91% |
| Score Read (Points) | 1580 | 1366 -14% | 1105 -30% | 923 -42% | 1790 13% |
| Score Write (Points) | 1565 | 1147 -27% | 1351 -14% | 1528 -2% | 2176 39% |
| Score Total (Points) | 3968 | 3168 -20% | 3037 -23% | 2896 -27% | 4950 25% |
| Copy ISO MB/s (MB/s) | 1685 | 946 -44% | 2474 47% | ||
| Copy Program MB/s (MB/s) | 669 | 452.8 -32% | 679 1% | ||
| Copy Game MB/s (MB/s) | 1493 | 1013 -32% | 1037 -31% | ||
| CrystalDiskMark 5.2 / 6 | 5% | 13% | -6% | 9% | |
| Write 4K (MB/s) | 67.3 | 148.4 121% | 118.7 76% | 97 44% | 131.3 95% |
| Read 4K (MB/s) | 41.47 | 49.65 20% | 52.4 26% | 49.58 20% | 45.84 11% |
| Write Seq (MB/s) | 2239 | 1139 -49% | 2247 0% | 1838 -18% | 2370 6% |
| Read Seq (MB/s) | 2112 | 2353 11% | 2234 6% | 2421 15% | 1509 -29% |
| Write 4K Q32T1 (MB/s) | 488.9 | 484.7 -1% | 515 5% | 326.9 -33% | 481.5 -2% |
| Read 4K Q32T1 (MB/s) | 557 | 542 -3% | 584 5% | 372.9 -33% | 560 1% |
| Write Seq Q32T1 (MB/s) | 2654 | 1139 -57% | 2235 -16% | 1894 -29% | 2392 -10% |
| Read Seq Q32T1 (MB/s) | 3137 | 3108 -1% | 3171 1% | 2828 -10% | 3232 3% |
| Teljes átlag (program / beállítások) | -2% /
-4% | 9% /
7% | -2% /
-1% | 17% /
18% |
* ... a kisebb jobb

Disk Throttling: DiskSpd Read Loop, Queue Depth 8
| 3DMark 11 | |
| 1280x720 Performance GPU | |
| Intel Core i9-10900K | |
| MSI GE63 Raider 8SG | |
| Asus Strix Scar 17 G732LXS | |
| Asus ROG Strix Scar 15 G532LWS | |
| Gigabyte Aero 15 OLED XB-8DE51B0SP | |
| Asus ROG Zephyrus Duo 15 GX550LXS | |
| Alienware m15 R3 P87F | |
| MSI GE65 Raider 9SF-049US | |
| Átlagos NVIDIA GeForce RTX 2070 Mobile (23335 - 27298, n=21) | |
| Dell G5 15 SE 5505 P89F | |
| Asus Zephyrus GX501 | |
| Razer Blade 15 RZ09-0328 | |
| Eluktronics RP-15 | |
| Maingear Vector 15 | |
| Acer Nitro 5 AN515-44-R5FT | |
| 1280x720 Performance Combined | |
| Intel Core i9-10900K | |
| Asus Strix Scar 17 G732LXS | |
| MSI GE65 Raider 9SF-049US | |
| Gigabyte Aero 15 OLED XB-8DE51B0SP | |
| Asus ROG Zephyrus Duo 15 GX550LXS | |
| Asus ROG Strix Scar 15 G532LWS | |
| Eluktronics RP-15 | |
| Alienware m15 R3 P87F | |
| Dell G5 15 SE 5505 P89F | |
| Átlagos NVIDIA GeForce RTX 2070 Mobile (8716 - 16364, n=21) | |
| Maingear Vector 15 | |
| Razer Blade 15 RZ09-0328 | |
| Acer Nitro 5 AN515-44-R5FT | |
| MSI GE63 Raider 8SG | |
| Asus Zephyrus GX501 | |
| 3DMark 11 Performance | 21233 pontok | |
| 3DMark Cloud Gate Standard Score | 41006 pontok | |
| 3DMark Fire Strike Score | 18127 pontok | |
| 3DMark Time Spy Score | 7818 pontok | |
Segítség | ||
| Shadow of the Tomb Raider - 1920x1080 Highest Preset AA:T | |
| Intel Core i9-10900K | |
| Asus ROG Strix Scar 15 G532LWS | |
| MSI GE65 Raider 9SF-049US | |
| Alienware m15 R3 P87F | |
| MSI GS66 Stealth 10SFS | |
| MSI GS75 10SF-609US | |
| Átlagos NVIDIA GeForce RTX 2070 Mobile (74.2 - 97, n=11) | |
| Razer Blade 15 RZ09-0328 | |
| Alienware m15 P79F | |
| Gigabyte Aero 15 OLED XA | |
| MSI GS66 Stealth 10SE-045 | |
| Eluktronics RP-15 | |
| Asus Zephyrus S GX502GW | |
| Dell G5 15 SE 5505 P89F | |
| Acer Nitro 5 AN515-44-R5FT | |
| The Witcher 3 - 1920x1080 Ultra Graphics & Postprocessing (HBAO+) | |
| Intel Core i9-10900K | |
| Asus ROG Strix Scar 15 G532LWS | |
| Alienware m15 R3 P87F | |
| MSI GE65 Raider 9SF-049US | |
| Átlagos NVIDIA GeForce RTX 2070 Mobile (64 - 82.1, n=21) | |
| MSI GS66 Stealth 10SFS | |
| Asus Zephyrus S GX502GW | |
| MSI GS75 10SF-609US | |
| Dell G5 15 SE 5505 P89F | |
| Alienware m15 P79F | |
| Gigabyte Aero 15 OLED XA | |
| MSI GS66 Stealth 10SE-045 | |
| Eluktronics RP-15 | |
| Asus Zephyrus GX501 | |
| Razer Blade 15 RZ09-0328 | |
| Maingear Vector 15 | |
| Asus ROG Strix G15 G512LI | |
| Acer Nitro 5 AN515-44-R5FT | |
| alacsony | közepes | magas | ultra | |
|---|---|---|---|---|
| The Witcher 3 (2015) | 356.7 | 249.9 | 149.8 | 81 |
| Dota 2 Reborn (2015) | 142 | 133 | 125 | 120 |
| X-Plane 11.11 (2018) | 96.1 | 87.3 | 71.9 | |
| Shadow of the Tomb Raider (2018) | 138 | 111 | 103 | 93 |
| Alienware m15 R3 P87F GeForce RTX 2070 Mobile, i7-10750H, 2x Micron 2200S 512 GB (RAID 0) | Alienware m15 R2 P87F GeForce RTX 2080 Max-Q, i7-9750H, 2x Toshiba XG6 KXG60ZNV512G (RAID 0) | Razer Blade 15 RZ09-0328 GeForce RTX 2070 Max-Q, i7-10750H, Lite-On CA5-8D512 | Asus Zephyrus S GX502GW GeForce RTX 2070 Mobile, i7-9750H, 2x Intel SSD 660p SSDPEKNW512G8 (RAID 0) | MSI GS66 Stealth 10SFS GeForce RTX 2070 Super Max-Q, i9-10980HK, Samsung SSD PM981 MZVLB1T0HALR | Asus ROG Strix Scar 15 G532LWS GeForce RTX 2070 Super Mobile, i9-10980HK, 2x Intel SSD 660p 1TB SSDPEKNW010T8 (RAID 0) | |
|---|---|---|---|---|---|---|
| Noise | -13% | -3% | -14% | -15% | -10% | |
| off / környezet * (dB) | 26.3 | 28.3 -8% | 28.4 -8% | 30 -14% | 30 -14% | 26.5 -1% |
| Idle Minimum * (dB) | 26.7 | 28.5 -7% | 28.4 -6% | 31 -16% | 32 -20% | 27.1 -1% |
| Idle Average * (dB) | 26.7 | 28.5 -7% | 28.4 -6% | 33 -24% | 34 -27% | 32.2 -21% |
| Idle Maximum * (dB) | 30.7 | 49 -60% | 31.7 -3% | 38 -24% | 39 -27% | 34 -11% |
| Load Average * (dB) | 40.2 | 49 -22% | 47.7 -19% | 50 -24% | 53 -32% | 52.4 -30% |
| Witcher 3 ultra * (dB) | 51 | 49 4% | 47.5 7% | 53 -4% | 48 6% | 57.5 -13% |
| Load Maximum * (dB) | 59.7 | 55 8% | 49.5 17% | 56 6% | 53 11% | 57.5 4% |
* ... a kisebb jobb
Zajszint
| Üresjárat |
| 26.7 / 26.7 / 30.7 dB(A) |
| Terhelés |
| 40.2 / 59.7 dB(A) |
 | ||
30 dB csendes 40 dB(A) hallható 50 dB(A) hangos |
||
min: | ||
(-) A felső oldalon a maximális hőmérséklet 55.8 °C / 132 F, összehasonlítva a 40.4 °C / 105 F átlagával , 21.2 és 68.8 °C között a Gaming osztálynál.
(-) Az alsó maximum 62 °C / 144 F-ig melegszik fel, összehasonlítva a 43.2 °C / 110 F átlagával
(±) Üresjáratban a felső oldal átlagos hőmérséklete 35.4 °C / 96 F, összehasonlítva a 33.9 °C / ### eszközátlaggal class_avg_f### F.
(±) A The Witcher 3 játék során a felső oldal átlaghőmérséklete 35.8 °C / 96 F, összehasonlítva a 33.9 °C / ## eszközátlaggal #class_avg_f### F.
(+) A csuklótámasz és az érintőpad hűvösebb, mint a bőr hőmérséklete, maximum 29.4 °C / 84.9 F, ezért hűvös tapintású.
(±) A hasonló eszközök csuklótámasz területének átlagos hőmérséklete 28.8 °C / 83.8 F volt (-0.6 °C / -1.1 F).
Alienware m15 R3 P87F hangelemzés
(+) | a hangszórók viszonylag hangosan tudnak játszani (89.5 dB)
Basszus 100 - 315 Hz
(-) | szinte nincs basszus – átlagosan 20.6%-kal alacsonyabb a mediánnál
(±) | a basszus linearitása átlagos (8.1% delta az előző frekvenciához)
Közepes 400-2000 Hz
(±) | csökkentett középértékek – átlagosan 6.6%-kal alacsonyabb, mint a medián
(+) | a középpontok lineárisak (6.7% delta az előző frekvenciához)
Maximum 2-16 kHz
(±) | magasabb csúcsok – átlagosan 5%-kal magasabb, mint a medián
(±) | a csúcsok linearitása átlagos (7.5% delta az előző gyakorisághoz)
Összességében 100 - 16.000 Hz
(±) | az általános hang linearitása átlagos (16.5% eltérés a mediánhoz képest)
Ugyanazon osztályhoz képest
» 42%Ebben az osztályban az összes tesztelt eszköz %-a jobb volt, 7% hasonló, 51%-kal rosszabb
» A legjobb delta értéke 6%, az átlag 18%, a legrosszabb 132% volt
Az összes tesztelt eszközzel összehasonlítva
» 28% az összes tesztelt eszköz jobb volt, 6% hasonló, 66%-kal rosszabb
» A legjobb delta értéke 4%, az átlag 23%, a legrosszabb 134% volt
Apple MacBook 12 (Early 2016) 1.1 GHz hangelemzés
(+) | a hangszórók viszonylag hangosan tudnak játszani (83.6 dB)
Basszus 100 - 315 Hz
(±) | csökkentett basszus – átlagosan 11.3%-kal alacsonyabb, mint a medián
(±) | a basszus linearitása átlagos (14.2% delta az előző frekvenciához)
Közepes 400-2000 Hz
(+) | kiegyensúlyozott középpontok – csak 2.4% választja el a mediántól
(+) | a középpontok lineárisak (5.5% delta az előző frekvenciához)
Maximum 2-16 kHz
(+) | kiegyensúlyozott csúcsok – csak 2% választja el a mediántól
(+) | a csúcsok lineárisak (4.5% delta az előző frekvenciához képest)
Összességében 100 - 16.000 Hz
(+) | általános hangzás lineáris (10.2% eltérés a mediánhoz képest)
Ugyanazon osztályhoz képest
» 7%Ebben az osztályban az összes tesztelt eszköz %-a jobb volt, 2% hasonló, 90%-kal rosszabb
» A legjobb delta értéke 5%, az átlag 18%, a legrosszabb 53% volt
Az összes tesztelt eszközzel összehasonlítva
» 5% az összes tesztelt eszköz jobb volt, 1% hasonló, 94%-kal rosszabb
» A legjobb delta értéke 4%, az átlag 23%, a legrosszabb 134% volt
| Kikapcsolt állapot / Készenlét | |
| Üresjárat | |
| Terhelés |
|
Kulcs:
min: | |
| Alienware m15 R3 P87F i7-10750H, GeForce RTX 2070 Mobile, IPS, 1920x1080, 15.6" | Alienware m15 P79F i7-8750H, GeForce RTX 2070 Max-Q, OLED, 3840x2160, 15.6" | Eluktronics RP-15 R7 4800H, GeForce RTX 2060 Mobile, IPS, 1920x1080, 15.6" | Razer Blade 15 RZ09-0328 i7-10750H, GeForce RTX 2070 Max-Q, AMOLED, 3840x2160, 15.6" | Asus Zephyrus S GX502GW i7-9750H, GeForce RTX 2070 Mobile, IPS, 1920x1080, 15.6" | MSI GS66 Stealth 10SFS i9-10980HK, GeForce RTX 2070 Super Max-Q, IPS, 1920x1080, 15.6" | MSI GP65 10SFK-047US i7-10750H, GeForce RTX 2070 Mobile, IPS, 1920x1080, 15.6" | |
|---|---|---|---|---|---|---|---|
| Power Consumption | 45% | 31% | 41% | 25% | 39% | 38% | |
| Idle Minimum * (Watt) | 34 | 10.9 68% | 21.7 36% | 11.1 67% | 24 29% | 13 62% | 14.2 58% |
| Idle Average * (Watt) | 48.6 | 12.3 75% | 30.1 38% | 13.7 72% | 27 44% | 16 67% | 18.8 61% |
| Idle Maximum * (Watt) | 58.2 | 19 67% | 35 40% | 33.4 43% | 33 43% | 27 54% | 23.9 59% |
| Load Average * (Watt) | 129.4 | 96 26% | 112.6 13% | 104.4 19% | 129 -0% | 109 16% | 96.9 25% |
| Witcher 3 ultra * (Watt) | 214.5 | 161.7 25% | 134.4 37% | 159.9 25% | 176 18% | 155 28% | 185 14% |
| Load Maximum * (Watt) | 257.3 | 229.1 11% | 201.5 22% | 203.8 21% | 216 16% | 236 8% | 233.4 9% |
* ... a kisebb jobb
| Alienware m15 R3 P87F i7-10750H, GeForce RTX 2070 Mobile, 86 Wh | Alienware m15 P79F i7-8750H, GeForce RTX 2070 Max-Q, 90 Wh | Eluktronics RP-15 R7 4800H, GeForce RTX 2060 Mobile, 46.7 Wh | Razer Blade 15 RZ09-0328 i7-10750H, GeForce RTX 2070 Max-Q, 65 Wh | Asus Zephyrus S GX502GW i7-9750H, GeForce RTX 2070 Mobile, 76 Wh | MSI GS66 Stealth 10SFS i9-10980HK, GeForce RTX 2070 Super Max-Q, 99.99 Wh | |
|---|---|---|---|---|---|---|
| Akkumulátor üzemidő | 86% | 29% | 43% | 31% | 110% | |
| Reader / Idle (h) | 5 | 5.9 18% | 8.4 68% | |||
| WiFi v1.3 (h) | 2.8 | 5.2 86% | 3.6 29% | 4 43% | 3.7 32% | 6.1 118% |
| Load (h) | 0.7 | 1 43% | 1.7 143% |
Pro
Kontra
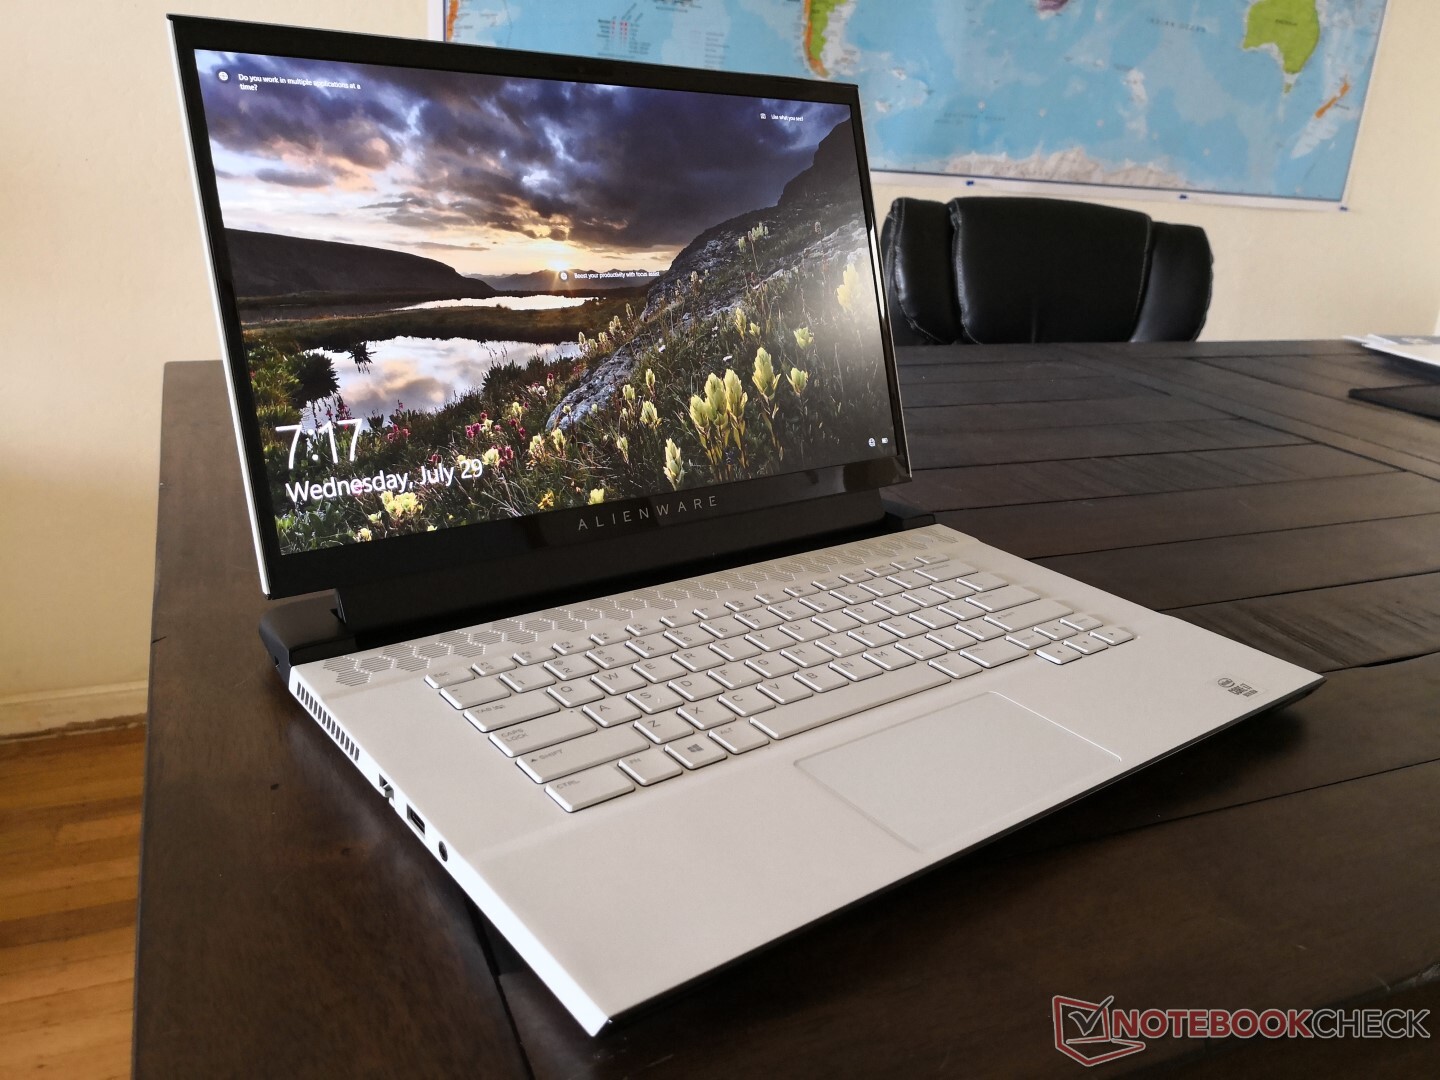
Külsőleg az Alienware m15 R3 legfeljebb csak egy apró frissítésnek tűnik a tavalyi m15 R2-höz képest. Ehelyett minden nagy változás a belsőben történt, és ez valahol kár, mivel a felhasználók többségének mindez fel sem fog tűnni. A Dell közvetlenül megoldja az m15 R2 egyik legnagyobb problémáját az m15 R3-mal, azáltal, hogy egy sokkal erősebb hűtési megoldást alkalmaz, és a belső hőmérsékletet legalább 20 C-fokkal csökkenti játszás közben. Adjuk hozzá az új CPU és GPU opciókat, és egy olyan rendszert kapunk, amely gyorsabban és hűvösebben fut, mint legközelebbi elődje, annak ellenére, hogy külsőleg szinte ugyanúgy néz ki. Röviden fogalmazva, az Alienware m15 R3 olyan, amilyen az m15 R2 kellett volna legyen.
A tavalyi modell legnagyobb problémája ezáltal megoldódott, így most itt az ideje, hogy a rendszer egyéb aspektusain javítsanak. Különösen a ventilátorzaj az, ami nem változott, és ez azt jelenti, hogy játszás közben még mindig szükség lehet egy jó fejhallgatóra. A vékony és könnyű váz nem annyira vékony és könnyű, mint mások ebben a kategóriában, és a gőzkamra beépítése miatt a rendszer valamivel súlyosabb lett, mint előtte. A nagyon nagy energiafogyasztás és a rövid üzemidő miatt a rendszer nem túl jó választás az utazóknak sem, olyanokhoz képest, mint az MSI GS66 vagy a Razer Blade 15, amelyek szinte ugyanazokat a CPU és GPU opciókat kínálják, mint a mi Dell gépünk.
Összességében az Alienware m15 R3 lényeges javulás az m15 R2-höz képest, főleg ami a belső hőmérsékletet illeti. Az új processzor opciókat szintén szívesen látjuk, viszont majdnem minden egyéb marad ugyanúgy, ahogy a tavalyi m15 R2 modellnél volt, tehát a hátrányok többsége is.
Alienware m15 R3 P87F
- 07/31/2020 v7 (old)
Allen Ngo
Price comparison

