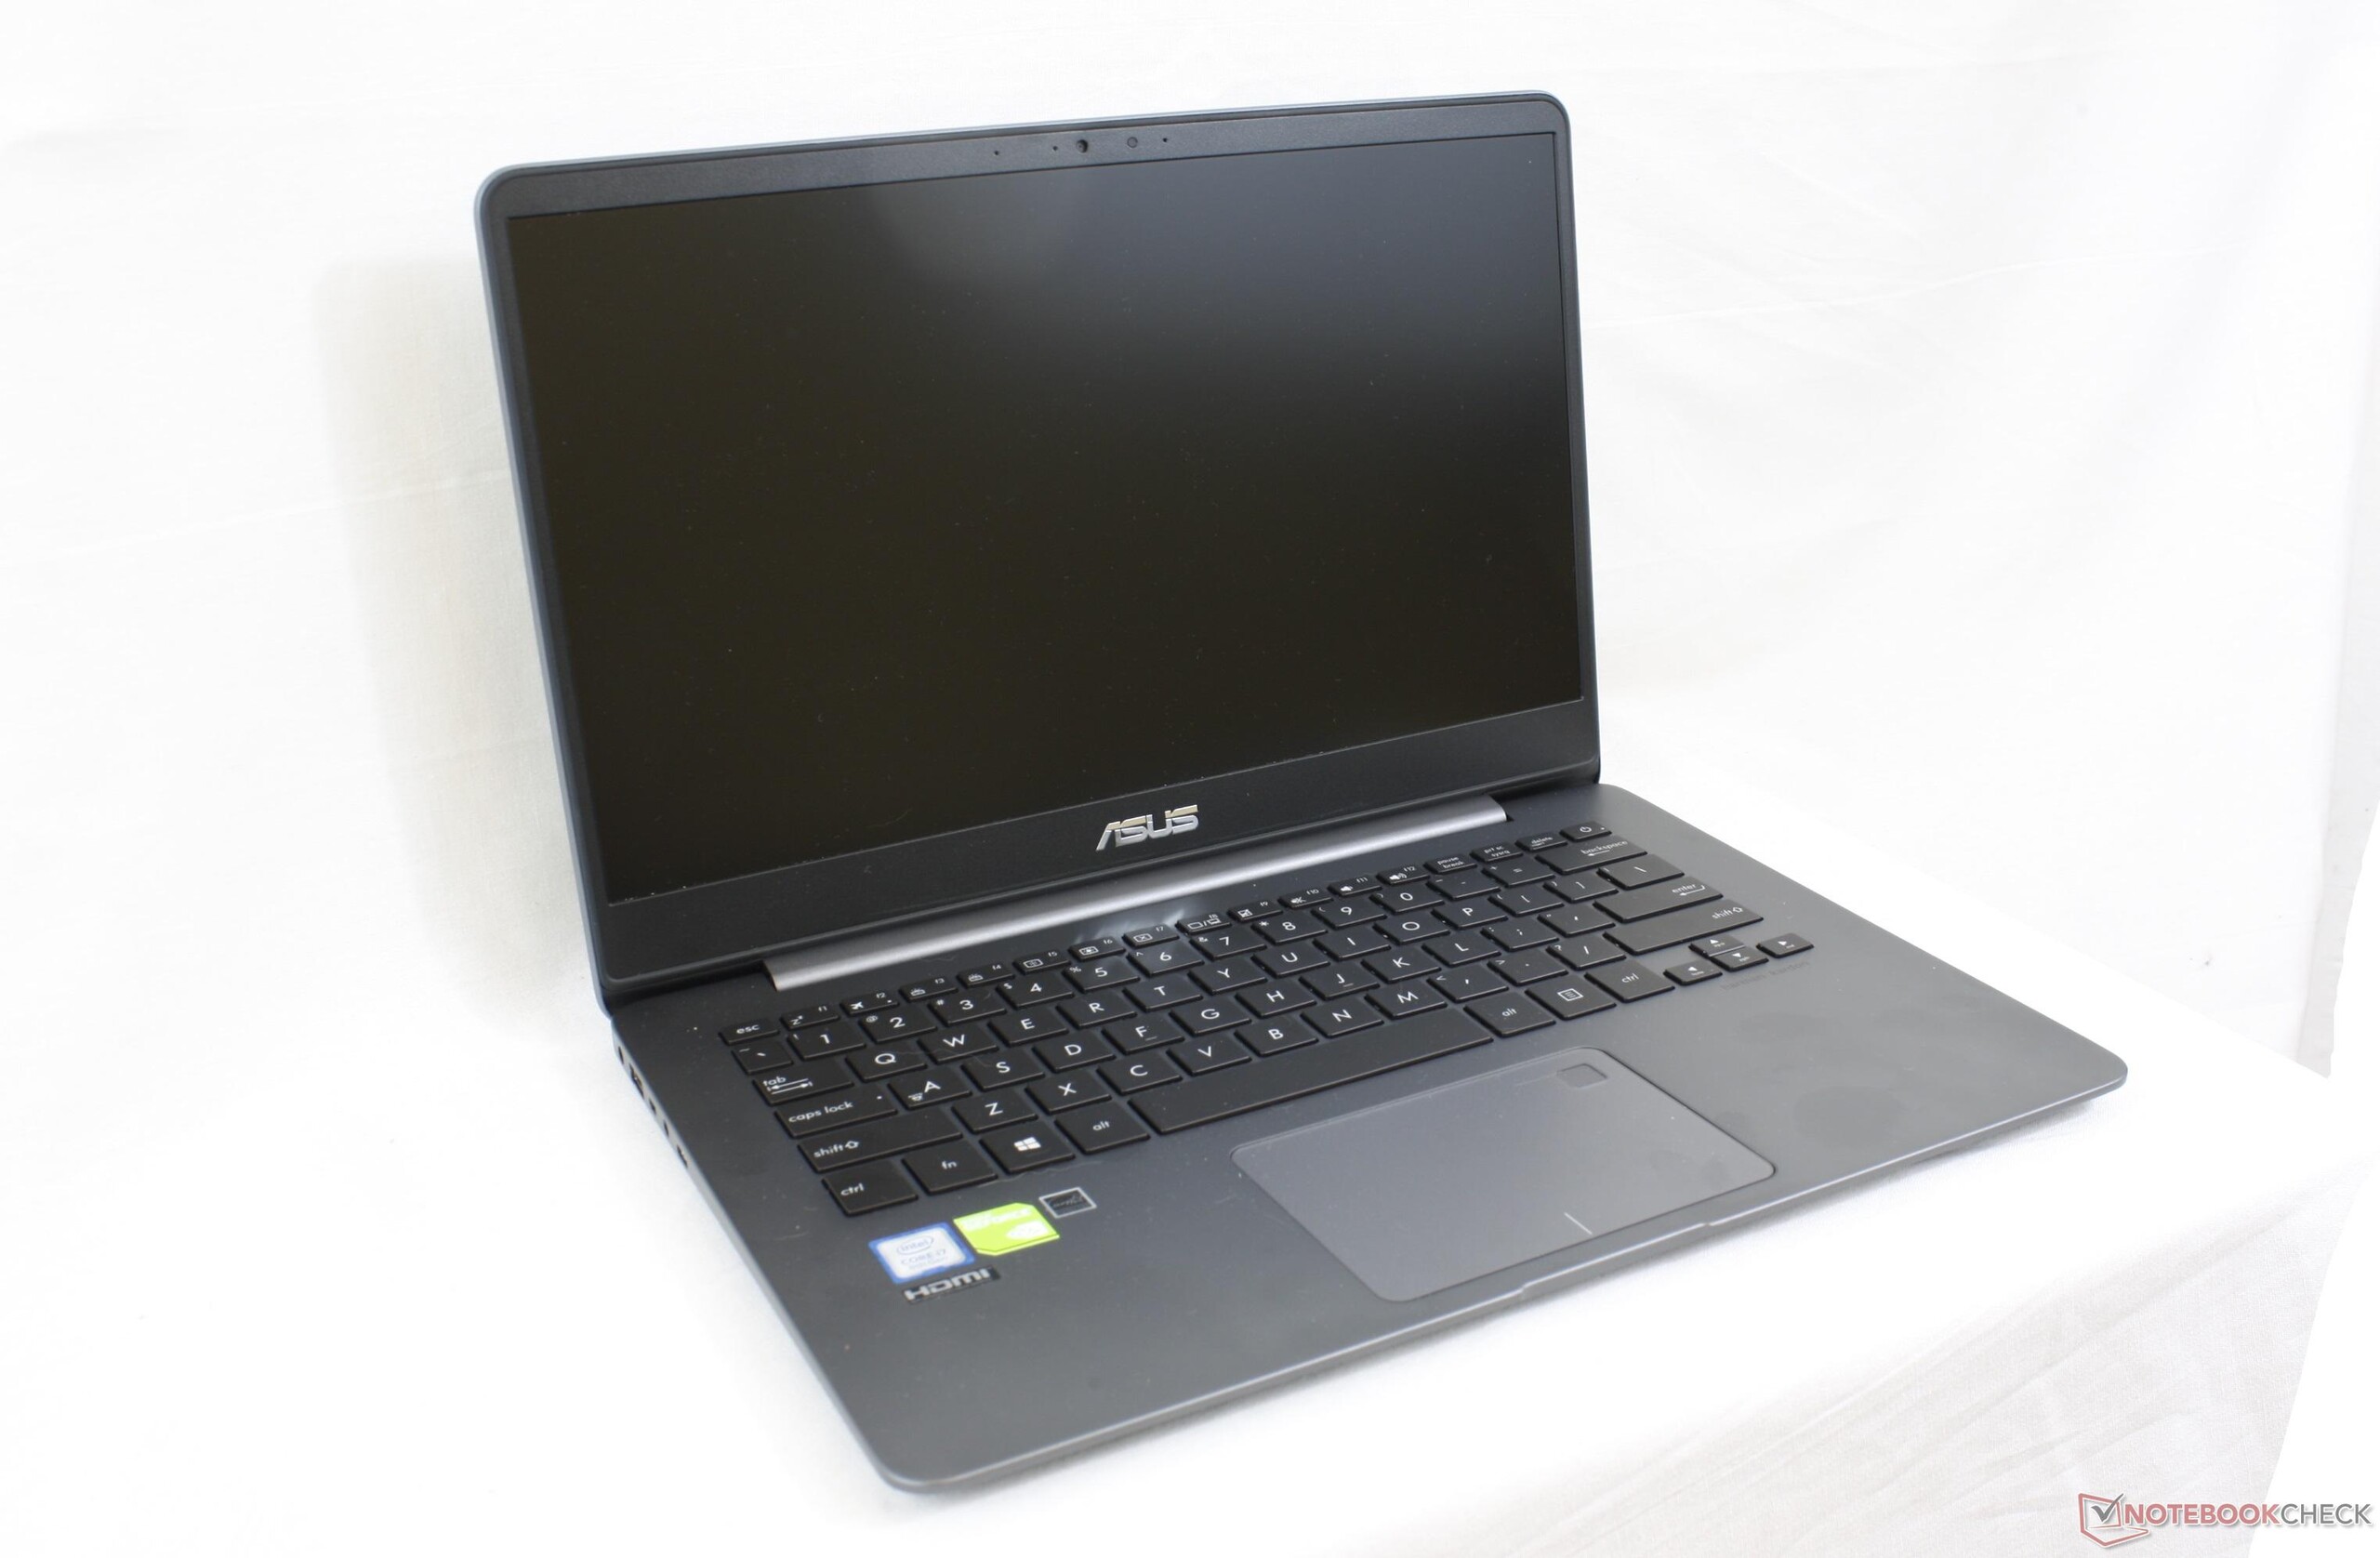
Asus ZenBook UX430UN (i7-8550U, GeForce MX150) Laptop rövid értékelés
| SD Card Reader | |
| average JPG Copy Test (av. of 3 runs) | |
| Dell XPS 13 9370 i5 UHD (Toshiba Exceria Pro M501 64 GB UHS-II) | |
| Samsung Notebook 9 NP900X5T-X01US (Toshiba Exceria Pro M501 UHS-II) | |
| Asus Zenbook UX430UN (Toshiba Exceria Pro SDXC 64 GB UHS-II) | |
| maximum AS SSD Seq Read Test (1GB) | |
| Dell XPS 13 9370 i5 UHD (Toshiba Exceria Pro M501 64 GB UHS-II) | |
| Samsung Notebook 9 NP900X5T-X01US (Toshiba Exceria Pro M501 UHS-II) | |
| Asus Zenbook UX430UN (Toshiba Exceria Pro SDXC 64 GB UHS-II) | |
| Networking | |
| iperf3 transmit AX12 | |
| Dell XPS 13 9370 i5 UHD | |
| Samsung Notebook 9 NP900X5T-X01US | |
| Asus Zenbook UX430UN | |
| iperf3 receive AX12 | |
| Samsung Notebook 9 NP900X5T-X01US | |
| Asus Zenbook UX430UN | |
| Dell XPS 13 9370 i5 UHD | |
| |||||||||||||||||||||||||
Fényerő megoszlás: 89 %
Centrumban: 310.4 cd/m²
Kontraszt: 1001:1 (Fekete: 0.31 cd/m²)
ΔE ColorChecker Calman: 4.07 | ∀{0.5-29.43 Ø4.71}
calibrated: 4.07
ΔE Greyscale Calman: 2.8 | ∀{0.09-98 Ø4.96}
84.6% sRGB (Argyll 1.6.3 3D)
55.3% AdobeRGB 1998 (Argyll 1.6.3 3D)
62% AdobeRGB 1998 (Argyll 3D)
84.8% sRGB (Argyll 3D)
64.6% Display P3 (Argyll 3D)
Gamma: 2.217
CCT: 7033 K
| Asus Zenbook UX430UN NV140FHM-N62, BOE0718, IPS, 14", 1920x1080 | Dell XPS 13 9370 i5 UHD ID: Sharp SHP148B, Name: LQ133D1, Dell P/N: 8XDHY, IPS, 13.3", 3840x2160 | Samsung Notebook 9 NP900X5T-X01US ID: BOE06E8, Name: BOE HF NV150FHB-N31, IPS, 15", 1920x1080 | Asus Zenbook 3 Deluxe UX490UA AU Optronics AUO383D / B140HAN03.8, IPS, 14", 1920x1080 | Huawei MateBook X Chi Mei CMN8201 / P130ZDZ-EF1, , 13.3", 2160x1440 | Microsoft Surface Laptop i5 ID: MEI96A2, Name: Panasonic VVX14T092N00, IPS, 13.5", 2256x1504 | |
|---|---|---|---|---|---|---|
| Display | 12% | 8% | -3% | 8% | 9% | |
| Display P3 Coverage (%) | 64.6 | 68.9 7% | 65.2 1% | 58.7 -9% | 65.8 2% | 67.8 5% |
| sRGB Coverage (%) | 84.8 | 98.4 16% | 97.4 15% | 86.9 2% | 96.2 13% | 94.3 11% |
| AdobeRGB 1998 Coverage (%) | 62 | 69.5 12% | 66.8 8% | 59.9 -3% | 66.8 8% | 69.5 12% |
| Response Times | -30% | 9% | 37% | 32% | -6% | |
| Response Time Grey 50% / Grey 80% * (ms) | 43.6 ? | 67.2 ? -54% | 46 ? -6% | 24 ? 45% | 33 ? 24% | 50.8 ? -17% |
| Response Time Black / White * (ms) | 39.2 ? | 41.6 ? -6% | 29.6 ? 24% | 28 ? 29% | 24 ? 39% | 37.2 ? 5% |
| PWM Frequency (Hz) | 200 ? | 2500 ? | 2976 ? | |||
| Screen | 11% | -2% | 2% | 20% | 23% | |
| Brightness middle (cd/m²) | 310.4 | 496.4 60% | 558.2 80% | 337 9% | 408 31% | 384.2 24% |
| Brightness (cd/m²) | 303 | 469 55% | 528 74% | 295 -3% | 395 30% | 378 25% |
| Brightness Distribution (%) | 89 | 84 -6% | 92 3% | 81 -9% | 88 -1% | 90 1% |
| Black Level * (cd/m²) | 0.31 | 0.5 -61% | 0.46 -48% | 0.21 32% | 0.45 -45% | 0.36 -16% |
| Contrast (:1) | 1001 | 993 -1% | 1213 21% | 1605 60% | 907 -9% | 1067 7% |
| Colorchecker dE 2000 * | 4.07 | 2.9 29% | 4.41 -8% | 4.89 -20% | 1.55 62% | 1.8 56% |
| Colorchecker dE 2000 max. * | 8.33 | 5.26 37% | 10.91 -31% | 8.43 -1% | 2.19 74% | 4.2 50% |
| Colorchecker dE 2000 calibrated * | 4.07 | |||||
| Greyscale dE 2000 * | 2.8 | 3.9 -39% | 6.6 -136% | 4.28 -53% | 1.91 32% | 1.2 57% |
| Gamma | 2.217 99% | 2.066 106% | 2.19 100% | 2.25 98% | 2.34 94% | 2.21 100% |
| CCT | 7033 92% | 7169 91% | 7615 85% | 7352 88% | 6491 100% | 6708 97% |
| Color Space (Percent of AdobeRGB 1998) (%) | 55.3 | 63.9 16% | 61.3 11% | 56 1% | 61 10% | 63.7 15% |
| Color Space (Percent of sRGB) (%) | 84.6 | 98.2 16% | 97.2 15% | 87 3% | 96 13% | 94.2 11% |
| Teljes átlag (program / beállítások) | -2% /
5% | 5% /
2% | 12% /
6% | 20% /
19% | 9% /
16% |
* ... a kisebb jobb
Megjelenítési válaszidők
| ↔ Válaszidő Fekete-fehér | ||
|---|---|---|
| 39.2 ms ... emelkedés és süllyedés ↘ kombinálva | ↗ 22.8 ms emelkedés | 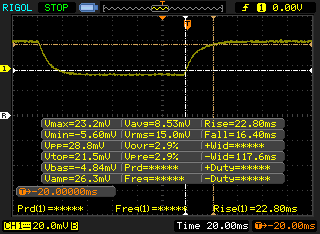 |
| ↘ 16.4 ms ősz | ||
| A képernyő lassú reakciósebességet mutat tesztjeinkben, és nem lesz kielégítő a játékosok számára. Összehasonlításképpen, az összes tesztelt eszköz 0.1 (minimum) és 240 (maximum) ms között mozog. » 97 % of all devices are better. Ez azt jelenti, hogy a mért válaszidő rosszabb, mint az összes vizsgált eszköz átlaga (19.8 ms). | ||
| ↔ Válaszidő 50% szürke és 80% szürke között | ||
| 43.6 ms ... emelkedés és süllyedés ↘ kombinálva | ↗ 24.4 ms emelkedés | 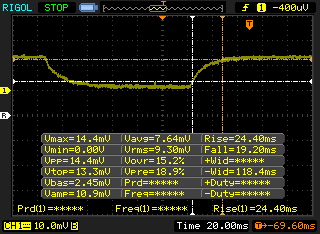 |
| ↘ 19.2 ms ősz | ||
| A képernyő lassú reakciósebességet mutat tesztjeinkben, és nem lesz kielégítő a játékosok számára. Összehasonlításképpen, az összes tesztelt eszköz 0.165 (minimum) és 636 (maximum) ms között mozog. » 73 % of all devices are better. Ez azt jelenti, hogy a mért válaszidő rosszabb, mint az összes vizsgált eszköz átlaga (31 ms). | ||
Képernyő villogása / PWM (impulzusszélesség-moduláció)
| Képernyő villogása / PWM észlelve | 200 Hz | ≤ 99 % fényerő beállítása | 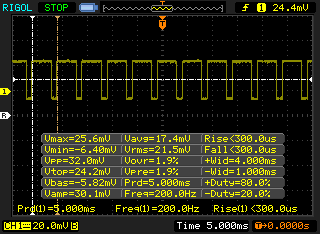 |
A kijelző háttérvilágítása 200 Hz-en villog (a legrosszabb esetben, pl. PWM használatával) Villódzás észlelve a 99 % vagy annál kisebb fényerő-beállításnál. E fényerő-beállítás felett nem lehet villogás vagy PWM. A 200 Hz frekvenciája viszonylag alacsony, így az érzékeny felhasználók valószínűleg villogást észlelnek, és megerőltetik a szemüket a megadott és az alatti fényerő-beállítás mellett. Összehasonlításképpen: az összes tesztelt eszköz 52 %-a nem használja a PWM-et a kijelző elsötétítésére. Ha PWM-et észleltek, akkor átlagosan 7754 (minimum: 5 - maximum: 343500) Hz-t mértek. | |||
| Cinebench R15 | |
| CPU Single 64Bit | |
| Eurocom Tornado F5 Killer Edition | |
| Asus Zenbook UX430UN | |
| Átlagos Intel Core i7-8550U (108 - 172, n=76) | |
| Samsung Notebook 9 NP900X5T-X01US | |
| Lenovo ThinkPad T480s-20L8S02D00 | |
| Asus Strix GL703VM-DB74 | |
| Asus ZenBook UX530UX-FY070T | |
| Alienware 13 R3 (i5-7300HQ, GTX 1050 Ti) | |
| Lenovo Ideapad 720S-13ARR | |
| Asus Zenbook UX310UQ-GL011T | |
| Lenovo IdeaPad 320s-14IKB | |
| Asus ASUSPRO Essential P2520LA-XO0167H | |
| CPU Multi 64Bit | |
| Lenovo ThinkPad T480s-20L8S02D00 | |
| Lenovo ThinkPad T480s-20L8S02D00 | |
| Asus Strix GL703VM-DB74 | |
| Eurocom Tornado F5 Killer Edition | |
| Asus Zenbook UX430UN | |
| Átlagos Intel Core i7-8550U (301 - 761, n=78) | |
| Samsung Notebook 9 NP900X5T-X01US | |
| Lenovo Ideapad 720S-13ARR | |
| Alienware 13 R3 (i5-7300HQ, GTX 1050 Ti) | |
| Lenovo IdeaPad 320s-14IKB | |
| Asus Zenbook UX310UQ-GL011T | |
| Asus ZenBook UX530UX-FY070T | |
| Asus ASUSPRO Essential P2520LA-XO0167H | |
| Cinebench R11.5 | |
| CPU Single 64Bit | |
| Eurocom Tornado F5 Killer Edition | |
| Samsung Notebook 9 NP900X5T-X01US | |
| Átlagos Intel Core i7-8550U (1.43 - 1.95, n=32) | |
| Asus Zenbook UX430UN | |
| Asus Strix GL703VM-DB74 | |
| Asus Zenbook UX310UQ-GL011T | |
| Asus ASUSPRO Essential P2520LA-XO0167H | |
| CPU Multi 64Bit | |
| Eurocom Tornado F5 Killer Edition | |
| Asus Strix GL703VM-DB74 | |
| Asus Zenbook UX430UN | |
| Átlagos Intel Core i7-8550U (4.38 - 8.56, n=32) | |
| Samsung Notebook 9 NP900X5T-X01US | |
| Asus Zenbook UX310UQ-GL011T | |
| Asus ASUSPRO Essential P2520LA-XO0167H | |
| Cinebench R10 | |
| Rendering Multiple CPUs 32Bit | |
| Eurocom Tornado F5 Killer Edition | |
| Asus Strix GL703VM-DB74 | |
| Asus Zenbook UX430UN | |
| Átlagos Intel Core i7-8550U (11694 - 24180, n=31) | |
| Samsung Notebook 9 NP900X5T-X01US | |
| Lenovo IdeaPad 320s-14IKB | |
| Asus Zenbook UX310UQ-GL011T | |
| Asus ASUSPRO Essential P2520LA-XO0167H | |
| Rendering Single 32Bit | |
| Eurocom Tornado F5 Killer Edition | |
| Asus Zenbook UX430UN | |
| Samsung Notebook 9 NP900X5T-X01US | |
| Átlagos Intel Core i7-8550U (4202 - 8211, n=31) | |
| Asus Strix GL703VM-DB74 | |
| Lenovo IdeaPad 320s-14IKB | |
| Asus Zenbook UX310UQ-GL011T | |
| Asus ASUSPRO Essential P2520LA-XO0167H | |
| wPrime 2.10 - 1024m | |
| Átlagos Intel Core i7-8550U (258 - 435, n=11) | |
| Samsung Notebook 9 NP900X5T-X01US | |
| Asus Zenbook UX430UN | |
| Eurocom Tornado F5 Killer Edition | |
| Asus Strix GL703VM-DB74 | |
* ... a kisebb jobb
| PCMark 8 | |
| Home Score Accelerated v2 | |
| Samsung Notebook 9 NP900X5T-X01US | |
| Asus Zenbook UX430UN | |
| Átlagos Intel Core i7-8550U, NVIDIA GeForce MX150 (3145 - 4130, n=21) | |
| Asus Zenbook 3 Deluxe UX490UA | |
| Dell XPS 13 9370 i5 UHD | |
| Work Score Accelerated v2 | |
| Samsung Notebook 9 NP900X5T-X01US | |
| Átlagos Intel Core i7-8550U, NVIDIA GeForce MX150 (4063 - 5228, n=20) | |
| Asus Zenbook UX430UN | |
| Asus Zenbook 3 Deluxe UX490UA | |
| Dell XPS 13 9370 i5 UHD | |
| Creative Score Accelerated v2 | |
| Samsung Notebook 9 NP900X5T-X01US | |
| Asus Zenbook UX430UN | |
| Átlagos Intel Core i7-8550U, NVIDIA GeForce MX150 (4643 - 5550, n=9) | |
| Dell XPS 13 9370 i5 UHD | |
| PCMark 10 - Score | |
| Samsung Notebook 9 NP900X5T-X01US | |
| Asus Zenbook UX430UN | |
| Dell XPS 13 9370 i5 UHD | |
| Átlagos Intel Core i7-8550U, NVIDIA GeForce MX150 (3056 - 4106, n=19) | |
| Asus Zenbook 3 Deluxe UX490UA | |
| PCMark 8 Home Score Accelerated v2 | 3792 pontok | |
| PCMark 8 Creative Score Accelerated v2 | 5153 pontok | |
| PCMark 8 Work Score Accelerated v2 | 4732 pontok | |
| PCMark 10 Score | 3858 pontok | |
Segítség | ||
| Asus Zenbook UX430UN SanDisk SD8SN8U512G1002 | Dell XPS 13 9370 i5 UHD Toshiba XG5 KXG50ZNV256G | Samsung Notebook 9 NP900X5T-X01US Samsung PM961 MZVLW256HEHP | Asus Zenbook 3 Deluxe UX490UA Micron 1100 MTFDDAV256TBN | Asus ZenBook 13 UX331UN SK Hynix HFS256G39TND-N210A | Microsoft Surface Laptop i5 Toshiba THNSN0128GTYA | |
|---|---|---|---|---|---|---|
| AS SSD | 131% | 184% | 15% | -16% | -74% | |
| Copy Game MB/s (MB/s) | 225.1 | 291.4 29% | 1058 370% | 154.1 -32% | 80.5 -64% | |
| Copy Program MB/s (MB/s) | 270.5 | 207 -23% | 479.5 77% | 129.7 -52% | 62.7 -77% | |
| Copy ISO MB/s (MB/s) | 467.6 | 357.4 -24% | 1751 274% | 192.4 -59% | 87.1 -81% | |
| Score Total (Points) | 926 | 2437 163% | 2646 186% | 855 -8% | 991 7% | 309 -67% |
| Score Write (Points) | 261 | 1135 335% | 628 141% | 382 46% | 323 24% | 86 -67% |
| Score Read (Points) | 441 | 894 103% | 1367 210% | 308 -30% | 445 1% | 157 -64% |
| Access Time Write * (ms) | 0.088 | 0.038 57% | 0.032 64% | 0.056 36% | 0.23 -161% | 0.369 -319% |
| Access Time Read * (ms) | 0.089 | 0.063 29% | 0.054 39% | 0.09 -1% | 0.09 -1% | 0.128 -44% |
| 4K-64 Write (MB/s) | 183.5 | 937 411% | 392.6 114% | 257.5 40% | 233.1 27% | 35.48 -81% |
| 4K-64 Read (MB/s) | 366 | 657 80% | 1085 196% | 234.5 -36% | 368.4 1% | 80.4 -78% |
| 4K Write (MB/s) | 47.88 | 107.2 124% | 115 140% | 77.2 61% | 68.9 44% | 39.07 -18% |
| 4K Read (MB/s) | 25.39 | 33.81 33% | 48.71 92% | 24.89 -2% | 27.98 10% | 20.15 -21% |
| Seq Write (MB/s) | 300.3 | 907 202% | 1206 302% | 470 57% | 213.7 -29% | 117.2 -61% |
| Seq Read (MB/s) | 494.4 | 2037 312% | 2337 373% | 487.2 -1% | 483.7 -2% | 561 13% |
* ... a kisebb jobb

| 3DMark | |
| 1280x720 Cloud Gate Standard Graphics | |
| Az osztály átlaga Multimedia (16765 - 143501, n=32, az elmúlt 2 évben) | |
| Dell Inspiron 15 7000 7577 | |
| Asus Zenbook UX510UW-CN044T | |
| Acer Aspire E5-575G-549D | |
| MSI PL62 MX150 7700HQ | |
| Átlagos NVIDIA GeForce MX150 (16227 - 22183, n=43) | |
| Asus Zenbook UX430UN | |
| Apple MacBook Pro 13 2017 | |
| Microsoft Surface Pro (2017) i7 | |
| Asus VivoBook S410UQ-NH74 | |
| Dell Latitude 5590 | |
| Lenovo Ideapad 720S-13ARR | |
| 1920x1080 Fire Strike Graphics | |
| Az osztály átlaga Multimedia (2328 - 48907, n=58, az elmúlt 2 évben) | |
| Dell Inspiron 15 7000 7577 | |
| Asus Zenbook UX510UW-CN044T | |
| MSI PL62 MX150 7700HQ | |
| Acer Aspire E5-575G-549D | |
| Átlagos NVIDIA GeForce MX150 (2323 - 3739, n=44) | |
| Asus Zenbook UX430UN | |
| Asus VivoBook S410UQ-NH74 | |
| Apple MacBook Pro 13 2017 | |
| Microsoft Surface Pro (2017) i7 | |
| Lenovo Ideapad 720S-13ARR | |
| Dell Latitude 5590 | |
| 3DMark 11 Performance | 4160 pontok | |
| 3DMark Ice Storm Standard Score | 44383 pontok | |
| 3DMark Cloud Gate Standard Score | 12367 pontok | |
| 3DMark Fire Strike Score | 2874 pontok | |
| 3DMark Fire Strike Extreme Score | 1437 pontok | |
Segítség | ||
| alacsony | közepes | magas | ultra | |
|---|---|---|---|---|
| BioShock Infinite (2013) | 141.4 | 77.2 | 66.9 | 28.9 |
| Metro: Last Light (2013) | 85.7 | 61.4 | 36.4 | 21.6 |
| Thief (2014) | 61 | 35.8 | 30.2 | 16.7 |
| The Witcher 3 (2015) | 32 | |||
| Batman: Arkham Knight (2015) | 41 | 36 | 16 | |
| Metal Gear Solid V (2015) | 60 | 60 | 34 | 24 |
| Fallout 4 (2015) | 51 | 35.7 | 19.2 | 14.9 |
| Rise of the Tomb Raider (2016) | 44.9 | 31.7 | 16.4 | 14.8 |
| Ashes of the Singularity (2016) | 25.7 | 15 | 12.8 | |
| Overwatch (2016) | 121.2 | 75.4 | 38.2 | 32.4 |
| Final Fantasy XV Benchmark (2018) | 25.4 | 12.6 | 7 |
Zajszint
| Üresjárat |
| 28.9 / 30 / 30.2 dB(A) |
| Terhelés |
| 41.8 / 42 dB(A) |
 | ||
30 dB csendes 40 dB(A) hallható 50 dB(A) hangos |
||
min: | ||
| Asus Zenbook UX430UN GeForce MX150, i5-8550U, SanDisk SD8SN8U512G1002 | Dell XPS 13 9370 i5 UHD UHD Graphics 620, i5-8250U, Toshiba XG5 KXG50ZNV256G | Samsung Notebook 9 NP900X5T-X01US GeForce MX150, i5-8550U, Samsung PM961 MZVLW256HEHP | Asus Zenbook 3 Deluxe UX490UA HD Graphics 620, i5-7200U, Micron 1100 MTFDDAV256TBN | Lenovo Yoga 920-13IKB-80Y7 UHD Graphics 620, i5-8550U, Samsung PM961 MZVLW256HEHP | Apple MacBook Pro 15 2017 (2.9 GHz, 560) Radeon Pro 560, i7-7820HQ | |
|---|---|---|---|---|---|---|
| Noise | 6% | 1% | 3% | 7% | 1% | |
| off / környezet * (dB) | 28.3 | 29 -2% | 29.6 -5% | 30.2 -7% | 28 1% | 30.8 -9% |
| Idle Minimum * (dB) | 28.9 | 29 -0% | 29.6 -2% | 30.2 -4% | 28 3% | 31 -7% |
| Idle Average * (dB) | 30 | 29 3% | 29.6 1% | 30.2 -1% | 28.8 4% | 31 -3% |
| Idle Maximum * (dB) | 30.2 | 29 4% | 30.3 -0% | 31.2 -3% | 30.3 -0% | 31 -3% |
| Load Average * (dB) | 41.8 | 32 23% | 40 4% | 35.7 15% | 34.5 17% | 31.3 25% |
| Witcher 3 ultra * (dB) | 42 | 40 5% | ||||
| Load Maximum * (dB) | 42 | 40.1 5% | 40 5% | 34.2 19% | 34.3 18% | 41.8 -0% |
* ... a kisebb jobb
(±) A felső oldalon a maximális hőmérséklet 43.6 °C / 110 F, összehasonlítva a 36.8 °C / 98 F átlagával , 21 és 71 °C között a Multimedia osztálynál.
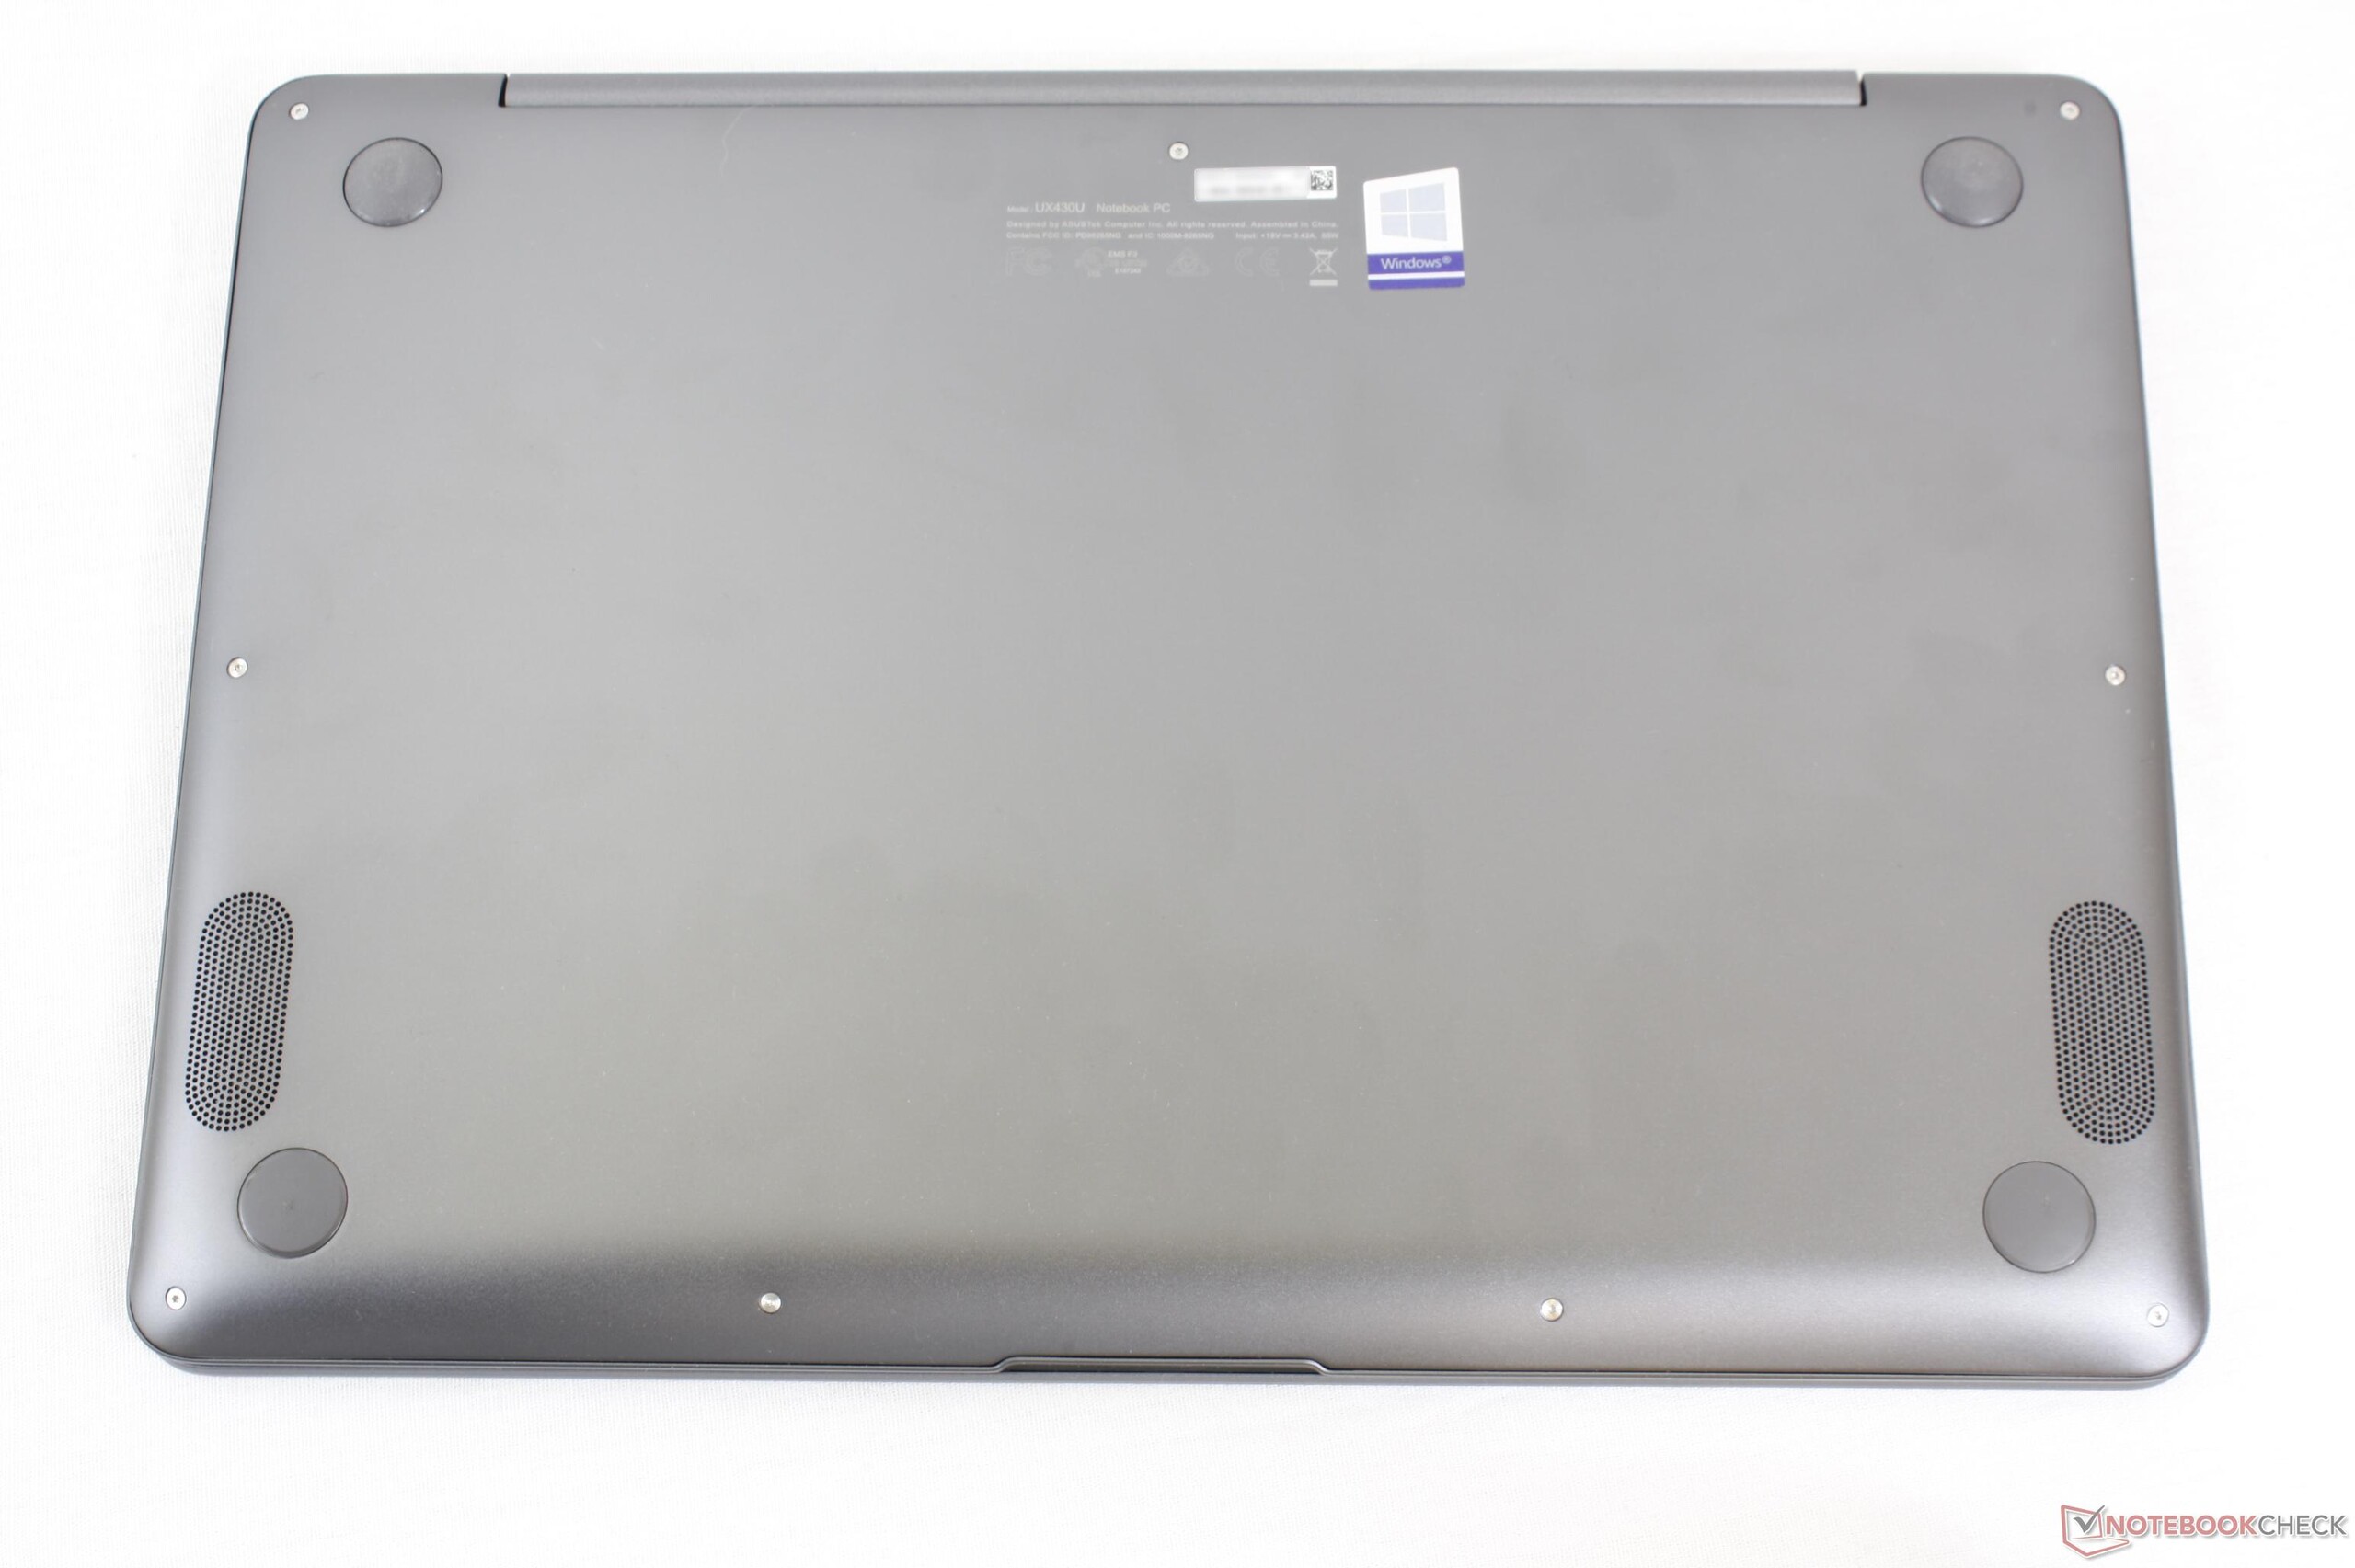
(±) Az alsó maximum 44 °C / 111 F-ig melegszik fel, összehasonlítva a 39.1 °C / 102 F átlagával
(+) Üresjáratban a felső oldal átlagos hőmérséklete 21.5 °C / 71 F, összehasonlítva a 31.3 °C / ### eszközátlaggal class_avg_f### F.
(+) A The Witcher 3 játék során a felső oldal átlaghőmérséklete 31.1 °C / 88 F, összehasonlítva a 31.3 °C / ## eszközátlaggal #class_avg_f### F.
(+) A csuklótámasz és az érintőpad hűvösebb, mint a bőr hőmérséklete, maximum 30.6 °C / 87.1 F, ezért hűvös tapintású.
(±) A hasonló eszközök csuklótámasz területének átlagos hőmérséklete 28.7 °C / 83.7 F volt (-1.9 °C / -3.4 F).
Asus Zenbook UX430UN hangelemzés
(-) | nem túl hangos hangszórók (64.5 dB)
Basszus 100 - 315 Hz
(-) | szinte nincs basszus – átlagosan 21.3%-kal alacsonyabb a mediánnál
(±) | a basszus linearitása átlagos (12.6% delta az előző frekvenciához)
Közepes 400-2000 Hz
(+) | kiegyensúlyozott középpontok – csak 3.4% választja el a mediántól
(+) | a középpontok lineárisak (4.2% delta az előző frekvenciához)
Maximum 2-16 kHz
(+) | kiegyensúlyozott csúcsok – csak 3.3% választja el a mediántól
(±) | a csúcsok linearitása átlagos (9.3% delta az előző gyakorisághoz)
Összességében 100 - 16.000 Hz
(±) | az általános hang linearitása átlagos (25.1% eltérés a mediánhoz képest)
Ugyanazon osztályhoz képest
» 89%Ebben az osztályban az összes tesztelt eszköz %-a jobb volt, 3% hasonló, 8%-kal rosszabb
» A legjobb delta értéke 5%, az átlag 17%, a legrosszabb 45% volt
Az összes tesztelt eszközzel összehasonlítva
» 77% az összes tesztelt eszköz jobb volt, 5% hasonló, 18%-kal rosszabb
» A legjobb delta értéke 4%, az átlag 23%, a legrosszabb 134% volt
Apple MacBook 12 (Early 2016) 1.1 GHz hangelemzés
(+) | a hangszórók viszonylag hangosan tudnak játszani (83.6 dB)
Basszus 100 - 315 Hz
(±) | csökkentett basszus – átlagosan 11.3%-kal alacsonyabb, mint a medián
(±) | a basszus linearitása átlagos (14.2% delta az előző frekvenciához)
Közepes 400-2000 Hz
(+) | kiegyensúlyozott középpontok – csak 2.4% választja el a mediántól
(+) | a középpontok lineárisak (5.5% delta az előző frekvenciához)
Maximum 2-16 kHz
(+) | kiegyensúlyozott csúcsok – csak 2% választja el a mediántól
(+) | a csúcsok lineárisak (4.5% delta az előző frekvenciához képest)
Összességében 100 - 16.000 Hz
(+) | általános hangzás lineáris (10.2% eltérés a mediánhoz képest)
Ugyanazon osztályhoz képest
» 7%Ebben az osztályban az összes tesztelt eszköz %-a jobb volt, 2% hasonló, 90%-kal rosszabb
» A legjobb delta értéke 5%, az átlag 18%, a legrosszabb 53% volt
Az összes tesztelt eszközzel összehasonlítva
» 5% az összes tesztelt eszköz jobb volt, 1% hasonló, 94%-kal rosszabb
» A legjobb delta értéke 4%, az átlag 23%, a legrosszabb 134% volt
| Kikapcsolt állapot / Készenlét | |
| Üresjárat | |
| Terhelés |
|
Kulcs:
min: | |
| Asus Zenbook UX430UN i5-8550U, GeForce MX150, SanDisk SD8SN8U512G1002, IPS, 1920x1080, 14" | Dell XPS 13 9370 i5 UHD i5-8250U, UHD Graphics 620, Toshiba XG5 KXG50ZNV256G, IPS, 3840x2160, 13.3" | Samsung Notebook 9 NP900X5T-X01US i5-8550U, GeForce MX150, Samsung PM961 MZVLW256HEHP, IPS, 1920x1080, 15" | Asus Zenbook 3 Deluxe UX490UA i5-7200U, HD Graphics 620, Micron 1100 MTFDDAV256TBN, IPS, 1920x1080, 14" | Huawei MateBook X i5-7200U, HD Graphics 620, LITEON CB1-SD256, , 2160x1440, 13.3" | Microsoft Surface Laptop i5 i5-7200U, HD Graphics 620, Toshiba THNSN0128GTYA, IPS, 2256x1504, 13.5" | Asus ZenBook 13 UX331UN i5-8550U, GeForce MX150, SK Hynix HFS256G39TND-N210A, IPS, 1920x1080, 13.3" | |
|---|---|---|---|---|---|---|---|
| Power Consumption | -17% | -42% | 8% | -34% | 11% | 13% | |
| Idle Minimum * (Watt) | 3 | 4.3 -43% | 3.5 -17% | 3.3 -10% | 4.6 -53% | 3.2 -7% | 2.2 27% |
| Idle Average * (Watt) | 5.8 | 8 -38% | 11.3 -95% | 6.1 -5% | 11 -90% | 6.5 -12% | 5 14% |
| Idle Maximum * (Watt) | 6.2 | 8.1 -31% | 14.2 -129% | 10.1 -63% | 12 -94% | 6.8 -10% | 8 -29% |
| Load Average * (Watt) | 54.1 | 46.6 14% | 53.3 1% | 24.6 55% | 39.5 27% | 28.2 48% | 33 39% |
| Witcher 3 ultra * (Watt) | 45.9 | 50.6 -10% | |||||
| Load Maximum * (Watt) | 56.4 | 49.8 12% | 56.2 -0% | 22 61% | 34.6 39% | 36 36% | 49.4 12% |
* ... a kisebb jobb
| Asus Zenbook UX430UN i5-8550U, GeForce MX150, 50 Wh | Dell XPS 13 9370 i5 UHD i5-8250U, UHD Graphics 620, 52 Wh | Samsung Notebook 9 NP900X5T-X01US i5-8550U, GeForce MX150, 75 Wh | Asus Zenbook 3 Deluxe UX490UA i5-7200U, HD Graphics 620, 46 Wh | Huawei MateBook X i5-7200U, HD Graphics 620, 40 Wh | Microsoft Surface Laptop i5 i5-7200U, HD Graphics 620, 45 Wh | |
|---|---|---|---|---|---|---|
| Akkumulátor üzemidő | -10% | 40% | 21% | -7% | 23% | |
| Reader / Idle (h) | 17.3 | 14.5 -16% | 30.2 75% | 17.2 -1% | 8.5 -51% | 22.5 30% |
| WiFi v1.3 (h) | 9.3 | 6.8 -27% | 10.6 14% | 9.4 1% | 5.6 -40% | 10 8% |
| Load (h) | 1.6 | 1.8 13% | 2.1 31% | 2.6 63% | 2.7 69% | 2.1 31% |
Pro
Kontra
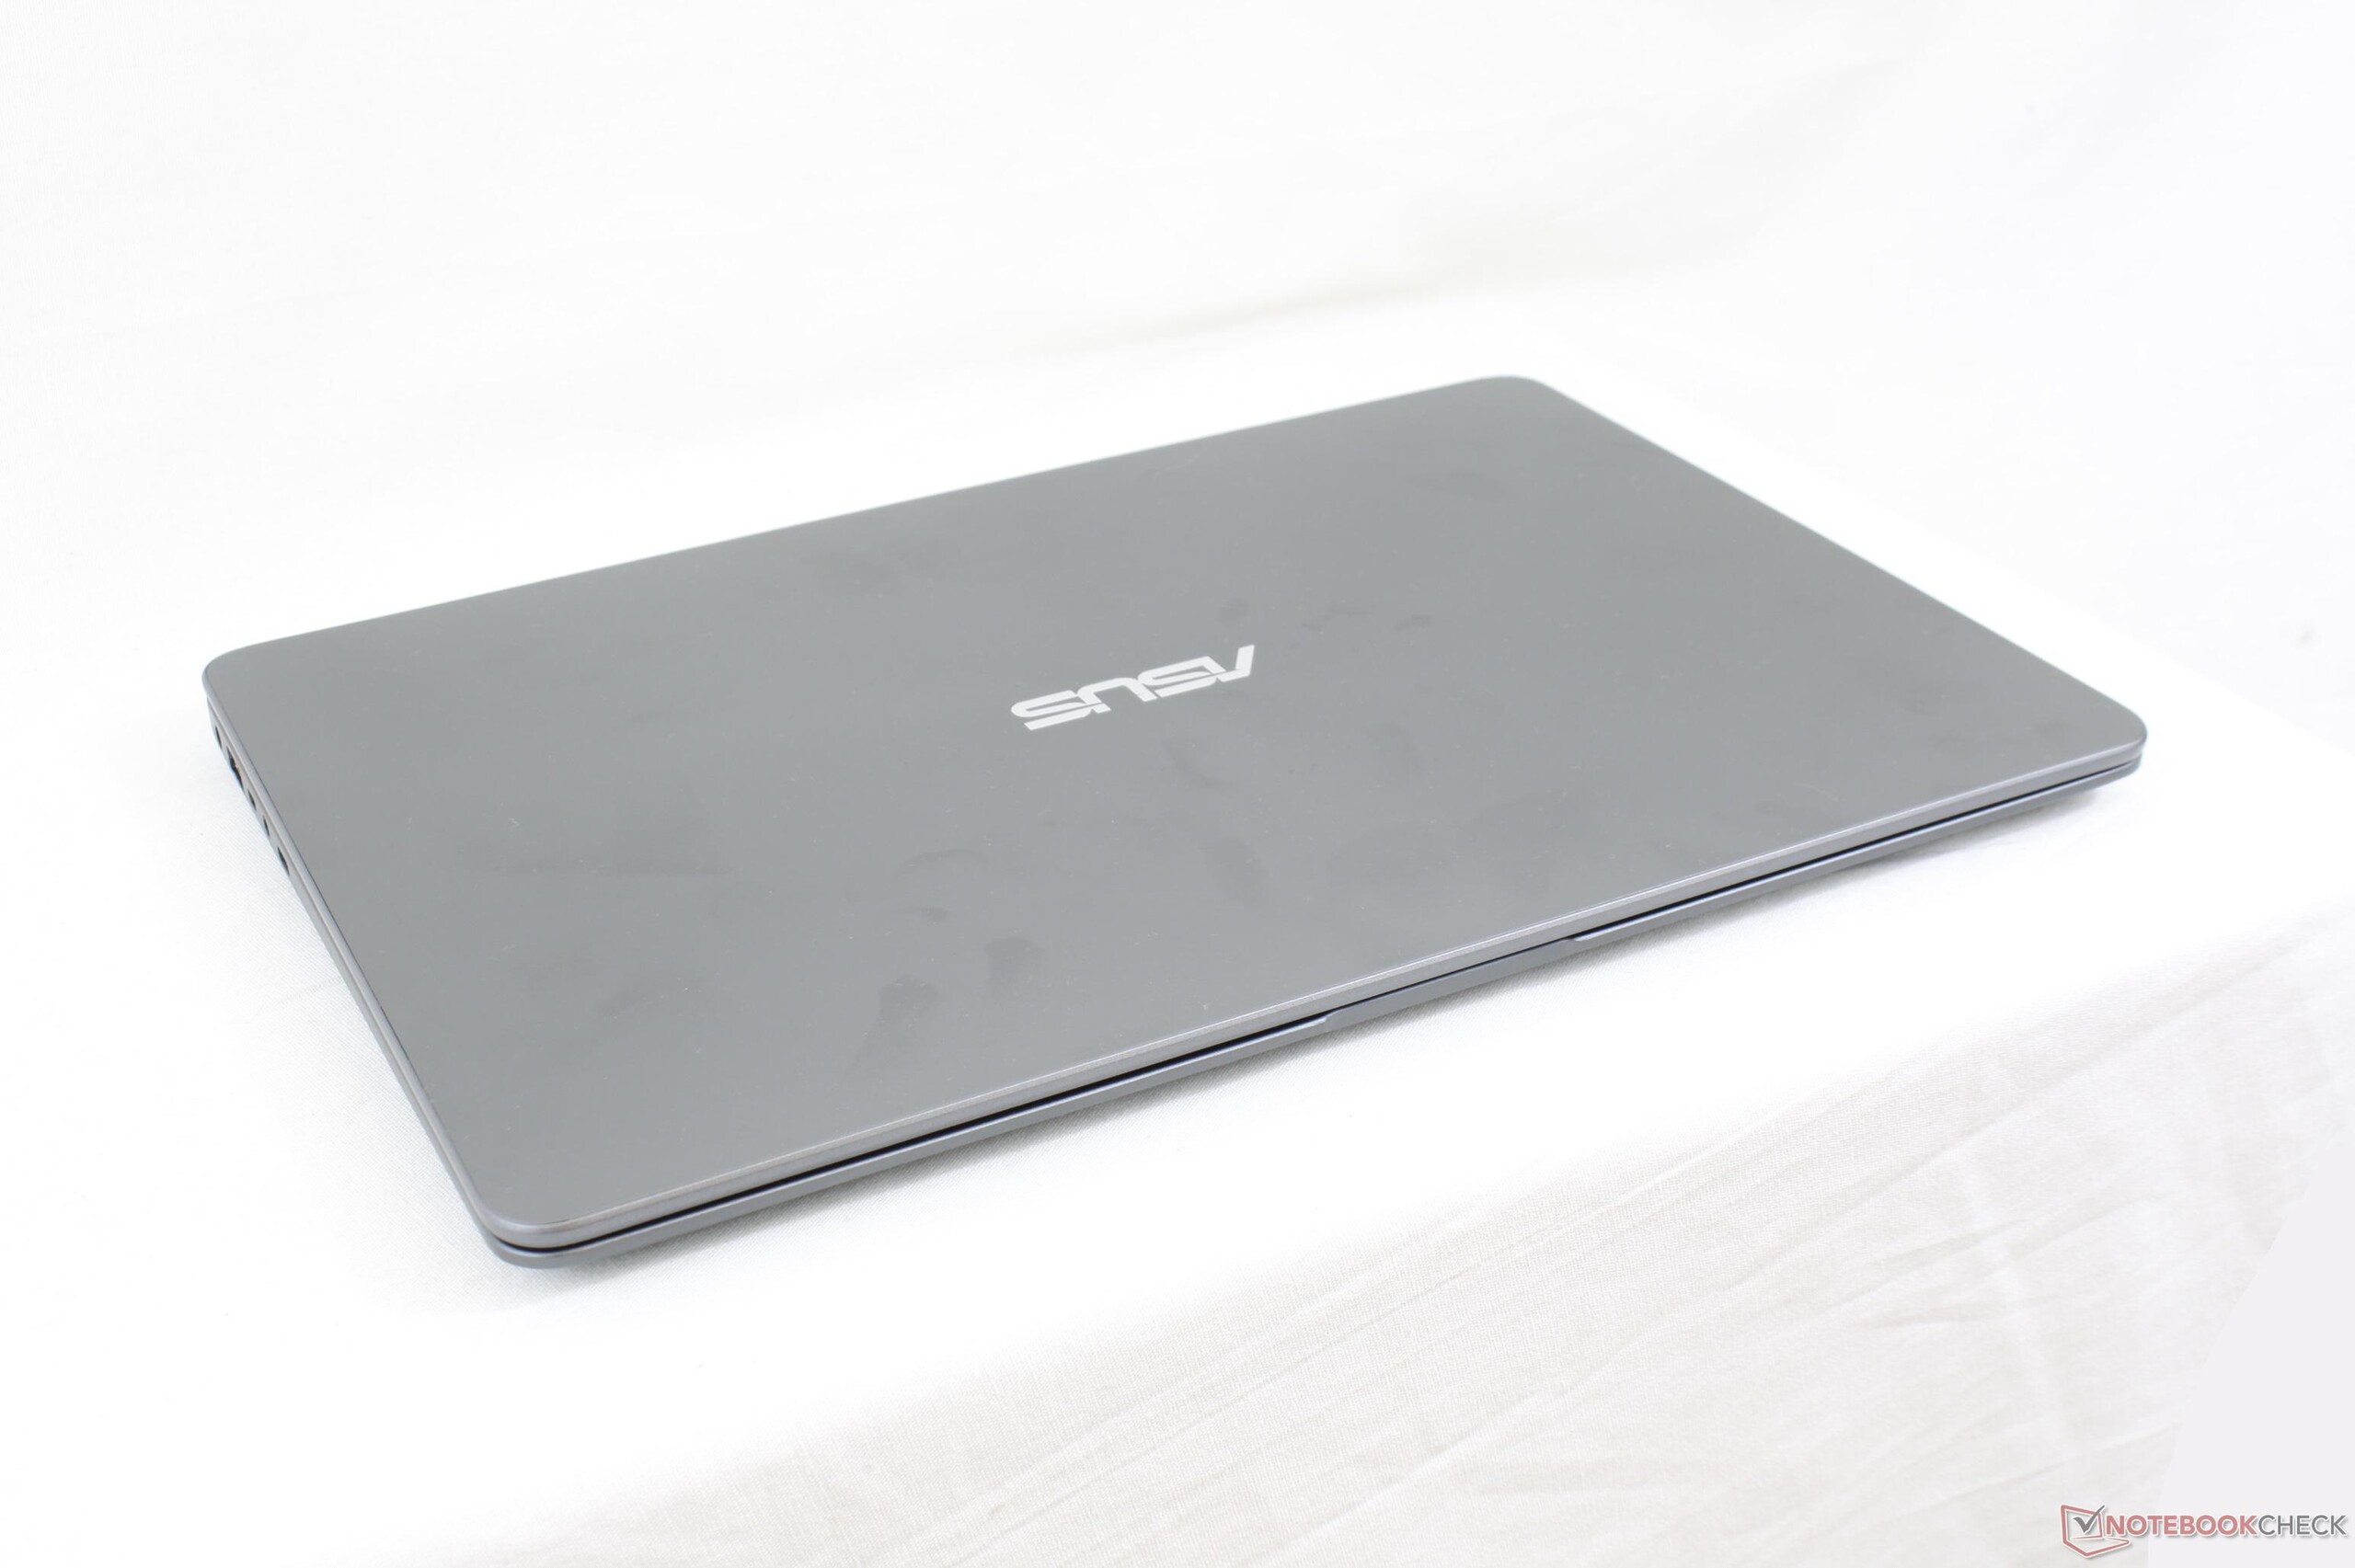
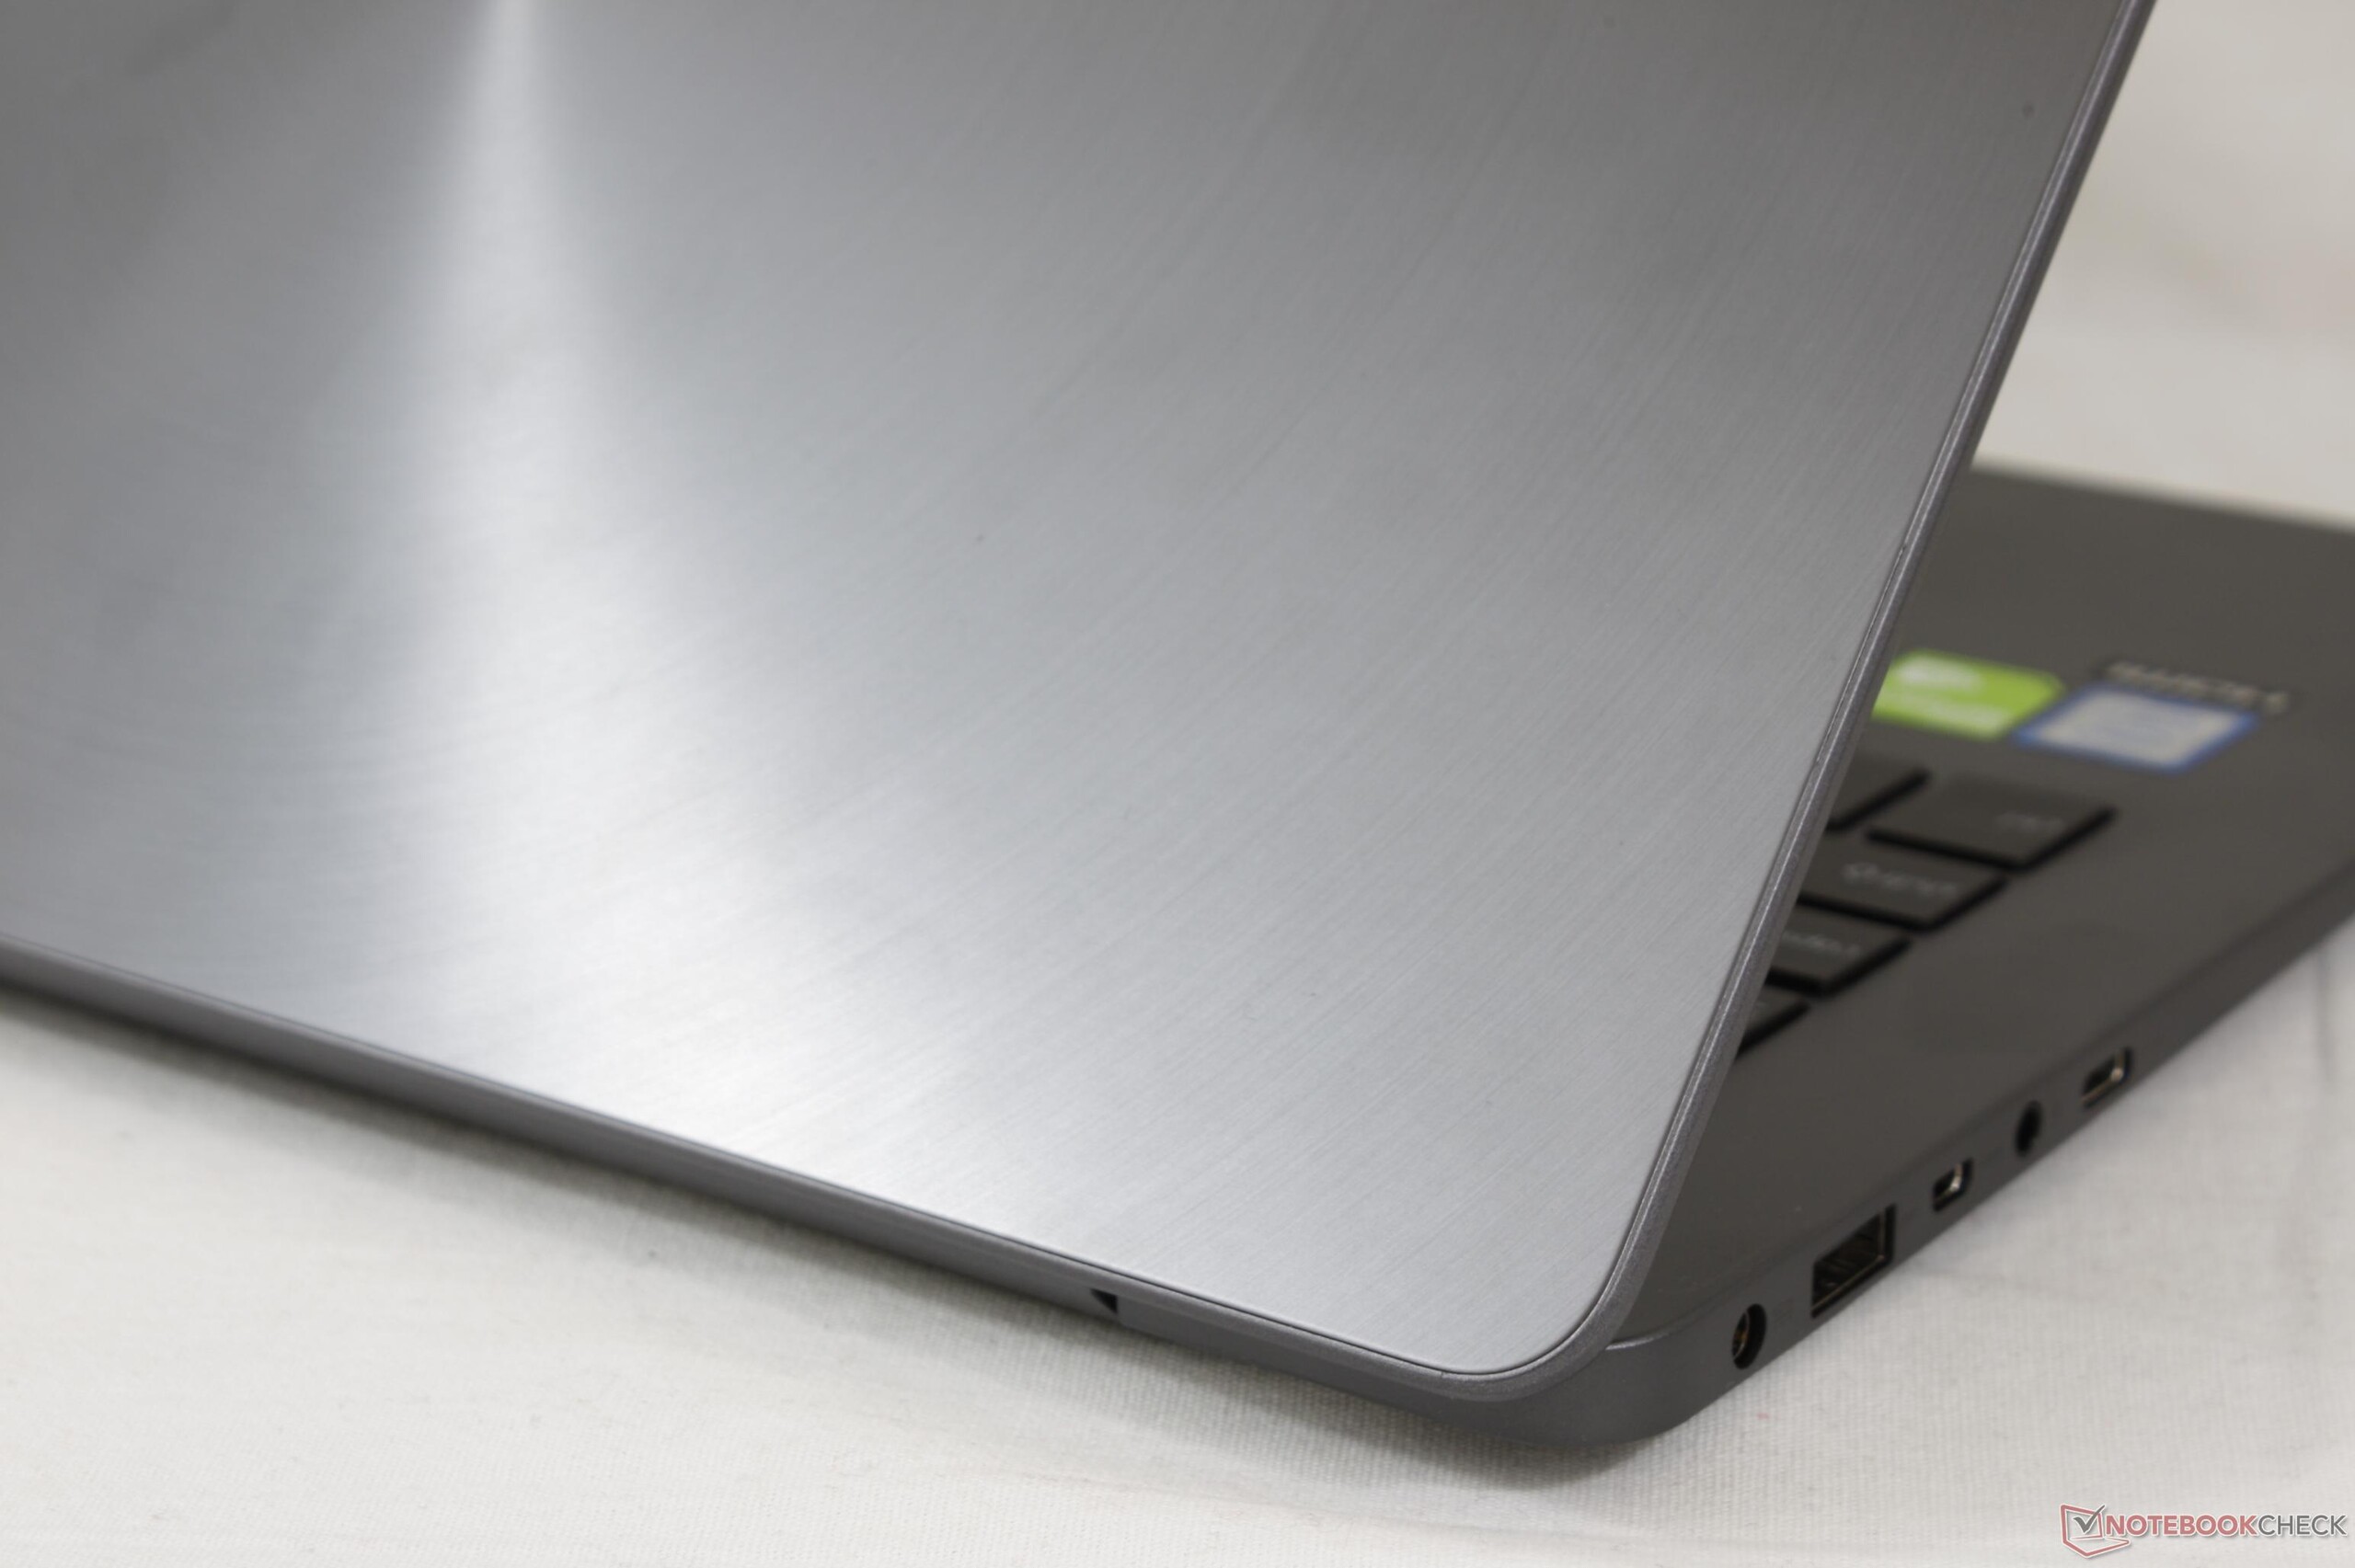
Az UX430 pozitívumai nem ellensúlyozzák a negatívumok hosszabb listáját. A kevés kiemelkedő tulajdonsága közé tartozik az éles képű matt kijelző, valamint a karcsú design, de nagyjából minden más maximum átlagos, vagy jellegtelen rajta. A fényereje alacsonyabb, mint a rivális ultrabookoknak, a ház viszonylag hajlékonyabb, a trackpad puha, és a billentyűzet gombjainak is lehetne határozottabb visszajelzése. A hardvert alaposabban megvizsgálva csalódást keltő tekercszajjal, és olyan erős GPU lefojtással találkoztunk, amely hosszabb idő után az alap órajel alá nyomja a videokártyát.
Az UX430UN fő előnye az $1200-os ár. Specifikációi lenyűgözően hangzanak a 8. generációs Core i7 CPU-val, 16 GB RAM-mal, 512 GB-os SSD-vel, és a dedikált, Pascal-os GeForce videokártyával. Egy hasonlóan felszerelt rendszer, például a Samsung NP900X5T vagy a Spectre x360 15 száz dollárokkal többe kerül, és még az XPS 13 is 1000 dollárról indul, az alap specifikációi pedig messze elmaradnak ettől. Innét nézve az UX430UN jó ár/teljesítmény arányúnak tekinthető, ha a hiányosságok listáját nem tévesztjük szem elől.
Remek specifikációk, remek áron. A hardver a gyakorlatban viszont majdnem minden téren fejlesztésre szorul, hogy a négy számjegyű árfekvésben labdába tudjon rúgni. Merevebb házat, és világosabb kijelzőt (jobb kültéri használhatóság) várunk következő iterációktól.
Ez az eredeti értékelés rövidített változata. A teljes, angol nyelvű cikk itt olvasható.
Asus Zenbook UX430UN
- 03/23/2018 v6 (old)
Allen Ngo
Price comparison
