Asus FX502VM-AS73 Notebook rövid értékelés


| SD Card Reader | |
| average JPG Copy Test (av. of 3 runs) | |
| Dell XPS 15-9550 i7 | |
| Asus Strix GL502VM-DS74 | |
| Asus FX502VM-AS73 | |
| maximum AS SSD Seq Read Test (1GB) | |
| Dell XPS 15-9550 i7 | |
| Asus Strix GL502VM-DS74 | |
| Asus FX502VM-AS73 | |
| Networking | |
| iperf3 transmit AX12 | |
| Alienware 15 R3 | |
| Asus FX502VM-AS73 | |
| Asus Strix GL502VM-DS74 | |
| iperf3 receive AX12 | |
| Alienware 15 R3 | |
| Asus FX502VM-AS73 | |
| Asus Strix GL502VM-DS74 | |
| |||||||||||||||||||||||||
Fényerő megoszlás: 92 %
Centrumban: 209.5 cd/m²
Kontraszt: 304:1 (Fekete: 0.69 cd/m²)
ΔE ColorChecker Calman: 4.7 | ∀{0.5-29.43 Ø4.73}
ΔE Greyscale Calman: 1.8 | ∀{0.09-98 Ø4.97}
56.6% sRGB (Argyll 1.6.3 3D)
36.2% AdobeRGB 1998 (Argyll 1.6.3 3D)
39.47% AdobeRGB 1998 (Argyll 3D)
56.9% sRGB (Argyll 3D)
38.28% Display P3 (Argyll 3D)
Gamma: 2.23
CCT: 6975 K
| Asus FX502VM-AS73 TN LED, 15.6", 1920x1080 | Alienware 15 R3 HPJGK_B156HTN (AUO51ED), TN, 15.6", 1920x1080 | MSI GT62VR 7RE-223 LG Philips LP156WF6 (LGD046F), IPS, 15.6", 1920x1080 | Dell XPS 15 2017 9560 (7300HQ, Full-HD) Sharp SHP1453 LQ156M1, LED IGZO IPS InfinityEdge, 15.6", 1920x1080 | Gigabyte P55W v7 LG Philips LP156WF6 (LGD046F), IPS, 15.6", 1920x1080 | Asus Strix GL502VM-DS74 IPS, 15.6", 1920x1080 | |
|---|---|---|---|---|---|---|
| Display | 66% | 56% | 78% | 54% | 58% | |
| Display P3 Coverage (%) | 38.28 | 66 72% | 63.9 67% | 68.9 80% | 63.5 66% | 64.8 69% |
| sRGB Coverage (%) | 56.9 | 90.5 59% | 83.1 46% | 98.9 74% | 82 44% | 84.9 49% |
| AdobeRGB 1998 Coverage (%) | 39.47 | 66.2 68% | 60.8 54% | 70.9 80% | 59.9 52% | 62 57% |
| Response Times | 29% | -21% | -112% | -21% | -47% | |
| Response Time Grey 50% / Grey 80% * (ms) | 28.4 ? | 25 ? 12% | 37 ? -30% | 54 ? -90% | 37 ? -30% | 42 ? -48% |
| Response Time Black / White * (ms) | 22.4 ? | 12 ? 46% | 25 ? -12% | 52.4 ? -134% | 25 ? -12% | 32.8 ? -46% |
| PWM Frequency (Hz) | ||||||
| Screen | -6% | 41% | 54% | 39% | 44% | |
| Brightness middle (cd/m²) | 209.5 | 386 84% | 310 48% | 400 91% | 287 37% | 307.8 47% |
| Brightness (cd/m²) | 205 | 382 86% | 311 52% | 392 91% | 289 41% | 301 47% |
| Brightness Distribution (%) | 92 | 93 1% | 85 -8% | 89 -3% | 87 -5% | 88 -4% |
| Black Level * (cd/m²) | 0.69 | 0.39 43% | 0.3 57% | 0.26 62% | 0.29 58% | 0.33 52% |
| Contrast (:1) | 304 | 990 226% | 1033 240% | 1538 406% | 990 226% | 933 207% |
| Colorchecker dE 2000 * | 4.7 | 10.2 -117% | 4.82 -3% | 4.9 -4% | 4.92 -5% | 4.5 4% |
| Colorchecker dE 2000 max. * | 19.7 | 15.81 20% | 10.14 49% | 11 44% | 11 44% | 10 49% |
| Greyscale dE 2000 * | 1.8 | 11.28 -527% | 3.94 -119% | 7.2 -300% | 3.66 -103% | 2.9 -61% |
| Gamma | 2.23 99% | 2.23 99% | 2.45 90% | 2.11 104% | 2.32 95% | 2.22 99% |
| CCT | 6975 93% | 11383 57% | 6877 95% | 6911 94% | 6482 100% | 1136 572% |
| Color Space (Percent of AdobeRGB 1998) (%) | 36.2 | 59 63% | 54 49% | 64.2 77% | 54 49% | 55.4 53% |
| Color Space (Percent of sRGB) (%) | 56.6 | 90 59% | 83 47% | 98.9 75% | 82 45% | 84.8 50% |
| Teljes átlag (program / beállítások) | 30% /
13% | 25% /
36% | 7% /
37% | 24% /
34% | 18% /
35% |
* ... a kisebb jobb
Megjelenítési válaszidők
| ↔ Válaszidő Fekete-fehér | ||
|---|---|---|
| 22.4 ms ... emelkedés és süllyedés ↘ kombinálva | ↗ 6 ms emelkedés | 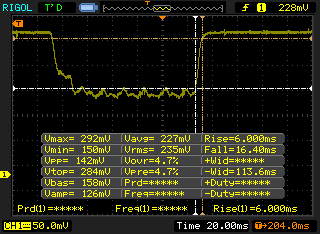 |
| ↘ 16.4 ms ősz | ||
| A képernyő jó reakciósebességet mutat tesztjeinkben, de túl lassú lehet a versenyképes játékosok számára. Összehasonlításképpen, az összes tesztelt eszköz 0.1 (minimum) és 240 (maximum) ms között mozog. » 50 % of all devices are better. Ez azt jelenti, hogy a mért válaszidő rosszabb, mint az összes vizsgált eszköz átlaga (19.9 ms). | ||
| ↔ Válaszidő 50% szürke és 80% szürke között | ||
| 28.4 ms ... emelkedés és süllyedés ↘ kombinálva | ↗ 11.2 ms emelkedés | 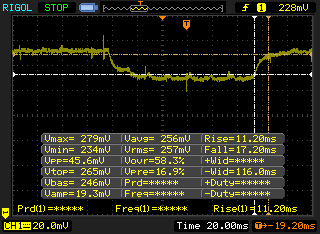 |
| ↘ 17.2 ms ősz | ||
| A képernyő viszonylag lassú reakciósebességet mutat tesztjeinkben, és túl lassú lehet a játékosok számára. Összehasonlításképpen, az összes tesztelt eszköz 0.165 (minimum) és 636 (maximum) ms között mozog. » 38 % of all devices are better. Ez azt jelenti, hogy a mért válaszidő hasonló az összes vizsgált eszköz átlagához (31.1 ms). | ||
Képernyő villogása / PWM (impulzusszélesség-moduláció)
| Képernyő villogása / PWM nem érzékelhető | 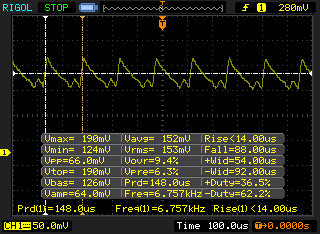 | ||
Összehasonlításképpen: az összes tesztelt eszköz 52 %-a nem használja a PWM-et a kijelző elsötétítésére. Ha PWM-et észleltek, akkor átlagosan 7794 (minimum: 5 - maximum: 343500) Hz-t mértek. | |||
| Cinebench R11.5 | |
| CPU Single 64Bit | |
| Asus G701VIK-BA049T | |
| Eurocom Sky X7E2 | |
| MSI GE62 2QC-468XPL | |
| Asus FX502VM-AS73 | |
| MSI GE72VR-6RF16H21 | |
| Toshiba Satellite S70-B-106 | |
| CPU Multi 64Bit | |
| Asus G701VIK-BA049T | |
| Eurocom Sky X7E2 | |
| Asus FX502VM-AS73 | |
| MSI GE62 2QC-468XPL | |
| MSI GE72VR-6RF16H21 | |
| Toshiba Satellite S70-B-106 | |
| Cinebench R10 | |
| Rendering Multiple CPUs 32Bit | |
| Eurocom Sky X7E2 | |
| MSI GE62 2QC-468XPL | |
| Asus FX502VM-AS73 | |
| Apple MacBook Pro 15 2016 (2.7 GHz, 455) | |
| MSI GE72VR-6RF16H21 | |
| Rendering Single 32Bit | |
| Eurocom Sky X7E2 | |
| Asus FX502VM-AS73 | |
| Apple MacBook Pro 15 2016 (2.7 GHz, 455) | |
| MSI GE62 2QC-468XPL | |
| MSI GE72VR-6RF16H21 | |
| wPrime 2.10 - 1024m | |
| Apple MacBook Pro 15 2016 (2.7 GHz, 455) | |
| Asus FX502VM-AS73 | |
| MSI GE62 2QC-468XPL | |
| Eurocom Sky X7E2 | |
* ... a kisebb jobb
| PCMark 8 | |
| Home Score Accelerated v2 | |
| MSI GT62VR 7RE-223 | |
| Asus Strix GL502VM-DS74 | |
| Alienware 15 R3 | |
| Asus FX502VM-AS73 | |
| Gigabyte P55W v7 | |
| Dell XPS 15 2017 9560 (7300HQ, Full-HD) | |
| Work Score Accelerated v2 | |
| Asus Strix GL502VM-DS74 | |
| MSI GT62VR 7RE-223 | |
| Gigabyte P55W v7 | |
| Alienware 15 R3 | |
| Dell XPS 15 2017 9560 (7300HQ, Full-HD) | |
| Asus FX502VM-AS73 | |
| Creative Score Accelerated v2 | |
| MSI GT62VR 7RE-223 | |
| Alienware 15 R3 | |
| Asus Strix GL502VM-DS74 | |
| Asus FX502VM-AS73 | |
| PCMark 8 Home Score Accelerated v2 | 4765 pontok | |
| PCMark 8 Creative Score Accelerated v2 | 7220 pontok | |
| PCMark 8 Work Score Accelerated v2 | 2722 pontok | |
Segítség | ||
| Asus FX502VM-AS73 SK Hynix HFS256G39TND-N210A | Alienware 15 R3 | Dell XPS 15 2017 9560 (7300HQ, Full-HD) WDC WD10SPCX-75KHST0 + SanDisk Z400s M.2 2242 32 GB Cache | Gigabyte P55W v7 Liteonit CV3-8D256 | Asus Strix GL502VM-DS74 Samsung SSD 960 Evo 250GB m.2 NVMe | |
|---|---|---|---|---|---|
| CrystalDiskMark 3.0 | 146% | -75% | 31% | 351% | |
| Read Seq (MB/s) | 503 | 1123 123% | 123 -76% | 466.2 -7% | 1747 247% |
| Write Seq (MB/s) | 138.2 | 429.2 211% | 74.2 -46% | 261.9 90% | 1477 969% |
| Read 512 (MB/s) | 343.5 | 833 143% | 101.7 -70% | 252.5 -26% | 863 151% |
| Write 512 (MB/s) | 137.8 | 428.1 211% | 42.51 -69% | 254.8 85% | 1115 709% |
| Read 4k (MB/s) | 29.36 | 37.8 29% | 10.84 -63% | 25.4 -13% | 56.8 93% |
| Write 4k (MB/s) | 70.9 | 122.9 73% | 1.021 -99% | 55 -22% | 152.4 115% |
| Read 4k QD32 (MB/s) | 369.9 | 542 47% | 69.8 -81% | 358.5 -3% | 652 76% |
| Write 4k QD32 (MB/s) | 99.7 | 429.8 331% | 1.057 -99% | 240.1 141% | 542 444% |

| 3DMark | |
| 1920x1080 Fire Strike Graphics | |
| Acer Predator 17 X GX-792-76DL | |
| Gigabyte P57X v7 | |
| Nvidia GeForce GTX 1060 Founders Edition 6 GB | |
| Asus FX502VM-AS73 | |
| Asus Strix GL502VM-DS74 | |
| MSI GE72 7RE-046 | |
| HP Pavilion 17t-ab200 | |
| Fire Strike Extreme Graphics | |
| Acer Predator 17 X GX-792-76DL | |
| Gigabyte P57X v7 | |
| Asus FX502VM-AS73 | |
| Asus Strix GL502VM-DS74 | |
| HP Pavilion 17t-ab200 | |
| 3840x2160 Fire Strike Ultra Graphics | |
| Acer Predator 17 X GX-792-76DL | |
| Gigabyte P57X v7 | |
| Nvidia GeForce GTX 1060 Founders Edition 6 GB | |
| Asus FX502VM-AS73 | |
| Asus Strix GL502VM-DS74 | |
| 3DMark 11 | |
| 1280x720 Performance GPU | |
| Acer Predator 17 X GX-792-76DL | |
| Gigabyte P57X v7 | |
| Nvidia GeForce GTX 1060 Founders Edition 6 GB | |
| Asus FX502VM-AS73 | |
| Asus Strix GL502VM-DS74 | |
| MSI GE72 7RE-046 | |
| HP Pavilion 17t-ab200 | |
| 1280x720 Performance Combined | |
| Nvidia GeForce GTX 1060 Founders Edition 6 GB | |
| Acer Predator 17 X GX-792-76DL | |
| Gigabyte P57X v7 | |
| Asus FX502VM-AS73 | |
| Asus Strix GL502VM-DS74 | |
| HP Pavilion 17t-ab200 | |
| MSI GE72 7RE-046 | |
| 3DMark 11 Performance | 12736 pontok | |
| 3DMark Ice Storm Standard Score | 125692 pontok | |
| 3DMark Cloud Gate Standard Score | 25979 pontok | |
| 3DMark Fire Strike Score | 9845 pontok | |
| 3DMark Fire Strike Extreme Score | 5189 pontok | |
Segítség | ||
| BioShock Infinite - 1920x1080 Ultra Preset, DX11 (DDOF) | |
| Aorus X7 DT v6 | |
| Gigabyte P57X v7 | |
| Asus FX502VM-AS73 | |
| Asus Strix GL502VY-DS71 | |
| MSI GL62M 7RD-077 | |
| Metro: Last Light - 1920x1080 Very High (DX11) AF:16x | |
| Aorus X7 DT v6 | |
| Asus FX502VM-AS73 | |
| Sleeping Dogs - 1920x1080 Extreme Preset AA:Extreme | |
| Aorus X7 DT v6 | |
| Gigabyte P57X v7 | |
| Asus FX502VM-AS73 | |
| Asus Strix GL502VY-DS71 | |
| Thief - 1920x1080 Very High Preset AA:FXAA & High SS AF:8x | |
| Aorus X7 DT v6 | |
| Asus FX502VM-AS73 | |
| Asus Strix GL502VY-DS71 | |
| MSI GL62M 7RD-077 | |
| Fallout 4 - 1920x1080 Ultra Preset AA:T AF:16x | |
| Aorus X7 DT v6 | |
| Nvidia GeForce GTX 1060 Founders Edition 6 GB | |
| Asus FX502VM-AS73 | |
| Asus Strix GL502VY-DS71 | |
| MSI GE72 7RE-046 | |
| Rise of the Tomb Raider - 1920x1080 Very High Preset AA:FX AF:16x | |
| Aorus X7 DT v6 | |
| Nvidia GeForce GTX 1060 Founders Edition 6 GB | |
| Nvidia GeForce GTX 1060 Founders Edition 6 GB | |
| Asus FX502VM-AS73 | |
| Asus Strix GL502VY-DS71 | |
| MSI GE72 7RE-046 | |
| MSI GL62M 7RD-077 | |
| Ashes of the Singularity - 1920x1080 high | |
| Asus FX502VM-AS73 | |
| MSI GL62M 7RD-077 | |
| Doom - 1920x1080 Ultra Preset AA:SM | |
| Aorus X7 DT v6 | |
| Nvidia GeForce GTX 1060 Founders Edition 6 GB | |
| Asus FX502VM-AS73 | |
| MSI GE72 7RE-046 | |
| Asus Strix GL502VY-DS71 | |
| Overwatch - 1920x1080 Epic (Render Scale 100 %) AA:SM AF:16x | |
| Nvidia GeForce GTX 1060 Founders Edition 6 GB | |
| Asus FX502VM-AS73 | |
| Asus Strix GL502VY-DS71 | |
| MSI GE72 7RE-046 | |
| MSI GL62M 7RD-077 | |
| Mafia 3 - 1920x1080 High Preset | |
| Asus FX502VM-AS73 | |
| MSI GE72 7RE-046 | |
| alacsony | közepes | magas | ultra | |
|---|---|---|---|---|
| Sleeping Dogs (2012) | 77.5 | |||
| BioShock Infinite (2013) | 103.1 | |||
| Metro: Last Light (2013) | 79.3 | |||
| Thief (2014) | 77.3 | |||
| Metal Gear Solid V (2015) | 60 | |||
| Fallout 4 (2015) | 73.7 | |||
| Rise of the Tomb Raider (2016) | 61.3 | |||
| Ashes of the Singularity (2016) | 54.8 | |||
| Doom (2016) | 95.1 | |||
| Overwatch (2016) | 107.3 | |||
| Mafia 3 (2016) | 46.7 |
Zajszint
| Üresjárat |
| 30.6 / 30.6 / 31 dB(A) |
| Terhelés |
| 46.2 / 52.3 dB(A) |
 | ||
30 dB csendes 40 dB(A) hallható 50 dB(A) hangos |
||
min: | ||
| Asus FX502VM-AS73 GeForce GTX 1060 Mobile, i7-7700HQ, SK Hynix HFS256G39TND-N210A | Alienware 15 R3 GeForce GTX 1070 Mobile, i7-7700HQ | Dell XPS 15 2017 9560 (7300HQ, Full-HD) GeForce GTX 1050 Mobile, i5-7300HQ, WDC WD10SPCX-75KHST0 + SanDisk Z400s M.2 2242 32 GB Cache | Gigabyte P55W v7 GeForce GTX 1060 Mobile, i7-7700HQ, Liteonit CV3-8D256 | Asus Strix GL502VM-DS74 GeForce GTX 1060 Mobile, i7-7700HQ, Samsung SSD 960 Evo 250GB m.2 NVMe | |
|---|---|---|---|---|---|
| Noise | -8% | -2% | -3% | -4% | |
| off / környezet * (dB) | 28.7 | 30 -5% | 30.3 -6% | 30 -5% | 30.8 -7% |
| Idle Minimum * (dB) | 30.6 | 31 -1% | 31.6 -3% | 33 -8% | 32 -5% |
| Idle Average * (dB) | 30.6 | 32 -5% | 31.6 -3% | 34 -11% | 32 -5% |
| Idle Maximum * (dB) | 31 | 42 -35% | 33.4 -8% | 35 -13% | 32 -3% |
| Load Average * (dB) | 46.2 | 49 -6% | 47.8 -3% | 39 16% | 48.3 -5% |
| Load Maximum * (dB) | 52.3 | 50 4% | 47.8 9% | 50 4% | 51.2 2% |
* ... a kisebb jobb
(-) A felső oldalon a maximális hőmérséklet 53.2 °C / 128 F, összehasonlítva a 40.4 °C / 105 F átlagával , 21.2 és 68.8 °C között a Gaming osztálynál.
(-) Az alsó maximum 56.8 °C / 134 F-ig melegszik fel, összehasonlítva a 43.2 °C / 110 F átlagával
(+) Üresjáratban a felső oldal átlagos hőmérséklete 25.5 °C / 78 F, összehasonlítva a 33.9 °C / ### eszközátlaggal class_avg_f### F.
(+) A csuklótámasz és az érintőpad hűvösebb, mint a bőr hőmérséklete, maximum 23.4 °C / 74.1 F, ezért hűvös tapintású.
(+) A hasonló eszközök csuklótámasz területének átlagos hőmérséklete 28.8 °C / 83.8 F volt (+5.4 °C / 9.7 F).
Asus FX502VM-AS73 hangelemzés
(-) | nem túl hangos hangszórók (67.7 dB)
Basszus 100 - 315 Hz
(±) | csökkentett basszus – átlagosan 14%-kal alacsonyabb, mint a medián
(±) | a basszus linearitása átlagos (12.6% delta az előző frekvenciához)
Közepes 400-2000 Hz
(+) | kiegyensúlyozott középpontok – csak 2.7% választja el a mediántól
(±) | a középpontok linearitása átlagos (11.5% delta az előző gyakorisághoz)
Maximum 2-16 kHz
(+) | kiegyensúlyozott csúcsok – csak 4.9% választja el a mediántól
(±) | a csúcsok linearitása átlagos (11.4% delta az előző gyakorisághoz)
Összességében 100 - 16.000 Hz
(±) | az általános hang linearitása átlagos (29.9% eltérés a mediánhoz képest)
Ugyanazon osztályhoz képest
» 95%Ebben az osztályban az összes tesztelt eszköz %-a jobb volt, 2% hasonló, 3%-kal rosszabb
» A legjobb delta értéke 6%, az átlag 18%, a legrosszabb 132% volt
Az összes tesztelt eszközzel összehasonlítva
» 88% az összes tesztelt eszköz jobb volt, 3% hasonló, 9%-kal rosszabb
» A legjobb delta értéke 4%, az átlag 24%, a legrosszabb 134% volt
Apple MacBook 12 (Early 2016) 1.1 GHz hangelemzés
(+) | a hangszórók viszonylag hangosan tudnak játszani (83.6 dB)
Basszus 100 - 315 Hz
(±) | csökkentett basszus – átlagosan 11.3%-kal alacsonyabb, mint a medián
(±) | a basszus linearitása átlagos (14.2% delta az előző frekvenciához)
Közepes 400-2000 Hz
(+) | kiegyensúlyozott középpontok – csak 2.4% választja el a mediántól
(+) | a középpontok lineárisak (5.5% delta az előző frekvenciához)
Maximum 2-16 kHz
(+) | kiegyensúlyozott csúcsok – csak 2% választja el a mediántól
(+) | a csúcsok lineárisak (4.5% delta az előző frekvenciához képest)
Összességében 100 - 16.000 Hz
(+) | általános hangzás lineáris (10.2% eltérés a mediánhoz képest)
Ugyanazon osztályhoz képest
» 7%Ebben az osztályban az összes tesztelt eszköz %-a jobb volt, 2% hasonló, 91%-kal rosszabb
» A legjobb delta értéke 5%, az átlag 18%, a legrosszabb 53% volt
Az összes tesztelt eszközzel összehasonlítva
» 5% az összes tesztelt eszköz jobb volt, 1% hasonló, 94%-kal rosszabb
» A legjobb delta értéke 4%, az átlag 24%, a legrosszabb 134% volt
| Kikapcsolt állapot / Készenlét | |
| Üresjárat | |
| Terhelés |
|
Kulcs:
min: | |
| Asus FX502VM-AS73 | Alienware 15 R3 | Dell XPS 15 2017 9560 (7300HQ, Full-HD) | Gigabyte P55W v7 | Asus Strix GL502VM-DS74 | |
|---|---|---|---|---|---|
| Power Consumption | -36% | 33% | 15% | -102% | |
| Idle Minimum * (Watt) | 14.9 | 19 -28% | 6.6 56% | 8 46% | 38.3 -157% |
| Idle Average * (Watt) | 15.1 | 23 -52% | 9 40% | 13 14% | 40.5 -168% |
| Idle Maximum * (Watt) | 15.2 | 29 -91% | 10.7 30% | 18 -18% | 42.2 -178% |
| Load Average * (Watt) | 105.8 | 85 20% | 77.5 27% | 76 28% | 110.4 -4% |
| Load Maximum * (Watt) | 148.8 | 192 -29% | 130 13% | 143 4% | 155.7 -5% |
* ... a kisebb jobb
| Asus FX502VM-AS73 i7-7700HQ, GeForce GTX 1060 Mobile, 64 Wh | Alienware 15 R3 i7-7700HQ, GeForce GTX 1070 Mobile, 99 Wh | Dell XPS 15 2017 9560 (7300HQ, Full-HD) i5-7300HQ, GeForce GTX 1050 Mobile, 56 Wh | Gigabyte P55W v7 i7-7700HQ, GeForce GTX 1060 Mobile, 63 Wh | Asus Strix GL502VM-DS74 i7-7700HQ, GeForce GTX 1060 Mobile, 64 Wh | |
|---|---|---|---|---|---|
| Akkumulátor üzemidő | 19% | 34% | 62% | -49% | |
| Reader / Idle (h) | 6.1 | 6.4 5% | 9.4 54% | 13.2 116% | 1.7 -72% |
| WiFi v1.3 (h) | 4.6 | 4.4 -4% | 5.6 22% | 5.8 26% | 1.5 -67% |
| Load (h) | 1.1 | 1.7 55% | 1.4 27% | 1.6 45% | 1 -9% |
Pro
Kontra

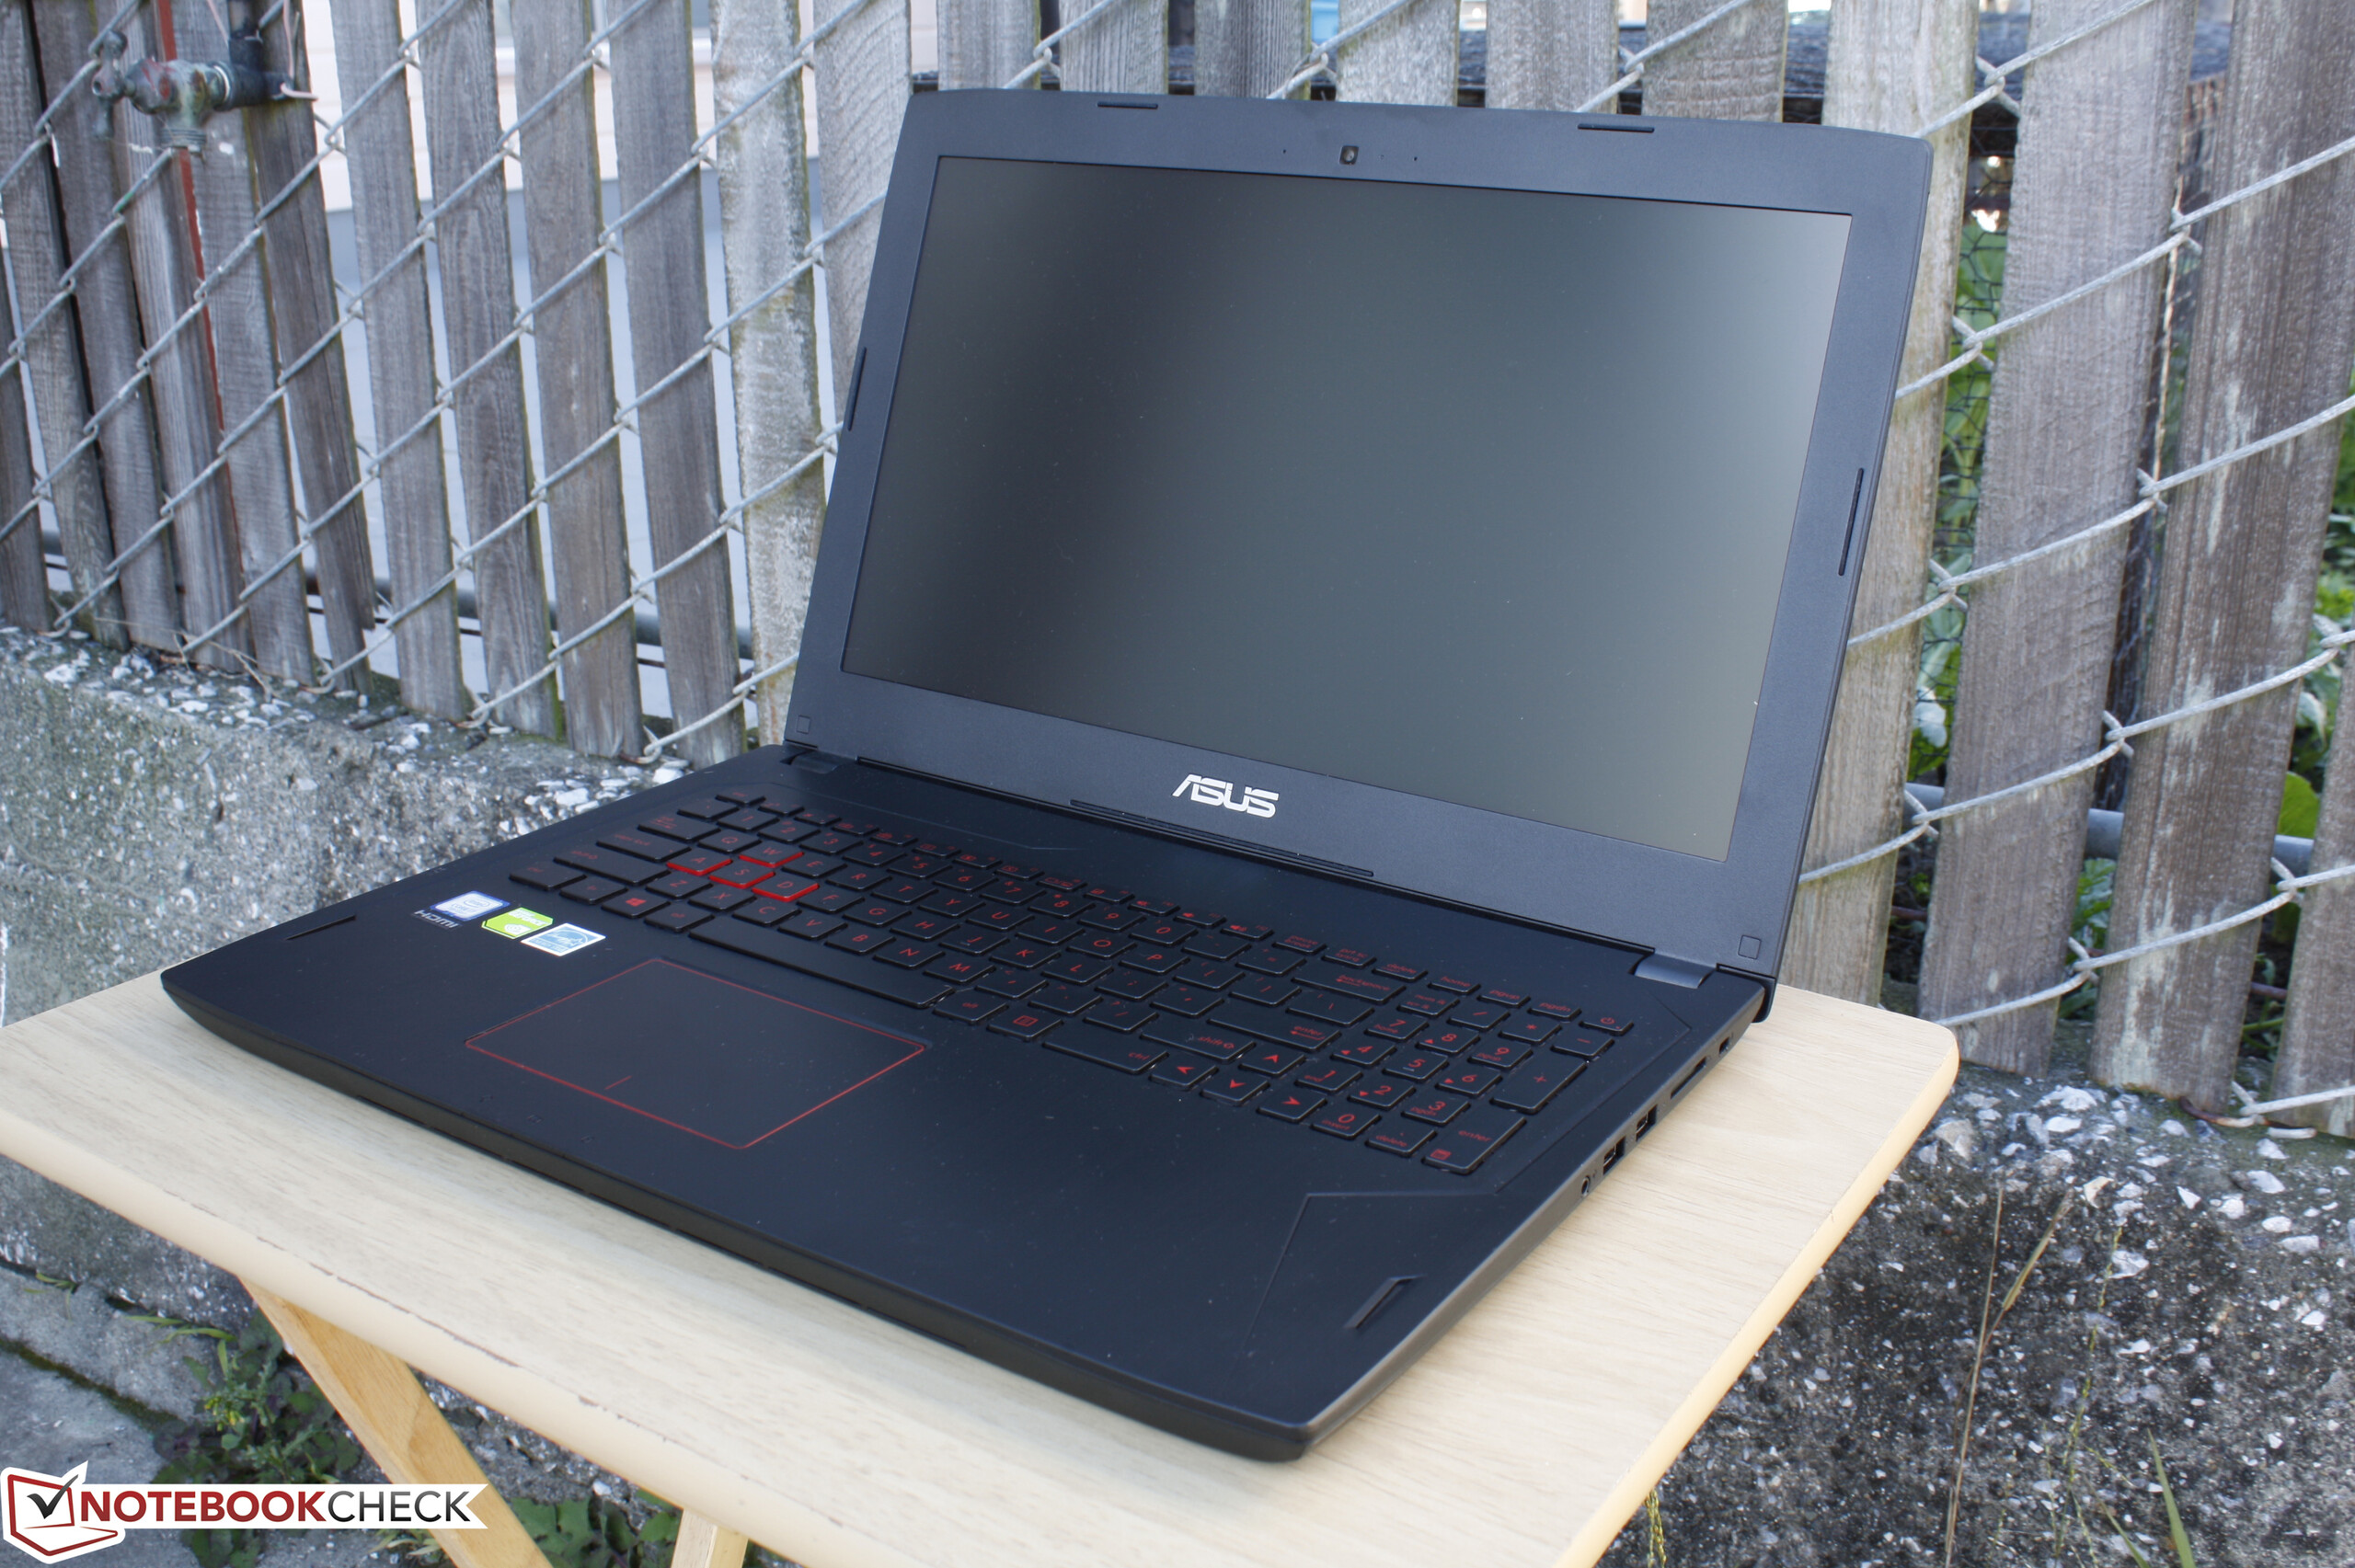
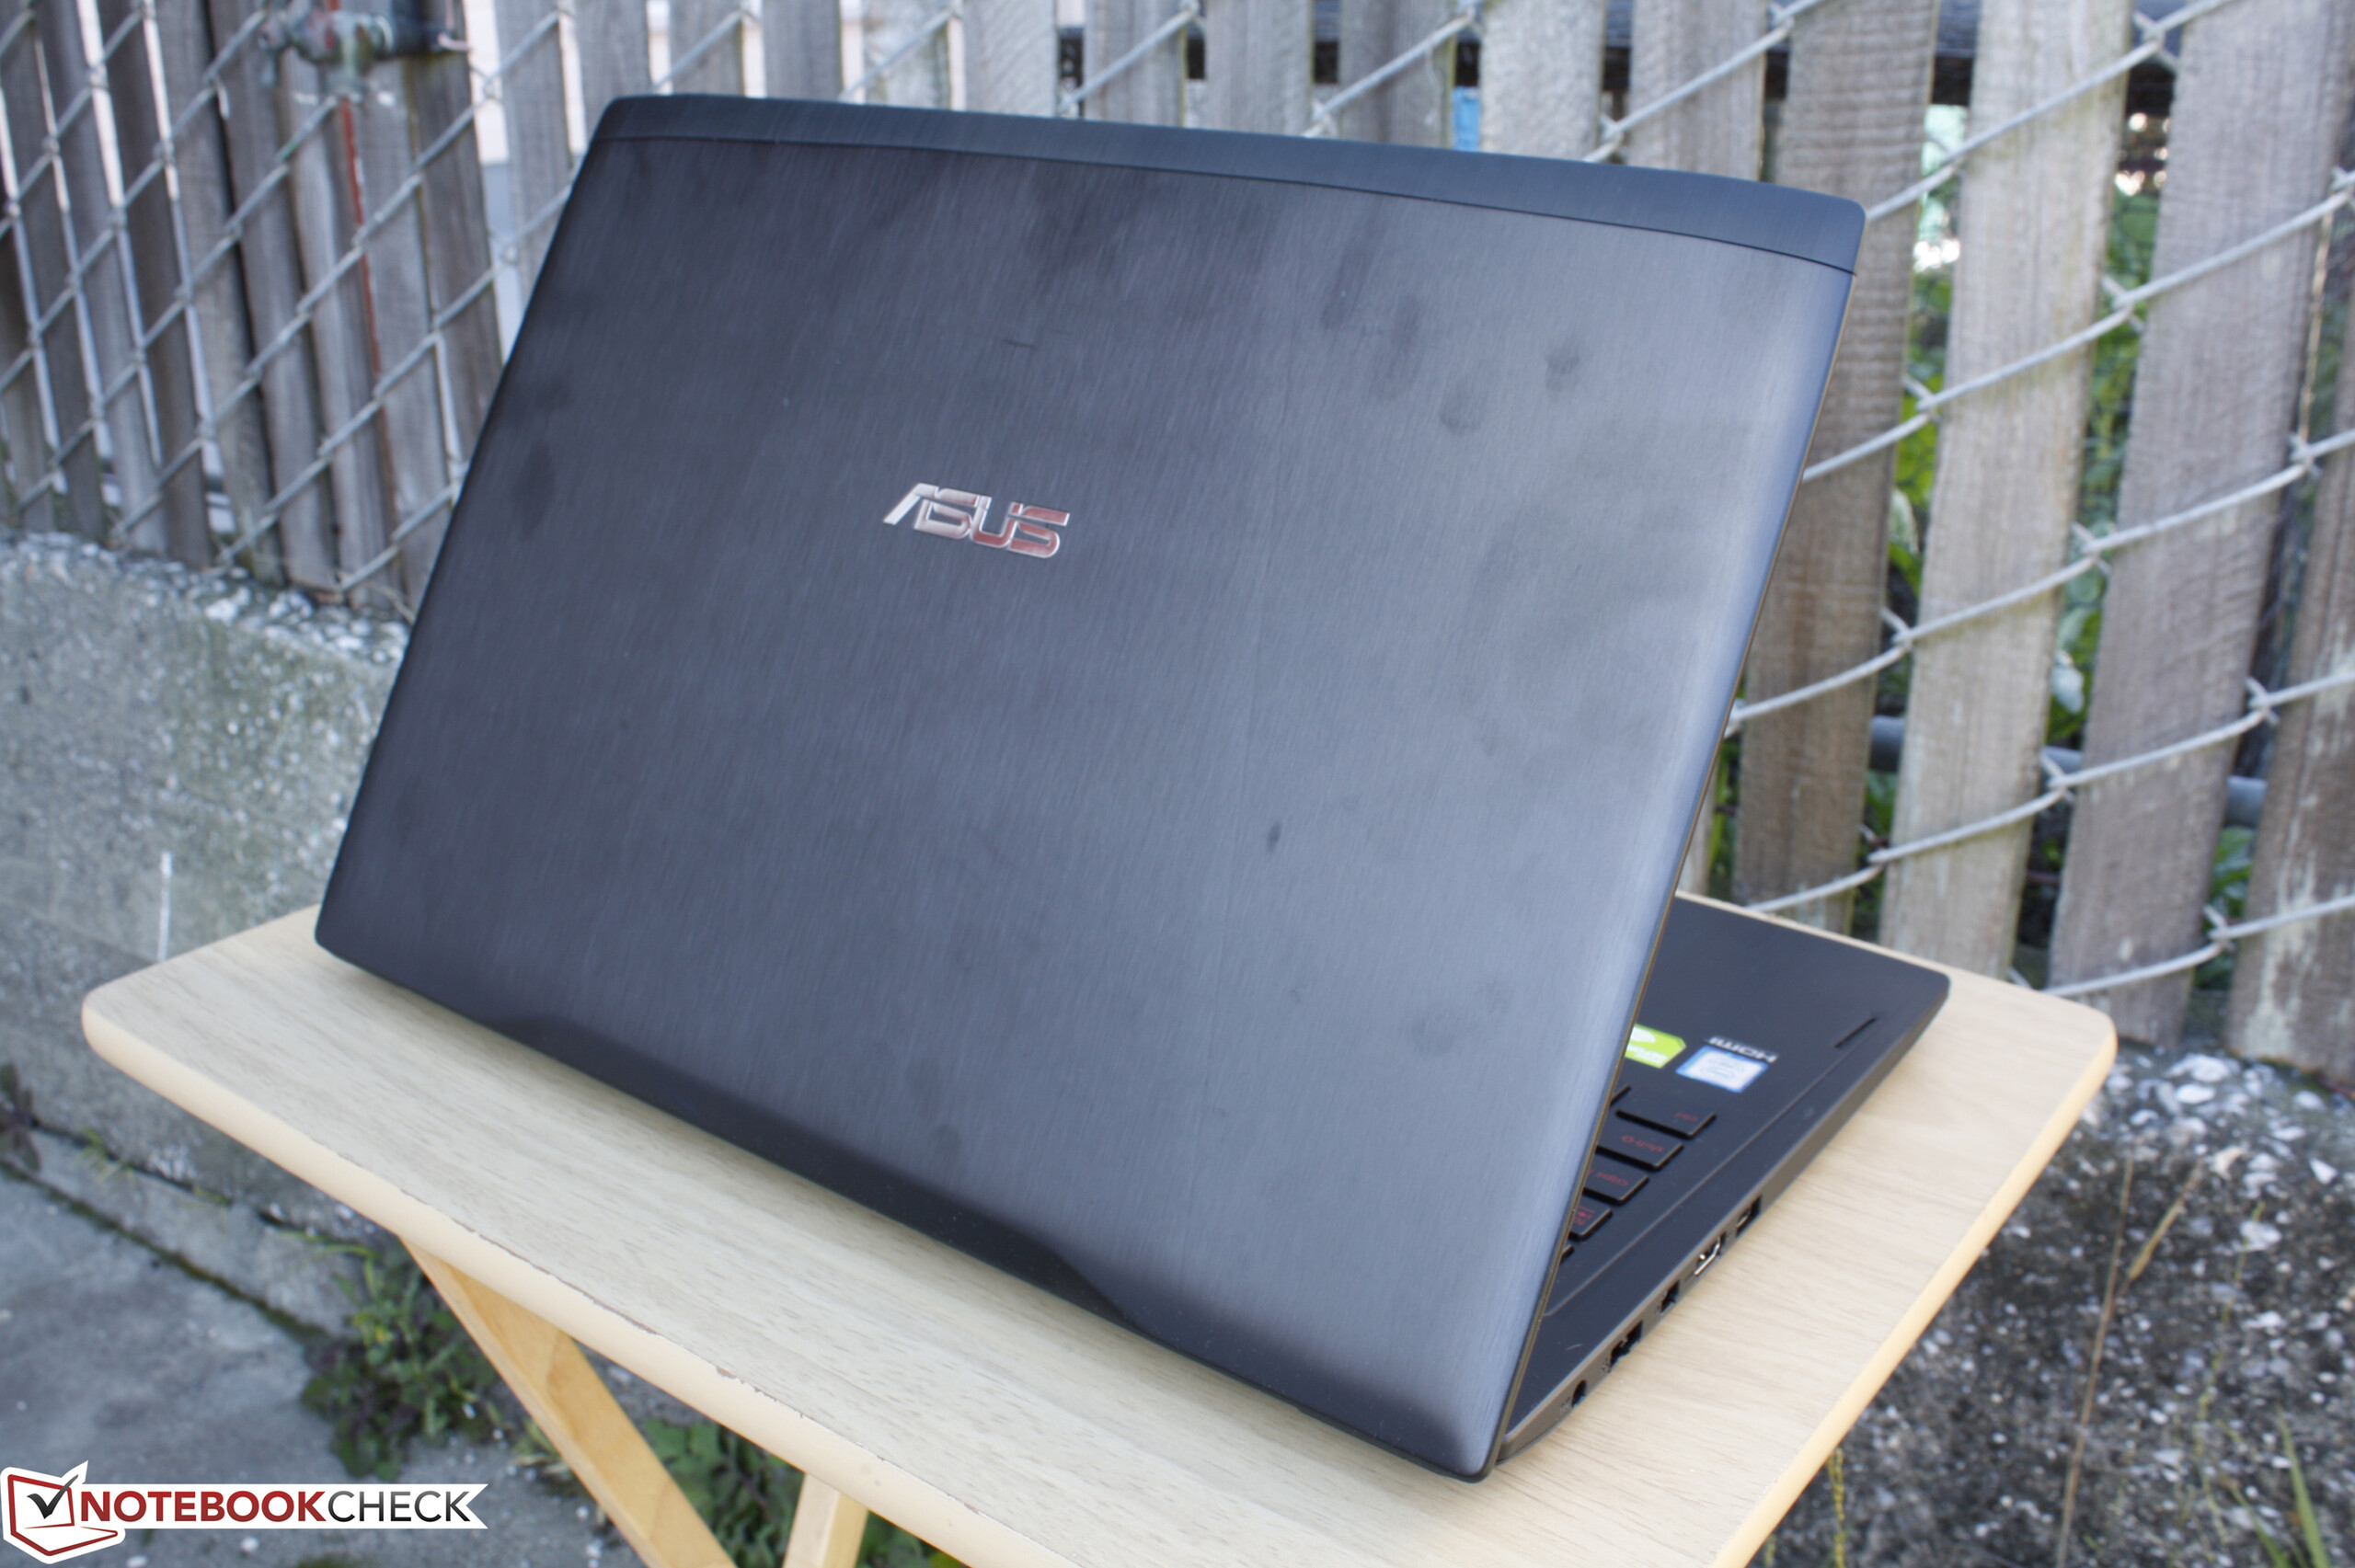
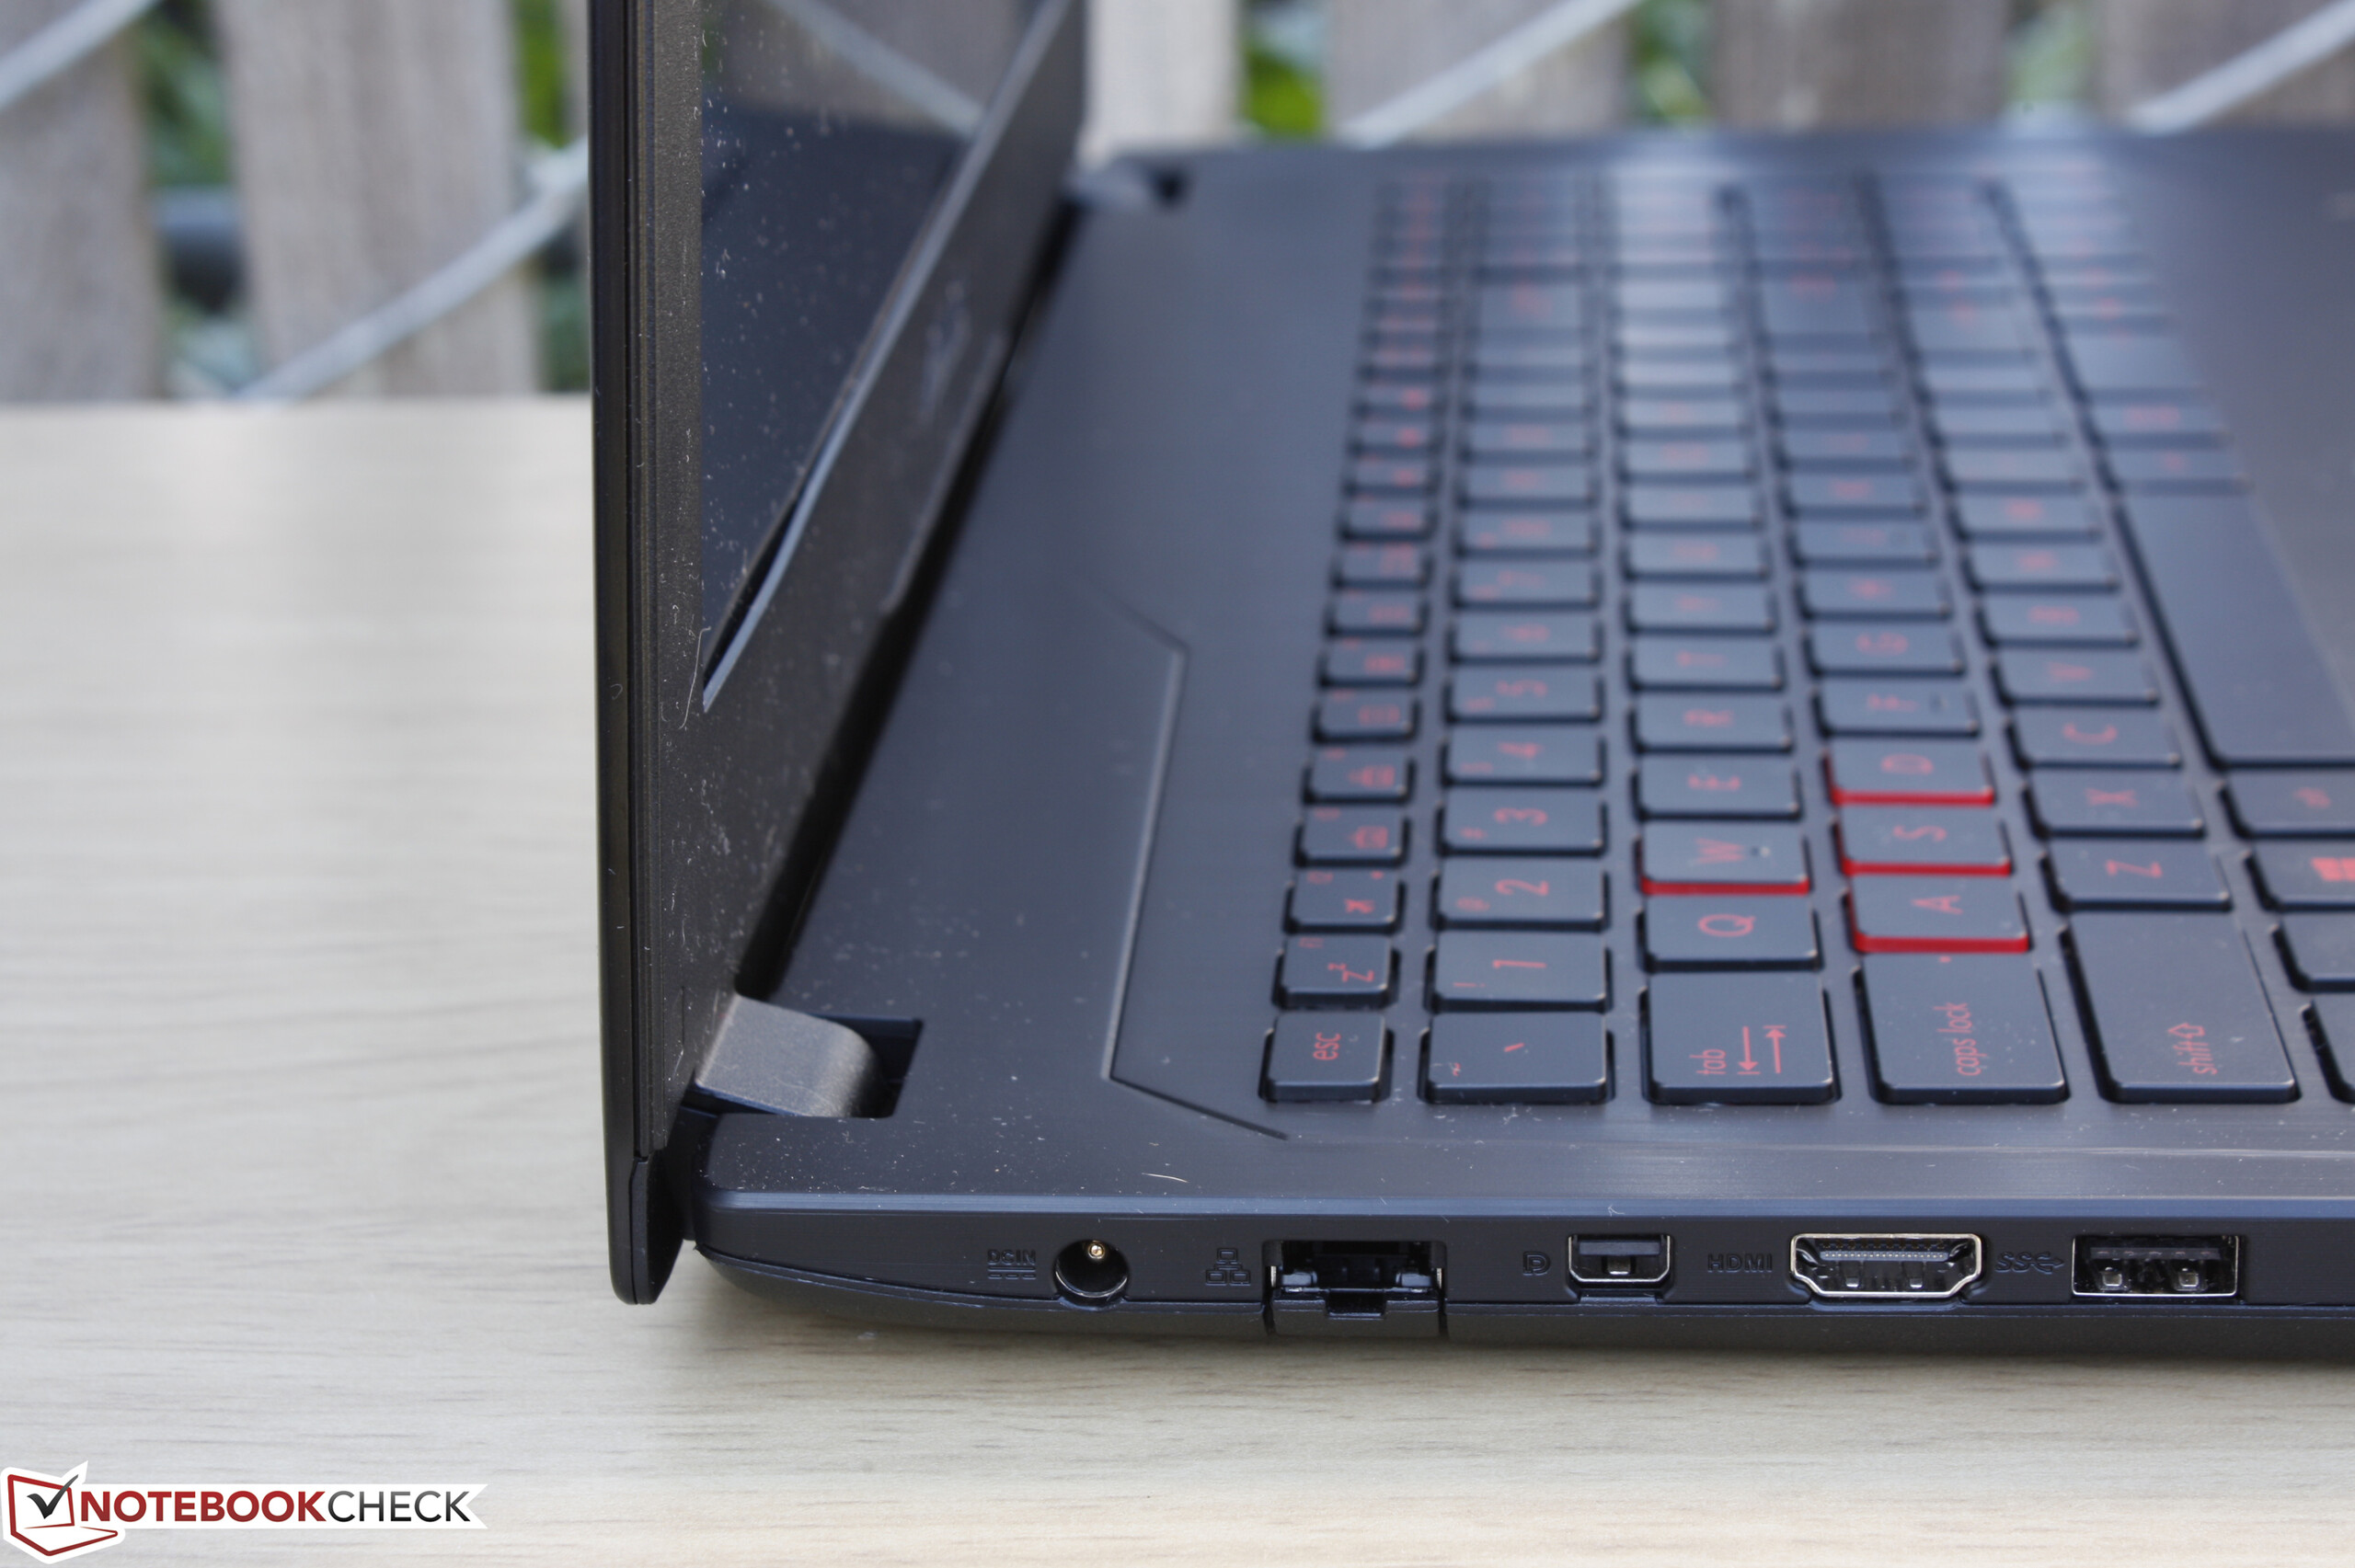
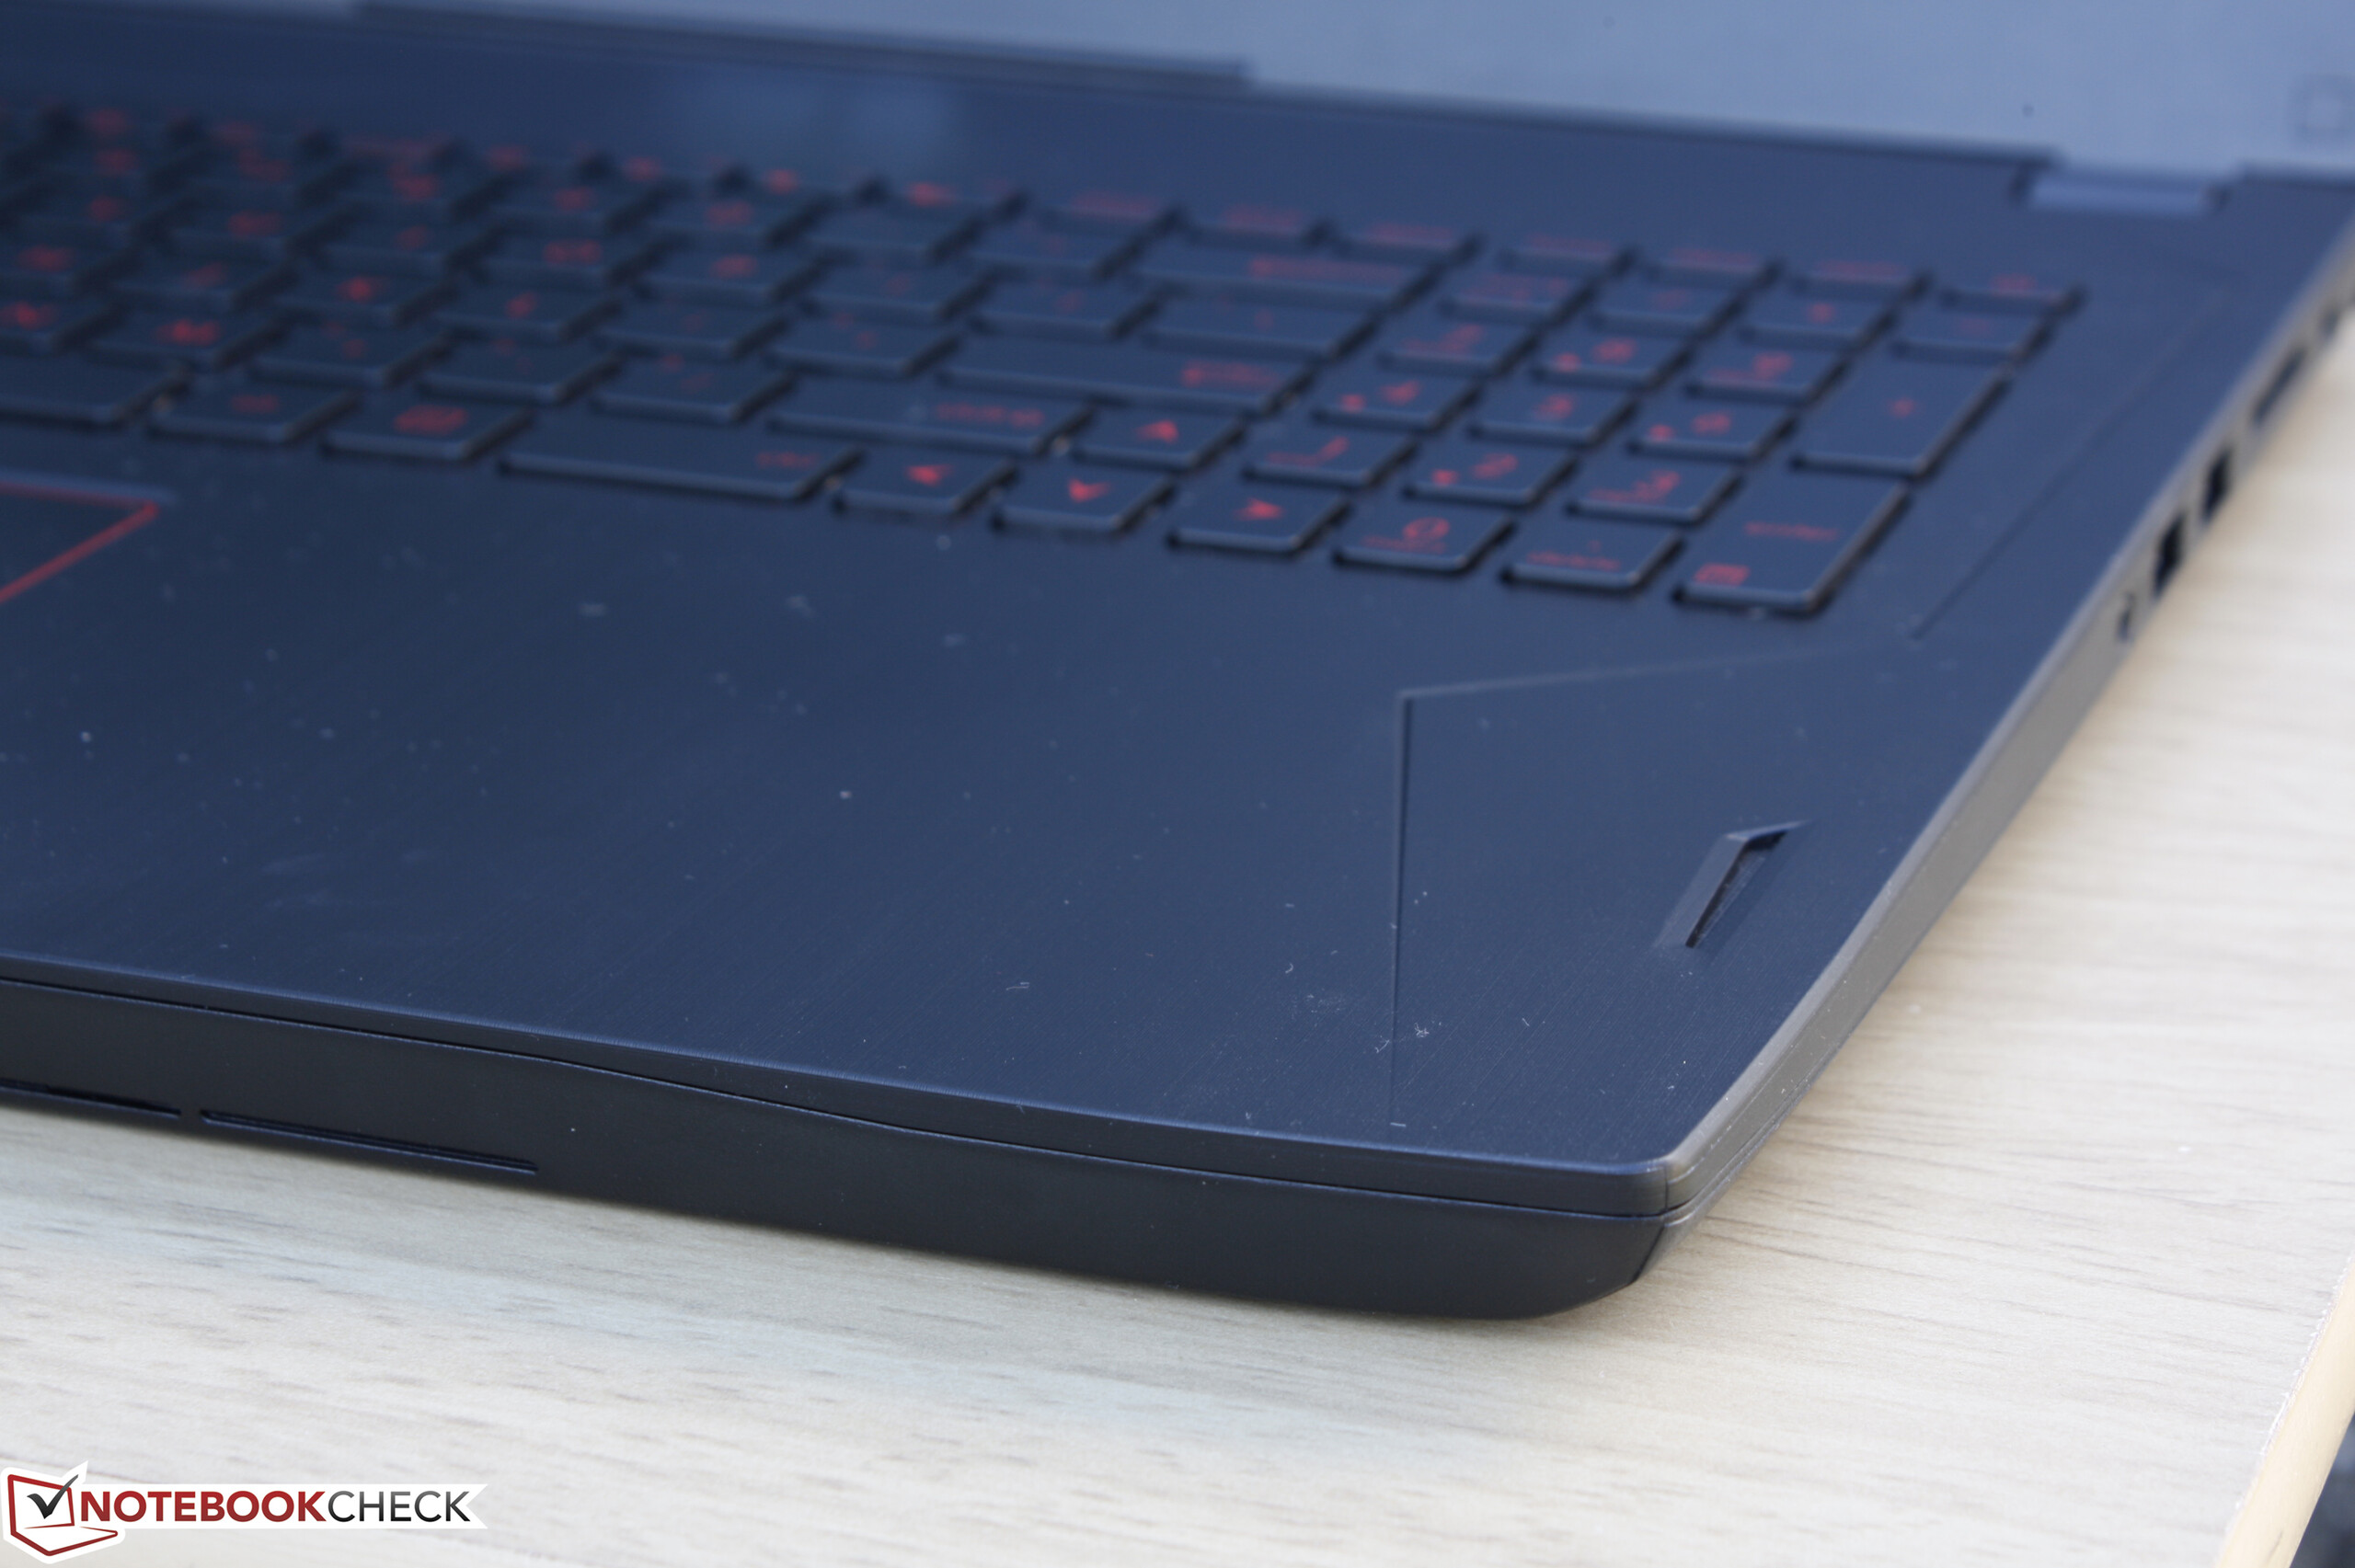
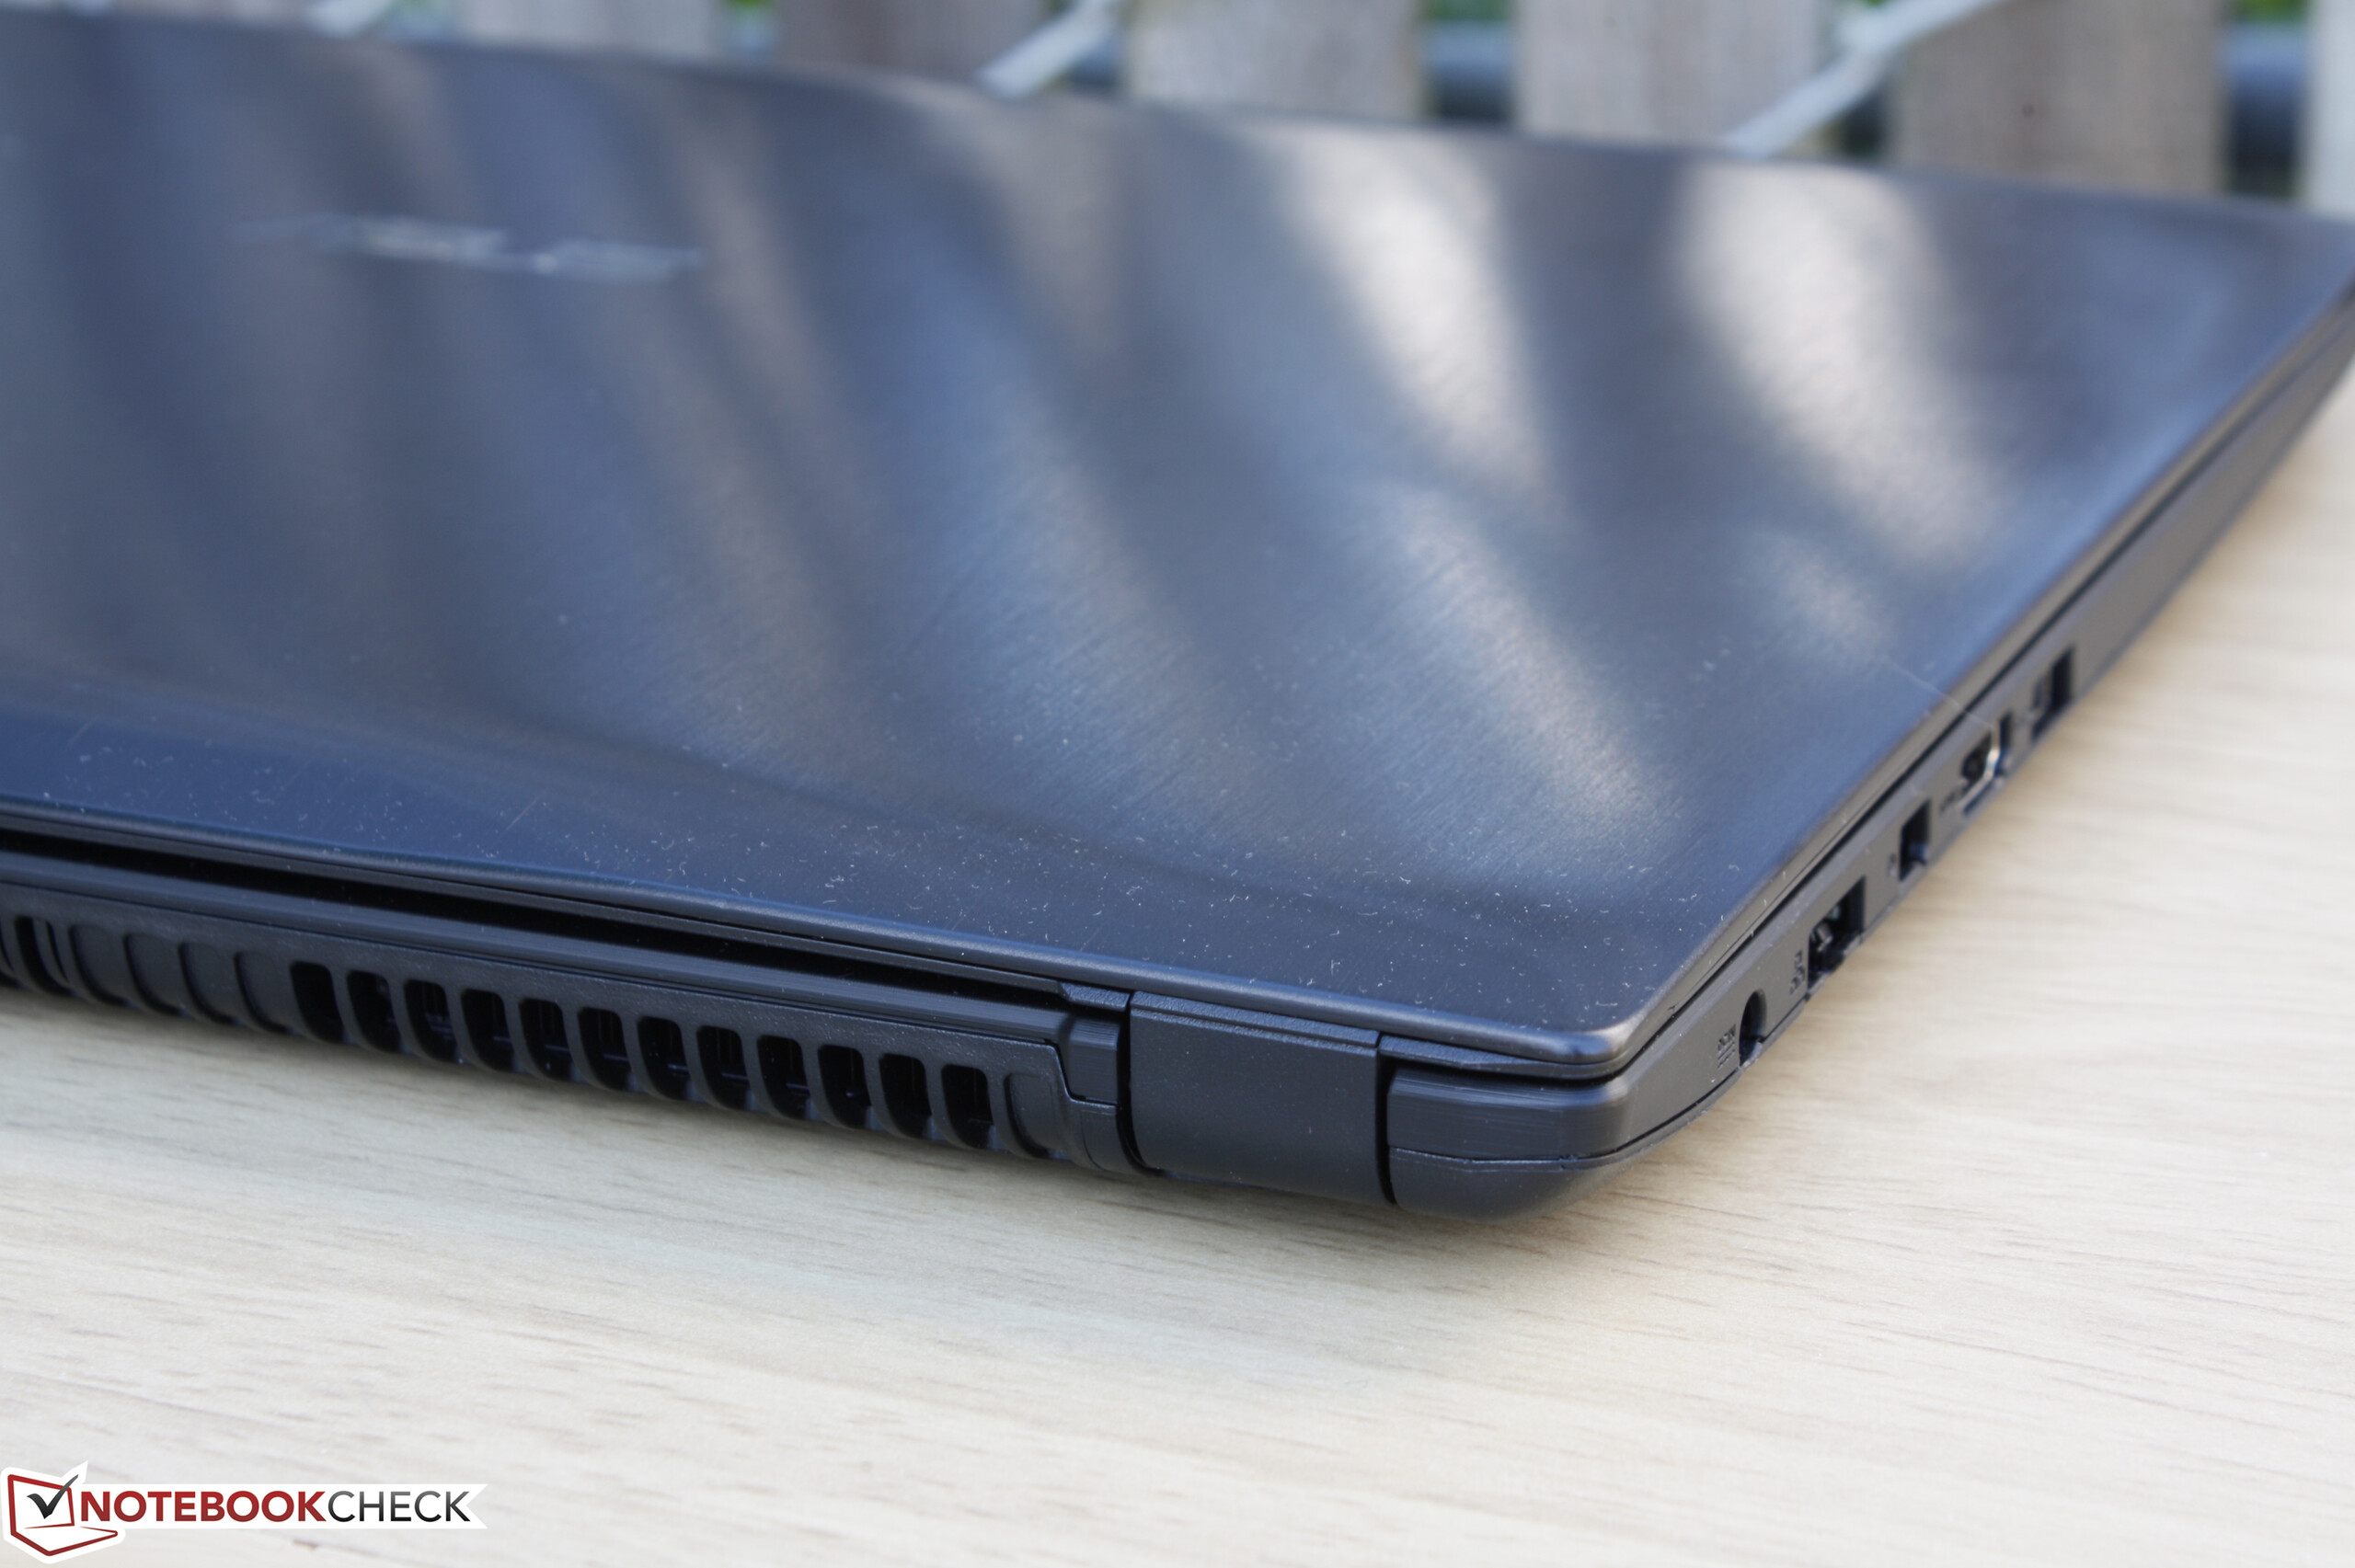
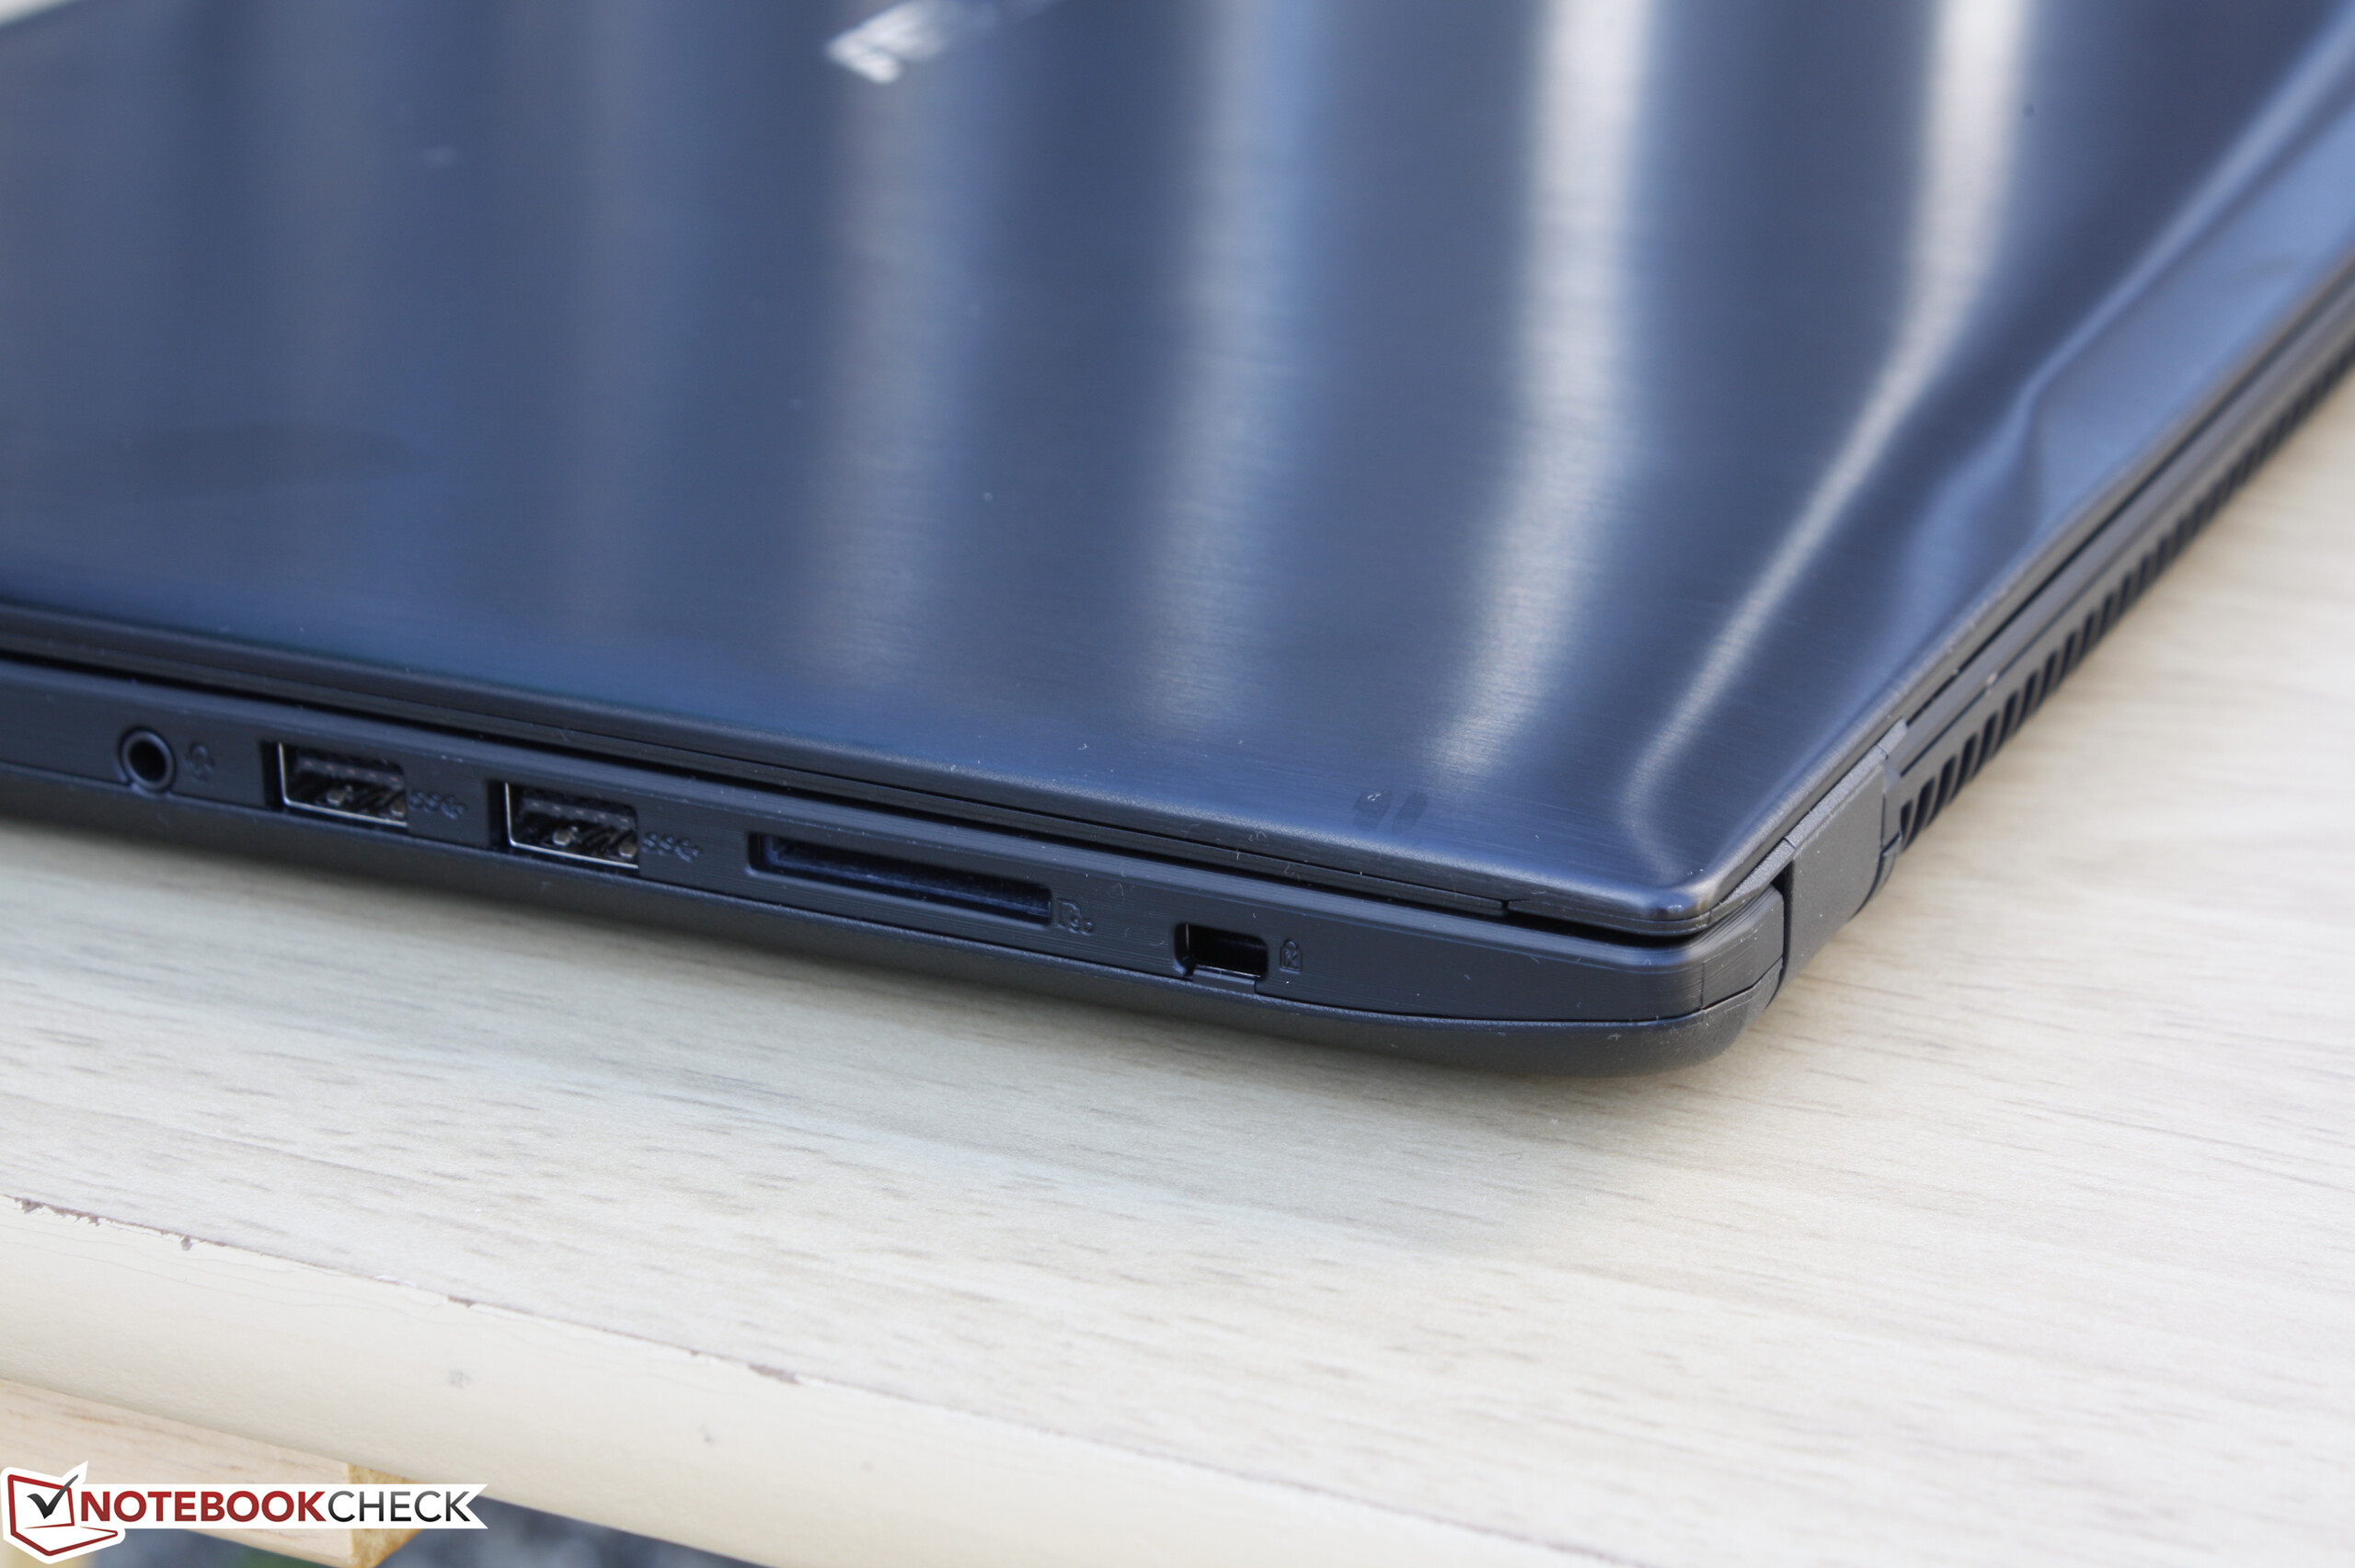
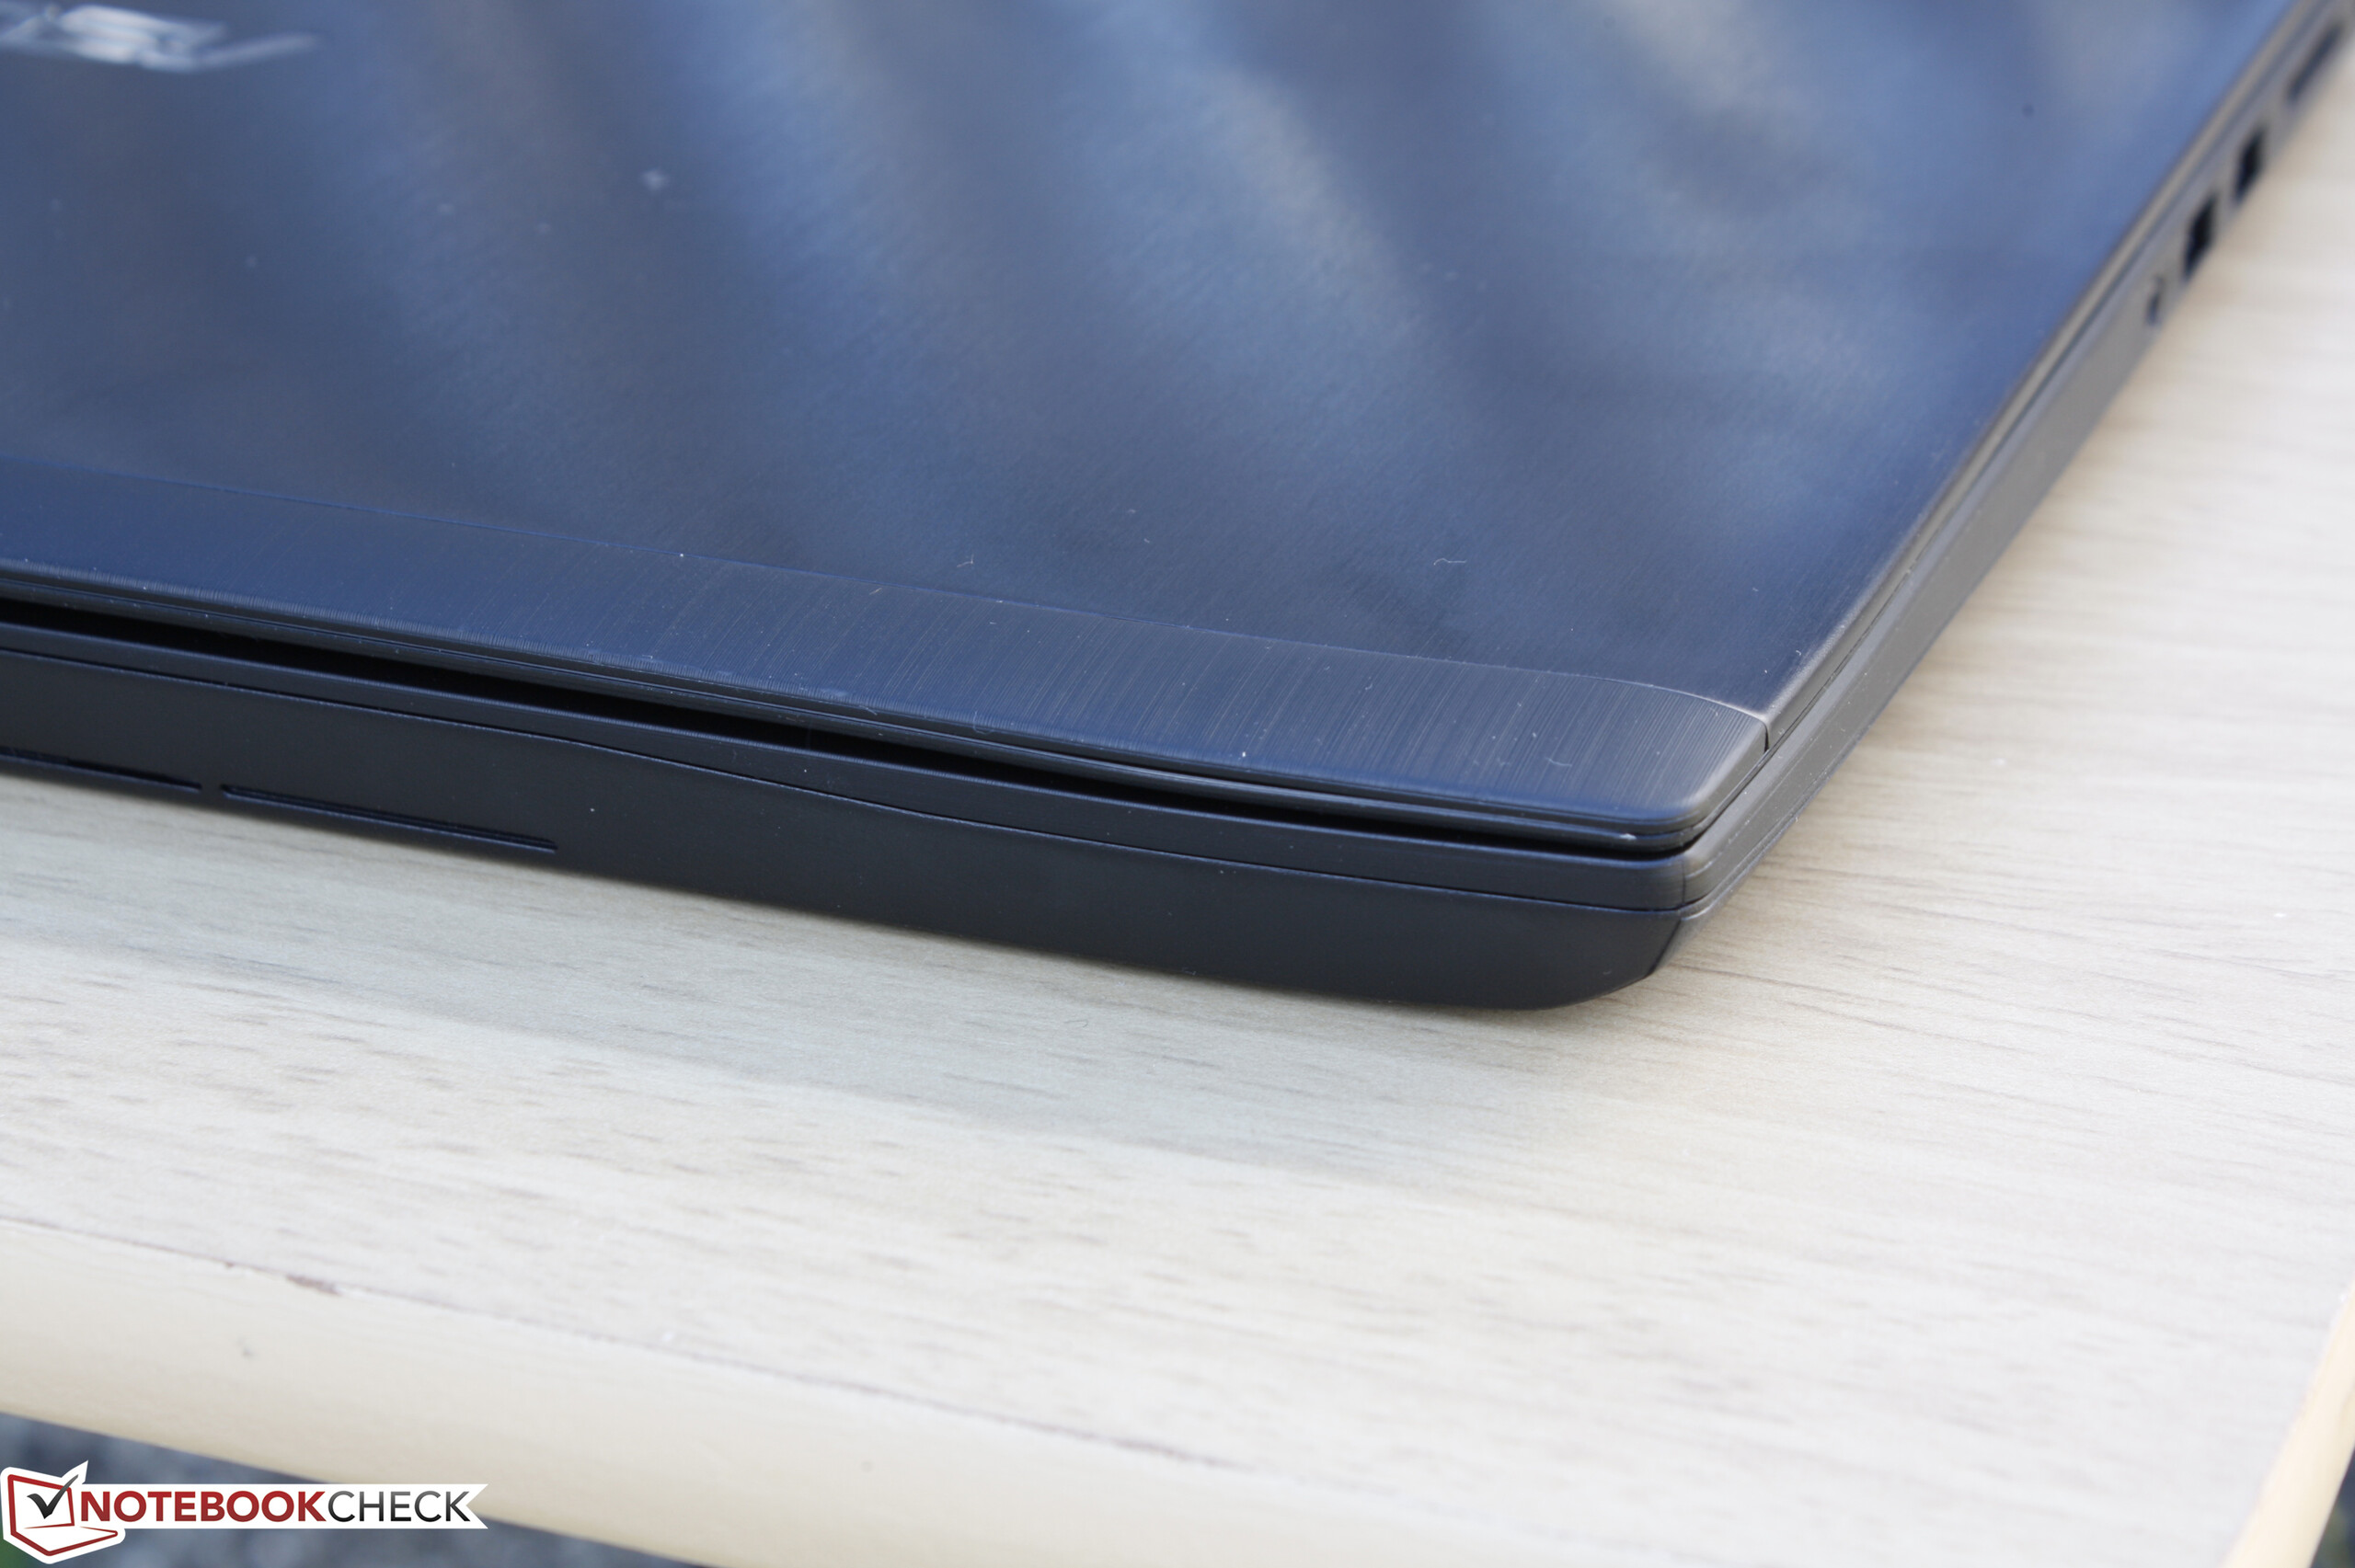
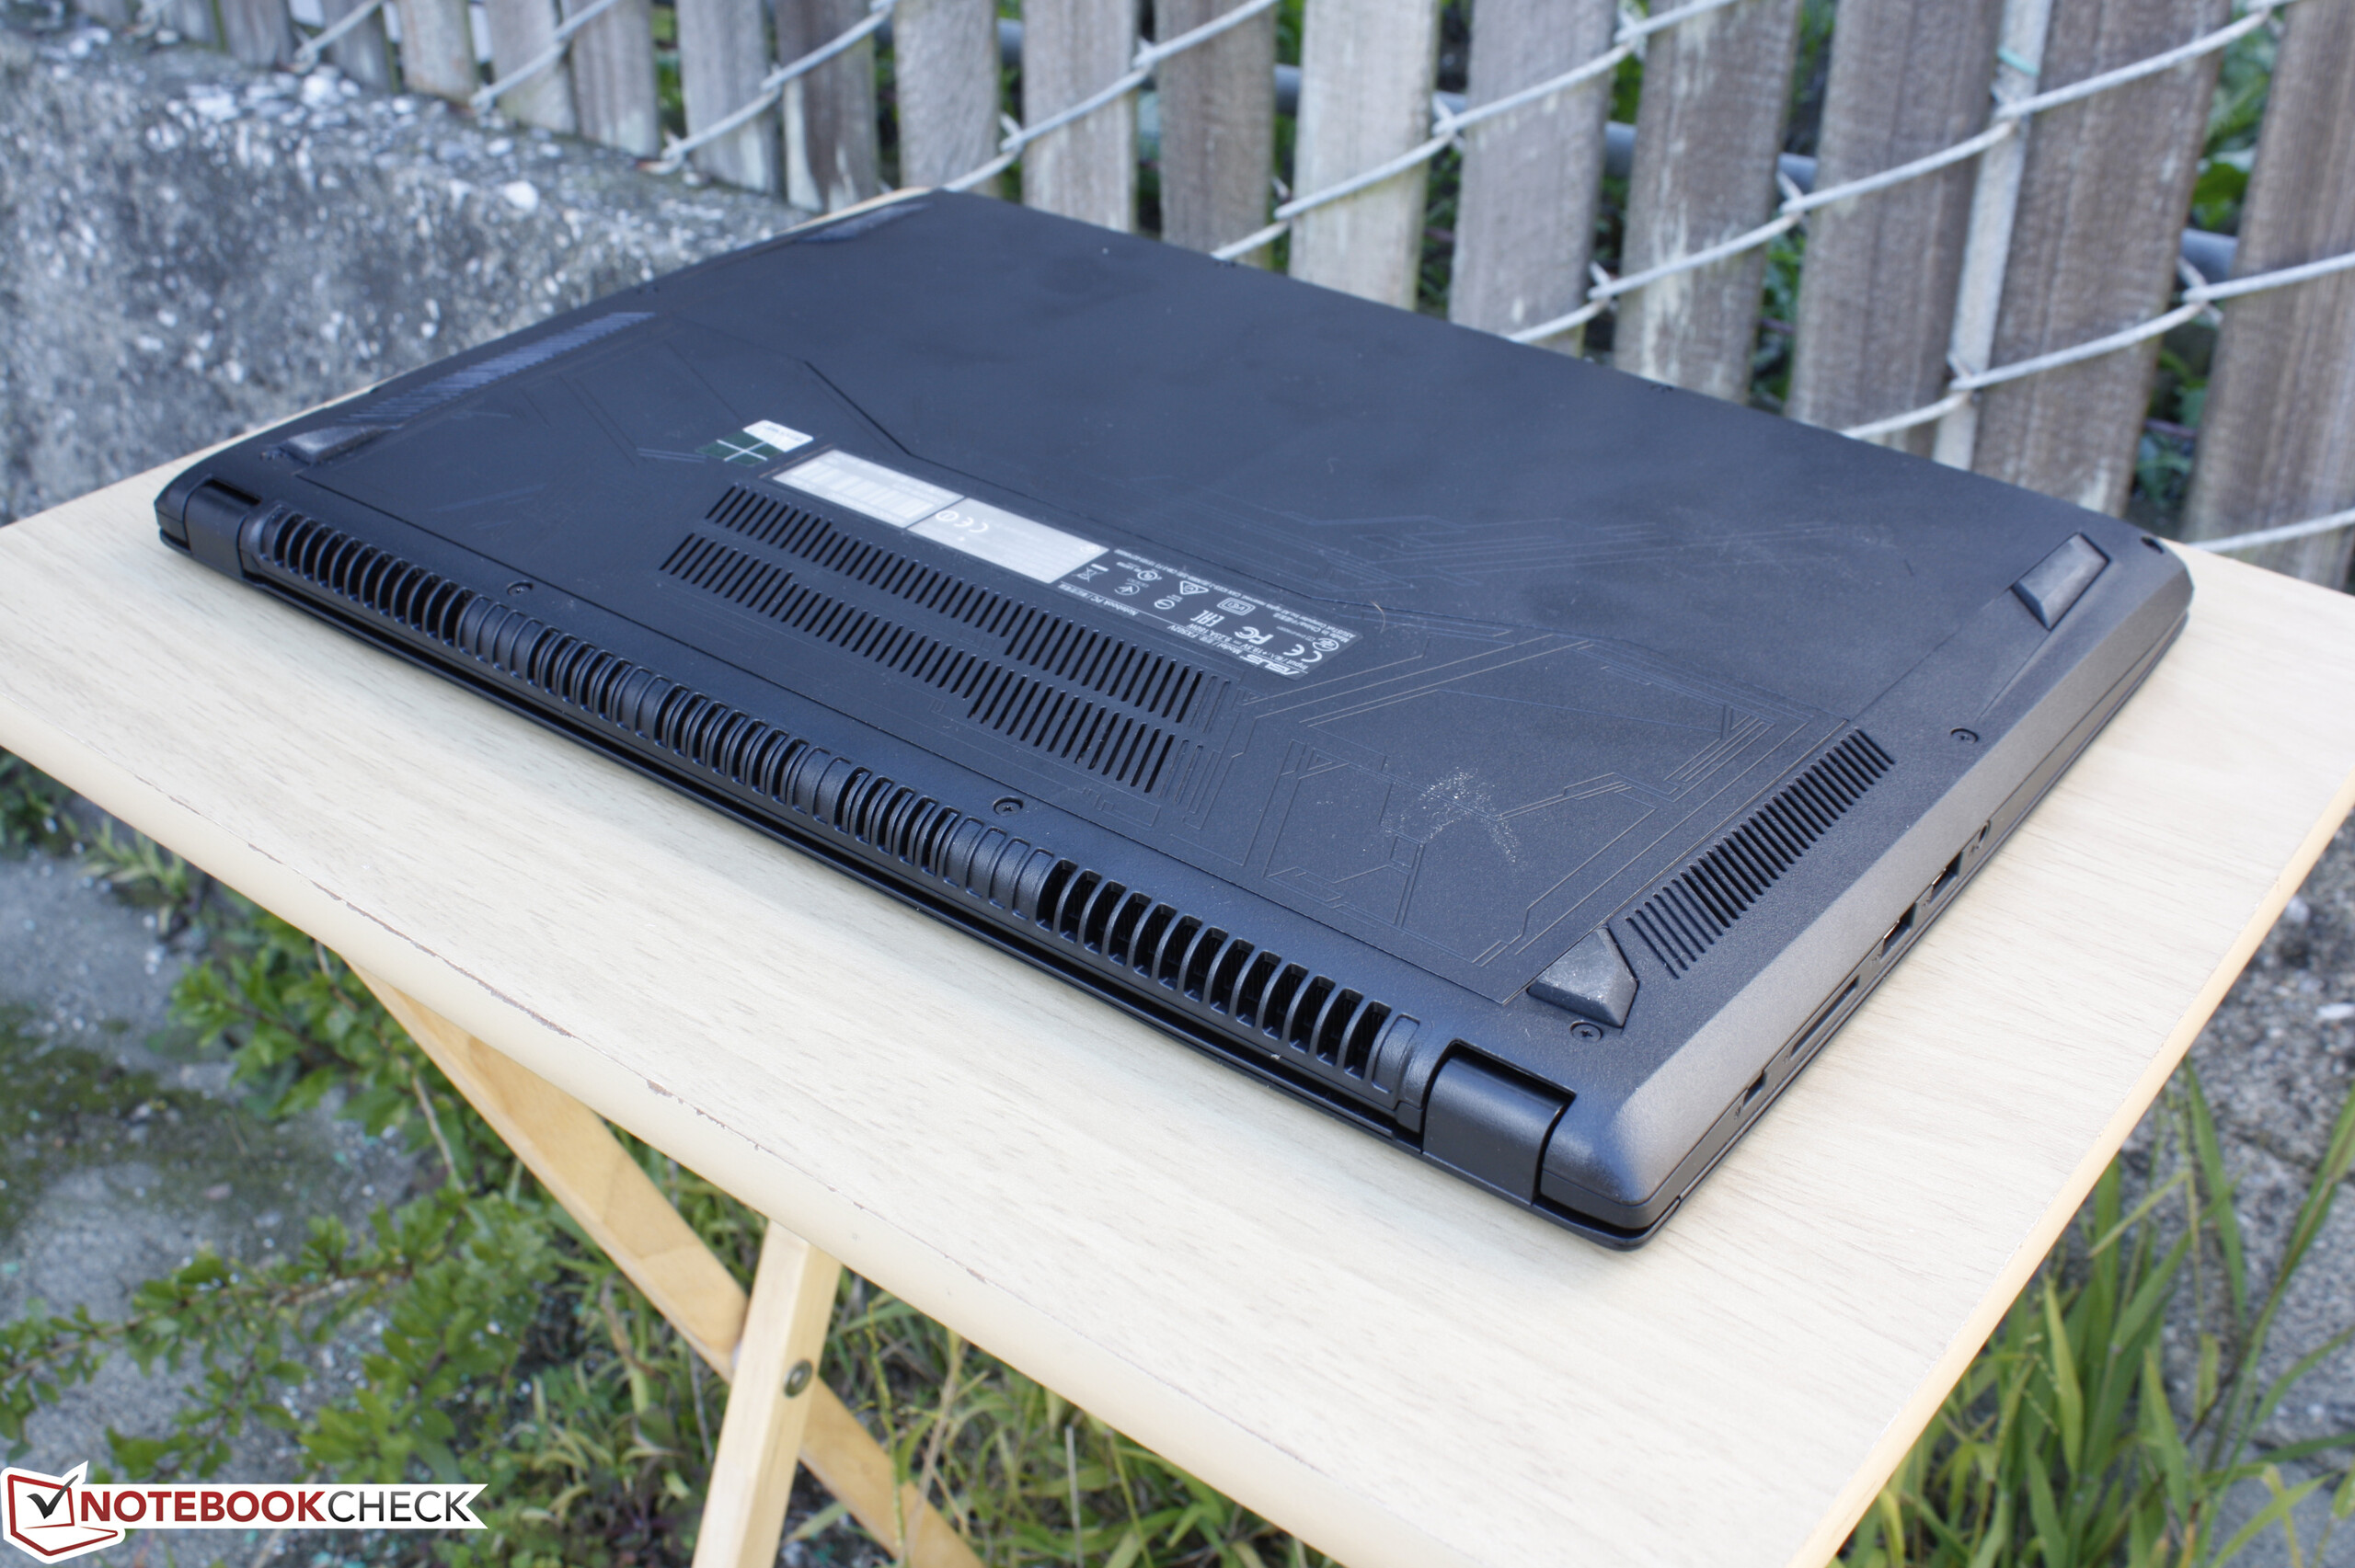
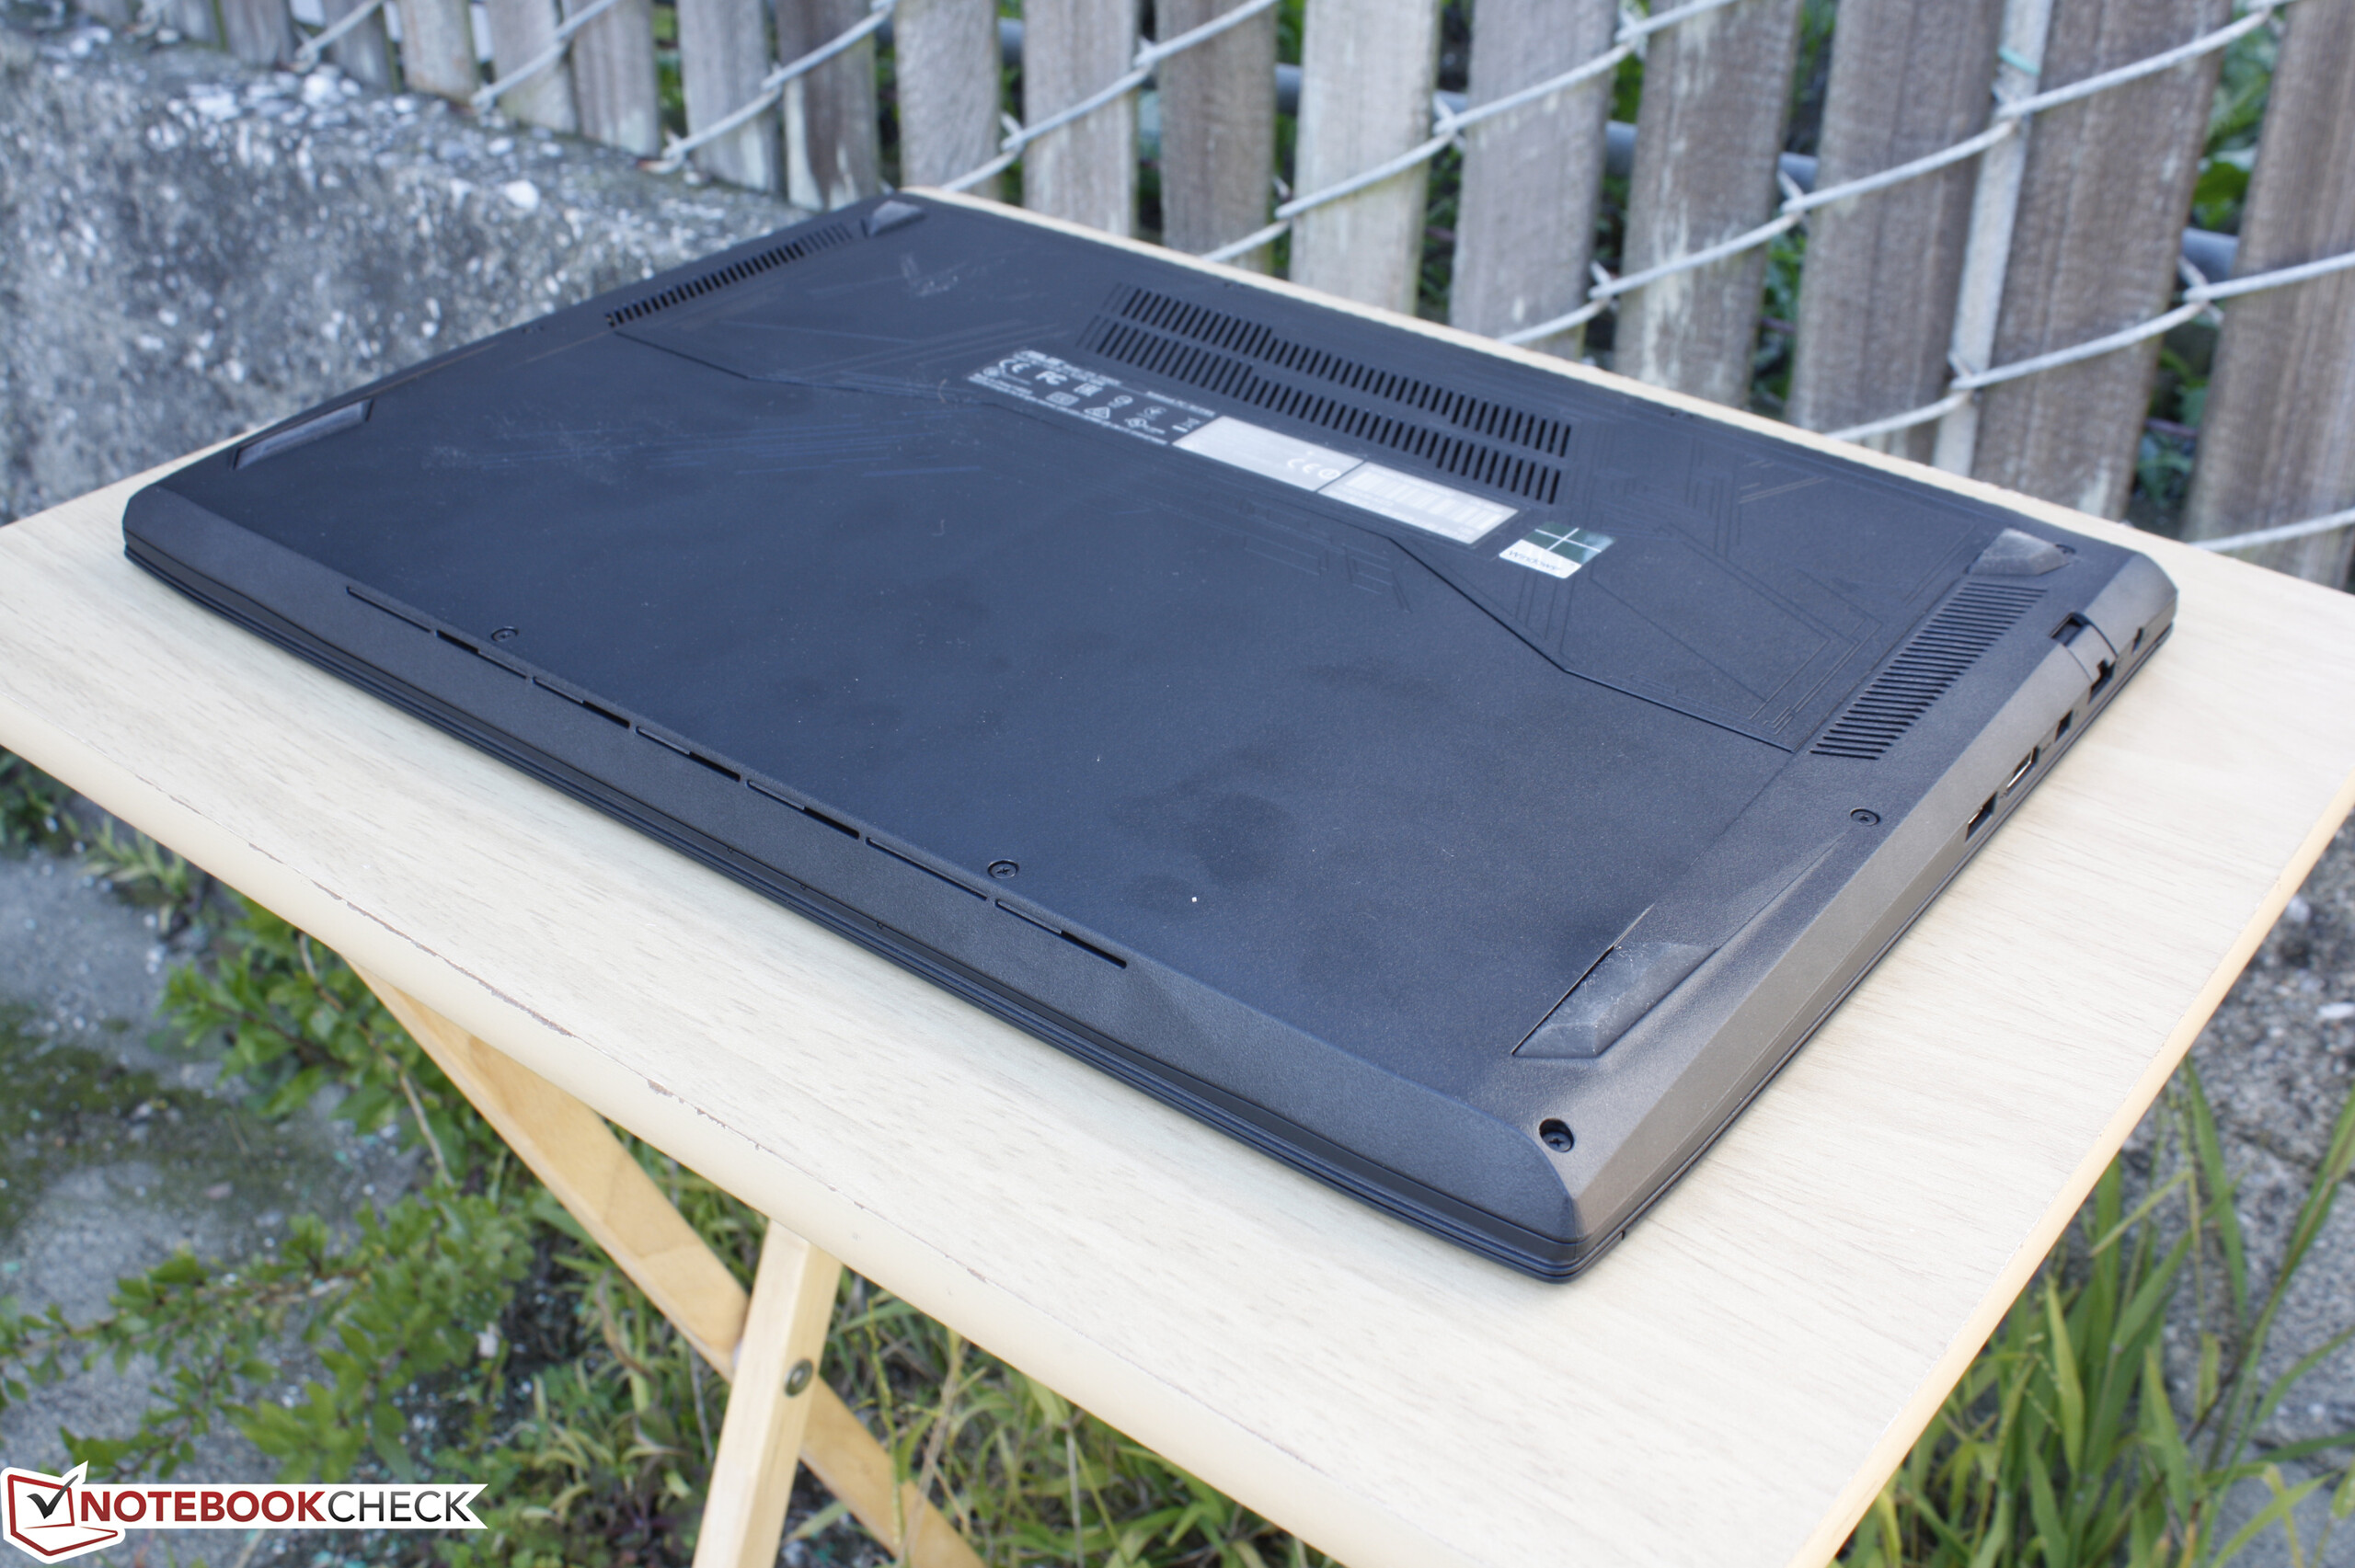
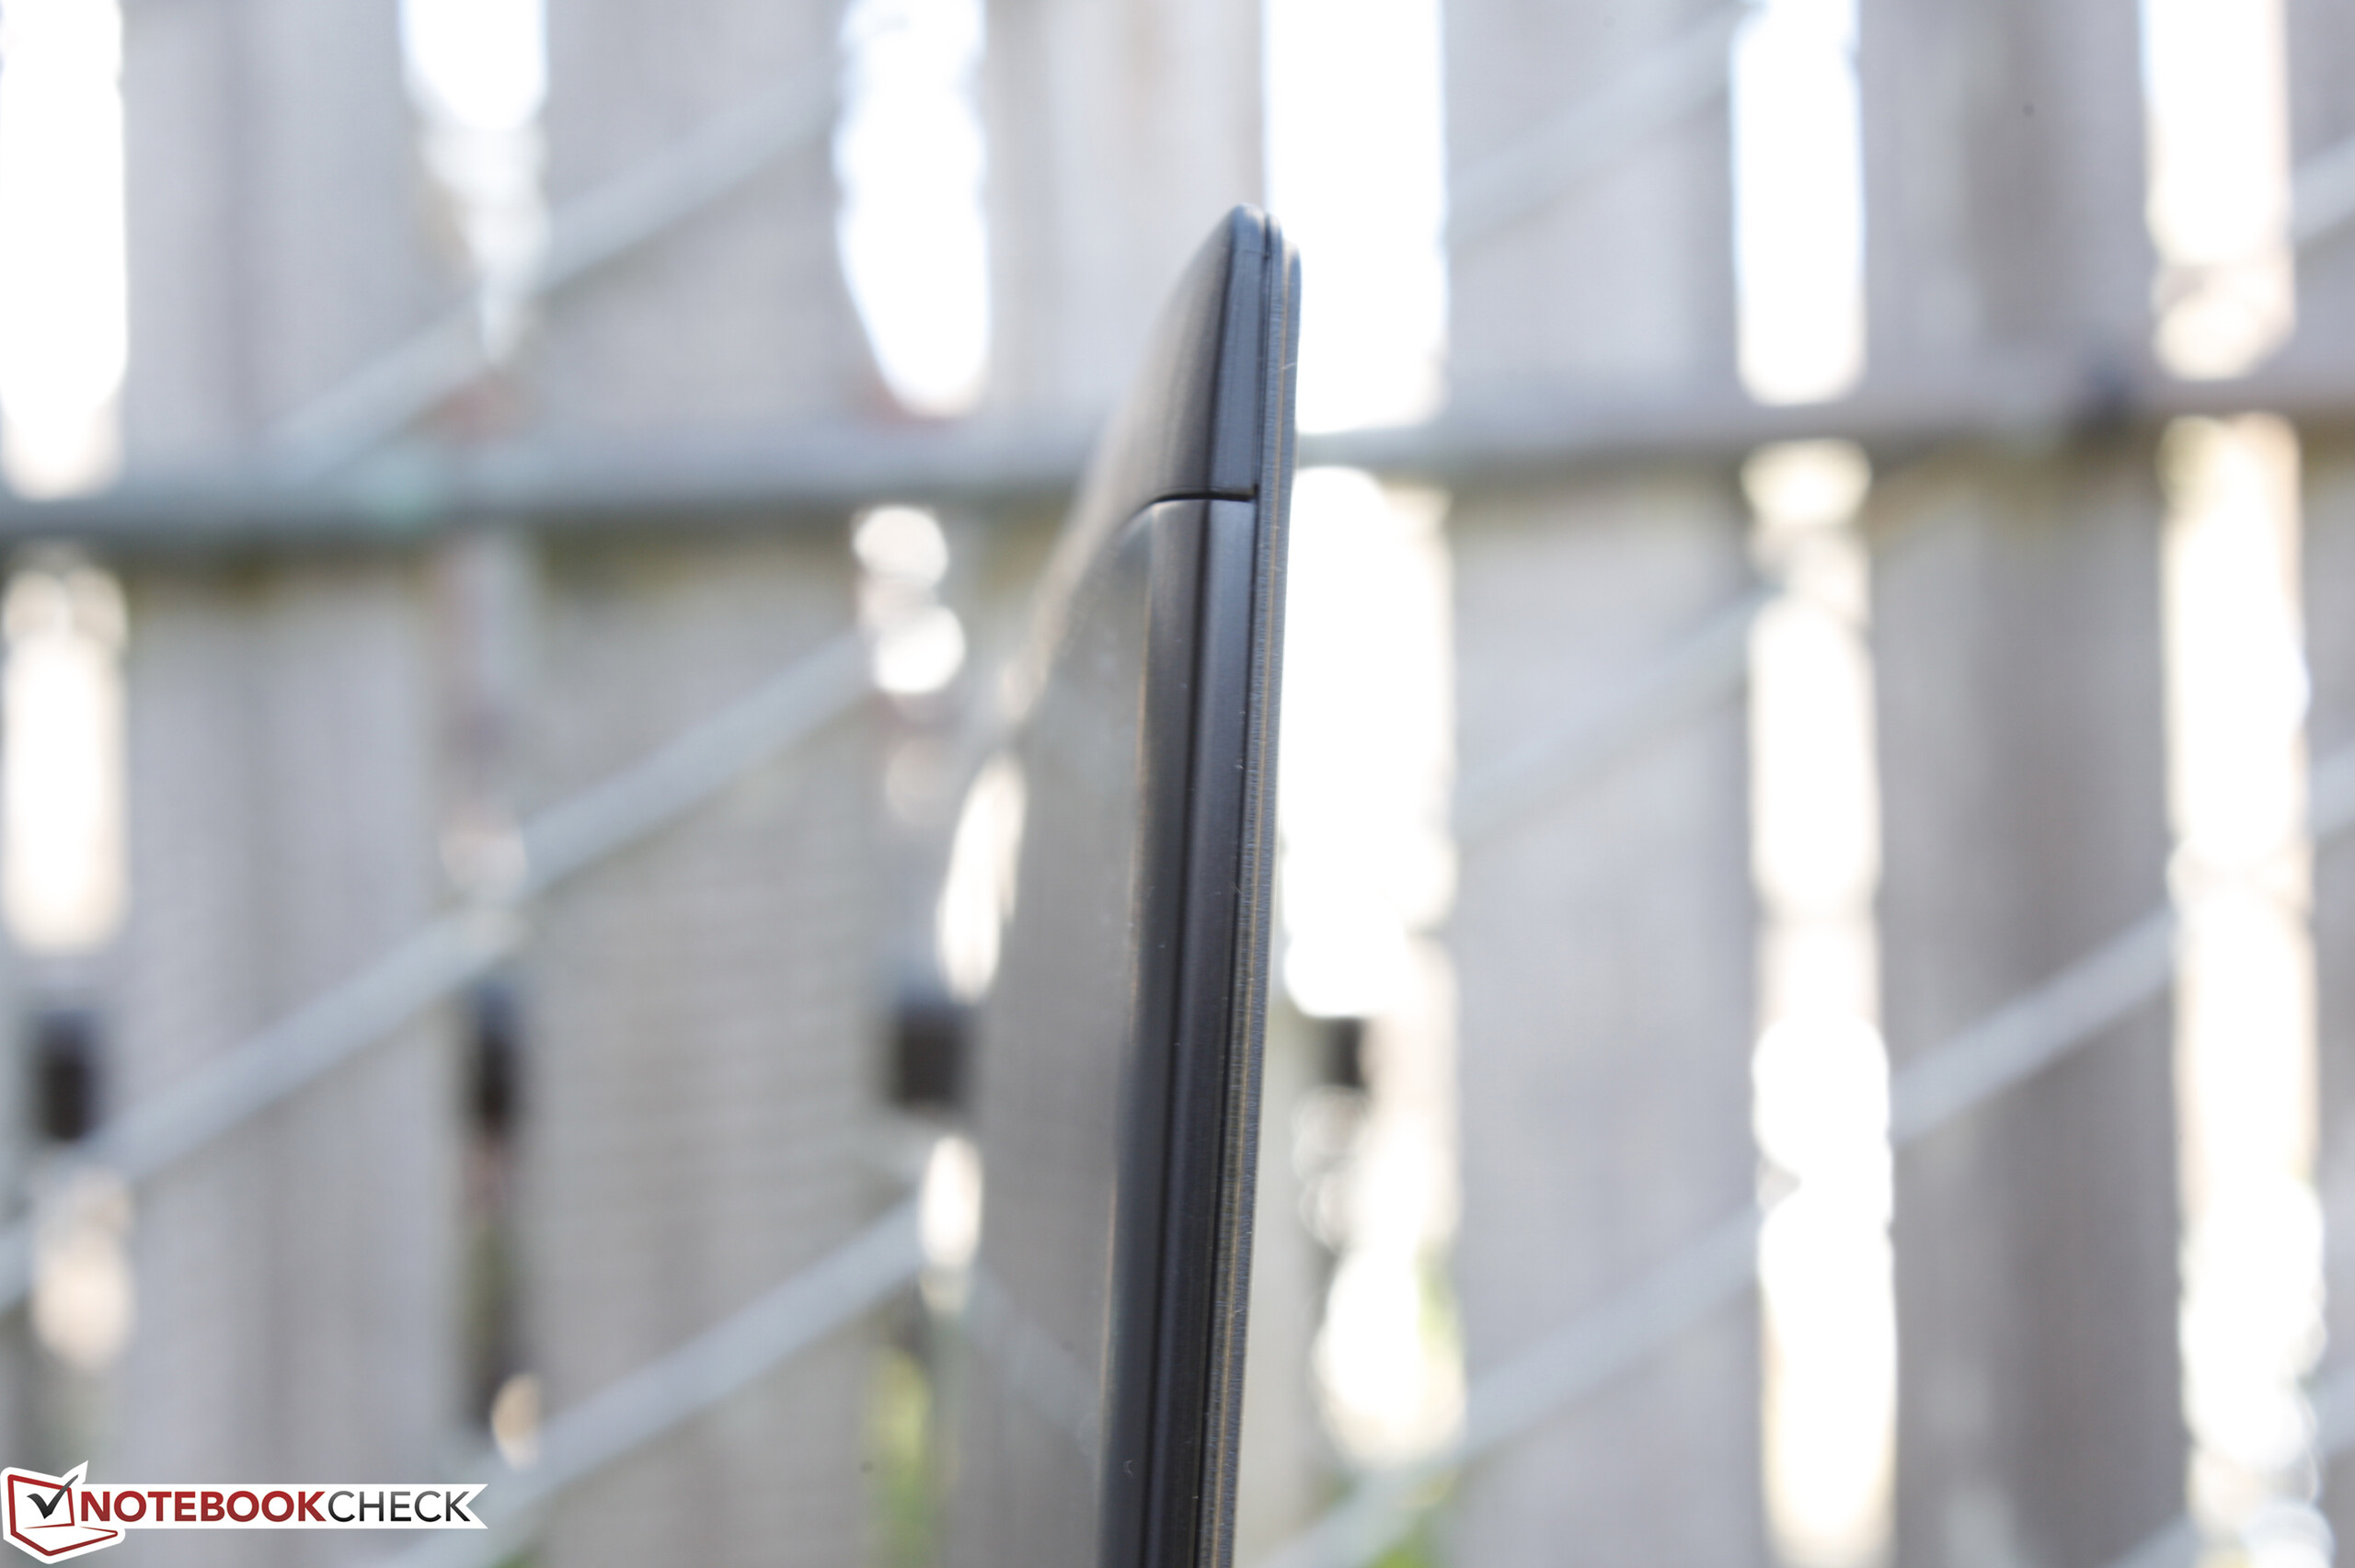
Az FX502VM pár száz dollárral olcsóbb, mint a GL502VM, még úgy is, ha egyforma CPU és tárhely opciókat választunk. Természetesen ez kompromisszumokkal jár, így nincs benne USB-C port, és a GTX 1060 is csak fele VRAM-mal rendelkezik. Összességében még így is egy kiegyensúlyozott gaming gép, mivel a kurtítások szinte semmilyen észre vehető hatással nem voltak az 1080p felbontásban történő játékra. Ezen kívül a GL502VM előnyei és hátrányai itt is megvannak, a viszonylag hangos ventilátort, hajlékony fedelet, és a Thunderbolt 3 hiányát ide értve. A GL502VM egy jó gaming noteszgép, és az FX502VM csak egy kis visszalépés, elérhetőbb árért cserébe. A ház észre vehetően vékonyabb, mint az MSI GE/GL szériáé, és határozottan vonzóbb, mint a HP Omen széria, miközben olcsóbb, mint a jelenlegi Gigabyte felhozatal.
Míg a rendszer határozottan megérdemli azt, hogy pénzszűkében lévő gamereknek ajánljuk, a leggyengébb TN-paneles konfigurációkat mindenképpen érdemes elkerülni, és helyettük egy IPS-es változatra beruházni. Ebben a kategóriában nincs helye a TN panelnek, mivel fényereje, kontrasztja, színei még a belépő szintű notebookok között is rossznak számítanak, nem hogy egy 1000 dolláros játékos gép esetében.
Ez az eredeti értékelés rövidített változata. A teljes, angol nyelvű cikk itt olvasható.
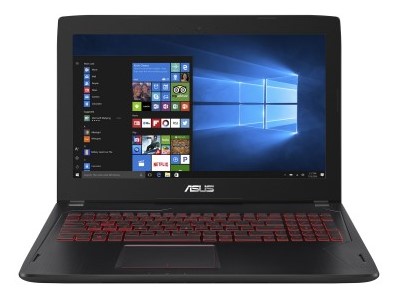
Asus FX502VM-AS73
- 03/04/2017 v6 (old)
Allen Ngo
Price comparison
