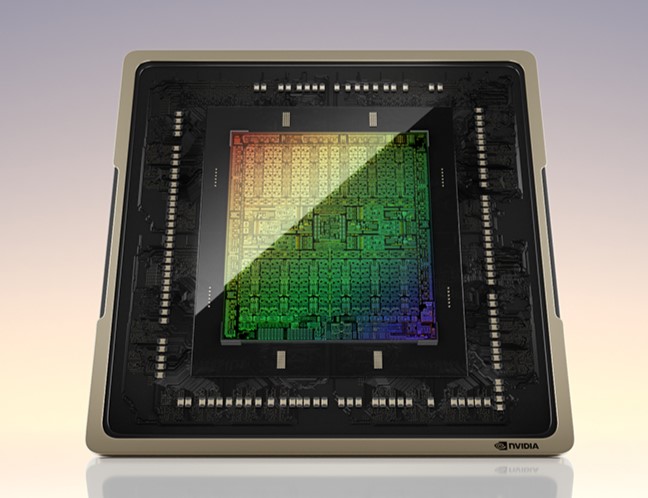
Nvidia Ada RTX 40 Laptop GPU elemzés: a 175 W-os RTX 4090 laptop GPU-teljesítményben és energiahatékonyságban felülmúlja a 350 W-os RTX 3090-et.
| Performance rating - Percent | |
| NVIDIA GeForce RTX 4090 Founders Edition | |
| AMD Radeon RX 7900 XTX | |
| NVIDIA GeForce RTX 4080 Founders Edition | |
| AMD Radeon RX 7900 XT | |
| Asus TUF Gaming GeForce RTX 4070 Ti | |
| MSI Titan GT77 HX 13VI | |
| Schenker XMG Neo 16 Raptor Lake | |
| Átlagos NVIDIA GeForce RTX 3090 | |
| Razer Blade 16 Early 2023 | |
| Átlagos AMD Radeon RX 6800M | |
| Átlagos NVIDIA GeForce RTX 3080 Ti Laptop GPU | |
| Átlagos NVIDIA GeForce RTX 3080 Laptop GPU | |
| Átlagos NVIDIA GeForce RTX 3070 Ti Laptop GPU | |
| Átlagos AMD Radeon RX 6700M -1! | |
| Átlagos AMD Radeon RX 6600M | |
| Átlagos NVIDIA GeForce RTX 3060 Laptop GPU | |
| 3DMark 11 - 1280x720 Performance GPU | |
| NVIDIA GeForce RTX 4090 Founders Edition | |
| NVIDIA GeForce RTX 4080 Founders Edition | |
| AMD Radeon RX 7900 XTX | |
| AMD Radeon RX 7900 XT | |
| Asus TUF Gaming GeForce RTX 4070 Ti | |
| Asus TUF Gaming GeForce RTX 4070 Ti | |
| Schenker XMG Neo 16 Raptor Lake | |
| MSI Titan GT77 HX 13VI | |
| Átlagos NVIDIA GeForce RTX 3090 (55144 - 66934, n=18) | |
| Razer Blade 16 Early 2023 | |
| Átlagos AMD Radeon RX 6800M (39075 - 41706, n=2) | |
| Átlagos NVIDIA GeForce RTX 3080 Ti Laptop GPU (13920 - 45841, n=45) | |
| Átlagos NVIDIA GeForce RTX 3080 Laptop GPU (31288 - 43744, n=40) | |
| Átlagos NVIDIA GeForce RTX 3070 Ti Laptop GPU (13799 - 42569, n=36) | |
| Átlagos AMD Radeon RX 6700M (n=1) | |
| Átlagos AMD Radeon RX 6600M (27030 - 32340, n=6) | |
| Átlagos NVIDIA GeForce RTX 3060 Laptop GPU (13799 - 30772, n=43) | |
| Performance rating - Percent | |
| NVIDIA GeForce RTX 4090 Founders Edition | |
| NVIDIA GeForce RTX 4080 Founders Edition | |
| AMD Radeon RX 7900 XTX -3! | |
| AMD Radeon RX 7900 XT -3! | |
| Asus TUF Gaming GeForce RTX 4070 Ti | |
| Schenker XMG Neo 16 Raptor Lake | |
| MSI Titan GT77 HX 13VI | |
| Átlagos NVIDIA GeForce RTX 3090 | |
| Razer Blade 16 Early 2023 | |
| Átlagos NVIDIA GeForce RTX 3080 Ti Laptop GPU -1! | |
| Átlagos AMD Radeon RX 6700M -12! | |
| Átlagos NVIDIA GeForce RTX 3070 Ti Laptop GPU -6! | |
| Átlagos AMD Radeon RX 6800M -3! | |
| Átlagos NVIDIA GeForce RTX 3080 Laptop GPU | |
| Átlagos NVIDIA GeForce RTX 3060 Laptop GPU | |
| Átlagos AMD Radeon RX 6600M | |
| Performance rating - Percent | |
| NVIDIA GeForce RTX 4090 Founders Edition | |
| NVIDIA GeForce RTX 4080 Founders Edition | |
| Asus TUF Gaming GeForce RTX 4070 Ti | |
| AMD Radeon RX 7900 XTX -2! | |
| AMD Radeon RX 7900 XT -2! | |
| MSI Titan GT77 HX 13VI | |
| Átlagos NVIDIA GeForce RTX 3090 | |
| Schenker XMG Neo 16 Raptor Lake | |
| Razer Blade 16 Early 2023 | |
| Átlagos NVIDIA GeForce RTX 3080 Ti Laptop GPU | |
| Átlagos NVIDIA GeForce RTX 3080 Laptop GPU | |
| Átlagos NVIDIA GeForce RTX 3070 Ti Laptop GPU | |
| Átlagos NVIDIA GeForce RTX 3060 Laptop GPU -1! | |
| Átlagos AMD Radeon RX 6700M -5! | |
| Átlagos AMD Radeon RX 6600M -2! | |
| Átlagos AMD Radeon RX 6800M -1! | |
| Metro Exodus - 1920x1080 Ultra Quality DXR AF:16x | |
| AMD Radeon RX 7900 XTX | |
| NVIDIA GeForce RTX 4080 Founders Edition | |
| NVIDIA GeForce RTX 4090 Founders Edition | |
| Asus TUF Gaming GeForce RTX 4070 Ti | |
| AMD Radeon RX 7900 XT | |
| Átlagos NVIDIA GeForce RTX 3090 (68.6 - 122.2, n=12) | |
| MSI Titan GT77 HX 13VI | |
| Razer Blade 16 Early 2023 | |
| Schenker XMG Neo 16 Raptor Lake | |
| Átlagos NVIDIA GeForce RTX 3080 Ti Laptop GPU (n=1) | |
| Átlagos NVIDIA GeForce RTX 3080 Laptop GPU (59.1 - 74.5, n=6) | |
| Átlagos NVIDIA GeForce RTX 3070 Ti Laptop GPU (61.3 - 65.1, n=2) | |
| Átlagos AMD Radeon RX 6800M (54.9 - 57.4, n=3) | |
| Átlagos NVIDIA GeForce RTX 3060 Laptop GPU (50.9 - 54.4, n=3) | |
| Átlagos AMD Radeon RX 6600M (43.8 - 54.4, n=3) | |
| Watch Dogs Legion - 1920x1080 Ultra Preset + Ultra Ray Tracing (DX12) | |
| NVIDIA GeForce RTX 4090 Founders Edition | |
| NVIDIA GeForce RTX 4080 Founders Edition | |
| Asus TUF Gaming GeForce RTX 4070 Ti | |
| Schenker XMG Neo 16 Raptor Lake | |
| Átlagos NVIDIA GeForce RTX 3090 (75.7 - 110, n=3) | |
| MSI Titan GT77 HX 13VI | |
| Razer Blade 16 Early 2023 | |
| Átlagos NVIDIA GeForce RTX 3080 Ti Laptop GPU (50 - 70, n=3) | |
| Átlagos NVIDIA GeForce RTX 3080 Laptop GPU (41 - 61, n=6) | |
| Átlagos NVIDIA GeForce RTX 3070 Ti Laptop GPU (36 - 41.2, n=2) | |
| Átlagos AMD Radeon RX 6800M (n=1) | |
| Átlagos NVIDIA GeForce RTX 3060 Laptop GPU (15.4 - 27, n=2) | |
| Átlagos AMD Radeon RX 6700M (n=1) | |
| Átlagos AMD Radeon RX 6600M (n=1) | |
| Far Cry 6 - 1920x1080 Ultra Graphics Quality + HD Textures + DXR AA:T | |
| NVIDIA GeForce RTX 4080 Founders Edition | |
| AMD Radeon RX 7900 XTX | |
| NVIDIA GeForce RTX 4090 Founders Edition | |
| Asus TUF Gaming GeForce RTX 4070 Ti | |
| AMD Radeon RX 7900 XT | |
| Razer Blade 16 Early 2023 | |
| MSI Titan GT77 HX 13VI | |
| Átlagos NVIDIA GeForce RTX 3090 (76 - 138.2, n=8) | |
| Schenker XMG Neo 16 Raptor Lake | |
| Átlagos NVIDIA GeForce RTX 3080 Ti Laptop GPU (91 - 92, n=3) | |
| Átlagos NVIDIA GeForce RTX 3080 Laptop GPU (59 - 84.7, n=4) | |
| Átlagos NVIDIA GeForce RTX 3070 Ti Laptop GPU (59 - 77.7, n=2) | |
| Átlagos AMD Radeon RX 6700M (n=1) | |
| Átlagos AMD Radeon RX 6600M (45.6 - 66.8, n=4) | |
| Átlagos NVIDIA GeForce RTX 3060 Laptop GPU (34 - 66, n=2) | |
| Dying Light 2 - 1920x1080 High Quality Raytracing | |
| NVIDIA GeForce RTX 4090 Founders Edition | |
| NVIDIA GeForce RTX 4080 Founders Edition | |
| Átlagos NVIDIA GeForce RTX 3090 (67.9 - 109.9, n=3) | |
| Razer Blade 16 Early 2023 | |
| Asus TUF Gaming GeForce RTX 4070 Ti | |
| Schenker XMG Neo 16 Raptor Lake | |
| MSI Titan GT77 HX 13VI | |
| Átlagos NVIDIA GeForce RTX 3080 Ti Laptop GPU (33.4 - 42.3, n=5) | |
| Átlagos NVIDIA GeForce RTX 3070 Ti Laptop GPU (28.7 - 54.9, n=6) | |
| Átlagos NVIDIA GeForce RTX 3080 Laptop GPU (n=1) | |
| Átlagos NVIDIA GeForce RTX 3060 Laptop GPU (n=1) | |
| Átlagos AMD Radeon RX 6800M (n=1) | |
| Ghostwire Tokyo - 1920x1080 Highest Settings + Maximum Ray Tracing | |
| NVIDIA GeForce RTX 4090 Founders Edition | |
| NVIDIA GeForce RTX 4080 Founders Edition | |
| Asus TUF Gaming GeForce RTX 4070 Ti | |
| AMD Radeon RX 7900 XTX | |
| MSI Titan GT77 HX 13VI | |
| Schenker XMG Neo 16 Raptor Lake | |
| AMD Radeon RX 7900 XT | |
| Átlagos NVIDIA GeForce RTX 3090 (106 - 122, n=4) | |
| Razer Blade 16 Early 2023 | |
| Átlagos NVIDIA GeForce RTX 3080 Ti Laptop GPU (66.1 - 68.3, n=2) | |
| Átlagos NVIDIA GeForce RTX 3080 Laptop GPU (64.7 - 65.9, n=3) | |
| Átlagos NVIDIA GeForce RTX 3070 Ti Laptop GPU (48.9 - 59.9, n=3) | |
| Átlagos NVIDIA GeForce RTX 3060 Laptop GPU (n=1) | |
| Átlagos AMD Radeon RX 6800M (n=1) | |
MSI Titan GT77 HX 13VI
| alacsony | közepes | magas | ultra | QHD | 4K DLSS | 4K | |
|---|---|---|---|---|---|---|---|
| GTA V (2015) | 184.1 | 182.6 | 140.9 | 138.5 | 175.7 | ||
| The Witcher 3 (2015) | 619 | 546 | 422 | 198.9 | 160 | ||
| Dota 2 Reborn (2015) | 225 | 206 | 194.1 | 185.9 | 178.9 | ||
| Final Fantasy XV Benchmark (2018) | 230 | 221 | 187.4 | 162.9 | 94.7 | ||
| X-Plane 11.11 (2018) | 203 | 177.5 | 134.1 | 114.3 | |||
| Far Cry 5 (2018) | 186 | 173 | 160 | 159 | 113 | ||
| Strange Brigade (2018) | 490 | 396 | 391 | 373 | 309 | 159.3 | |
| Shadow of the Tomb Raider (2018) | 245 | 227 | 219 | 214 | 187 | 103 | |
| Metro Exodus (2019) | 204 | 183 | 153 | 132 | 116 | 81 | |
| Control (2019) | 240 | 232 | 187 | 122 | 63 | ||
| Borderlands 3 (2019) | 201 | 176 | 162 | 151 | 130 | 76 | |
| Horizon Zero Dawn (2020) | 209 | 189 | 174 | 163 | 154 | 131 | 95 |
| Mafia Definitive Edition (2020) | 219 | 189 | 179 | 161 | 93 | ||
| Watch Dogs Legion (2020) | 152 | 144 | 131 | 120 | 109 | 69 | |
| F1 2021 (2021) | 501 | 449 | 417 | 209 | 192.4 | 114.4 | |
| Far Cry 6 (2021) | 167 | 147 | 144 | 135 | 89 | ||
| Forza Horizon 5 (2021) | 220 | 181 | 174 | 124 | 113 | 95 | |
| God of War (2022) | 201 | 200 | 180 | 133 | 115 | 80 | |
| Rainbow Six Extraction (2022) | 378 | 347 | 346 | 314 | 219 | 112 | |
| Dying Light 2 (2022) | 240 | 206 | 174 | 121 | 62 | ||
| GRID Legends (2022) | 254 | 230 | 210 | 199 | 190 | 132 | |
| Cyberpunk 2077 1.6 (2022) | 156 | 144 | 138 | 135 | 98 | 56 | |
| Ghostwire Tokyo (2022) | 237 | 236 | 234 | 231 | 206 | 100 | |
| Tiny Tina's Wonderlands (2022) | 339 | 289 | 224 | 182 | 131 | 70 | |
| F1 22 (2022) | 316 | 294 | 283 | 138.2 | 90.1 | 44.9 | |
| Call of Duty Modern Warfare 2 2022 (2022) | 230 | 215 | 183 | 176 | 135 | 126 | 85 |
| Spider-Man Miles Morales (2022) | 134 | 131 | 118 | 116 | 113 | 83 | |
| The Callisto Protocol (2022) | 195 | 181 | 145 | 144 | 114 | 68 | |
| The Witcher 3 v4 (2023) | 240 | 189 | 173 | 150 | 104 | 50 | |
| Dead Space Remake (2023) | 147 | 141 | 130 | 129 | 100 | 53 |
Razer Blade 16 Early 2023
| alacsony | közepes | magas | ultra | QHD DLSS | QHD FSR | QHD | 4K DLSS | 4K FSR | 4K | |
|---|---|---|---|---|---|---|---|---|---|---|
| GTA V (2015) | 186.6 | 185.2 | 183.4 | 140.7 | 125.2 | 143.7 | ||||
| The Witcher 3 (2015) | 609.6 | 462.7 | 353.5 | 176.8 | 120.6 | |||||
| Dota 2 Reborn (2015) | 218 | 204 | 196 | 194.7 | 176.7 | |||||
| Final Fantasy XV Benchmark (2018) | 195.8 | 184.1 | 157.8 | 120.1 | 74.1 | |||||
| X-Plane 11.11 (2018) | 201 | 177.7 | 137 | 117.5 | ||||||
| Strange Brigade (2018) | 438 | 365 | 351 | 323 | 237 | 122.3 | ||||
| Shadow of the Tomb Raider (2018) | 228 | 201 | 196 | 176 | 154 | 84 | ||||
| Metro Exodus (2019) | 197 | 170.4 | 145 | 121.7 | 102 | 67 | ||||
| Control (2019) | 239.1 | 204.7 | 157 | 102 | 50.1 | |||||
| Borderlands 3 (2019) | 207.7 | 176.6 | 158.1 | 133.5 | 108.7 | 59.8 | ||||
| Valorant (2020) | 336 | |||||||||
| Horizon Zero Dawn (2020) | 128 | 112 | ||||||||
| Mafia Definitive Edition (2020) | 280.3 | 184 | 171.3 | 121.6 | 70.4 | |||||
| Watch Dogs Legion (2020) | 140 | 129 | 121 | 110 | 93 | 56 | ||||
| Far Cry 6 (2021) | 181 | 149 | 134 | 125 | 115 | 71 | ||||
| Dying Light 2 (2022) | 184.1 | 160.4 | 140.9 | 97.8 | 48.6 | |||||
| Cyberpunk 2077 1.6 (2022) | 121.1 | 118.1 | 113.8 | 106.2 | 81.2 | 40 | ||||
| Ghostwire Tokyo (2022) | 198.7 | 159.6 | 154 | 145 | 135.9 | 73.1 | ||||
| The Callisto Protocol (2022) | 177.8 | 159.8 | 119.9 | 120.4 | 93.1 | 55.3 | ||||
| Baldur's Gate 3 (2023) | 168.3 | 160 | 121.9 | 120.5 | 66.7 | |||||
| Cyberpunk 2077 (2023) | 110 | 93.6 | 80.6 | 44.4 | 36.2 | 35 | ||||
| Alan Wake 2 (2023) | 66.9 | 37 | ||||||||
| Skull & Bones (2024) | 50 | |||||||||
| Horizon Forbidden West (2024) | 56.1 | 54.8 | 39.5 | |||||||
| F1 24 (2024) | 226 | 236 | 251 | 117.7 | 118.8 | 92.5 | 76.3 | 65 | 38.8 | |
| Black Myth: Wukong (2024) | 110 | 89 | 71 | 42 | 47 | 31 | 33 | 18 | ||
| Star Wars Outlaws (2024) | 84.3 | 81.5 | 74.1 | 64.4 | 59.1 | 47.7 | 35.8 | 20.5 | ||
| Call of Duty Black Ops 6 (2024) | 107 | 100 | 65 | 62 | ||||||
| Stalker 2 (2024) | 63.1 | 50.3 | 30.9 | |||||||
| Marvel Rivals (2024) | 145 | 120 | 88 | 74 | 56 | |||||
| Indiana Jones and the Great Circle (2024) | 96.4 | 80.3 | 51 | |||||||
| Kingdom Come Deliverance 2 (2025) | 92.3 | 92.3 | 71.2 | |||||||
| Monster Hunter Wilds (2025) | 63.3 | 62 | 54.8 | 48 | 34.4 | |||||
| Civilization 7 (2025) | 155.1 | 117.3 | 105.8 | 50.2 | ||||||
| Assassin's Creed Shadows (2025) | 69 | 50 | 52 | 44 | 41 | 32 | ||||
| Doom: The Dark Ages (2025) | 112.5 | 102.8 | 94.6 | 93.8 | 86.6 | 65.4 | 51.9 | 53.1 | 34.7 | |
| F1 25 (2025) | 172.5 | 171.9 | 44.2 | 46.1 | 26.5 | 24.2 | 12.2 | |||
| Borderlands 4 (2025) | 58.5 | 30.5 | 46.1 | 26.2 | ||||||
| Battlefield 6 (2025) | 128.9 | 121.9 | 115.1 | 103.8 | 113.8 | 75.5 | 70.1 | 53.7 | ||
| The Outer Worlds 2 (2025) | 83.7 | 79.7 | 73.6 | 61.1 | 31.1 | 43.4 | ||||
| ARC Raiders (2025) | 88.4 | 89.4 | 68.1 | |||||||
| Anno 117: Pax Romana (2025) | 79.8 | 48.2 | 35.2 | |||||||
| Call of Duty Black Ops 7 (2025) | 58 | 56 | 38 | |||||||
| Resident Evil Requiem (2026) | 66.6 | 46.1 | 21.6 | |||||||
| Death Stranding 2 (2026) | 72.1 | 80 | 60.3 | 37.9 | ||||||
| Crimson Desert (2026) | 104.2 | 88.7 | 76.2 | 69 | 68.1 | 59.3 | 48 | 35.9 | ||
| Pragmata (2026) | 114 | 97.9 | 81 | 64.8 | 44.2 | |||||
| War Thunder (2026) | 304 | 127 | 88.6 | 37.9 | ||||||
| Forza Horizon 6 (2026) | 91 | 78 | 59 | 58 | 44 | 37 | 27 | |||
| 007 First Light (2026) | 78.6 | 69.6 | 55.9 | 51.8 | 28.3 |
Schenker XMG Neo 16
| alacsony | közepes | magas | ultra | QHD | 4K | |
|---|---|---|---|---|---|---|
| GTA V (2015) | 137.5 | 137.7 | 88.9 | |||
| The Witcher 3 (2015) | 216.4 | 137.1 | ||||
| Dota 2 Reborn (2015) | 227 | 202 | 191.2 | 177.3 | 179.4 | |
| Final Fantasy XV Benchmark (2018) | 180.7 | 158 | 91.5 | |||
| X-Plane 11.11 (2018) | 204 | 179.7 | 135.5 | 124.2 | ||
| Strange Brigade (2018) | 482 | 396 | 372 | 350 | 311 | 160.3 |
| Shadow of the Tomb Raider (2018) | 207 | 168 | 103 | |||
| Metro Exodus (2019) | 131.51 | 117.44 | 83.98 | |||
| Control (2019) | 183.7 | 121.9 | 63.5 | |||
| Borderlands 3 (2019) | 176 | 132.34 | 70.5 | |||
| Mafia Definitive Edition (2020) | 187.9 | 168.1 | 91.8 | |||
| Watch Dogs Legion (2020) | 127 | 113 | 71 | |||
| Assassin´s Creed Valhalla (2020) | 161 | 130 | 78 | |||
| Far Cry 6 (2021) | 139 | 134 | 92 | |||
| Dying Light 2 (2022) | 171.8 | 118.4 | 61.7 | |||
| Cyberpunk 2077 1.6 (2022) | 122.8 | 94.26 | 49.15 | |||
| Ghostwire Tokyo (2022) | 230.1 | 196.8 | 97.7 | |||
| Tiny Tina's Wonderlands (2022) | 189.4 | 135.8 | 73.7 | |||
| F1 22 (2022) | 137.4 | 90.5 | 45.3 | |||
| Call of Duty Modern Warfare 2 2022 (2022) | 181 | 137 | 86 | |||
| Spider-Man Miles Morales (2022) | 121.4 | 115.7 | 84.2 | |||
| The Callisto Protocol (2022) | 143.5 | 116.5 | 69.8 | |||
| The Witcher 3 v4 (2023) | 141.8 | 102.9 | 52.8 |
Power consumption: External monitor
| Power Consumption / The Witcher 3 ultra (external Monitor) | |
| NVIDIA GeForce RTX 4090 Founders Edition (133% PT OC, Idle: 81.25 W) | |
| NVIDIA GeForce RTX 4090 Founders Edition (100% PT, Idle: 81.25 W) | |
| AMD Radeon RX 7900 XTX (Idle: 86.5 W) | |
| Átlagos NVIDIA GeForce RTX 3090 (Idle: 464 - 597, n=18 W) | |
| NVIDIA GeForce RTX 4080 Founders Edition (110% PT, Idle: 78.45 W) | |
| NVIDIA GeForce RTX 4080 Founders Edition (100% PT, Idle: 78.45 W) | |
| AMD Radeon RX 7900 XT (Idle: 84.6 W) | |
| Asus TUF Gaming GeForce RTX 4070 Ti (Perf BIOS / 110% PT, Idle: 75.4 W) | |
| Asus TUF Gaming GeForce RTX 4070 Ti (Perf BIOS / 100% PT, Idle: 75.4 W) | |
| Asus TUF Gaming GeForce RTX 4070 Ti (Quiet BIOS / 100% PT, Idle: 75.4 W) | |
| MSI Titan GT77 HX 13VI | |
| MSI Titan GT77 12UHS | |
| Razer Blade 16 Early 2023 | |
| Razer Blade 17 Early 2022 | |
| Átlagos NVIDIA GeForce RTX 3080 Ti Laptop GPU (Idle: 144 - 287, n=27 W) | |
| Átlagos AMD Radeon RX 6800M (Idle: n=1 W) | |
| Átlagos NVIDIA GeForce RTX 3080 Laptop GPU (Idle: 124 - 244, n=26 W) | |
| Átlagos AMD Radeon RX 6700M (Idle: n=1 W) | |
| Átlagos NVIDIA GeForce RTX 3070 Ti Laptop GPU (Idle: 115 - 234, n=25 W) | |
| Átlagos AMD Radeon RX 6600M (Idle: 124 - 191, n=6 W) | |
| Átlagos NVIDIA GeForce RTX 3060 Laptop GPU (Idle: 107.5 - 191, n=38 W) | |
| Power Consumption / FurMark 1.19 GPU Stress Test (external Monitor) | |
| NVIDIA GeForce RTX 4090 Founders Edition (133% PT OC, Idle: 81.25 W) | |
| NVIDIA GeForce RTX 4090 Founders Edition (100% PT, Idle: 81.25 W) | |
| AMD Radeon RX 7900 XTX (Idle: 86.5 W) | |
| AMD Radeon RX 7900 XT (Idle: 84.6 W) | |
| Átlagos NVIDIA GeForce RTX 3090 (Idle: 281 - 551, n=9 W) | |
| NVIDIA GeForce RTX 4080 Founders Edition (110% PT, Idle: 78.45 W) | |
| NVIDIA GeForce RTX 4080 Founders Edition (100% PT, Idle: 78.45 W) | |
| Asus TUF Gaming GeForce RTX 4070 Ti (Perf BIOS / 110% PT, Idle: 75.4 W) | |
| Asus TUF Gaming GeForce RTX 4070 Ti (Quiet BIOS / 100% PT, Idle: 75.4 W) | |
| Asus TUF Gaming GeForce RTX 4070 Ti (Perf BIOS / 100% PT, Idle: 75.4 W) | |
| Razer Blade 16 Early 2023 | |
| MSI Titan GT77 12UHS | |
| Razer Blade 17 Early 2022 | |
| MSI Titan GT77 HX 13VI | |
| Átlagos NVIDIA GeForce RTX 3080 Ti Laptop GPU (Idle: 139.2 - 288, n=28 W) | |
| Átlagos AMD Radeon RX 6800M (Idle: n=1 W) | |
| Átlagos NVIDIA GeForce RTX 3070 Ti Laptop GPU (Idle: 123.6 - 211, n=27 W) | |
| Átlagos NVIDIA GeForce RTX 3080 Laptop GPU (Idle: 122 - 254, n=27 W) | |
| Átlagos AMD Radeon RX 6600M (Idle: 113 - 187, n=6 W) | |
| Átlagos AMD Radeon RX 6700M (Idle: n=1 W) | |
| Átlagos NVIDIA GeForce RTX 3060 Laptop GPU (Idle: 94.1 - 202, n=38 W) | |
| Power Consumption / Witcher 3 ultra Efficiency (external Monitor) | |
| MSI Titan GT77 HX 13VI | |
| Razer Blade 16 Early 2023 | |
| Átlagos NVIDIA GeForce RTX 3080 Laptop GPU (0.4696 - 0.736, n=24) | |
| Átlagos NVIDIA GeForce RTX 3070 Ti Laptop GPU (0.4399 - 0.97, n=24) | |
| AMD Radeon RX 7900 XT | |
| Átlagos NVIDIA GeForce RTX 3080 Ti Laptop GPU (0.4432 - 0.69, n=26) | |
| AMD Radeon RX 7900 XTX | |
| NVIDIA GeForce RTX 4080 Founders Edition | |
| Asus TUF Gaming GeForce RTX 4070 Ti | |
| Razer Blade 17 Early 2022 | |
| NVIDIA GeForce RTX 4090 Founders Edition | |
| Átlagos NVIDIA GeForce RTX 3060 Laptop GPU (0.4181 - 0.651, n=33) | |
| Átlagos AMD Radeon RX 6700M (n=1) | |
| MSI Titan GT77 12UHS | |
| Átlagos AMD Radeon RX 6600M (0.4398 - 0.608, n=6) | |
| Átlagos NVIDIA GeForce RTX 3090 (0.268 - 0.3954, n=15) | |
* ... a kisebb jobb
Összegzés: Asztali RTX 3090-osztályú teljesítmény 175 W mellett
Az Nvidia Ampere generációja a Turing-hoz képest sok mindenre volt képes a teljesítményét tekintve, de a bevezetése egy olyan időszakban történt, amikor a globális rend a feje tetejére állt.
Ennek eredményeképpen nem volt raktáron elég kártya, túlárazottak voltak, és ez mindenféle trükközéshez vezetett. A szeszélyes és röpke kriptovaluta-virágzással párosulva, sok gamer úgy érezte, hogy gazdaságilag ésszerűbb az Amper-rel működő laptopokat választani az asztali kártyák helyett.
Ugorjunk előre 2023-ba, és a legtöbb ilyen gyötrelmes tapasztalat már mögöttünk van. Az Nvidia legújabb Ada GPU-i nagyon magasra tették maguknak a mércét a teljesítmény és az energiahatékonyság tekintetében, úgyhogy valóban generációs ugrásnak tűnnek.
Hatalmas benyomást tett ránk az Ada teljesítménye az asztali gépeken, és örömmel látjuk, hogy ezen előnyök nagy része átkerül a laptopokba is.
Az Nvidia RTX 4080 és RTX 4090 laptop videokártyák kiválóan bemutatják az Ada teljesítményét és hatékonyságát, előbbi nagyjából hasonlóan teljesít, mint egy 350 W-os asztali RTX 3090-es. Ezek az előnyök azonban csak a 175 W-ot igénylő, legmagasabb teljesítményűeknél jelentkeznek.
Az Ada mobile esetében azonban nincs minden a legnagyobb rendben. Az általunk tesztelt készülékek engedték az RTX 4080-at és az RTX 4090-et 150 W-os teljesítményen, további 25 W-os Dynamic Boost mellett teljes erőbedobással működni. A „vadonban” nem minden laptop teszi lehetővé, hogy ezek a GPU-k ilyen TDP-vel működjenek.
És azok sem éppen hordozhatóak, amelyek igen - a Titan GT77 tápegysége önmagában 1,4 kg-ot nyom, és a zajszintje csúcsterhelés alatt olyan benyomást kelthet, mintha egy F16-os pilótafülkéjében ülnénk.
A másik probléma az Nvidia félrevezető márkajelzése. Az átlagos vásárló általában jobban kötődik a numerikus márkajelzéshez, mint a GPU tényleges specifikációjához, így valaki Santa Clara-ban (az Nvidia székhelyén) úgy gondolta, hogy tökéletes marketing értelme van a csúcskategóriás modellt RTX 4090 Laptop GPU-ra keresztelni, csak azért, mert jobban teljesít, mint egy asztali RTX 3090!
De azok, akik az RTX 4090-es laptopokat keresik, nem a tipikus átlagfogyasztók. És akkor még ne is beszéljünk mindenféle teljesítménybeli gubancról, amire a 80 W és 150 W közötti TDP-tartományban számítani lehet.
Az árazás egy másik fontos tényező, amit figyelembe kell venni. Az ebben az összehasonlításban használt laptopok nagy lyukat fúrhatnak a zsebünk. Olyannyira, hogy egy használt autó vásárlása jobb befektetésnek tűnhet. De hát ez a zászlóshajó készülékek természete általában.
Mindent összevetve, az Ada mobile egy üdvözlendő lépés a jó irányba. A csúcskategóriás konfigurációknál látott előnyök minden bizonnyal a középkategóriás és belépőszintű ajánlatokba is átmennek, és az olyan funkciók, mint a DLSS 3, minden bizonnyal segítenek majd felgyorsítani az Ada elfogadását a mobil gamerek körében.
Holisztikusabb képet fogunk kapni az Ada mobile hatékonyságának javulásáról, amint az elkövetkező hónapokban több RTX 40 laptopot tesztelünk különböző TDP értékekkel.
Remélhetőleg előbb-utóbb az AMD RDNA 3 meghajtású készülékek is jelentős számban lesznek elérhetőek, és mindannyiunk érdekében jól versenyeznek majd.
Price comparison

