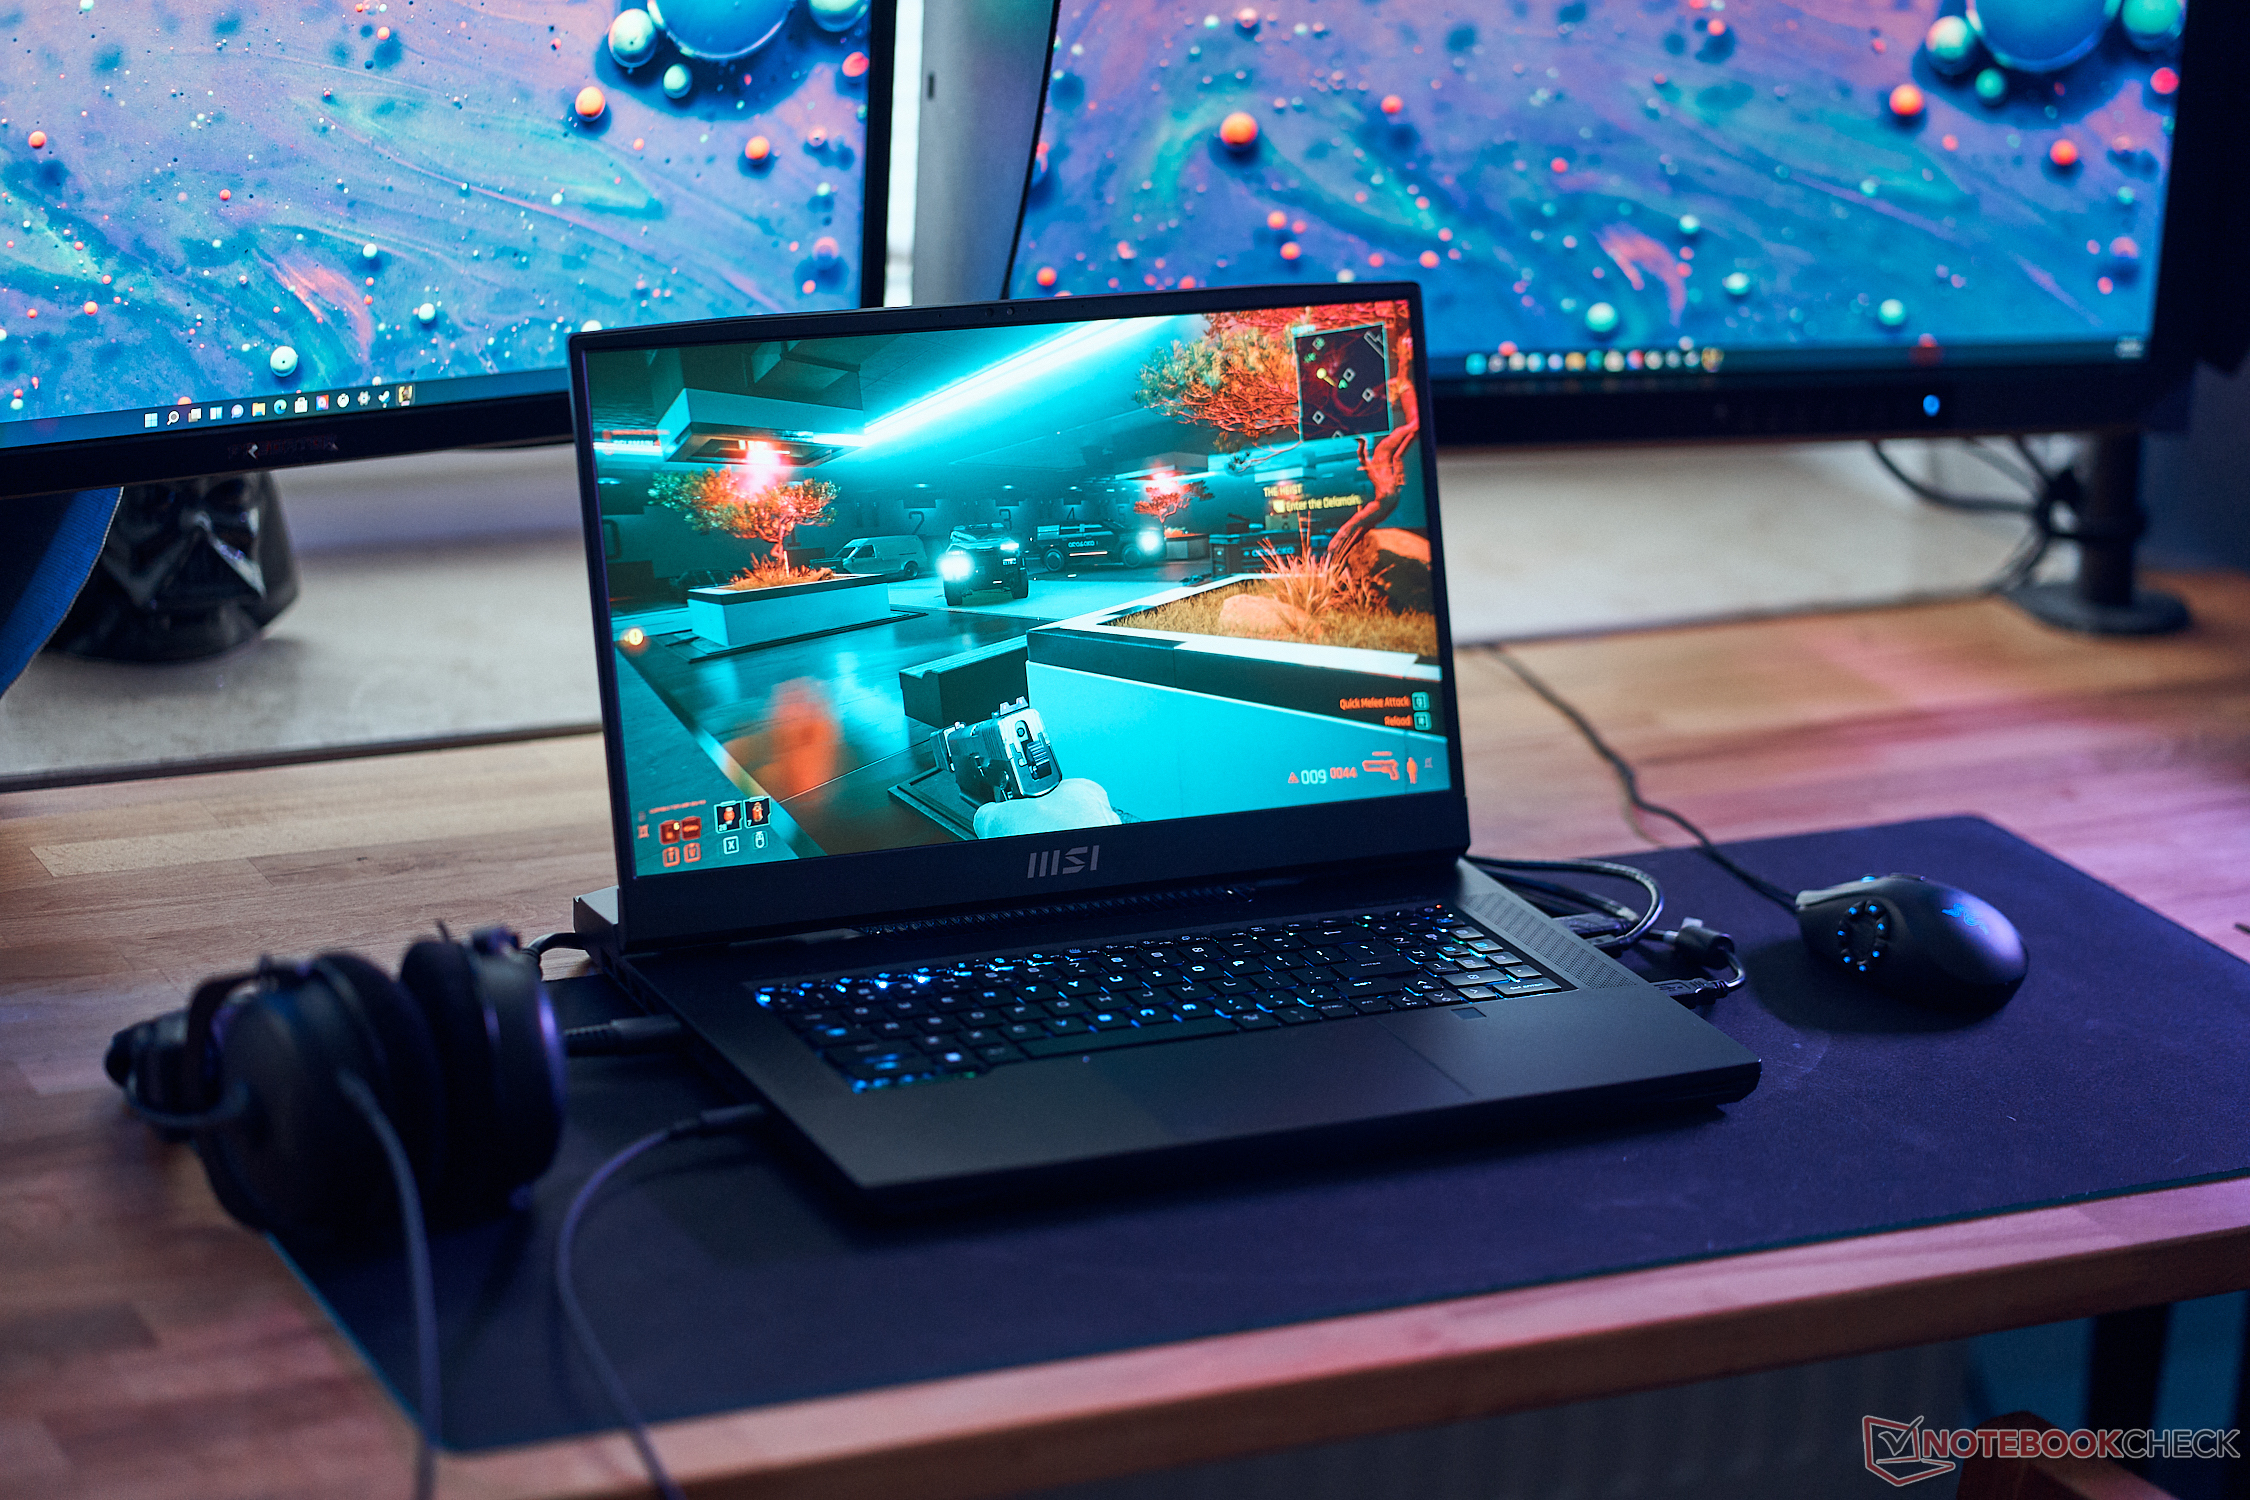
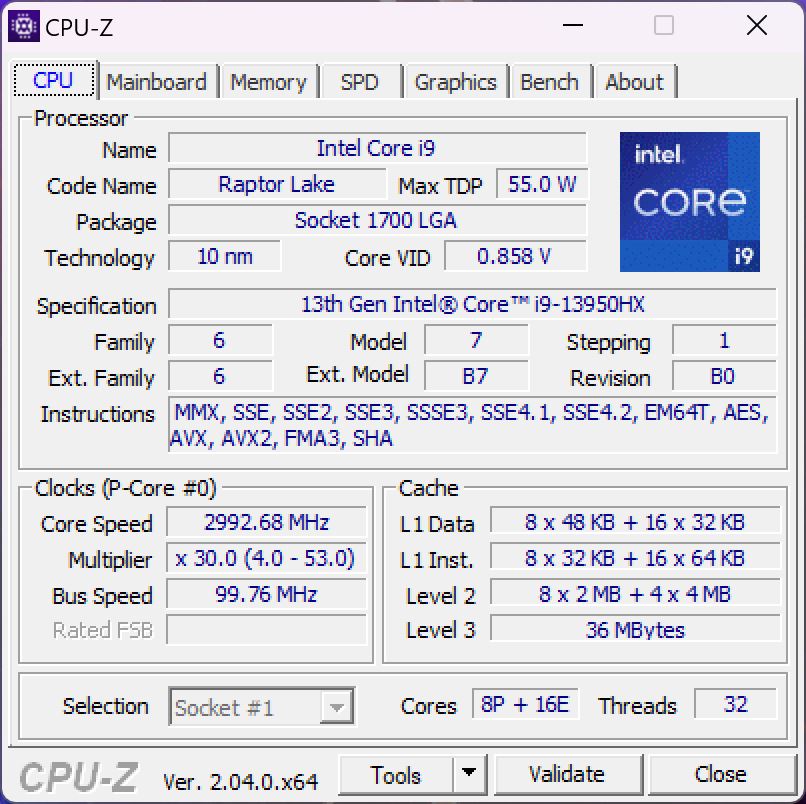
MSI Titan GT77 HX 13V rövid értékelés - Igazi csúcs gamer laptop RTX 4090-nel és Core i9-13950HX-szel
Possible Competitors
Értékelés | Dátum | Modell | Súly | Magasság | Méret | Felbontás | Legjobb ár |
|---|---|---|---|---|---|---|---|
| 89 % v7 (old) | 05/2023 | MSI Titan GT77 HX 13VI i9-13950HX, GeForce RTX 4090 Laptop GPU | 3.5 kg | 23 mm | 17.30" | 3840x2160 | |
| 91.2 % v7 (old) | 05/2023 | Razer Blade 16 Early 2023 i9-13950HX, GeForce RTX 4080 Laptop GPU | 2.4 kg | 21.99 mm | 16.00" | 2560x1600 | |
| 86.9 % v7 (old) | 01/2023 | Asus ROG Strix Scar 17 SE G733CX-LL014W i9-12950HX, GeForce RTX 3080 Ti Laptop GPU | 2.9 kg | 28.3 mm | 17.30" | 2560x1440 | |
| 88.3 % v7 (old) | 09/2022 | MSI Titan GT77 12UHS i9-12900HX, GeForce RTX 3080 Ti Laptop GPU | 3.3 kg | 23 mm | 17.30" | 1920x1080 | |
| 89.2 % v7 (old) | 05/2022 | Alienware x17 R2 P48E i9-12900HK, GeForce RTX 3080 Ti Laptop GPU | 3.1 kg | 20.9 mm | 17.30" | 1920x1080 | |
| 87.6 % v7 (old) | 09/2022 | Schenker XMG Neo 17 M22 R9 6900HX, GeForce RTX 3080 Ti Laptop GPU | 2.8 kg | 27 mm | 17.00" | 2560x1600 |
| SD Card Reader | |
| average JPG Copy Test (av. of 3 runs) | |
| Alienware x17 R2 P48E (AV Pro V60) | |
| Az osztály átlaga Gaming (20.9 - 210, n=54, az elmúlt 2 évben) | |
| Razer Blade 16 Early 2023 (AV PRO microSD 128 GB V60) | |
| MSI Titan GT77 HX 13VI (Angelibird AV Pro V60) | |
| MSI Titan GT77 12UHS (AV PRO microSD 128 GB V60) | |
| Schenker XMG Neo 17 M22 (AV PRO microSD 128 GB V60) | |
| maximum AS SSD Seq Read Test (1GB) | |
| Alienware x17 R2 P48E (AV Pro V60) | |
| Razer Blade 16 Early 2023 (AV PRO microSD 128 GB V60) | |
| Az osztály átlaga Gaming (25.5 - 261, n=51, az elmúlt 2 évben) | |
| MSI Titan GT77 12UHS (AV PRO microSD 128 GB V60) | |
| MSI Titan GT77 HX 13VI (Angelibird AV Pro V60) | |


| |||||||||||||||||||||||||
Fényerő megoszlás: 93 %
Centrumban: 402 cd/m²
Kontraszt: 6060000:1 (Fekete: 0.0001 cd/m²)
ΔE ColorChecker Calman: 4.8 | ∀{0.5-29.43 Ø4.73}
calibrated: 1.8
ΔE Greyscale Calman: 6.5 | ∀{0.09-98 Ø4.97}
92.4% AdobeRGB 1998 (Argyll 3D)
99.9% sRGB (Argyll 3D)
94.9% Display P3 (Argyll 3D)
Gamma: 2.63
CCT: 6596 K
| MSI Titan GT77 HX 13VI B173ZAN06.C, Mini-LED, 3840x2160, 17.3" | Razer Blade 16 Early 2023 CSOT T3 MNG007DA4-1, IPS, 2560x1600, 16" | Asus ROG Strix Scar 17 SE G733CX-LL014W NE173QHM-NZ2, IPS, 2560x1440, 17.3" | MSI Titan GT77 12UHS Sharp SHP1544 LQ173M1JW08, IPS-Level, 1920x1080, 17.3" | Alienware x17 R2 P48E AU Optronics B173HAN, IPS, 1920x1080, 17.3" | Schenker XMG Neo 17 M22 BOE0A99, IPS, 2560x1600, 17" | |
|---|---|---|---|---|---|---|
| Display | 0% | -2% | -16% | -10% | -17% | |
| Display P3 Coverage (%) | 94.9 | 98.5 4% | 97.1 2% | 70.8 -25% | 79.2 -17% | 69 -27% |
| sRGB Coverage (%) | 99.9 | 100 0% | 99.9 0% | 98.9 -1% | 99.8 0% | 99.8 0% |
| AdobeRGB 1998 Coverage (%) | 92.4 | 89.7 -3% | 84.8 -8% | 73 -21% | 79.6 -14% | 69.6 -25% |
| Response Times | 69% | 74% | 86% | 67% | 75% | |
| Response Time Grey 50% / Grey 80% * (ms) | 38.4 ? | 6.6 ? 83% | 5.7 ? 85% | 3.03 ? 92% | 12.4 ? 68% | 10.8 ? 72% |
| Response Time Black / White * (ms) | 26.6 ? | 12 ? 55% | 10.1 ? 62% | 5.28 ? 80% | 9.2 ? 65% | 6.1 ? 77% |
| PWM Frequency (Hz) | 2380 ? | |||||
| Screen | -38877% | -37485% | -44442% | -32218% | -47756% | |
| Brightness middle (cd/m²) | 606 | 456.8 -25% | 320 -47% | 280 -54% | 365.4 -40% | 415 -32% |
| Brightness (cd/m²) | 602 | 437 -27% | 303 -50% | 275 -54% | 344 -43% | 399 -34% |
| Brightness Distribution (%) | 93 | 83 -11% | 87 -6% | 79 -15% | 85 -9% | 90 -3% |
| Black Level * (cd/m²) | 0.0001 | 0.35 -349900% | 0.3 -299900% | 0.4 -399900% | 0.29 -289900% | 0.43 -429900% |
| Contrast (:1) | 6060000 | 1305 -100% | 1067 -100% | 700 -100% | 1260 -100% | 965 -100% |
| Colorchecker dE 2000 * | 4.8 | 3.7 23% | 1.1 77% | 2.1 56% | 3.17 34% | 1.44 70% |
| Colorchecker dE 2000 max. * | 8.2 | 6.42 22% | 2.7 67% | 5.83 29% | 7.69 6% | 2.33 72% |
| Colorchecker dE 2000 calibrated * | 1.8 | 0.66 63% | 1.58 12% | 0.51 72% | 0.89 51% | |
| Greyscale dE 2000 * | 6.5 | 2.6 60% | 1.1 83% | 3.3 49% | 5.3 18% | 1.8 72% |
| Gamma | 2.63 84% | 2.3 96% | 2.13 103% | 2.13 103% | 2.18 101% | 2.132 103% |
| CCT | 6596 99% | 6108 106% | 6599 98% | 7060 92% | 5879 111% | 6327 103% |
| Teljes átlag (program / beállítások) | -12936% /
-24983% | -12471% /
-23057% | -14791% /
-28561% | -10720% /
-20704% | -15899% /
-30693% |
* ... a kisebb jobb
Megjelenítési válaszidők
| ↔ Válaszidő Fekete-fehér | ||
|---|---|---|
| 26.6 ms ... emelkedés és süllyedés ↘ kombinálva | ↗ 9.2 ms emelkedés | 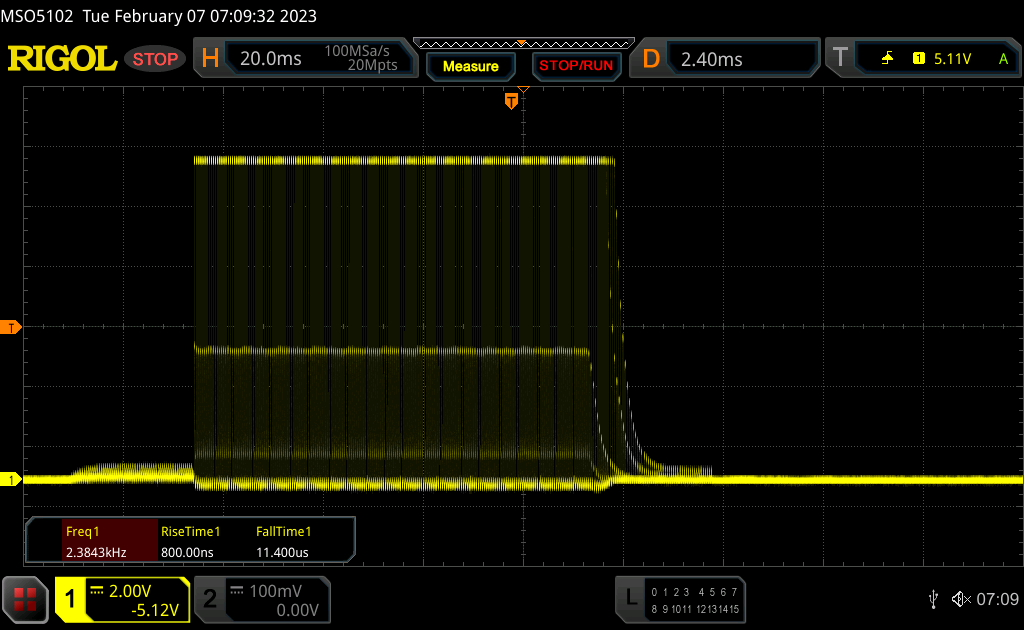 |
| ↘ 17.4 ms ősz | ||
| A képernyő viszonylag lassú reakciósebességet mutat tesztjeinkben, és túl lassú lehet a játékosok számára. Összehasonlításképpen, az összes tesztelt eszköz 0.1 (minimum) és 240 (maximum) ms között mozog. » 66 % of all devices are better. Ez azt jelenti, hogy a mért válaszidő rosszabb, mint az összes vizsgált eszköz átlaga (19.9 ms). | ||
| ↔ Válaszidő 50% szürke és 80% szürke között | ||
| 38.4 ms ... emelkedés és süllyedés ↘ kombinálva | ↗ 13.6 ms emelkedés | 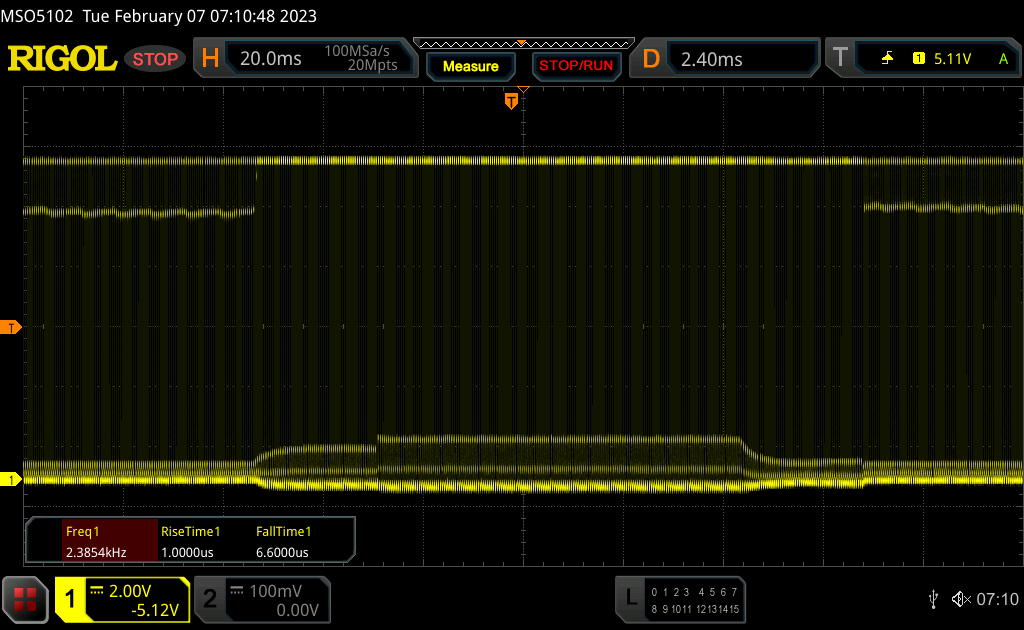 |
| ↘ 24.8 ms ősz | ||
| A képernyő lassú reakciósebességet mutat tesztjeinkben, és nem lesz kielégítő a játékosok számára. Összehasonlításképpen, az összes tesztelt eszköz 0.165 (minimum) és 636 (maximum) ms között mozog. » 57 % of all devices are better. Ez azt jelenti, hogy a mért válaszidő rosszabb, mint az összes vizsgált eszköz átlaga (31.1 ms). | ||
Képernyő villogása / PWM (impulzusszélesség-moduláció)
| Képernyő villogása / PWM észlelve | 2380 Hz | ≤ 100 % fényerő beállítása | 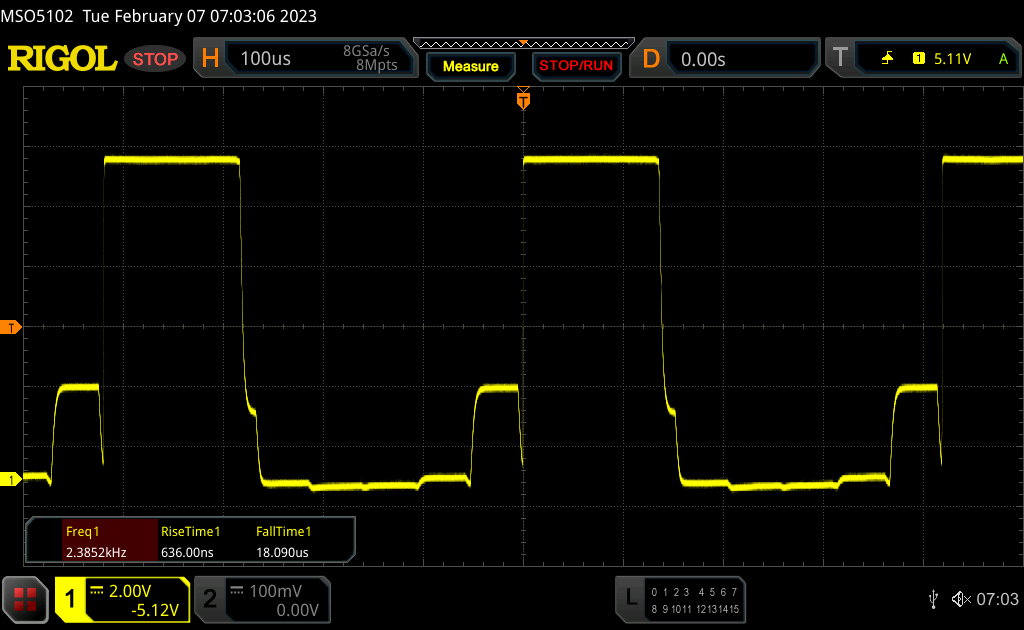 |
A kijelző háttérvilágítása 2380 Hz-en villog (a legrosszabb esetben, pl. PWM használatával) Villódzás észlelve a 100 % vagy annál kisebb fényerő-beállításnál. E fényerő-beállítás felett nem lehet villogás vagy PWM. A 2380 Hz frekvenciája meglehetősen magas, így a legtöbb PWM-re érzékeny felhasználó nem észlel semmilyen villogást. Összehasonlításképpen: az összes tesztelt eszköz 52 %-a nem használja a PWM-et a kijelző elsötétítésére. Ha PWM-et észleltek, akkor átlagosan 7794 (minimum: 5 - maximum: 343500) Hz-t mértek. | |||
Cinebench R15 Multi Dauertest
Cinebench R23: Multi Core | Single Core
Cinebench R20: CPU (Multi Core) | CPU (Single Core)
Cinebench R15: CPU Multi 64Bit | CPU Single 64Bit
Blender: v2.79 BMW27 CPU
7-Zip 18.03: 7z b 4 | 7z b 4 -mmt1
Geekbench 5.5: Multi-Core | Single-Core
HWBOT x265 Benchmark v2.2: 4k Preset
LibreOffice : 20 Documents To PDF
R Benchmark 2.5: Overall mean
| CPU Performance rating | |
| MSI Titan GT77 HX 13VI | |
| MSI Titan GT77 HX 13VI | |
| Schenker XMG Neo 16 Raptor Lake | |
| Átlagos Intel Core i9-13950HX | |
| Razer Blade 16 Early 2023 | |
| Az osztály átlaga Gaming | |
| MSI Titan GT77 12UHS | |
| Asus ROG Strix Scar 17 SE G733CX-LL014W | |
| Alienware x17 R2 P48E | |
| Schenker XMG Neo 17 M22 | |
| Cinebench R23 / Multi Core | |
| MSI Titan GT77 HX 13VI | |
| MSI Titan GT77 HX 13VI | |
| Átlagos Intel Core i9-13950HX (24560 - 33277, n=7) | |
| Schenker XMG Neo 16 Raptor Lake | |
| Schenker XMG Neo 16 Raptor Lake | |
| Schenker XMG Neo 16 Raptor Lake | |
| Razer Blade 16 Early 2023 | |
| Az osztály átlaga Gaming (10488 - 40970, n=112, az elmúlt 2 évben) | |
| MSI Titan GT77 12UHS | |
| Asus ROG Strix Scar 17 SE G733CX-LL014W | |
| Alienware x17 R2 P48E | |
| Schenker XMG Neo 17 M22 | |
| Cinebench R23 / Single Core | |
| MSI Titan GT77 HX 13VI | |
| MSI Titan GT77 HX 13VI | |
| Átlagos Intel Core i9-13950HX (1952 - 2113, n=7) | |
| Schenker XMG Neo 16 Raptor Lake | |
| Razer Blade 16 Early 2023 | |
| Az osztály átlaga Gaming (1166 - 2356, n=112, az elmúlt 2 évben) | |
| MSI Titan GT77 12UHS | |
| Alienware x17 R2 P48E | |
| Asus ROG Strix Scar 17 SE G733CX-LL014W | |
| Schenker XMG Neo 17 M22 | |
| Cinebench R20 / CPU (Multi Core) | |
| MSI Titan GT77 HX 13VI | |
| MSI Titan GT77 HX 13VI | |
| Schenker XMG Neo 16 Raptor Lake | |
| Átlagos Intel Core i9-13950HX (8697 - 12648, n=7) | |
| Az osztály átlaga Gaming (4029 - 16108, n=111, az elmúlt 2 évben) | |
| Razer Blade 16 Early 2023 | |
| MSI Titan GT77 12UHS | |
| Asus ROG Strix Scar 17 SE G733CX-LL014W | |
| Alienware x17 R2 P48E | |
| Schenker XMG Neo 17 M22 | |
| Cinebench R20 / CPU (Single Core) | |
| MSI Titan GT77 HX 13VI | |
| MSI Titan GT77 HX 13VI | |
| Átlagos Intel Core i9-13950HX (742 - 816, n=7) | |
| Az osztály átlaga Gaming (442 - 895, n=111, az elmúlt 2 évben) | |
| Schenker XMG Neo 16 Raptor Lake | |
| Razer Blade 16 Early 2023 | |
| Asus ROG Strix Scar 17 SE G733CX-LL014W | |
| MSI Titan GT77 12UHS | |
| Alienware x17 R2 P48E | |
| Schenker XMG Neo 17 M22 | |
| Cinebench R15 / CPU Multi 64Bit | |
| MSI Titan GT77 HX 13VI | |
| MSI Titan GT77 HX 13VI | |
| Schenker XMG Neo 16 Raptor Lake | |
| Schenker XMG Neo 16 Raptor Lake | |
| Átlagos Intel Core i9-13950HX (3625 - 5227, n=7) | |
| Razer Blade 16 Early 2023 | |
| Az osztály átlaga Gaming (1578 - 6271, n=111, az elmúlt 2 évben) | |
| MSI Titan GT77 12UHS | |
| Asus ROG Strix Scar 17 SE G733CX-LL014W | |
| Alienware x17 R2 P48E | |
| Schenker XMG Neo 17 M22 | |
| Cinebench R15 / CPU Single 64Bit | |
| MSI Titan GT77 HX 13VI | |
| MSI Titan GT77 HX 13VI | |
| Schenker XMG Neo 16 Raptor Lake | |
| Schenker XMG Neo 16 Raptor Lake | |
| Az osztály átlaga Gaming (188.8 - 343, n=111, az elmúlt 2 évben) | |
| Átlagos Intel Core i9-13950HX (274 - 303, n=7) | |
| MSI Titan GT77 12UHS | |
| Asus ROG Strix Scar 17 SE G733CX-LL014W | |
| Razer Blade 16 Early 2023 | |
| Alienware x17 R2 P48E | |
| Schenker XMG Neo 17 M22 | |
| Blender / v2.79 BMW27 CPU | |
| Schenker XMG Neo 17 M22 | |
| Asus ROG Strix Scar 17 SE G733CX-LL014W | |
| Alienware x17 R2 P48E | |
| Az osztály átlaga Gaming (80 - 330, n=109, az elmúlt 2 évben) | |
| MSI Titan GT77 12UHS | |
| Razer Blade 16 Early 2023 | |
| Átlagos Intel Core i9-13950HX (100 - 137, n=7) | |
| Schenker XMG Neo 16 Raptor Lake | |
| MSI Titan GT77 HX 13VI | |
| MSI Titan GT77 HX 13VI | |
| 7-Zip 18.03 / 7z b 4 | |
| MSI Titan GT77 HX 13VI | |
| MSI Titan GT77 HX 13VI | |
| Schenker XMG Neo 16 Raptor Lake | |
| Átlagos Intel Core i9-13950HX (99351 - 127295, n=7) | |
| Razer Blade 16 Early 2023 | |
| Az osztály átlaga Gaming (33491 - 148086, n=110, az elmúlt 2 évben) | |
| MSI Titan GT77 12UHS | |
| Asus ROG Strix Scar 17 SE G733CX-LL014W | |
| Alienware x17 R2 P48E | |
| Schenker XMG Neo 17 M22 | |
| 7-Zip 18.03 / 7z b 4 -mmt1 | |
| MSI Titan GT77 HX 13VI | |
| MSI Titan GT77 HX 13VI | |
| Schenker XMG Neo 16 Raptor Lake | |
| Átlagos Intel Core i9-13950HX (6445 - 7064, n=7) | |
| Razer Blade 16 Early 2023 | |
| Az osztály átlaga Gaming (4199 - 7436, n=110, az elmúlt 2 évben) | |
| MSI Titan GT77 12UHS | |
| Asus ROG Strix Scar 17 SE G733CX-LL014W | |
| Schenker XMG Neo 17 M22 | |
| Alienware x17 R2 P48E | |
| Geekbench 5.5 / Multi-Core | |
| Schenker XMG Neo 16 Raptor Lake | |
| MSI Titan GT77 HX 13VI | |
| MSI Titan GT77 HX 13VI | |
| Átlagos Intel Core i9-13950HX (16776 - 21853, n=7) | |
| Razer Blade 16 Early 2023 | |
| Az osztály átlaga Gaming (6460 - 27010, n=110, az elmúlt 2 évben) | |
| MSI Titan GT77 12UHS | |
| Asus ROG Strix Scar 17 SE G733CX-LL014W | |
| Alienware x17 R2 P48E | |
| Schenker XMG Neo 17 M22 | |
| Geekbench 5.5 / Single-Core | |
| MSI Titan GT77 HX 13VI | |
| Az osztály átlaga Gaming (986 - 2474, n=110, az elmúlt 2 évben) | |
| MSI Titan GT77 HX 13VI | |
| Schenker XMG Neo 16 Raptor Lake | |
| Átlagos Intel Core i9-13950HX (1805 - 2097, n=7) | |
| MSI Titan GT77 12UHS | |
| Alienware x17 R2 P48E | |
| Asus ROG Strix Scar 17 SE G733CX-LL014W | |
| Razer Blade 16 Early 2023 | |
| Schenker XMG Neo 17 M22 | |
| HWBOT x265 Benchmark v2.2 / 4k Preset | |
| MSI Titan GT77 HX 13VI | |
| MSI Titan GT77 HX 13VI | |
| Schenker XMG Neo 16 Raptor Lake | |
| Átlagos Intel Core i9-13950HX (26 - 34.5, n=7) | |
| Razer Blade 16 Early 2023 | |
| Az osztály átlaga Gaming (11.5 - 44.3, n=110, az elmúlt 2 évben) | |
| MSI Titan GT77 12UHS | |
| Asus ROG Strix Scar 17 SE G733CX-LL014W | |
| Alienware x17 R2 P48E | |
| Schenker XMG Neo 17 M22 | |
| LibreOffice / 20 Documents To PDF | |
| Schenker XMG Neo 17 M22 | |
| Az osztály átlaga Gaming (19 - 88.8, n=110, az elmúlt 2 évben) | |
| Razer Blade 16 Early 2023 | |
| MSI Titan GT77 HX 13VI | |
| Schenker XMG Neo 16 Raptor Lake | |
| Átlagos Intel Core i9-13950HX (32.8 - 52.1, n=7) | |
| Alienware x17 R2 P48E | |
| MSI Titan GT77 12UHS | |
| MSI Titan GT77 HX 13VI | |
| Asus ROG Strix Scar 17 SE G733CX-LL014W | |
| R Benchmark 2.5 / Overall mean | |
| Schenker XMG Neo 17 M22 | |
| Alienware x17 R2 P48E | |
| Az osztály átlaga Gaming (0.3439 - 0.759, n=111, az elmúlt 2 évben) | |
| Asus ROG Strix Scar 17 SE G733CX-LL014W | |
| MSI Titan GT77 12UHS | |
| Razer Blade 16 Early 2023 | |
| MSI Titan GT77 HX 13VI | |
| MSI Titan GT77 HX 13VI | |
| Átlagos Intel Core i9-13950HX (0.3823 - 0.4121, n=7) | |
| Schenker XMG Neo 16 Raptor Lake | |
* ... a kisebb jobb
AIDA64: FP32 Ray-Trace | FPU Julia | CPU SHA3 | CPU Queen | FPU SinJulia | FPU Mandel | CPU AES | CPU ZLib | FP64 Ray-Trace | CPU PhotoWorxx
| Performance rating | |
| MSI Titan GT77 HX 13VI | |
| Schenker XMG Neo 16 Raptor Lake | |
| Az osztály átlaga Gaming | |
| Átlagos Intel Core i9-13950HX | |
| Razer Blade 16 Early 2023 | |
| MSI Titan GT77 12UHS | |
| Asus ROG Strix Scar 17 SE G733CX-LL014W | |
| Schenker XMG Neo 17 M22 | |
| Alienware x17 R2 P48E | |
| AIDA64 / FP32 Ray-Trace | |
| Az osztály átlaga Gaming (10227 - 85542, n=109, az elmúlt 2 évben) | |
| MSI Titan GT77 HX 13VI | |
| Schenker XMG Neo 16 Raptor Lake | |
| Razer Blade 16 Early 2023 | |
| Razer Blade 16 Early 2023 | |
| Razer Blade 16 Early 2023 | |
| Átlagos Intel Core i9-13950HX (17993 - 28957, n=9) | |
| MSI Titan GT77 12UHS | |
| Asus ROG Strix Scar 17 SE G733CX-LL014W | |
| Schenker XMG Neo 17 M22 | |
| Alienware x17 R2 P48E | |
| AIDA64 / FPU Julia | |
| MSI Titan GT77 HX 13VI | |
| Az osztály átlaga Gaming (51376 - 238426, n=109, az elmúlt 2 évben) | |
| Schenker XMG Neo 16 Raptor Lake | |
| Razer Blade 16 Early 2023 | |
| Razer Blade 16 Early 2023 | |
| Razer Blade 16 Early 2023 | |
| Átlagos Intel Core i9-13950HX (89362 - 144303, n=9) | |
| MSI Titan GT77 12UHS | |
| Schenker XMG Neo 17 M22 | |
| Asus ROG Strix Scar 17 SE G733CX-LL014W | |
| Alienware x17 R2 P48E | |
| AIDA64 / CPU SHA3 | |
| MSI Titan GT77 HX 13VI | |
| Schenker XMG Neo 16 Raptor Lake | |
| Razer Blade 16 Early 2023 | |
| Razer Blade 16 Early 2023 | |
| Razer Blade 16 Early 2023 | |
| Az osztály átlaga Gaming (2180 - 9817, n=109, az elmúlt 2 évben) | |
| Átlagos Intel Core i9-13950HX (4518 - 7093, n=9) | |
| MSI Titan GT77 12UHS | |
| Asus ROG Strix Scar 17 SE G733CX-LL014W | |
| Alienware x17 R2 P48E | |
| Schenker XMG Neo 17 M22 | |
| AIDA64 / CPU Queen | |
| MSI Titan GT77 HX 13VI | |
| Schenker XMG Neo 16 Raptor Lake | |
| Átlagos Intel Core i9-13950HX (131931 - 140103, n=8) | |
| Razer Blade 16 Early 2023 | |
| Razer Blade 16 Early 2023 | |
| Az osztály átlaga Gaming (49785 - 173351, n=100, az elmúlt 2 évben) | |
| Alienware x17 R2 P48E | |
| Asus ROG Strix Scar 17 SE G733CX-LL014W | |
| MSI Titan GT77 12UHS | |
| Schenker XMG Neo 17 M22 | |
| AIDA64 / FPU SinJulia | |
| MSI Titan GT77 HX 13VI | |
| Schenker XMG Neo 16 Raptor Lake | |
| Razer Blade 16 Early 2023 | |
| Razer Blade 16 Early 2023 | |
| Razer Blade 16 Early 2023 | |
| Átlagos Intel Core i9-13950HX (12318 - 17057, n=9) | |
| Az osztály átlaga Gaming (4424 - 33636, n=109, az elmúlt 2 évben) | |
| MSI Titan GT77 12UHS | |
| Schenker XMG Neo 17 M22 | |
| Asus ROG Strix Scar 17 SE G733CX-LL014W | |
| Alienware x17 R2 P48E | |
| AIDA64 / FPU Mandel | |
| MSI Titan GT77 HX 13VI | |
| Az osztály átlaga Gaming (25115 - 128721, n=109, az elmúlt 2 évben) | |
| Schenker XMG Neo 16 Raptor Lake | |
| Razer Blade 16 Early 2023 | |
| Razer Blade 16 Early 2023 | |
| Razer Blade 16 Early 2023 | |
| Átlagos Intel Core i9-13950HX (44372 - 71038, n=9) | |
| Schenker XMG Neo 17 M22 | |
| MSI Titan GT77 12UHS | |
| Asus ROG Strix Scar 17 SE G733CX-LL014W | |
| Alienware x17 R2 P48E | |
| AIDA64 / CPU AES | |
| MSI Titan GT77 12UHS | |
| Asus ROG Strix Scar 17 SE G733CX-LL014W | |
| Razer Blade 16 Early 2023 | |
| Razer Blade 16 Early 2023 | |
| Razer Blade 16 Early 2023 | |
| Átlagos Intel Core i9-13950HX (99981 - 204491, n=9) | |
| MSI Titan GT77 HX 13VI | |
| Schenker XMG Neo 17 M22 | |
| Schenker XMG Neo 16 Raptor Lake | |
| Alienware x17 R2 P48E | |
| Az osztály átlaga Gaming (39258 - 247074, n=109, az elmúlt 2 évben) | |
| AIDA64 / CPU ZLib | |
| MSI Titan GT77 HX 13VI | |
| Schenker XMG Neo 16 Raptor Lake | |
| Razer Blade 16 Early 2023 | |
| Razer Blade 16 Early 2023 | |
| Razer Blade 16 Early 2023 | |
| Átlagos Intel Core i9-13950HX (1263 - 2069, n=9) | |
| Az osztály átlaga Gaming (574 - 2531, n=109, az elmúlt 2 évben) | |
| MSI Titan GT77 12UHS | |
| Asus ROG Strix Scar 17 SE G733CX-LL014W | |
| Alienware x17 R2 P48E | |
| Schenker XMG Neo 17 M22 | |
| AIDA64 / FP64 Ray-Trace | |
| Az osztály átlaga Gaming (5509 - 45446, n=109, az elmúlt 2 évben) | |
| MSI Titan GT77 HX 13VI | |
| Schenker XMG Neo 16 Raptor Lake | |
| Razer Blade 16 Early 2023 | |
| Razer Blade 16 Early 2023 | |
| Razer Blade 16 Early 2023 | |
| Átlagos Intel Core i9-13950HX (9649 - 15573, n=9) | |
| MSI Titan GT77 12UHS | |
| Asus ROG Strix Scar 17 SE G733CX-LL014W | |
| Schenker XMG Neo 17 M22 | |
| Alienware x17 R2 P48E | |
| AIDA64 / CPU PhotoWorxx | |
| Razer Blade 16 Early 2023 | |
| Razer Blade 16 Early 2023 | |
| Razer Blade 16 Early 2023 | |
| Átlagos Intel Core i9-13950HX (40233 - 50864, n=9) | |
| Schenker XMG Neo 16 Raptor Lake | |
| Az osztály átlaga Gaming (12271 - 89891, n=109, az elmúlt 2 évben) | |
| Asus ROG Strix Scar 17 SE G733CX-LL014W | |
| MSI Titan GT77 12UHS | |
| MSI Titan GT77 HX 13VI | |
| Alienware x17 R2 P48E | |
| Schenker XMG Neo 17 M22 | |
CrossMark: Overall | Productivity | Creativity | Responsiveness
| PCMark 10 / Score | |
| MSI Titan GT77 HX 13VI | |
| Az osztály átlaga Gaming (5828 - 11574, n=95, az elmúlt 2 évben) | |
| Átlagos Intel Core i9-13950HX, NVIDIA GeForce RTX 4090 Laptop GPU (7597 - 8884, n=2) | |
| MSI Titan GT77 12UHS | |
| Alienware x17 R2 P48E | |
| Razer Blade 16 Early 2023 | |
| Asus ROG Strix Scar 17 SE G733CX-LL014W | |
| Schenker XMG Neo 17 M22 | |
| PCMark 10 / Essentials | |
| MSI Titan GT77 HX 13VI | |
| Átlagos Intel Core i9-13950HX, NVIDIA GeForce RTX 4090 Laptop GPU (10903 - 11761, n=2) | |
| Alienware x17 R2 P48E | |
| MSI Titan GT77 12UHS | |
| Razer Blade 16 Early 2023 | |
| Az osztály átlaga Gaming (8810 - 12600, n=99, az elmúlt 2 évben) | |
| Asus ROG Strix Scar 17 SE G733CX-LL014W | |
| Schenker XMG Neo 17 M22 | |
| PCMark 10 / Productivity | |
| Az osztály átlaga Gaming (6845 - 18766, n=97, az elmúlt 2 évben) | |
| MSI Titan GT77 12UHS | |
| Alienware x17 R2 P48E | |
| Asus ROG Strix Scar 17 SE G733CX-LL014W | |
| MSI Titan GT77 HX 13VI | |
| Schenker XMG Neo 17 M22 | |
| Átlagos Intel Core i9-13950HX, NVIDIA GeForce RTX 4090 Laptop GPU (8330 - 9851, n=2) | |
| Razer Blade 16 Early 2023 | |
| PCMark 10 / Digital Content Creation | |
| MSI Titan GT77 HX 13VI | |
| Átlagos Intel Core i9-13950HX, NVIDIA GeForce RTX 4090 Laptop GPU (13099 - 16424, n=2) | |
| Razer Blade 16 Early 2023 | |
| Az osztály átlaga Gaming (7602 - 19657, n=97, az elmúlt 2 évben) | |
| MSI Titan GT77 12UHS | |
| Alienware x17 R2 P48E | |
| Asus ROG Strix Scar 17 SE G733CX-LL014W | |
| Schenker XMG Neo 17 M22 | |
| CrossMark / Overall | |
| MSI Titan GT77 HX 13VI | |
| Asus ROG Strix Scar 17 SE G733CX-LL014W | |
| MSI Titan GT77 12UHS | |
| Átlagos Intel Core i9-13950HX, NVIDIA GeForce RTX 4090 Laptop GPU (2019 - 2139, n=2) | |
| Schenker XMG Neo 16 Raptor Lake | |
| Az osztály átlaga Gaming (1366 - 2409, n=97, az elmúlt 2 évben) | |
| Alienware x17 R2 P48E | |
| Schenker XMG Neo 17 M22 | |
| Razer Blade 16 Early 2023 | |
| CrossMark / Productivity | |
| MSI Titan GT77 12UHS | |
| MSI Titan GT77 HX 13VI | |
| Asus ROG Strix Scar 17 SE G733CX-LL014W | |
| Átlagos Intel Core i9-13950HX, NVIDIA GeForce RTX 4090 Laptop GPU (1909 - 1977, n=2) | |
| Az osztály átlaga Gaming (1386 - 2254, n=97, az elmúlt 2 évben) | |
| Schenker XMG Neo 16 Raptor Lake | |
| Alienware x17 R2 P48E | |
| Schenker XMG Neo 17 M22 | |
| Razer Blade 16 Early 2023 | |
| CrossMark / Creativity | |
| MSI Titan GT77 HX 13VI | |
| Schenker XMG Neo 16 Raptor Lake | |
| Asus ROG Strix Scar 17 SE G733CX-LL014W | |
| Átlagos Intel Core i9-13950HX, NVIDIA GeForce RTX 4090 Laptop GPU (2222 - 2423, n=2) | |
| MSI Titan GT77 12UHS | |
| Az osztály átlaga Gaming (1343 - 2729, n=97, az elmúlt 2 évben) | |
| Alienware x17 R2 P48E | |
| Schenker XMG Neo 17 M22 | |
| Razer Blade 16 Early 2023 | |
| CrossMark / Responsiveness | |
| MSI Titan GT77 12UHS | |
| Asus ROG Strix Scar 17 SE G733CX-LL014W | |
| MSI Titan GT77 HX 13VI | |
| Átlagos Intel Core i9-13950HX, NVIDIA GeForce RTX 4090 Laptop GPU (1792 - 1861, n=2) | |
| Az osztály átlaga Gaming (1226 - 2334, n=97, az elmúlt 2 évben) | |
| Alienware x17 R2 P48E | |
| Schenker XMG Neo 16 Raptor Lake | |
| Schenker XMG Neo 17 M22 | |
| Razer Blade 16 Early 2023 | |
| PCMark 10 Score | 8884 pontok | |
Segítség | ||
| AIDA64 / Memory Copy | |
| Razer Blade 16 Early 2023 | |
| Razer Blade 16 Early 2023 | |
| Razer Blade 16 Early 2023 | |
| Átlagos Intel Core i9-13950HX (61938 - 78813, n=9) | |
| Az osztály átlaga Gaming (21750 - 129946, n=109, az elmúlt 2 évben) | |
| Schenker XMG Neo 16 Raptor Lake | |
| MSI Titan GT77 12UHS | |
| MSI Titan GT77 HX 13VI | |
| Asus ROG Strix Scar 17 SE G733CX-LL014W | |
| Alienware x17 R2 P48E | |
| Schenker XMG Neo 17 M22 | |
| AIDA64 / Memory Read | |
| Razer Blade 16 Early 2023 | |
| Razer Blade 16 Early 2023 | |
| Razer Blade 16 Early 2023 | |
| Átlagos Intel Core i9-13950HX (62368 - 86831, n=9) | |
| Schenker XMG Neo 16 Raptor Lake | |
| Az osztály átlaga Gaming (22956 - 118858, n=109, az elmúlt 2 évben) | |
| Asus ROG Strix Scar 17 SE G733CX-LL014W | |
| MSI Titan GT77 HX 13VI | |
| MSI Titan GT77 12UHS | |
| Alienware x17 R2 P48E | |
| Schenker XMG Neo 17 M22 | |
| AIDA64 / Memory Write | |
| Razer Blade 16 Early 2023 | |
| Razer Blade 16 Early 2023 | |
| Razer Blade 16 Early 2023 | |
| Az osztály átlaga Gaming (22297 - 135096, n=109, az elmúlt 2 évben) | |
| Átlagos Intel Core i9-13950HX (59501 - 80441, n=9) | |
| Schenker XMG Neo 16 Raptor Lake | |
| Asus ROG Strix Scar 17 SE G733CX-LL014W | |
| MSI Titan GT77 HX 13VI | |
| MSI Titan GT77 12UHS | |
| Schenker XMG Neo 17 M22 | |
| Alienware x17 R2 P48E | |
| AIDA64 / Memory Latency | |
| Az osztály átlaga Gaming (75.3 - 259, n=109, az elmúlt 2 évben) | |
| Razer Blade 16 Early 2023 | |
| Razer Blade 16 Early 2023 | |
| Razer Blade 16 Early 2023 | |
| Alienware x17 R2 P48E | |
| MSI Titan GT77 HX 13VI | |
| Schenker XMG Neo 17 M22 | |
| Schenker XMG Neo 16 Raptor Lake | |
| Átlagos Intel Core i9-13950HX (84.4 - 99.5, n=9) | |
| MSI Titan GT77 12UHS | |
| Asus ROG Strix Scar 17 SE G733CX-LL014W | |
* ... a kisebb jobb
| DPC Latencies / LatencyMon - interrupt to process latency (max), Web, Youtube, Prime95 | |
| MSI Titan GT77 HX 13VI | |
| Schenker XMG Neo 17 M22 | |
| Asus ROG Strix Scar 17 SE G733CX-LL014W | |
| Razer Blade 16 Early 2023 | |
| MSI Titan GT77 12UHS | |
| MSI Titan GT77 12UHS | |
| Alienware x17 R2 P48E | |
* ... a kisebb jobb

* ... a kisebb jobb
Disk Throttling: DiskSpd Read Loop, Queue Depth 8
Geekbench 5.5: OpenCL Score
GFXBench: 3840x2160 4K Aztec Ruins High Tier Offscreen | 2560x1440 Aztec Ruins High Tier Offscreen
| 3DMark / Fire Strike Graphics | |
| NVIDIA GeForce RTX 4080 | |
| NVIDIA GeForce RTX 4070 Ti | |
| NVIDIA GeForce RTX 3090 Ti | |
| NVIDIA GeForce RTX 4090 Laptop GPU | |
| NVIDIA GeForce RTX 3080 Ti | |
| NVIDIA GeForce RTX 3090 | |
| Átlagos NVIDIA GeForce RTX 4090 Laptop GPU (40259 - 53059, n=41) | |
| NVIDIA GeForce RTX 4090 Laptop GPU | |
| NVIDIA GeForce RTX 4080 Laptop GPU | |
| Az osztály átlaga Gaming (12242 - 62849, n=120, az elmúlt 2 évben) | |
| NVIDIA GeForce RTX 3080 Ti Laptop GPU | |
| NVIDIA GeForce RTX 3080 Ti Laptop GPU | |
| NVIDIA GeForce RTX 3080 Ti Laptop GPU | |
| NVIDIA GeForce RTX 3080 Ti Laptop GPU | |
| NVIDIA GeForce RTX 3080 Ti Laptop GPU | |
| 3DMark / Time Spy Graphics | |
| NVIDIA GeForce RTX 4080 | |
| NVIDIA GeForce RTX 4070 Ti | |
| NVIDIA GeForce RTX 4090 Laptop GPU | |
| NVIDIA GeForce RTX 4090 Laptop GPU | |
| NVIDIA GeForce RTX 3090 Ti | |
| Átlagos NVIDIA GeForce RTX 4090 Laptop GPU (16950 - 23292, n=43) | |
| NVIDIA GeForce RTX 3080 Ti | |
| NVIDIA GeForce RTX 3090 | |
| NVIDIA GeForce RTX 4080 Laptop GPU | |
| Az osztály átlaga Gaming (5012 - 26212, n=119, az elmúlt 2 évben) | |
| NVIDIA GeForce RTX 3080 Ti Laptop GPU | |
| NVIDIA GeForce RTX 3080 Ti Laptop GPU | |
| NVIDIA GeForce RTX 3080 Ti Laptop GPU | |
| NVIDIA GeForce RTX 3080 Ti Laptop GPU | |
| NVIDIA GeForce RTX 3080 Ti Laptop GPU | |
| 3DMark / Wild Life Extreme Unlimited | |
| NVIDIA GeForce RTX 3090 Ti | |
| NVIDIA GeForce RTX 4090 Laptop GPU | |
| Átlagos NVIDIA GeForce RTX 4090 Laptop GPU (34246 - 44948, n=7) | |
| Az osztály átlaga Gaming (22281 - 47946, n=17, az elmúlt 2 évben) | |
| NVIDIA GeForce RTX 3080 Ti Laptop GPU | |
| NVIDIA GeForce RTX 3080 Ti Laptop GPU | |
| NVIDIA GeForce RTX 3080 Ti Laptop GPU | |
| Apple M2 Max 38-Core GPU | |
| NVIDIA GeForce RTX 3080 Ti Laptop GPU | |
| 3DMark / Speed Way Score | |
| NVIDIA GeForce RTX 4080 | |
| NVIDIA GeForce RTX 4090 Laptop GPU | |
| NVIDIA GeForce RTX 4090 Laptop GPU | |
| Átlagos NVIDIA GeForce RTX 4090 Laptop GPU (4401 - 5940, n=27) | |
| NVIDIA GeForce RTX 4070 Ti | |
| NVIDIA GeForce RTX 3080 Ti | |
| NVIDIA GeForce RTX 3090 | |
| Az osztály átlaga Gaming (1577 - 6643, n=44, az elmúlt 2 évben) | |
| NVIDIA GeForce RTX 4080 Laptop GPU | |
| NVIDIA GeForce RTX 3080 Ti Laptop GPU | |
| 3DMark / Port Royal Graphics | |
| NVIDIA GeForce RTX 4080 | |
| NVIDIA GeForce RTX 3090 Ti | |
| NVIDIA GeForce RTX 4090 Laptop GPU | |
| NVIDIA GeForce RTX 4090 Laptop GPU | |
| NVIDIA GeForce RTX 4070 Ti | |
| Átlagos NVIDIA GeForce RTX 4090 Laptop GPU (10798 - 14592, n=31) | |
| NVIDIA GeForce RTX 3090 | |
| NVIDIA GeForce RTX 4080 Laptop GPU | |
| NVIDIA GeForce RTX 4080 Laptop GPU | |
| Az osztály átlaga Gaming (4395 - 17286, n=70, az elmúlt 2 évben) | |
| NVIDIA GeForce RTX 3080 Ti Laptop GPU | |
| NVIDIA GeForce RTX 3080 Ti Laptop GPU | |
| NVIDIA GeForce RTX 3080 Ti Laptop GPU | |
| NVIDIA GeForce RTX 3080 Ti Laptop GPU | |
| NVIDIA GeForce RTX 3080 Ti Laptop GPU | |
| Geekbench 5.5 / OpenCL Score | |
| NVIDIA GeForce RTX 4080 | |
| NVIDIA GeForce RTX 3090 Ti | |
| NVIDIA GeForce RTX 3090 | |
| NVIDIA GeForce RTX 4090 Laptop GPU | |
| NVIDIA GeForce RTX 4090 Laptop GPU | |
| NVIDIA GeForce RTX 4070 Ti | |
| Átlagos NVIDIA GeForce RTX 4090 Laptop GPU (6841 - 237138, n=39) | |
| NVIDIA GeForce RTX 4080 Laptop GPU | |
| Az osztály átlaga Gaming (80702 - 277970, n=107, az elmúlt 2 évben) | |
| NVIDIA GeForce RTX 3080 Ti Laptop GPU | |
| NVIDIA GeForce RTX 3080 Ti Laptop GPU | |
| NVIDIA GeForce RTX 3080 Ti Laptop GPU | |
| NVIDIA GeForce RTX 3080 Ti Laptop GPU | |
| NVIDIA GeForce RTX 3080 Ti Laptop GPU | |
| Apple M2 Max 38-Core GPU | |
| GFXBench / 4K Aztec Ruins High Tier Offscreen | |
| Átlagos NVIDIA GeForce RTX 4090 Laptop GPU (239 - 246, n=3) | |
| NVIDIA GeForce RTX 4090 Laptop GPU | |
| NVIDIA GeForce RTX 4080 Laptop GPU | |
| Apple M2 Max 38-Core GPU | |
| Az osztály átlaga Gaming (100.4 - 243, n=6, az elmúlt 2 évben) | |
| GFXBench / Aztec Ruins High Tier Offscreen | |
| Átlagos NVIDIA GeForce RTX 4090 Laptop GPU (518 - 550, n=3) | |
| NVIDIA GeForce RTX 4090 Laptop GPU | |
| NVIDIA GeForce RTX 4080 Laptop GPU | |
| Apple M2 Max 38-Core GPU | |
| Az osztály átlaga Gaming (232 - 507, n=6, az elmúlt 2 évben) | |
| 3DMark 06 Standard Score | 67927 pontok | |
| 3DMark Vantage P Result | 113387 pontok | |
| 3DMark 11 Performance | 49253 pontok | |
| 3DMark Fire Strike Score | 37594 pontok | |
| 3DMark Fire Strike Extreme Score | 25475 pontok | |
| 3DMark Time Spy Score | 20862 pontok | |
Segítség | ||
Photoshop PugetBench: Filter Score | General Score | GPU Score | Overall Score
Premiere Pro PugetBench: GPU 0.9 | Live Playback 0.9 | Export 0.9 | Overall Score 0.9
| Blender / v3.3 Classroom OPTIX/RTX | |
| Alienware x15 R2 P111F | |
| Asus ROG Strix Scar 17 SE G733CX-LL014W | |
| MSI Titan GT77 12UHS | |
| Az osztály átlaga Gaming (9 - 32, n=111, az elmúlt 2 évben) | |
| Razer Blade 16 Early 2023 | |
| ASUS TUF Gaming GeForce RTX 3080 Ti OC | |
| Intel Core i5-13400F | |
| Átlagos NVIDIA GeForce RTX 4090 Laptop GPU (9 - 19, n=39) | |
| KFA2 GeForce RTX 4070 Ti SG | |
| MSI Titan GT77 HX 13VI | |
| Schenker XMG Neo 16 Raptor Lake | |
| KFA2 GeForce RTX 4080 SG | |
| Blender / v3.3 Classroom CUDA | |
| Alienware x15 R2 P111F | |
| Asus ROG Strix Scar 17 SE G733CX-LL014W | |
| Az osztály átlaga Gaming (15 - 228, n=111, az elmúlt 2 évben) | |
| MSI Titan GT77 12UHS | |
| Razer Blade 16 Early 2023 | |
| ASUS TUF Gaming GeForce RTX 3080 Ti OC | |
| Intel Core i5-13400F | |
| Átlagos NVIDIA GeForce RTX 4090 Laptop GPU (16 - 24, n=39) | |
| Schenker XMG Neo 16 Raptor Lake | |
| MSI Titan GT77 HX 13VI | |
| Blender / v3.3 Classroom CPU | |
| Alienware x15 R2 P111F | |
| Intel Core i5-13400F | |
| Apple MacBook Pro 16 2023 M2 Max | |
| Asus ROG Strix Scar 17 SE G733CX-LL014W | |
| MSI Titan GT77 12UHS | |
| Az osztály átlaga Gaming (122 - 565, n=107, az elmúlt 2 évben) | |
| Razer Blade 16 Early 2023 | |
| Schenker XMG Neo 16 Raptor Lake | |
| Átlagos NVIDIA GeForce RTX 4090 Laptop GPU (144 - 305, n=39) | |
| MSI Titan GT77 HX 13VI | |
| ASUS TUF Gaming GeForce RTX 3080 Ti OC | |
| Blender / v3.3 Classroom METAL | |
| Apple MacBook Pro 16 2023 M2 Max | |
| Photoshop PugetBench / Filter Score | |
| KFA2 GeForce RTX 4080 SG | |
| ASUS TUF Gaming GeForce RTX 3080 Ti OC | |
| KFA2 GeForce RTX 4070 Ti SG | |
| Intel Core i5-13400F | |
| Apple MacBook Pro 16 2023 M2 Max | |
| MSI Titan GT77 HX 13VI | |
| Átlagos NVIDIA GeForce RTX 4090 Laptop GPU (91.9 - 104.6, n=5) | |
| Photoshop PugetBench / General Score | |
| MSI Titan GT77 HX 13VI | |
| Átlagos NVIDIA GeForce RTX 4090 Laptop GPU (151.8 - 168.2, n=5) | |
| Apple MacBook Pro 16 2023 M2 Max | |
| KFA2 GeForce RTX 4080 SG | |
| ASUS TUF Gaming GeForce RTX 3080 Ti OC | |
| KFA2 GeForce RTX 4070 Ti SG | |
| Intel Core i5-13400F | |
| Photoshop PugetBench / GPU Score | |
| KFA2 GeForce RTX 4080 SG | |
| ASUS TUF Gaming GeForce RTX 3080 Ti OC | |
| KFA2 GeForce RTX 4070 Ti SG | |
| Apple MacBook Pro 16 2023 M2 Max | |
| Átlagos NVIDIA GeForce RTX 4090 Laptop GPU (109.1 - 119.4, n=5) | |
| MSI Titan GT77 HX 13VI | |
| Intel Core i5-13400F | |
| Photoshop PugetBench / Overall Score | |
| KFA2 GeForce RTX 4080 SG | |
| ASUS TUF Gaming GeForce RTX 3080 Ti OC | |
| KFA2 GeForce RTX 4070 Ti SG | |
| MSI Titan GT77 HX 13VI | |
| Átlagos NVIDIA GeForce RTX 4090 Laptop GPU (1225 - 1356, n=5) | |
| Apple MacBook Pro 16 2023 M2 Max | |
| Intel Core i5-13400F | |
| Premiere Pro PugetBench / GPU 0.9 | |
| MSI Titan GT77 HX 13VI | |
| Átlagos NVIDIA GeForce RTX 4090 Laptop GPU (75.8 - 109.2, n=3) | |
| KFA2 GeForce RTX 4080 SG | |
| Intel Core i5-13400F | |
| ASUS TUF Gaming GeForce RTX 3080 Ti OC | |
| KFA2 GeForce RTX 4070 Ti SG | |
| Apple MacBook Pro 16 2023 M2 Max | |
| Premiere Pro PugetBench / Live Playback 0.9 | |
| MSI Titan GT77 HX 13VI | |
| Átlagos NVIDIA GeForce RTX 4090 Laptop GPU (91.7 - 118, n=3) | |
| KFA2 GeForce RTX 4080 SG | |
| KFA2 GeForce RTX 4070 Ti SG | |
| ASUS TUF Gaming GeForce RTX 3080 Ti OC | |
| Intel Core i5-13400F | |
| Apple MacBook Pro 16 2023 M2 Max | |
| Premiere Pro PugetBench / Export 0.9 | |
| MSI Titan GT77 HX 13VI | |
| KFA2 GeForce RTX 4070 Ti SG | |
| KFA2 GeForce RTX 4080 SG | |
| ASUS TUF Gaming GeForce RTX 3080 Ti OC | |
| Átlagos NVIDIA GeForce RTX 4090 Laptop GPU (78.4 - 113.4, n=3) | |
| Apple MacBook Pro 16 2023 M2 Max | |
| Intel Core i5-13400F | |
| Premiere Pro PugetBench / Overall Score 0.9 | |
| Apple MacBook Pro 16 2023 M2 Max | |
| MSI Titan GT77 HX 13VI | |
| Átlagos NVIDIA GeForce RTX 4090 Laptop GPU (821 - 1105, n=3) | |
| KFA2 GeForce RTX 4070 Ti SG | |
| KFA2 GeForce RTX 4080 SG | |
| ASUS TUF Gaming GeForce RTX 3080 Ti OC | |
| Intel Core i5-13400F | |
Photoshop PugetBench: Filter Score | General Score | GPU Score | Overall Score
Premiere Pro PugetBench: GPU 0.9 | Live Playback 0.9 | Export 0.9 | Overall Score 0.9
* ... a kisebb jobb
| LuxMark v2.0 64Bit | |
| Room GPUs-only | |
| KFA2 GeForce RTX 4090 SG | |
| NVIDIA GeForce RTX 4080 Founders Edition | |
| MSI Titan GT77 HX 13VI | |
| KFA2 GeForce RTX 4070 Ti SG | |
| Intel Core i5-13400F | |
| ASUS TUF Gaming GeForce RTX 3080 Ti OC | |
| AMD Radeon RX 7900 XTX | |
| Sala GPUs-only | |
| KFA2 GeForce RTX 4090 SG | |
| NVIDIA GeForce RTX 4080 Founders Edition | |
| MSI Titan GT77 HX 13VI | |
| KFA2 GeForce RTX 4070 Ti SG | |
| ASUS TUF Gaming GeForce RTX 3080 Ti OC | |
| Intel Core i5-13400F | |
| AMD Radeon RX 7900 XTX | |
| SPECviewperf 13 | |
| Solidworks (sw-04) | |
| AMD Radeon RX 7900 XTX | |
| Lenovo ThinkPad P16 G1 RTX A5500 | |
| NVIDIA GeForce RTX 4080 Founders Edition | |
| KFA2 GeForce RTX 4090 SG | |
| KFA2 GeForce RTX 4070 Ti SG | |
| MSI Titan GT77 HX 13VI | |
| ASUS TUF Gaming GeForce RTX 3080 Ti OC | |
| Intel Core i5-13400F | |
| Siemens NX (snx-03) | |
| AMD Radeon RX 7900 XTX | |
| Lenovo ThinkPad P16 G1 RTX A5500 | |
| KFA2 GeForce RTX 4090 SG | |
| NVIDIA GeForce RTX 4080 Founders Edition | |
| MSI Titan GT77 HX 13VI | |
| KFA2 GeForce RTX 4070 Ti SG | |
| ASUS TUF Gaming GeForce RTX 3080 Ti OC | |
| Intel Core i5-13400F | |
| Showcase (showcase-02) | |
| KFA2 GeForce RTX 4090 SG | |
| AMD Radeon RX 7900 XTX | |
| NVIDIA GeForce RTX 4080 Founders Edition | |
| MSI Titan GT77 HX 13VI | |
| Intel Core i5-13400F | |
| ASUS TUF Gaming GeForce RTX 3080 Ti OC | |
| KFA2 GeForce RTX 4070 Ti SG | |
| Lenovo ThinkPad P16 G1 RTX A5500 | |
| Medical (medical-02) | |
| AMD Radeon RX 7900 XTX | |
| KFA2 GeForce RTX 4090 SG | |
| NVIDIA GeForce RTX 4080 Founders Edition | |
| Lenovo ThinkPad P16 G1 RTX A5500 | |
| KFA2 GeForce RTX 4070 Ti SG | |
| MSI Titan GT77 HX 13VI | |
| ASUS TUF Gaming GeForce RTX 3080 Ti OC | |
| Intel Core i5-13400F | |
| Maya (maya-05) | |
| AMD Radeon RX 7900 XTX | |
| NVIDIA GeForce RTX 4080 Founders Edition | |
| KFA2 GeForce RTX 4090 SG | |
| MSI Titan GT77 HX 13VI | |
| KFA2 GeForce RTX 4070 Ti SG | |
| ASUS TUF Gaming GeForce RTX 3080 Ti OC | |
| Intel Core i5-13400F | |
| Lenovo ThinkPad P16 G1 RTX A5500 | |
| Energy (energy-02) | |
| AMD Radeon RX 7900 XTX | |
| KFA2 GeForce RTX 4090 SG | |
| NVIDIA GeForce RTX 4080 Founders Edition | |
| MSI Titan GT77 HX 13VI | |
| KFA2 GeForce RTX 4070 Ti SG | |
| Lenovo ThinkPad P16 G1 RTX A5500 | |
| Intel Core i5-13400F | |
| ASUS TUF Gaming GeForce RTX 3080 Ti OC | |
| Creo (creo-02) | |
| AMD Radeon RX 7900 XTX | |
| NVIDIA GeForce RTX 4080 Founders Edition | |
| KFA2 GeForce RTX 4090 SG | |
| MSI Titan GT77 HX 13VI | |
| KFA2 GeForce RTX 4070 Ti SG | |
| ASUS TUF Gaming GeForce RTX 3080 Ti OC | |
| Intel Core i5-13400F | |
| Lenovo ThinkPad P16 G1 RTX A5500 | |
| Catia (catia-05) | |
| AMD Radeon RX 7900 XTX | |
| KFA2 GeForce RTX 4090 SG | |
| Lenovo ThinkPad P16 G1 RTX A5500 | |
| NVIDIA GeForce RTX 4080 Founders Edition | |
| KFA2 GeForce RTX 4070 Ti SG | |
| MSI Titan GT77 HX 13VI | |
| ASUS TUF Gaming GeForce RTX 3080 Ti OC | |
| Intel Core i5-13400F | |
| 3ds Max (3dsmax-06) | |
| AMD Radeon RX 7900 XTX | |
| KFA2 GeForce RTX 4090 SG | |
| NVIDIA GeForce RTX 4080 Founders Edition | |
| KFA2 GeForce RTX 4070 Ti SG | |
| ASUS TUF Gaming GeForce RTX 3080 Ti OC | |
| MSI Titan GT77 HX 13VI | |
| Intel Core i5-13400F | |
| Lenovo ThinkPad P16 G1 RTX A5500 | |
| SPECviewperf 2020 | |
| 1920x1080 Solidworks (solidworks-05) | |
| MSI Titan GT77 HX 13VI | |
| Lenovo ThinkPad P16 G1 RTX A5500 | |
| 1920x1080 Siemens NX (snx-04) | |
| Lenovo ThinkPad P16 G1 RTX A5500 | |
| MSI Titan GT77 HX 13VI | |
| 1920x1080 Medical (medical-03) | |
| Lenovo ThinkPad P16 G1 RTX A5500 | |
| MSI Titan GT77 HX 13VI | |
| 1920x1080 Maya (maya-06) | |
| MSI Titan GT77 HX 13VI | |
| Lenovo ThinkPad P16 G1 RTX A5500 | |
| 1920x1080 Energy (energy-03) | |
| MSI Titan GT77 HX 13VI | |
| Lenovo ThinkPad P16 G1 RTX A5500 | |
| 1920x1080 Creo (creo-03) | |
| Lenovo ThinkPad P16 G1 RTX A5500 | |
| MSI Titan GT77 HX 13VI | |
| 1920x1080 CATIA (catia-06) | |
| MSI Titan GT77 HX 13VI | |
| Lenovo ThinkPad P16 G1 RTX A5500 | |
| 1920x1080 3ds Max (3dsmax-07) | |
| MSI Titan GT77 HX 13VI | |
| Lenovo ThinkPad P16 G1 RTX A5500 | |
| 3840x2160 Solidworks (solidworks-05) | |
| NVIDIA GeForce RTX 4080 Founders Edition | |
| MSI Titan GT77 HX 13VI | |
| Intel Core i5-13400F | |
| Lenovo ThinkPad P16 G1 RTX A5500 | |
| 3840x2160 Siemens NX (snx-04) | |
| AMD Radeon RX 7900 XTX | |
| Lenovo ThinkPad P16 G1 RTX A5500 | |
| KFA2 GeForce RTX 4090 SG | |
| NVIDIA GeForce RTX 4080 Founders Edition | |
| MSI Titan GT77 HX 13VI | |
| KFA2 GeForce RTX 4070 Ti SG | |
| ASUS TUF Gaming GeForce RTX 3080 Ti OC | |
| Intel Core i5-13400F | |
| 3840x2160 Medical (medical-03) | |
| AMD Radeon RX 7900 XTX | |
| KFA2 GeForce RTX 4090 SG | |
| NVIDIA GeForce RTX 4080 Founders Edition | |
| KFA2 GeForce RTX 4070 Ti SG | |
| Lenovo ThinkPad P16 G1 RTX A5500 | |
| MSI Titan GT77 HX 13VI | |
| ASUS TUF Gaming GeForce RTX 3080 Ti OC | |
| Intel Core i5-13400F | |
| 3840x2160 Maya (maya-06) | |
| KFA2 GeForce RTX 4090 SG | |
| AMD Radeon RX 7900 XTX | |
| NVIDIA GeForce RTX 4080 Founders Edition | |
| KFA2 GeForce RTX 4070 Ti SG | |
| MSI Titan GT77 HX 13VI | |
| ASUS TUF Gaming GeForce RTX 3080 Ti OC | |
| Intel Core i5-13400F | |
| Lenovo ThinkPad P16 G1 RTX A5500 | |
| 3840x2160 Energy (energy-03) | |
| KFA2 GeForce RTX 4090 SG | |
| AMD Radeon RX 7900 XTX | |
| KFA2 GeForce RTX 4070 Ti SG | |
| MSI Titan GT77 HX 13VI | |
| Intel Core i5-13400F | |
| ASUS TUF Gaming GeForce RTX 3080 Ti OC | |
| NVIDIA GeForce RTX 4080 Founders Edition | |
| Lenovo ThinkPad P16 G1 RTX A5500 | |
| 3840x2160 Creo (creo-03) | |
| AMD Radeon RX 7900 XTX | |
| NVIDIA GeForce RTX 4080 Founders Edition | |
| KFA2 GeForce RTX 4090 SG | |
| KFA2 GeForce RTX 4070 Ti SG | |
| MSI Titan GT77 HX 13VI | |
| Lenovo ThinkPad P16 G1 RTX A5500 | |
| ASUS TUF Gaming GeForce RTX 3080 Ti OC | |
| Intel Core i5-13400F | |
| 3840x2160 CATIA (catia-06) | |
| AMD Radeon RX 7900 XTX | |
| KFA2 GeForce RTX 4090 SG | |
| NVIDIA GeForce RTX 4080 Founders Edition | |
| Lenovo ThinkPad P16 G1 RTX A5500 | |
| MSI Titan GT77 HX 13VI | |
| KFA2 GeForce RTX 4070 Ti SG | |
| ASUS TUF Gaming GeForce RTX 3080 Ti OC | |
| Intel Core i5-13400F | |
| 3840x2160 3ds Max (3dsmax-07) | |
| KFA2 GeForce RTX 4090 SG | |
| NVIDIA GeForce RTX 4080 Founders Edition | |
| AMD Radeon RX 7900 XTX | |
| KFA2 GeForce RTX 4070 Ti SG | |
| MSI Titan GT77 HX 13VI | |
| Intel Core i5-13400F | |
| ASUS TUF Gaming GeForce RTX 3080 Ti OC | |
| Lenovo ThinkPad P16 G1 RTX A5500 | |
| The Witcher 3 - 1920x1080 Ultra Graphics & Postprocessing (HBAO+) | |
| Schenker XMG Neo 16 Raptor Lake | |
| MSI Titan GT77 HX 13VI | |
| Razer Blade 16 Early 2023 | |
| Az osztály átlaga Gaming (95 - 240, n=8, az elmúlt 2 évben) | |
| MSI Titan GT77 12UHS | |
| Alienware x17 R2 P48E | |
| Schenker XMG Neo 17 M22 | |
| Asus ROG Strix Scar 17 SE G733CX-LL014W | |
| The Witcher 3 v4 - 1920x1080 RT Ultra Preset / On AA:FX | |
| KFA2 GeForce RTX 4070 Ti SG | |
| MSI Titan GT77 HX 13VI | |
| Schenker XMG Neo 16 Raptor Lake | |
| Átlagos NVIDIA GeForce RTX 4090 Laptop GPU (53.1 - 68, n=5) | |
| Cyberpunk 2077 1.6 | |
| 3840x2160 Ray Tracing Ultra Preset (DLSS off) | |
| KFA2 GeForce RTX 4080 SG | |
| Zotac Gaming GeForce RTX 3090 Ti AMP Extreme Holo | |
| Schenker XMG Neo 16 Raptor Lake | |
| MSI Titan GT77 HX 13VI | |
| KFA2 GeForce RTX 4070 Ti SG | |
| Átlagos NVIDIA GeForce RTX 4090 Laptop GPU (16.5 - 22.4, n=7) | |
| Razer Blade 16 Early 2023 | |
| ASUS TUF Gaming GeForce RTX 3080 Ti OC | |
| 1920x1080 Ray Tracing Ultra Preset (DLSS off) | |
| KFA2 GeForce RTX 4080 SG | |
| KFA2 GeForce RTX 4070 Ti SG | |
| Zotac Gaming GeForce RTX 3090 Ti AMP Extreme Holo | |
| MSI Titan GT77 HX 13VI | |
| Schenker XMG Neo 16 Raptor Lake | |
| ASUS TUF Gaming GeForce RTX 3080 Ti OC | |
| Átlagos NVIDIA GeForce RTX 4090 Laptop GPU (56.5 - 74, n=8) | |
| Razer Blade 16 Early 2023 | |
| MSI Titan GT77 12UHS | |
| Alienware x15 R2 P111F | |
| The Callisto Protocol - 1920x1080 Ultra Preset (without FSR Upscaling) + Full Ray-Tracing | |
| KFA2 GeForce RTX 4080 SG | |
| KFA2 GeForce RTX 4070 Ti SG | |
| ASUS TUF Gaming GeForce RTX 3080 Ti OC | |
| MSI Titan GT77 HX 13VI | |
| Átlagos NVIDIA GeForce RTX 4090 Laptop GPU (32 - 79.6, n=5) | |
| Schenker XMG Neo 16 Raptor Lake | |
| Spider-Man Miles Morales - 1920x0180 Very High Preset + Ray-Tracing AA:T | |
| KFA2 GeForce RTX 4080 SG | |
| KFA2 GeForce RTX 4070 Ti SG | |
| Schenker XMG Neo 16 Raptor Lake | |
| ASUS TUF Gaming GeForce RTX 3080 Ti OC | |
| MSI Titan GT77 HX 13VI | |
| Átlagos NVIDIA GeForce RTX 4090 Laptop GPU (79.6 - 96.2, n=4) | |
| Far Cry 6 - 1920x1080 Ultra Graphics Quality + HD Textures + DXR AA:T | |
| KFA2 GeForce RTX 4070 Ti SG | |
| ASUS TUF Gaming GeForce RTX 3080 Ti OC | |
| KFA2 GeForce RTX 4080 SG | |
| Zotac Gaming GeForce RTX 3090 Ti AMP Extreme Holo | |
| Razer Blade 16 Early 2023 | |
| MSI Titan GT77 HX 13VI | |
| Schenker XMG Neo 16 Raptor Lake | |
| Az osztály átlaga Gaming (n=1az elmúlt 2 évben) | |
| Intel Core i5-13400F | |
| Átlagos NVIDIA GeForce RTX 4090 Laptop GPU (81 - 116, n=5) | |
| Metro Exodus - 1920x1080 Ultra Quality DXR AF:16x | |
| KFA2 GeForce RTX 4080 SG | |
| KFA2 GeForce RTX 4070 Ti SG | |
| Zotac Gaming GeForce RTX 3090 Ti AMP Extreme Holo | |
| ASUS TUF Gaming GeForce RTX 3080 Ti OC | |
| Intel Core i5-13400F | |
| MSI Titan GT77 HX 13VI | |
| Átlagos NVIDIA GeForce RTX 4090 Laptop GPU (93.9 - 118.8, n=4) | |
| Razer Blade 16 Early 2023 | |
| Schenker XMG Neo 16 Raptor Lake | |
| Schenker XMG Neo 17 M22 | |
| Watch Dogs Legion - 1920x1080 Ultra Preset + Ultra Ray Tracing (DX12) | |
| Schenker XMG Neo 16 Raptor Lake | |
| Zotac Gaming GeForce RTX 3090 Ti AMP Extreme Holo | |
| Átlagos NVIDIA GeForce RTX 4090 Laptop GPU (84 - 90, n=2) | |
| MSI Titan GT77 HX 13VI | |
| Razer Blade 16 Early 2023 | |
| MSI Titan GT77 12UHS | |
| Alienware x15 R2 P111F | |
Witcher 3 FPS-Diagramm
| Power Consumption - Witcher 3 ultra Efficiency (external Monitor) | |
| NVIDIA GeForce RTX 4090 Laptop GPU | |
| NVIDIA GeForce RTX 4080 Laptop GPU | |
| NVIDIA GeForce RTX 3080 Ti Laptop GPU | |
| NVIDIA GeForce RTX 4080 | |
| NVIDIA GeForce RTX 4070 Ti | |
| NVIDIA GeForce RTX 3080 Ti Laptop GPU | |
| NVIDIA GeForce RTX 3080 Ti Laptop GPU | |
| NVIDIA GeForce RTX 3080 Ti Laptop GPU | |
| NVIDIA GeForce RTX 3090 | |
| NVIDIA GeForce RTX 3080 Ti | |
| NVIDIA GeForce RTX 3090 Ti | |
| alacsony | közepes | magas | ultra | QHD | 4K DLSS | 4K | |
|---|---|---|---|---|---|---|---|
| GTA V (2015) | 184.1 | 182.6 | 140.9 | 138.5 | 175.7 | ||
| The Witcher 3 (2015) | 619 | 546 | 422 | 198.9 | 160 | ||
| Dota 2 Reborn (2015) | 225 | 206 | 194.1 | 185.9 | 178.9 | ||
| Final Fantasy XV Benchmark (2018) | 230 | 221 | 187.4 | 162.9 | 94.7 | ||
| X-Plane 11.11 (2018) | 203 | 177.5 | 134.1 | 114.3 | |||
| Far Cry 5 (2018) | 186 | 173 | 160 | 159 | 113 | ||
| Strange Brigade (2018) | 490 | 396 | 391 | 373 | 309 | 159.3 | |
| Shadow of the Tomb Raider (2018) | 245 | 227 | 219 | 214 | 187 | 103 | |
| Metro Exodus (2019) | 204 | 183 | 153 | 132 | 116 | 81 | |
| Control (2019) | 240 | 232 | 187 | 122 | 63 | ||
| Borderlands 3 (2019) | 201 | 176 | 162 | 151 | 130 | 76 | |
| Horizon Zero Dawn (2020) | 209 | 189 | 174 | 163 | 154 | 131 | 95 |
| Mafia Definitive Edition (2020) | 219 | 189 | 179 | 161 | 93 | ||
| Watch Dogs Legion (2020) | 152 | 144 | 131 | 120 | 109 | 69 | |
| F1 2021 (2021) | 501 | 449 | 417 | 209 | 192.4 | 114.4 | |
| Far Cry 6 (2021) | 167 | 147 | 144 | 135 | 89 | ||
| Forza Horizon 5 (2021) | 220 | 181 | 174 | 124 | 113 | 95 | |
| God of War (2022) | 201 | 200 | 180 | 133 | 115 | 80 | |
| Rainbow Six Extraction (2022) | 378 | 347 | 346 | 314 | 219 | 112 | |
| Dying Light 2 (2022) | 240 | 206 | 174 | 121 | 62 | ||
| GRID Legends (2022) | 254 | 230 | 210 | 199 | 190 | 132 | |
| Cyberpunk 2077 1.6 (2022) | 156 | 144 | 138 | 135 | 98 | 56 | |
| Ghostwire Tokyo (2022) | 237 | 236 | 234 | 231 | 206 | 100 | |
| Tiny Tina's Wonderlands (2022) | 339 | 289 | 224 | 182 | 131 | 70 | |
| F1 22 (2022) | 316 | 294 | 283 | 138.2 | 90.1 | 44.9 | |
| Call of Duty Modern Warfare 2 2022 (2022) | 230 | 215 | 183 | 176 | 135 | 126 | 85 |
| Spider-Man Miles Morales (2022) | 134 | 131 | 118 | 116 | 113 | 83 | |
| The Callisto Protocol (2022) | 195 | 181 | 145 | 144 | 114 | 68 | |
| The Witcher 3 v4 (2023) | 240 | 189 | 173 | 150 | 104 | 50 | |
| Dead Space Remake (2023) | 147 | 141 | 130 | 129 | 100 | 53 |
Zajszint
| Üresjárat |
| 29.2 / 29.2 / 29.2 dB(A) |
| Terhelés |
| 50.7 / 61 dB(A) |
 | ||
30 dB csendes 40 dB(A) hallható 50 dB(A) hangos |
||
min: | ||
| MSI Titan GT77 HX 13VI GeForce RTX 4090 Laptop GPU, i9-13950HX, Samsung PM9A1 MZVL22T0HBLB | Razer Blade 16 Early 2023 GeForce RTX 4080 Laptop GPU, i9-13950HX, SSSTC CA6-8D1024 | Asus ROG Strix Scar 17 SE G733CX-LL014W GeForce RTX 3080 Ti Laptop GPU, i9-12950HX, Samsung PM9A1 MZVL22T0HBLB | MSI Titan GT77 12UHS GeForce RTX 3080 Ti Laptop GPU, i9-12900HX, Samsung PM9A1 MZVL21T0HCLR | Alienware x17 R2 P48E GeForce RTX 3080 Ti Laptop GPU, i9-12900HK, 2x Samsung PM9A1 1TB (RAID 0) | Schenker XMG Neo 17 M22 GeForce RTX 3080 Ti Laptop GPU, R9 6900HX, Samsung SSD 980 Pro 1TB MZ-V8P1T0BW | |
|---|---|---|---|---|---|---|
| Noise | 16% | 19% | 10% | 18% | -2% | |
| off / környezet * (dB) | 24.6 | 23 7% | 23.9 3% | 21.9 11% | 22.7 8% | 26 -6% |
| Idle Minimum * (dB) | 29.2 | 23 21% | 23.9 18% | 24.53 16% | 23.1 21% | 26 11% |
| Idle Average * (dB) | 29.2 | 23 21% | 23.9 18% | 24.53 16% | 23.1 21% | 29 1% |
| Idle Maximum * (dB) | 29.2 | 23.6 19% | 23.9 18% | 24.53 16% | 23.1 21% | 40 -37% |
| Load Average * (dB) | 50.7 | 39 23% | 34.3 32% | 46.25 9% | 31.9 37% | 47 7% |
| Witcher 3 ultra * (dB) | 53.3 | 51.6 3% | 56.86 -7% | 52.5 2% | 52 2% | |
| Load Maximum * (dB) | 61 | 51.3 16% | 45.9 25% | 54.25 11% | 52.5 14% | 54 11% |
* ... a kisebb jobb
(±) A felső oldalon a maximális hőmérséklet 40.6 °C / 105 F, összehasonlítva a 40.4 °C / 105 F átlagával , 21.2 és 68.8 °C között a Gaming osztálynál.
(±) Az alsó maximum 41.1 °C / 106 F-ig melegszik fel, összehasonlítva a 43.2 °C / 110 F átlagával
(+) Üresjáratban a felső oldal átlagos hőmérséklete 25.2 °C / 77 F, összehasonlítva a 33.9 °C / ### eszközátlaggal class_avg_f### F.
(±) A The Witcher 3 játék során a felső oldal átlaghőmérséklete 36.2 °C / 97 F, összehasonlítva a 33.9 °C / ## eszközátlaggal #class_avg_f### F.
(+) A csuklótámasz és az érintőpad hűvösebb, mint a bőr hőmérséklete, maximum 29.6 °C / 85.3 F, ezért hűvös tapintású.
(±) A hasonló eszközök csuklótámasz területének átlagos hőmérséklete 28.8 °C / 83.8 F volt (-0.8 °C / -1.5 F).
| MSI Titan GT77 HX 13VI Intel Core i9-13950HX, NVIDIA GeForce RTX 4090 Laptop GPU | Razer Blade 16 Early 2023 Intel Core i9-13950HX, NVIDIA GeForce RTX 4080 Laptop GPU | Asus ROG Strix Scar 17 SE G733CX-LL014W Intel Core i9-12950HX, NVIDIA GeForce RTX 3080 Ti Laptop GPU | MSI Titan GT77 12UHS Intel Core i9-12900HX, NVIDIA GeForce RTX 3080 Ti Laptop GPU | Alienware x17 R2 P48E Intel Core i9-12900HK, NVIDIA GeForce RTX 3080 Ti Laptop GPU | Schenker XMG Neo 17 M22 AMD Ryzen 9 6900HX, NVIDIA GeForce RTX 3080 Ti Laptop GPU | |
|---|---|---|---|---|---|---|
| Heat | -5% | -19% | -22% | -11% | -18% | |
| Maximum Upper Side * (°C) | 40.6 | 40 1% | 48.8 -20% | 40.8 -0% | 49.6 -22% | 49 -21% |
| Maximum Bottom * (°C) | 41.1 | 37.6 9% | 52.4 -27% | 52.4 -27% | 42.4 -3% | 52 -27% |
| Idle Upper Side * (°C) | 26.2 | 32.4 -24% | 30.4 -16% | 34.6 -32% | 29.2 -11% | 30 -15% |
| Idle Bottom * (°C) | 30.3 | 31.4 -4% | 34.1 -13% | 38.4 -27% | 32 -6% | 33 -9% |
* ... a kisebb jobb
MSI Titan GT77 HX 13VI hangelemzés
(+) | a hangszórók viszonylag hangosan tudnak játszani (90.1 dB)
Basszus 100 - 315 Hz
(±) | csökkentett basszus – átlagosan 14.3%-kal alacsonyabb, mint a medián
(±) | a basszus linearitása átlagos (7.5% delta az előző frekvenciához)
Közepes 400-2000 Hz
(+) | kiegyensúlyozott középpontok – csak 3.5% választja el a mediántól
(+) | a középpontok lineárisak (3.2% delta az előző frekvenciához)
Maximum 2-16 kHz
(+) | kiegyensúlyozott csúcsok – csak 1.9% választja el a mediántól
(+) | a csúcsok lineárisak (3.8% delta az előző frekvenciához képest)
Összességében 100 - 16.000 Hz
(+) | általános hangzás lineáris (11.1% eltérés a mediánhoz képest)
Ugyanazon osztályhoz képest
» 8%Ebben az osztályban az összes tesztelt eszköz %-a jobb volt, 3% hasonló, 89%-kal rosszabb
» A legjobb delta értéke 6%, az átlag 18%, a legrosszabb 132% volt
Az összes tesztelt eszközzel összehasonlítva
» 7% az összes tesztelt eszköz jobb volt, 2% hasonló, 92%-kal rosszabb
» A legjobb delta értéke 4%, az átlag 24%, a legrosszabb 134% volt
Alienware x17 R2 P48E hangelemzés
(+) | a hangszórók viszonylag hangosan tudnak játszani (84.3 dB)
Basszus 100 - 315 Hz
(±) | csökkentett basszus – átlagosan 9.7%-kal alacsonyabb, mint a medián
(+) | a basszus lineáris (5.5% delta az előző frekvenciához)
Közepes 400-2000 Hz
(+) | kiegyensúlyozott középpontok – csak 1.6% választja el a mediántól
(+) | a középpontok lineárisak (3% delta az előző frekvenciához)
Maximum 2-16 kHz
(±) | magasabb csúcsok – átlagosan 5%-kal magasabb, mint a medián
(±) | a csúcsok linearitása átlagos (7.6% delta az előző gyakorisághoz)
Összességében 100 - 16.000 Hz
(+) | általános hangzás lineáris (9.3% eltérés a mediánhoz képest)
Ugyanazon osztályhoz képest
» 3%Ebben az osztályban az összes tesztelt eszköz %-a jobb volt, 2% hasonló, 95%-kal rosszabb
» A legjobb delta értéke 6%, az átlag 18%, a legrosszabb 132% volt
Az összes tesztelt eszközzel összehasonlítva
» 3% az összes tesztelt eszköz jobb volt, 1% hasonló, 96%-kal rosszabb
» A legjobb delta értéke 4%, az átlag 24%, a legrosszabb 134% volt
| Kikapcsolt állapot / Készenlét | |
| Üresjárat | |
| Terhelés |
|
Kulcs:
min: | |
| MSI Titan GT77 HX 13VI i9-13950HX, GeForce RTX 4090 Laptop GPU, Samsung PM9A1 MZVL22T0HBLB, Mini-LED, 3840x2160, 17.3" | Razer Blade 16 Early 2023 i9-13950HX, GeForce RTX 4080 Laptop GPU, SSSTC CA6-8D1024, IPS, 2560x1600, 16" | Asus ROG Strix Scar 17 SE G733CX-LL014W i9-12950HX, GeForce RTX 3080 Ti Laptop GPU, Samsung PM9A1 MZVL22T0HBLB, IPS, 2560x1440, 17.3" | MSI Titan GT77 12UHS i9-12900HX, GeForce RTX 3080 Ti Laptop GPU, Samsung PM9A1 MZVL21T0HCLR, IPS-Level, 1920x1080, 17.3" | Alienware x17 R2 P48E i9-12900HK, GeForce RTX 3080 Ti Laptop GPU, 2x Samsung PM9A1 1TB (RAID 0), IPS, 1920x1080, 17.3" | Schenker XMG Neo 17 M22 R9 6900HX, GeForce RTX 3080 Ti Laptop GPU, Samsung SSD 980 Pro 1TB MZ-V8P1T0BW, IPS, 2560x1600, 17" | Átlagos NVIDIA GeForce RTX 4090 Laptop GPU | Az osztály átlaga Gaming | |
|---|---|---|---|---|---|---|---|---|
| Power Consumption | -12% | -7% | -30% | -37% | 33% | -9% | 14% | |
| Idle Minimum * (Watt) | 14 | 15.2 -9% | 19.3 -38% | 30.21 -116% | 24.1 -72% | 7 50% | 16.2 ? -16% | 13.2 ? 6% |
| Idle Average * (Watt) | 21.6 | 22.8 -6% | 26.5 -23% | 32.42 -50% | 28.5 -32% | 11 49% | 23.1 ? -7% | 18.9 ? 13% |
| Idle Maximum * (Watt) | 24.8 | 49.8 -101% | 27.1 -9% | 33.7 -36% | 60 -142% | 17 31% | 34.2 ? -38% | 24.3 ? 2% |
| Load Average * (Watt) | 122.5 | 121.2 1% | 141 -15% | 125.09 -2% | 128.7 -5% | 92 25% | 130.5 ? -7% | 108 ? 12% |
| Witcher 3 ultra * (Watt) | 265 | 242 9% | 225 15% | 256 3% | 254 4% | 221 17% | ||
| Load Maximum * (Watt) | 418 | 273.7 35% | 307.9 26% | 321.88 23% | 323 23% | 306 27% | 324 ? 22% | 254 ? 39% |
* ... a kisebb jobb
Power consumption Witcher 3 / Stress test
Power consumption external screen
| MSI Titan GT77 HX 13VI i9-13950HX, GeForce RTX 4090 Laptop GPU, 99.9 Wh | Razer Blade 16 Early 2023 i9-13950HX, GeForce RTX 4080 Laptop GPU, 95.2 Wh | Asus ROG Strix Scar 17 SE G733CX-LL014W i9-12950HX, GeForce RTX 3080 Ti Laptop GPU, 90 Wh | MSI Titan GT77 12UHS i9-12900HX, GeForce RTX 3080 Ti Laptop GPU, 99.9 Wh | Alienware x17 R2 P48E i9-12900HK, GeForce RTX 3080 Ti Laptop GPU, 87 Wh | Schenker XMG Neo 17 M22 R9 6900HX, GeForce RTX 3080 Ti Laptop GPU, 99 Wh | Az osztály átlaga Gaming | |
|---|---|---|---|---|---|---|---|
| Akkumulátor üzemidő | 8% | -21% | 17% | -53% | 36% | 25% | |
| H.264 (h) | 6 | 7.2 20% | 6.6 10% | 8.26 ? 38% | |||
| WiFi v1.3 (h) | 5.3 | 6.1 15% | 4.2 -21% | 6.9 30% | 2 -62% | 9 70% | 7.02 ? 32% |
| Load (h) | 1.4 | 1.4 0% | 1.4 0% | 0.8 -43% | 1.8 29% | 1.47 ? 5% | |
| Witcher 3 ultra (h) | 1.5 |
Pro
Kontra
Összegzés - GT77 extrém játékteljesítménnyel és nagyszerű kijelzővel
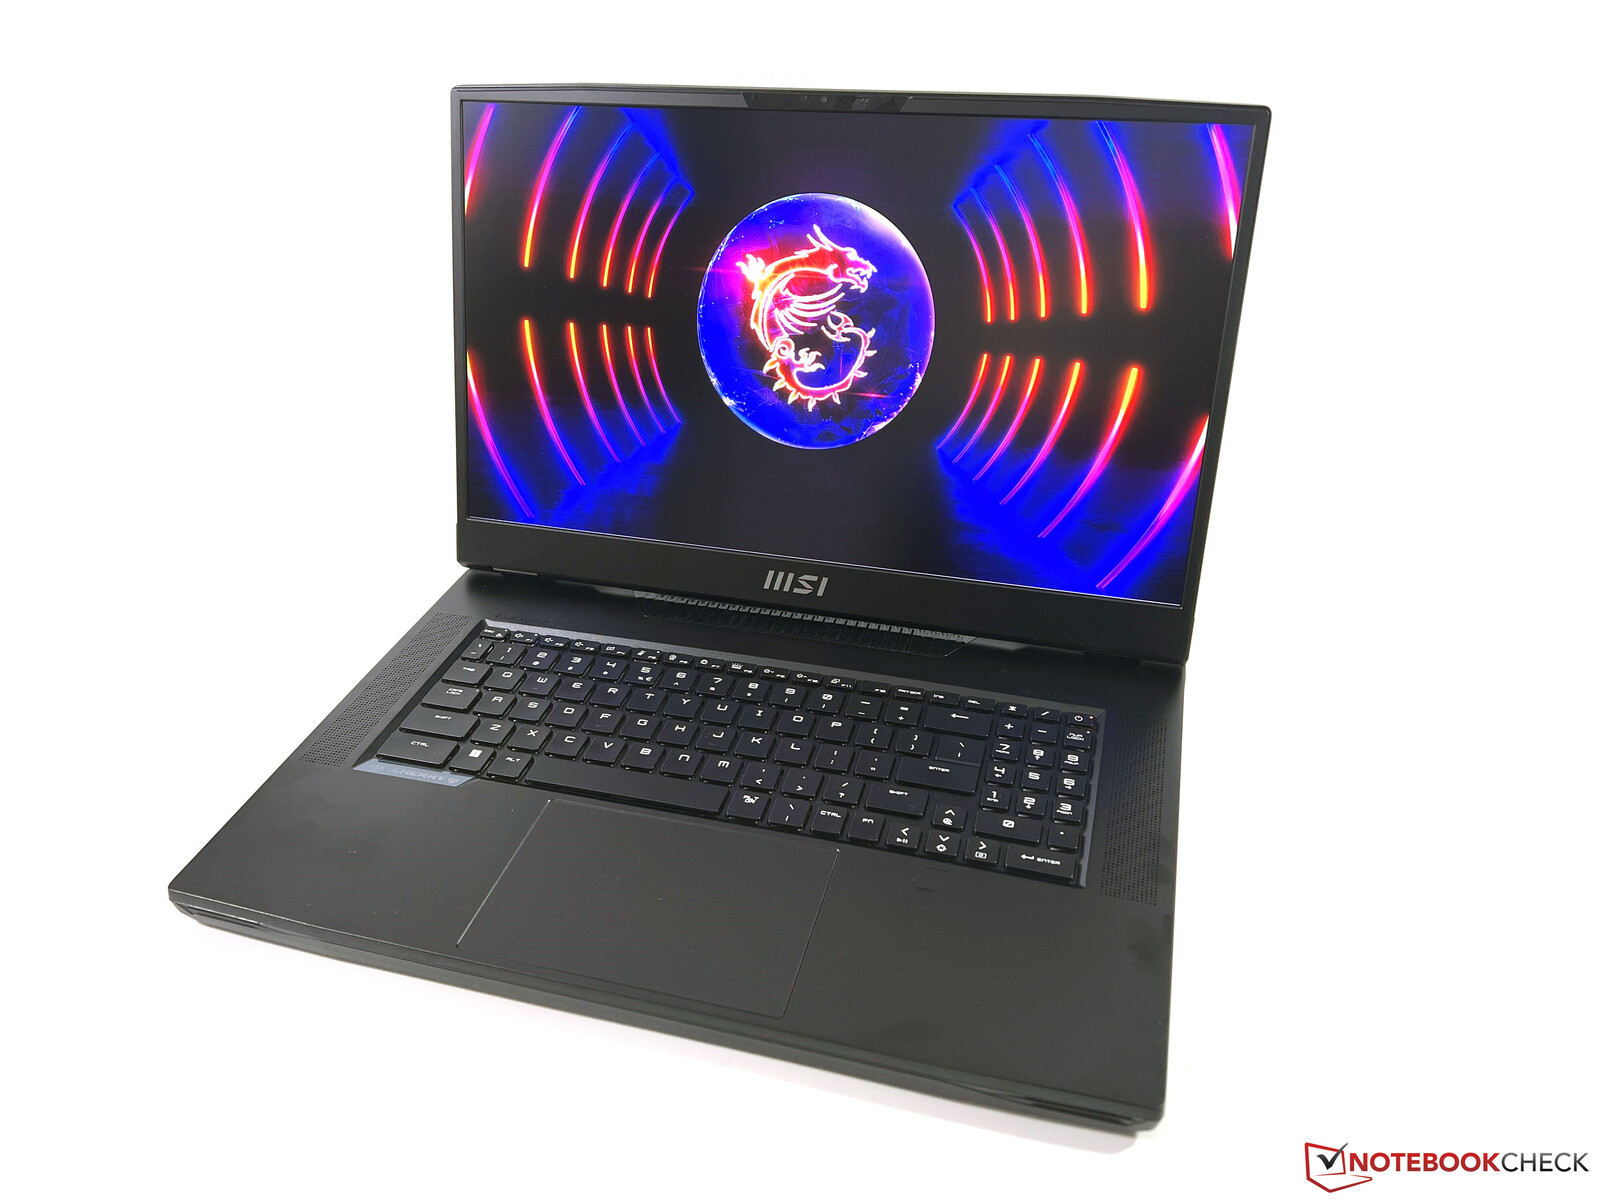
Az új MSI Titan GT77 a magas ár miatt valószínűleg csak a felhasználók egy nagyon szűk csoportjához jut el, de így is lenyűgözően mutatja be, hogy mi minden lehetséges. A csúcskategóriás gamer szinte minden tekintetben a jelenleg kapható legjobb komponenseket egyesíti magában, és egy nagyon jó összcsomagot alkot, amelynek nem kell a teljes értékű asztali rendszerek mögé bújnia.
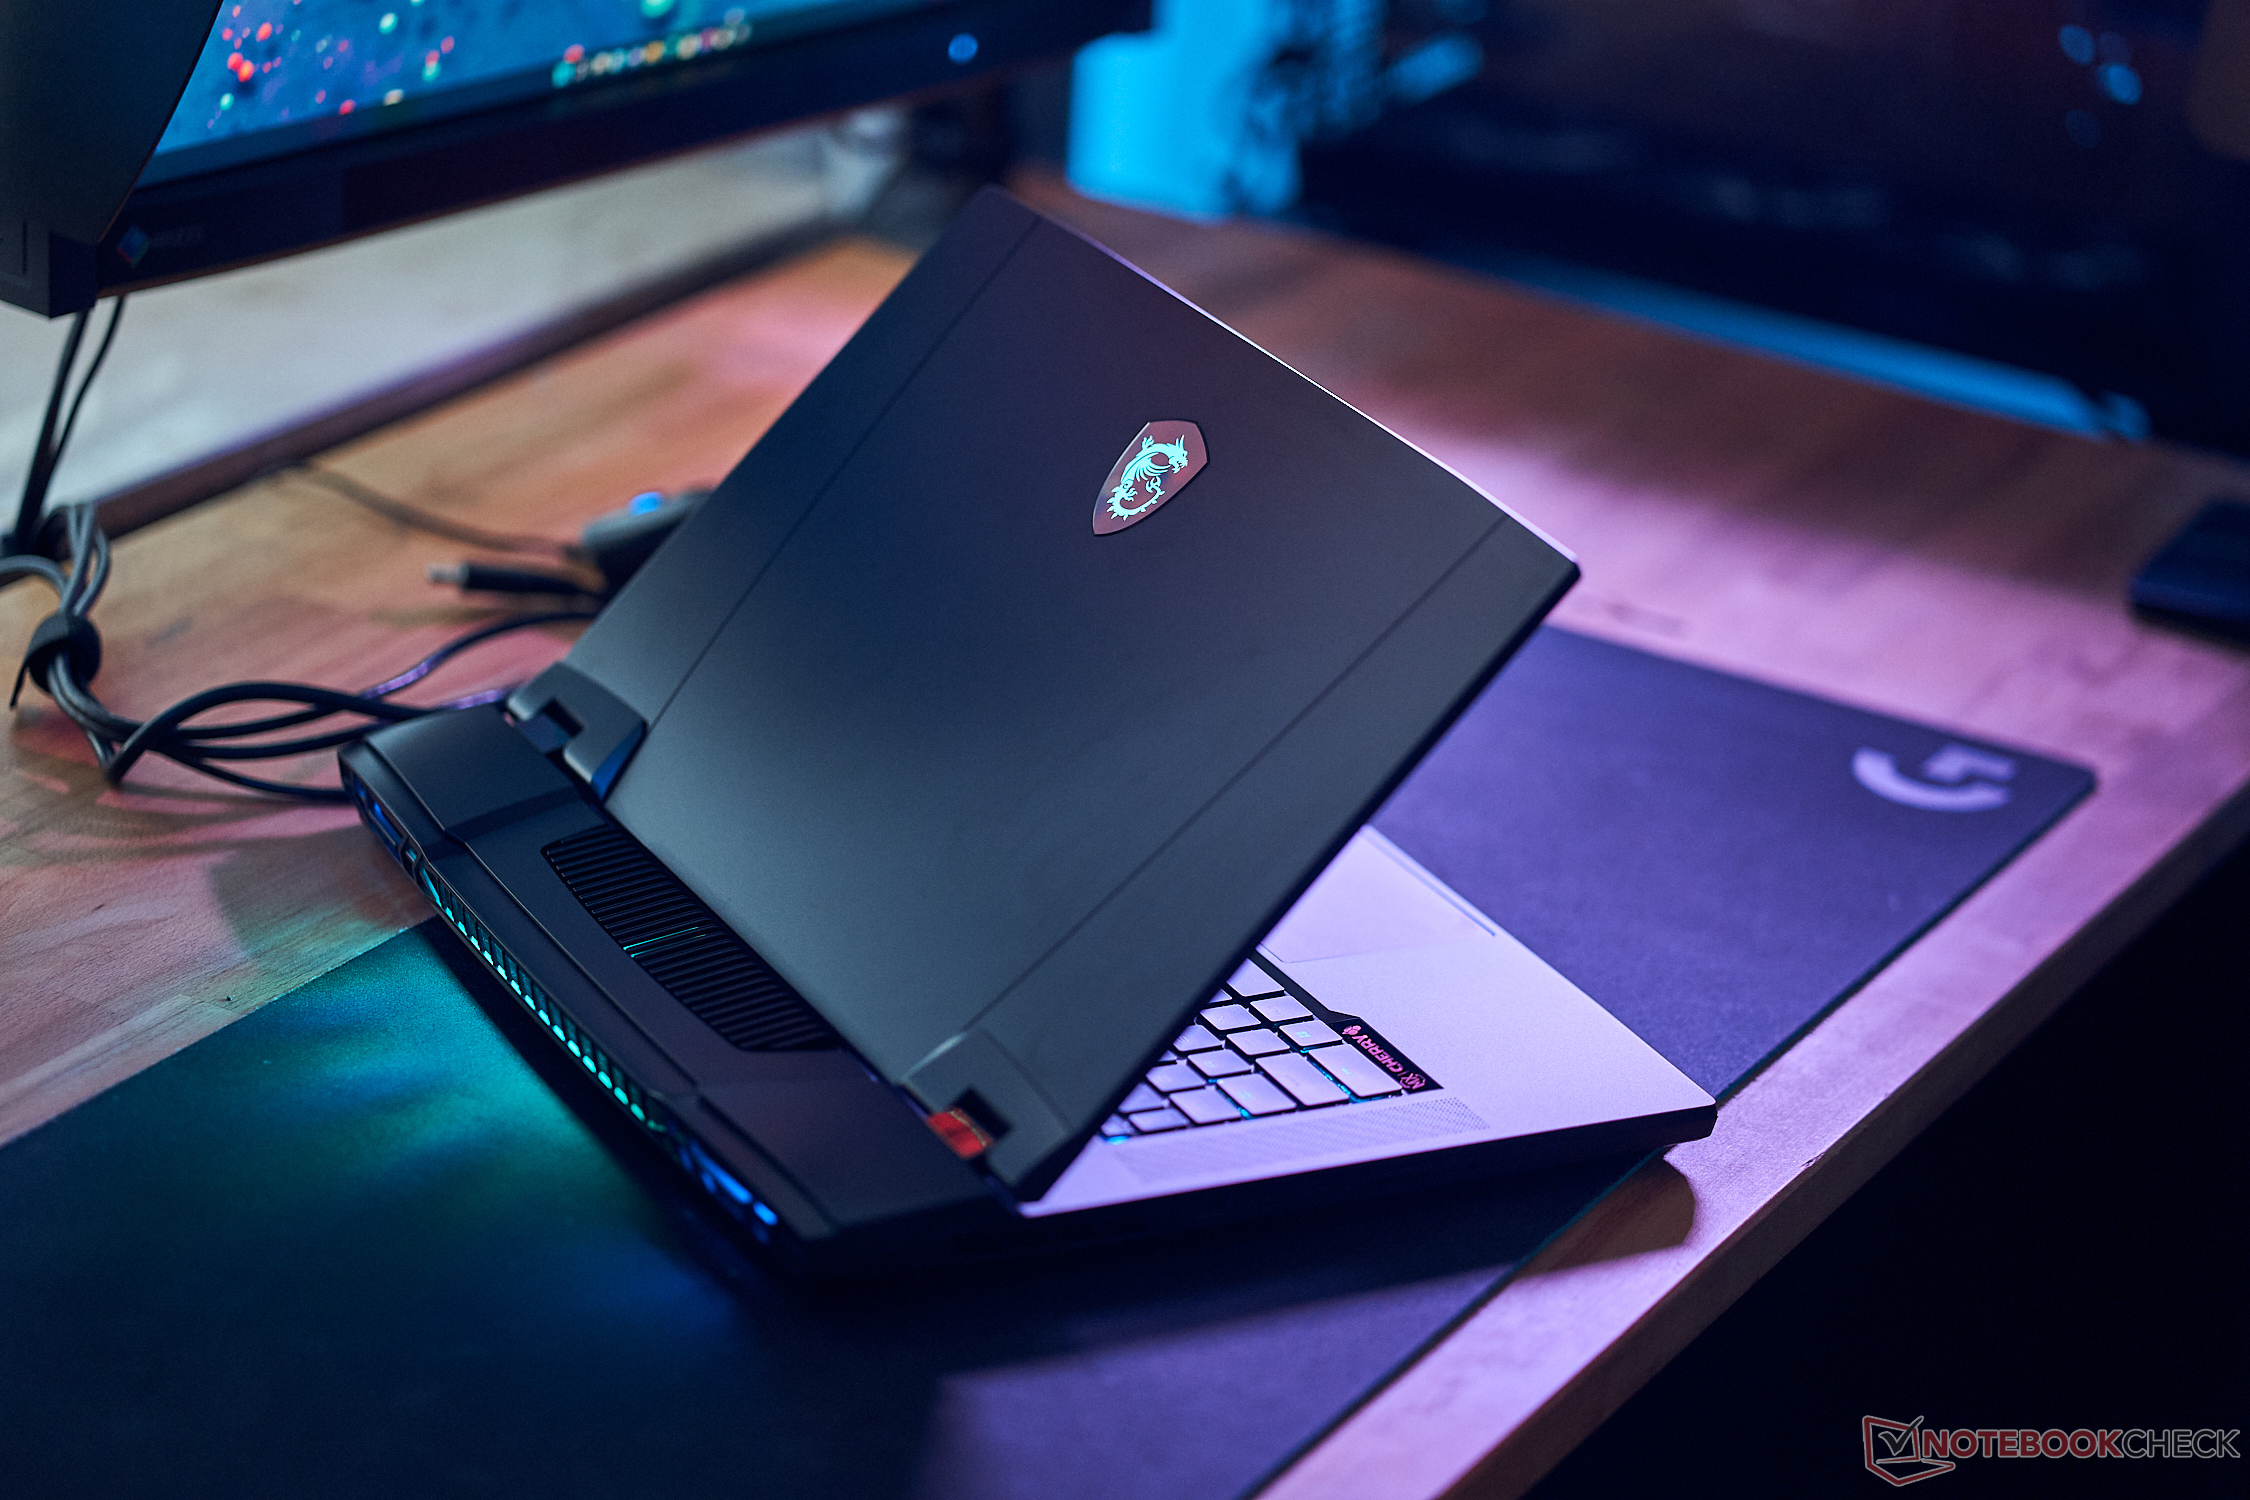
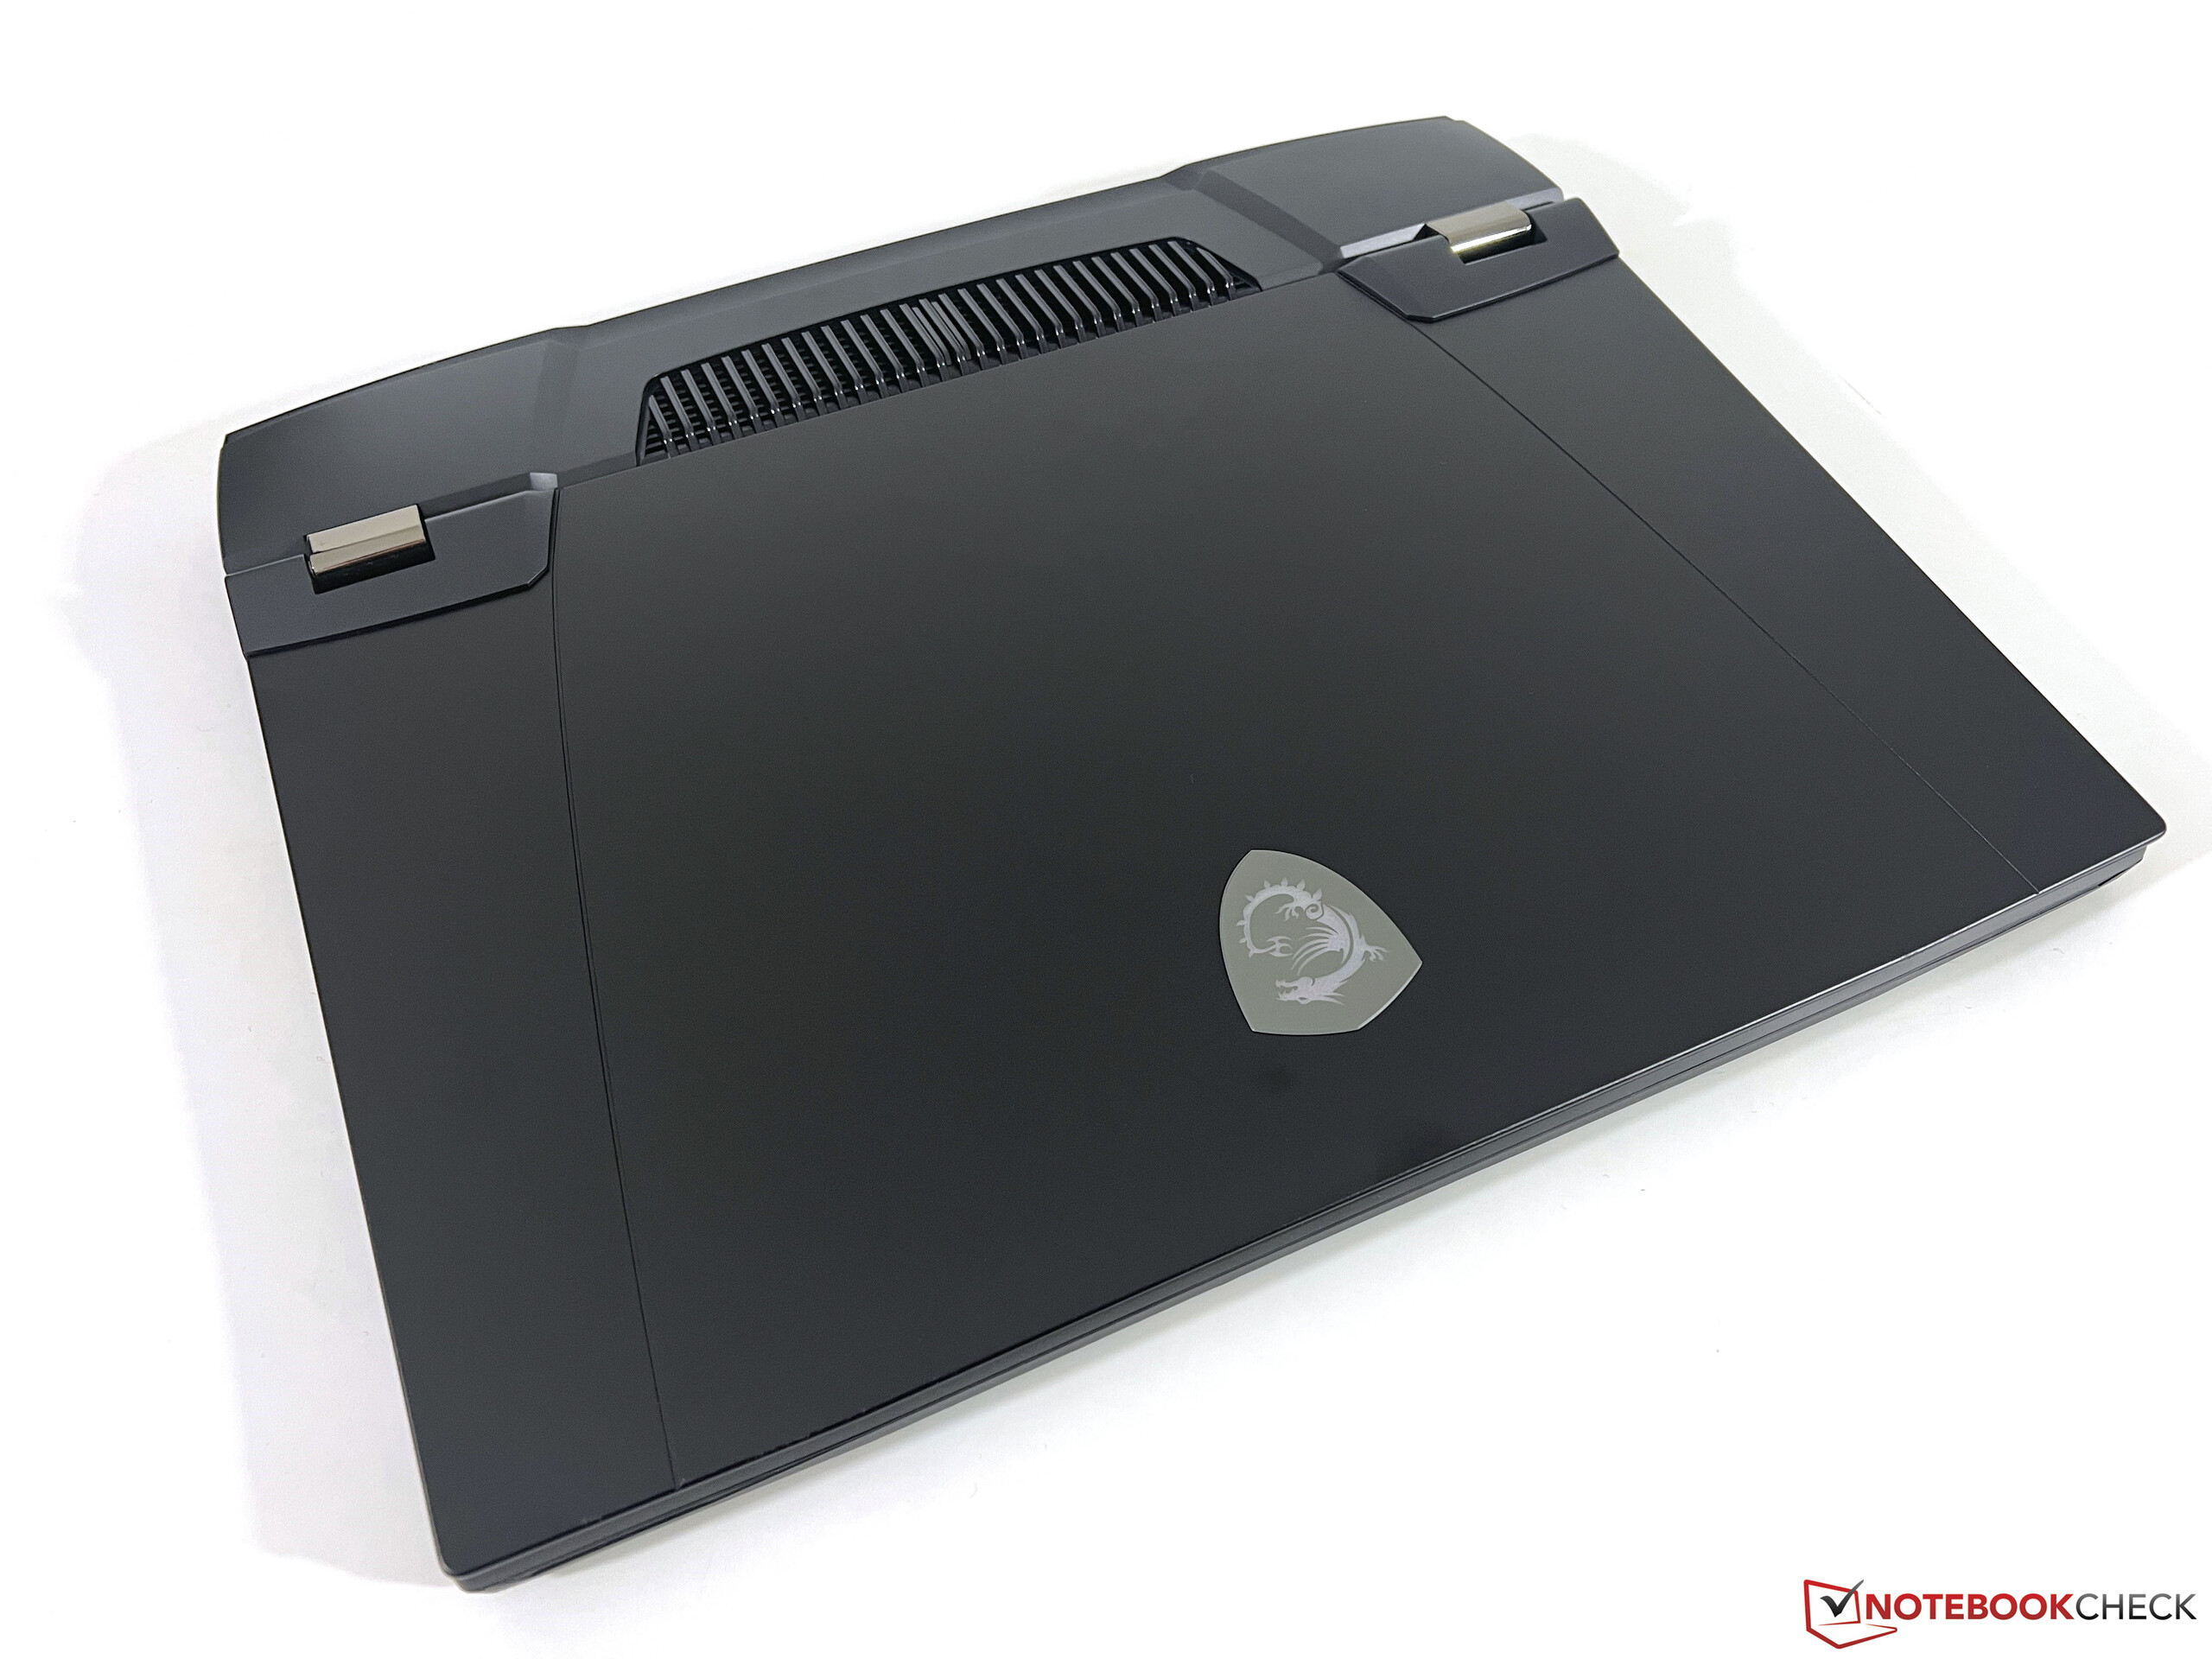
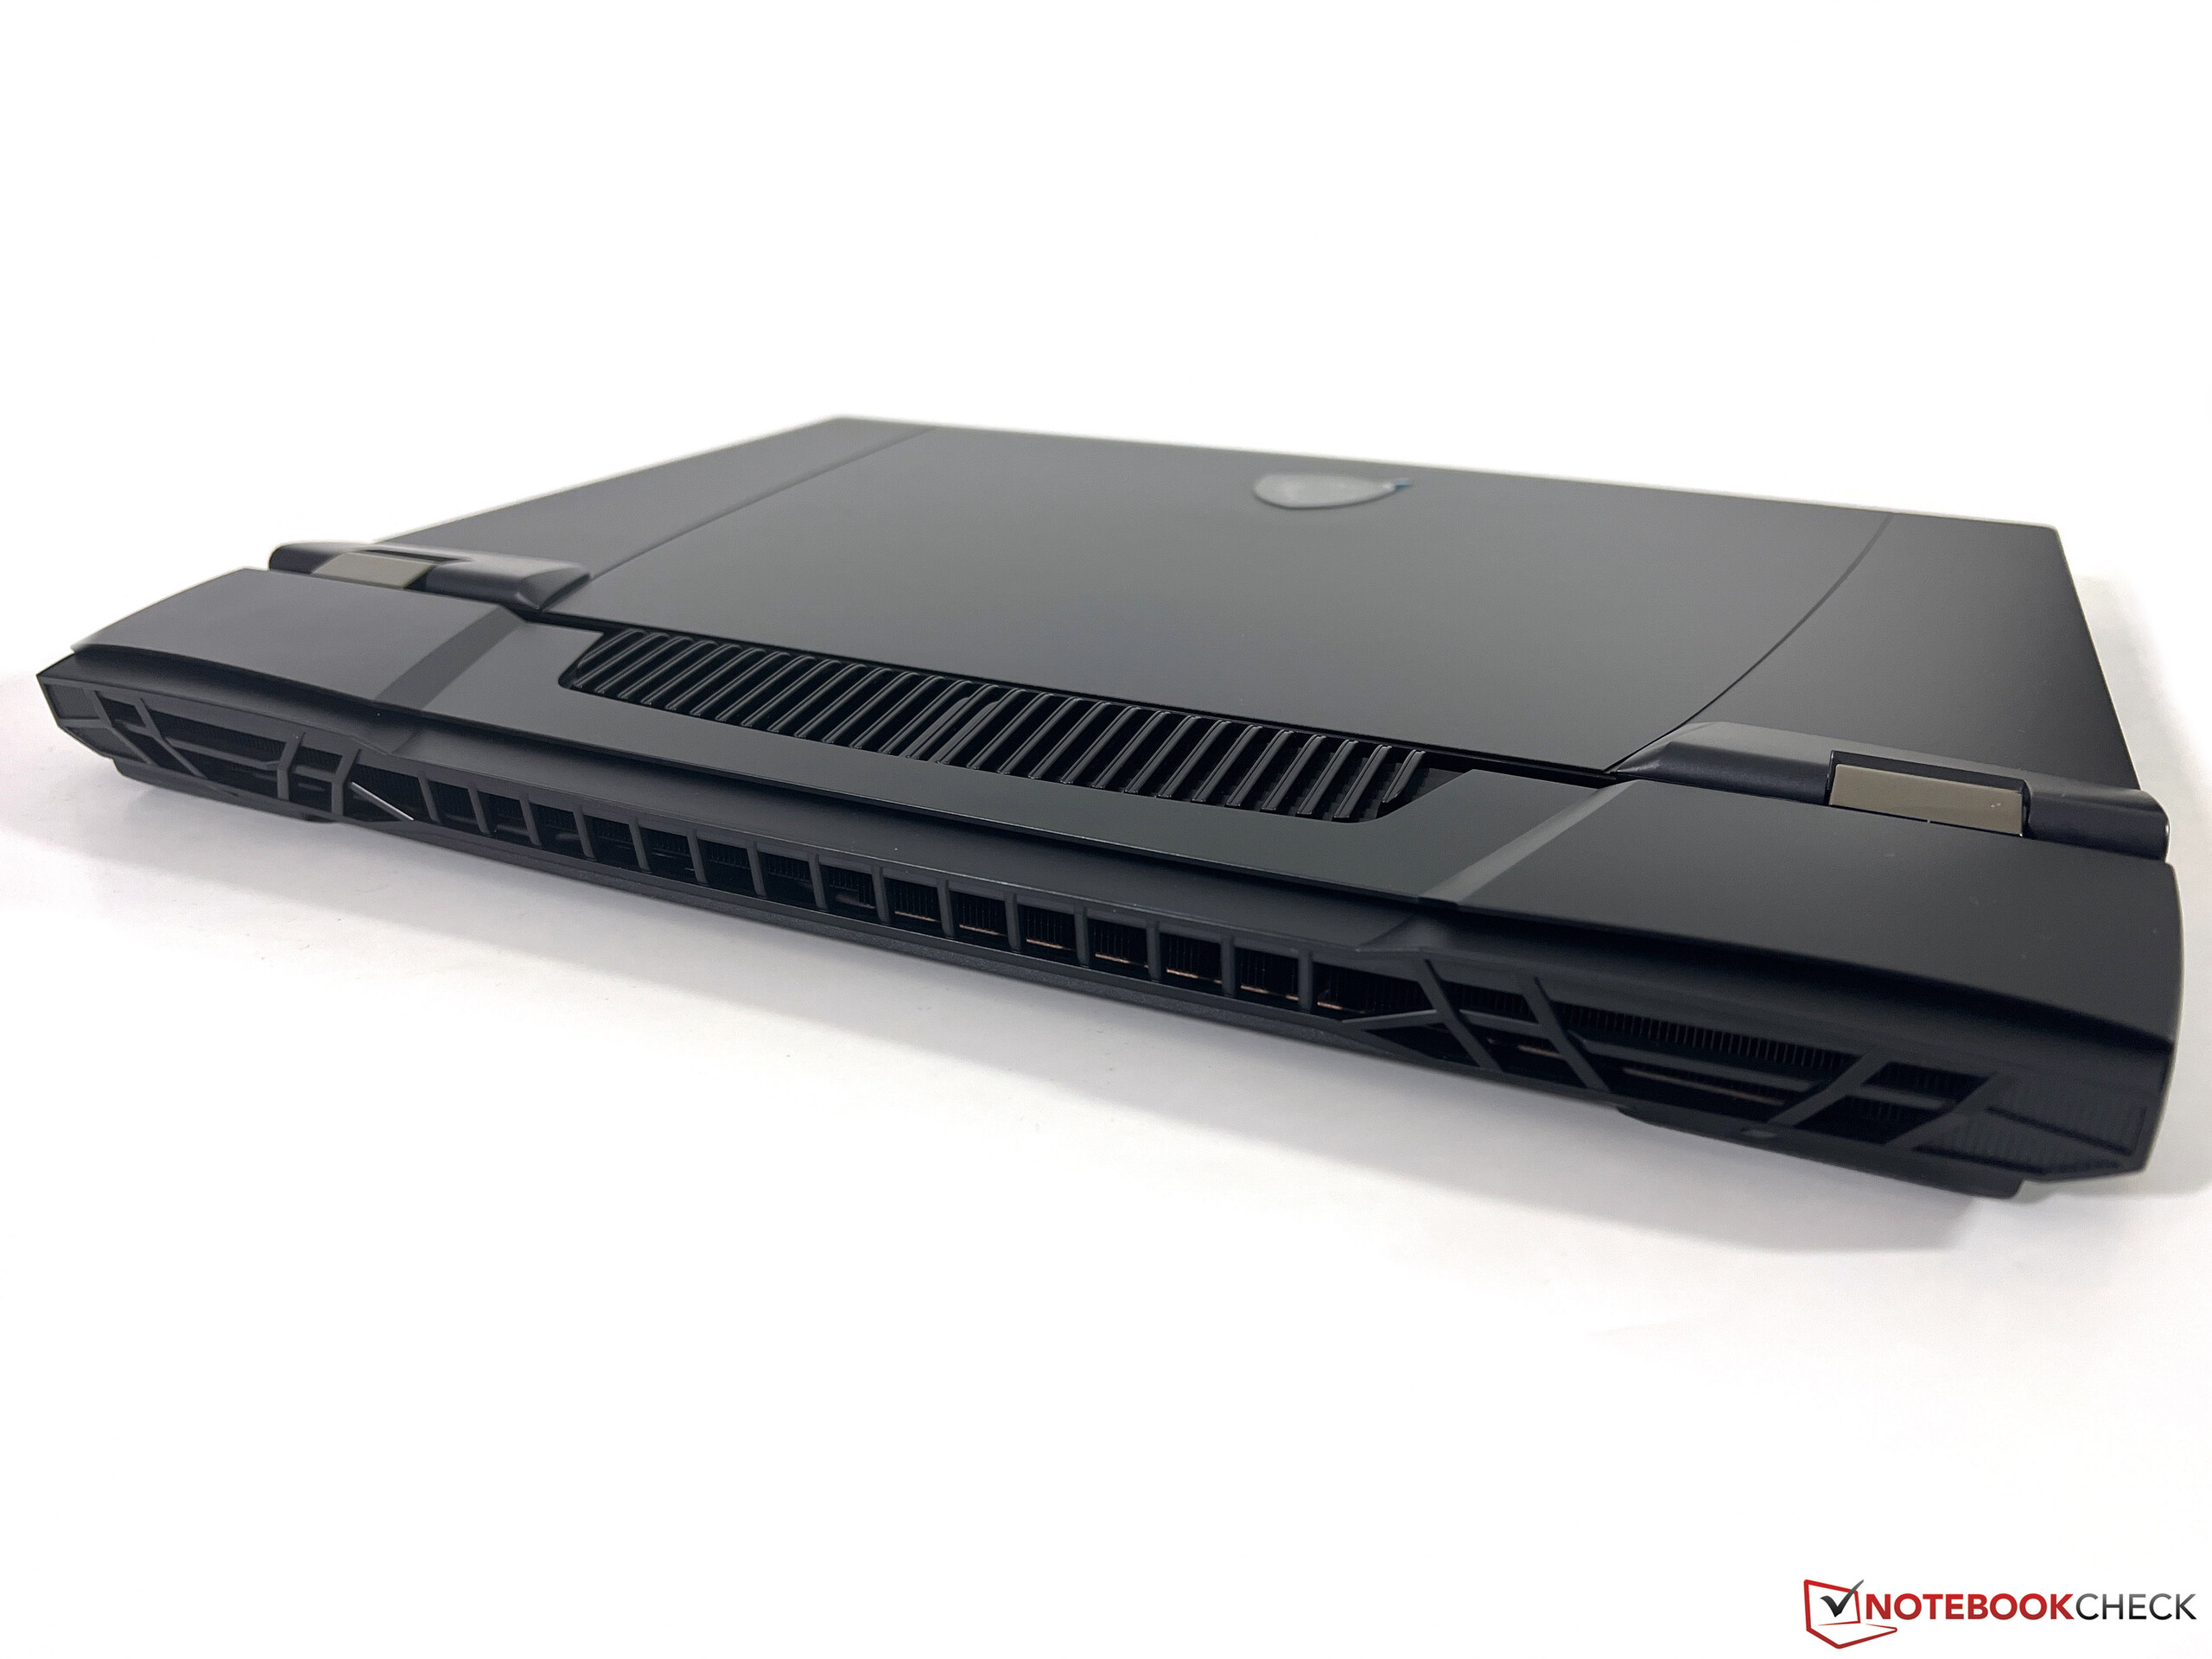
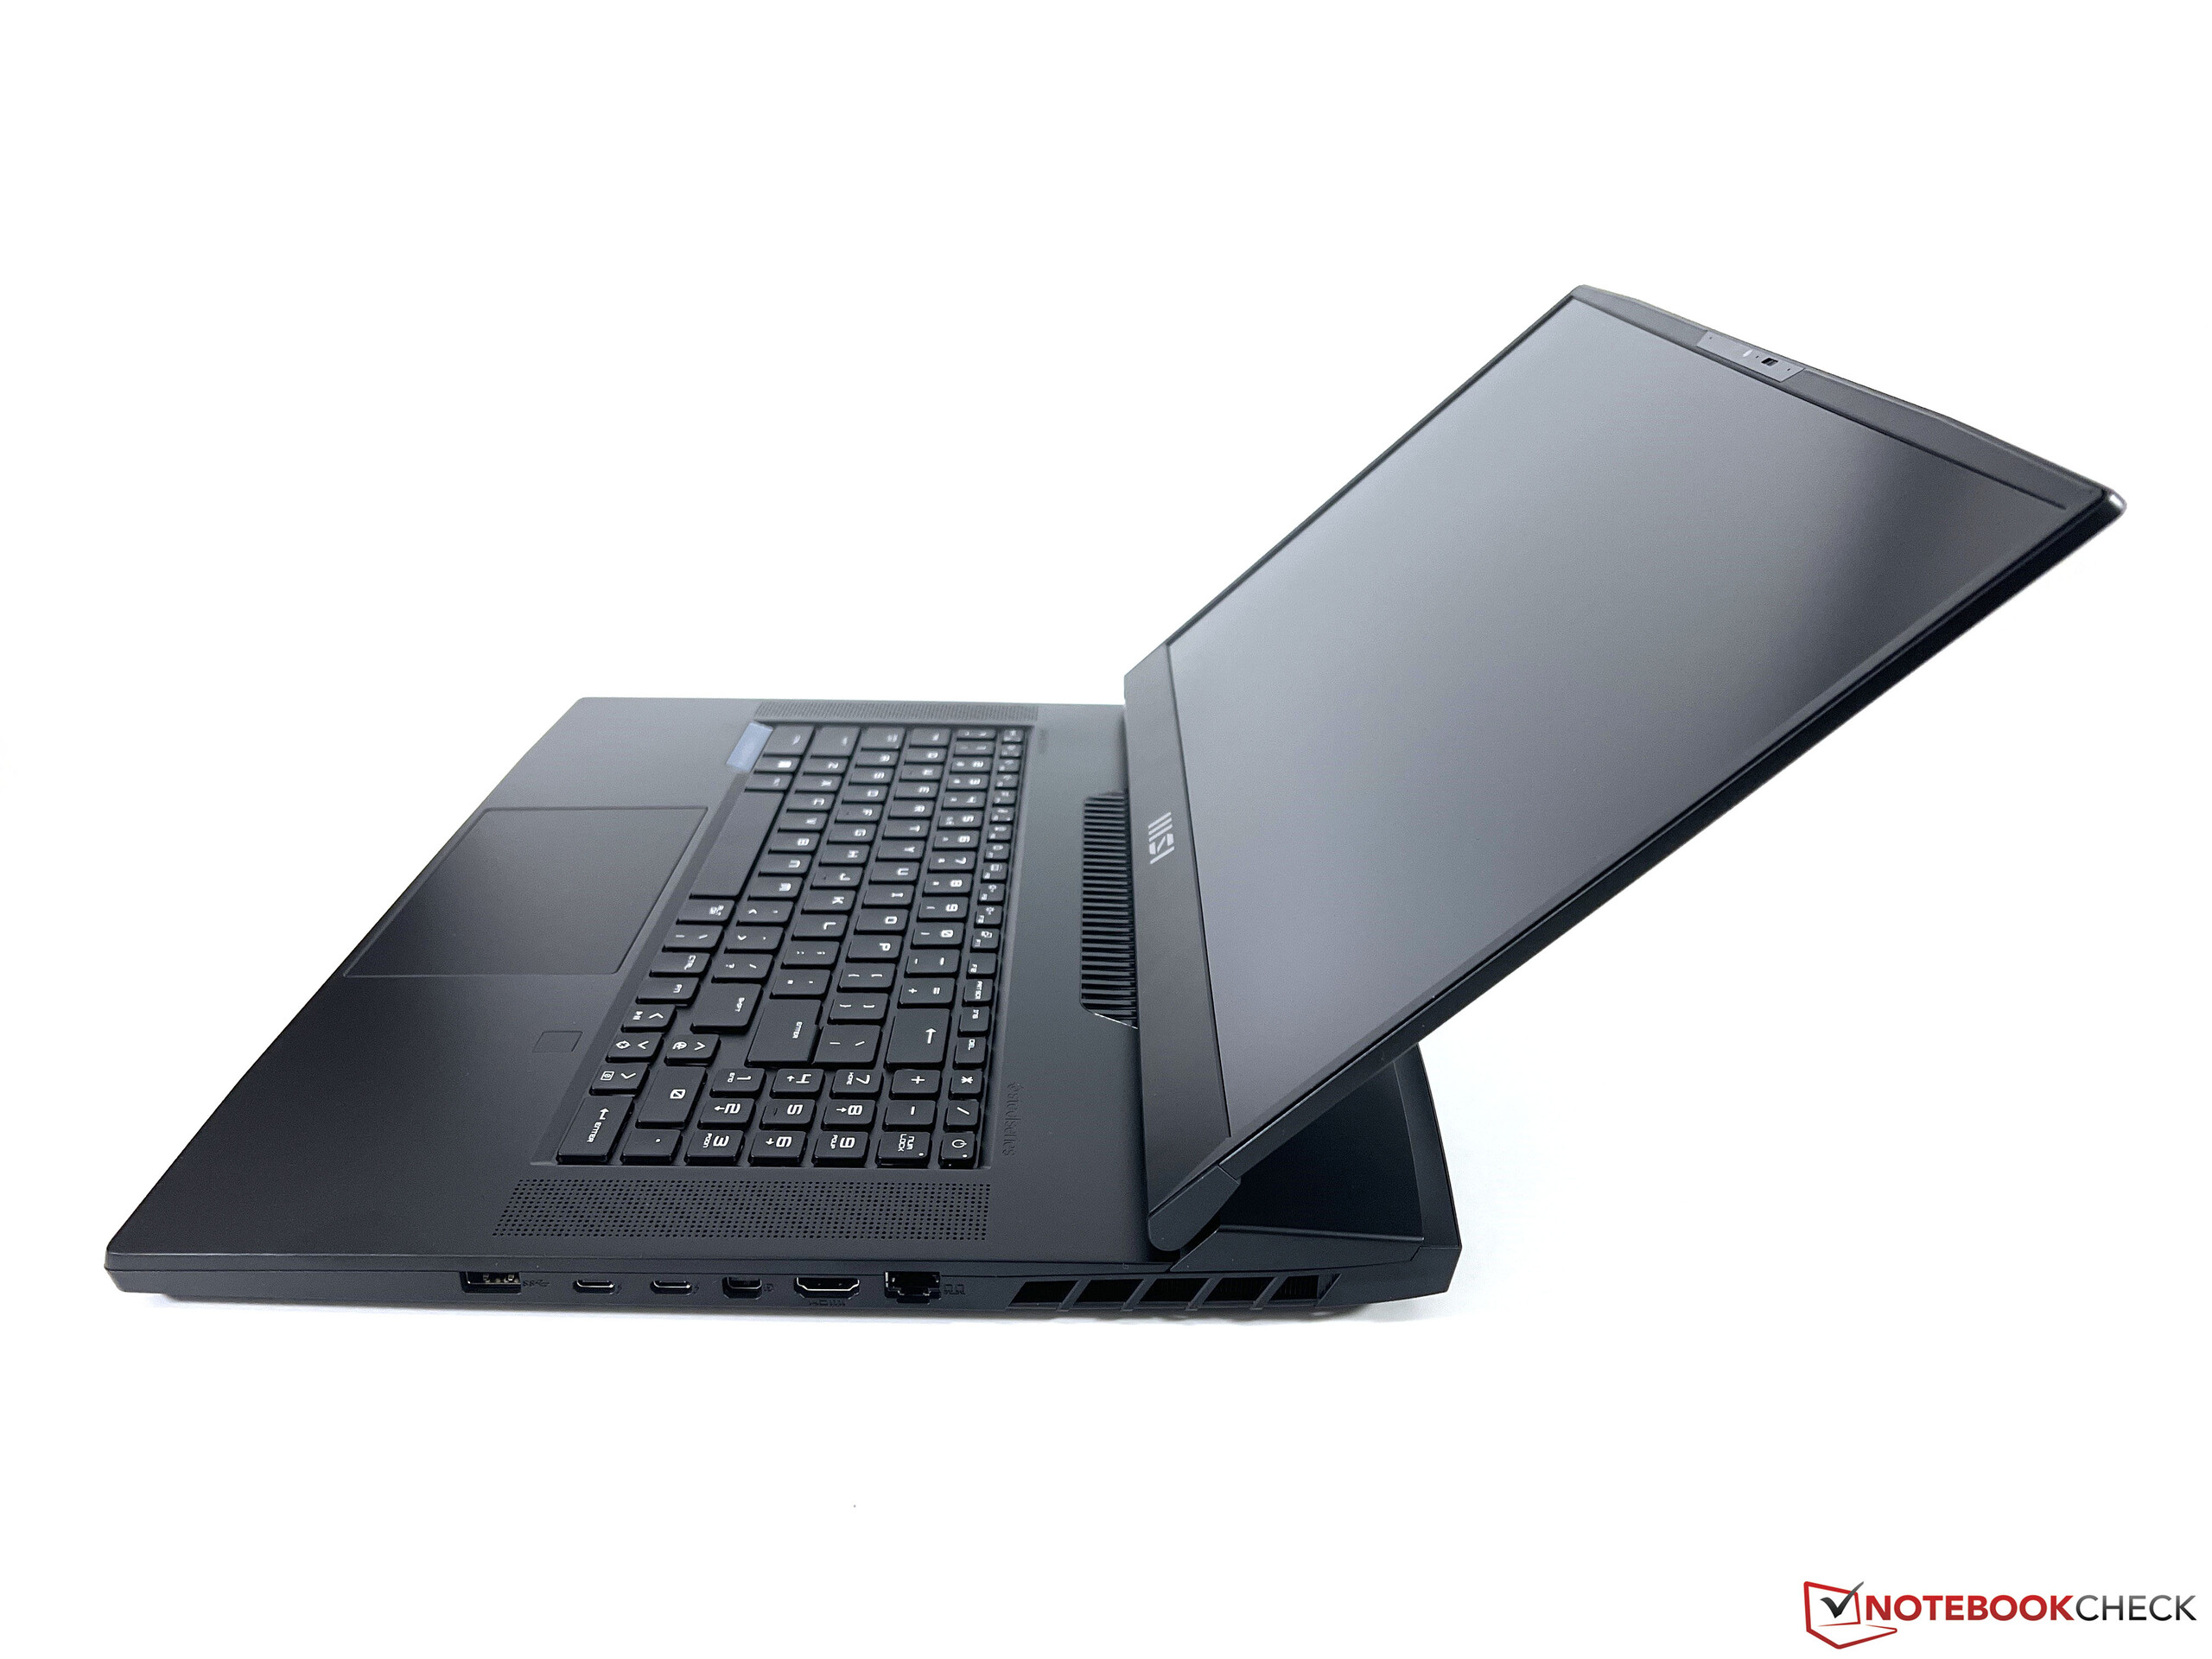
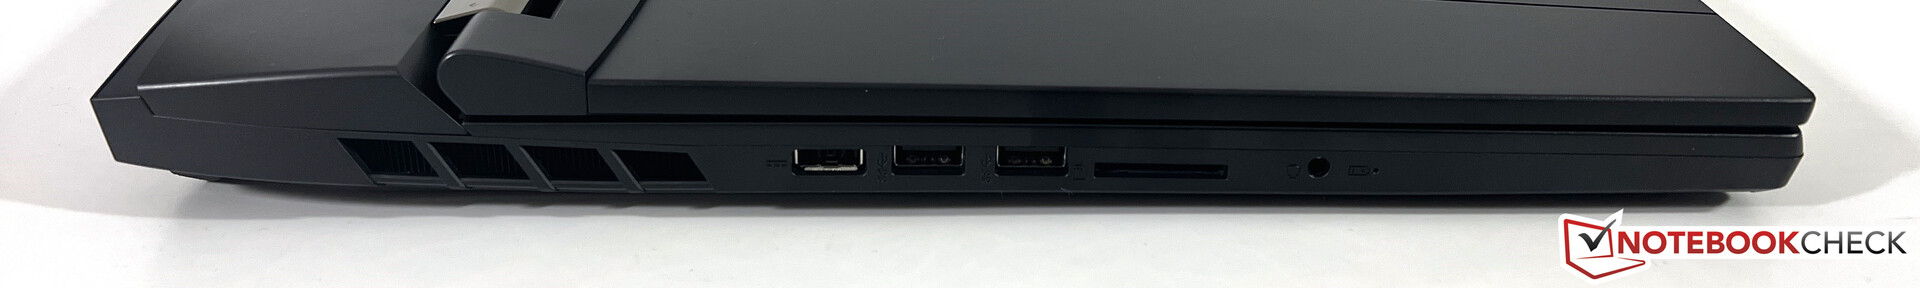
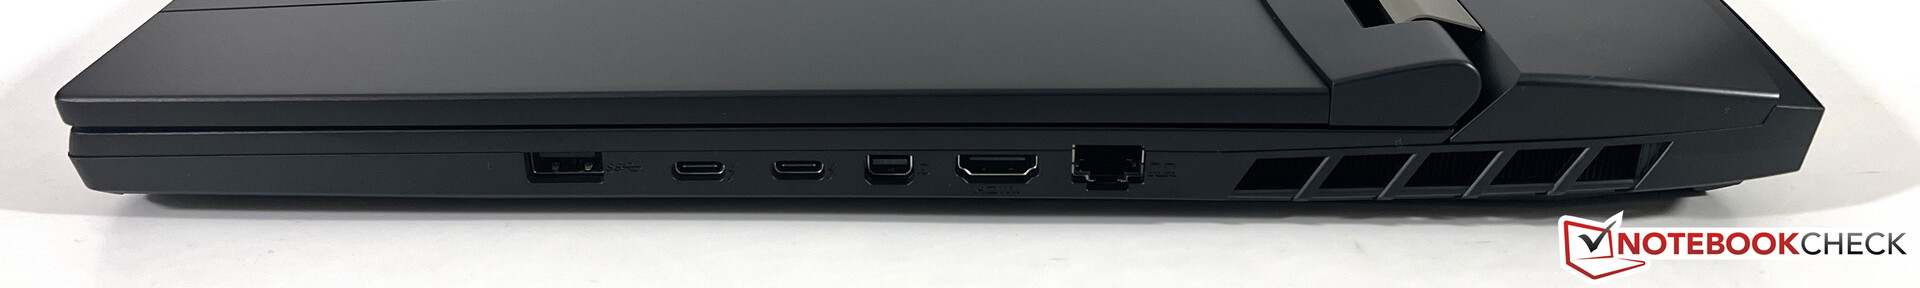
A vázat már ismerjük az elődből, és jó benyomást kelt, de a megvilágítási lehetőségek eléggé korlátozottak (ami preferenciáktól függően lehet jó vagy rossz), és a sima felületeken könnyen meglátszanak az ujjlenyomatok. A mechanikus billentyűzet továbbra is kiváló, és elegendő port van. Az Intel jelenlegi Raptor Lake generációjába tartozó új HX processzor átlagosan körülbelül 22%-kal gyorsabb az elődjénél, de az új GeForce RTX 4090 még ennél is lenyűgözőbb. A hasonló, 175W-os TGP ellenére körülbelül 40-60%-kal gyorsabb, mint a régi RTX 3080 Ti, és felveszi a versenyt az RTX 3090/RTX 3090 Ti asztali változataival. A jelenlegi RTX-40xx asztali GPU-khoz képest az új RTX 4090 Laptop az RTX 4070 Ti és az RTX 4080 között helyezkedik el.
Ennél nagyobb teljesítményt jelenleg egyetlen gamer laptop sem kínál: Az MSI GT77 a Core i9-13950HX processzorral és a GeForce RTX 4090-nel a leggyorsabb hardvert használja, amit laptophoz kapni lehet. A játékok is hihetetlenül jól néznek ki az új 4K Mini-LED panelen.
A hardverkombinációnak nem okoz gondot az új Mini-LED képernyő natív 4K felbontása (144 Hz). A szubjektív képminőség kiváló, a játékok pedig egyszerűen nagyon jól néznek ki. A panelt kalibrálás után képszerkesztésre is lehet használni, ami az előre telepített True Color szoftverrel lehetséges. A kijelző a HDR-t is támogatja, több mint 1000 nites fényerővel, de Windows rendszerben a HDR még mindig borzalmas a macOS-hez képest, ahol egyszerűen zökkenőmentesen működik.
Figyelembe véve az erős hardvert, a feltűnésmentes ház dizájnt, a jó kijelzőt és a kiváló billentyűzetet, a Titan GT77 mobil munkaállomásként is nagyon jól működik, és még az RTX A5500 is alulmarad bizonyos professzionális alkalmazásokban.
A hűtés nagyon hatékony a négy ventilátorral és a rengeteg hőcsővel, és terhelés alatt is alig mérhetünk 40 °C feletti felületi hőmérsékletet, cserébe viszont a ventilátorok rendkívül zajosak. Játék közben 54-57 dB(A) erejű zajra kell számítani, és 60 dB(A) felettire is, ha csak a CPU-t terheljük. A ventilátorok zaja nagyon egyenletes, de mi mégis fejhallgatót javasolnánk (lehetőleg aktív zajszűréssel). Lehetőség van a Csendes üzemmód használatára is, amivel a ventilátor zaját 40 dB(A)-ra csökkenthetjük. A teljesítmény ugyan visszaesik, de a legtöbb játéknál még így is több mint elegendő lesz.
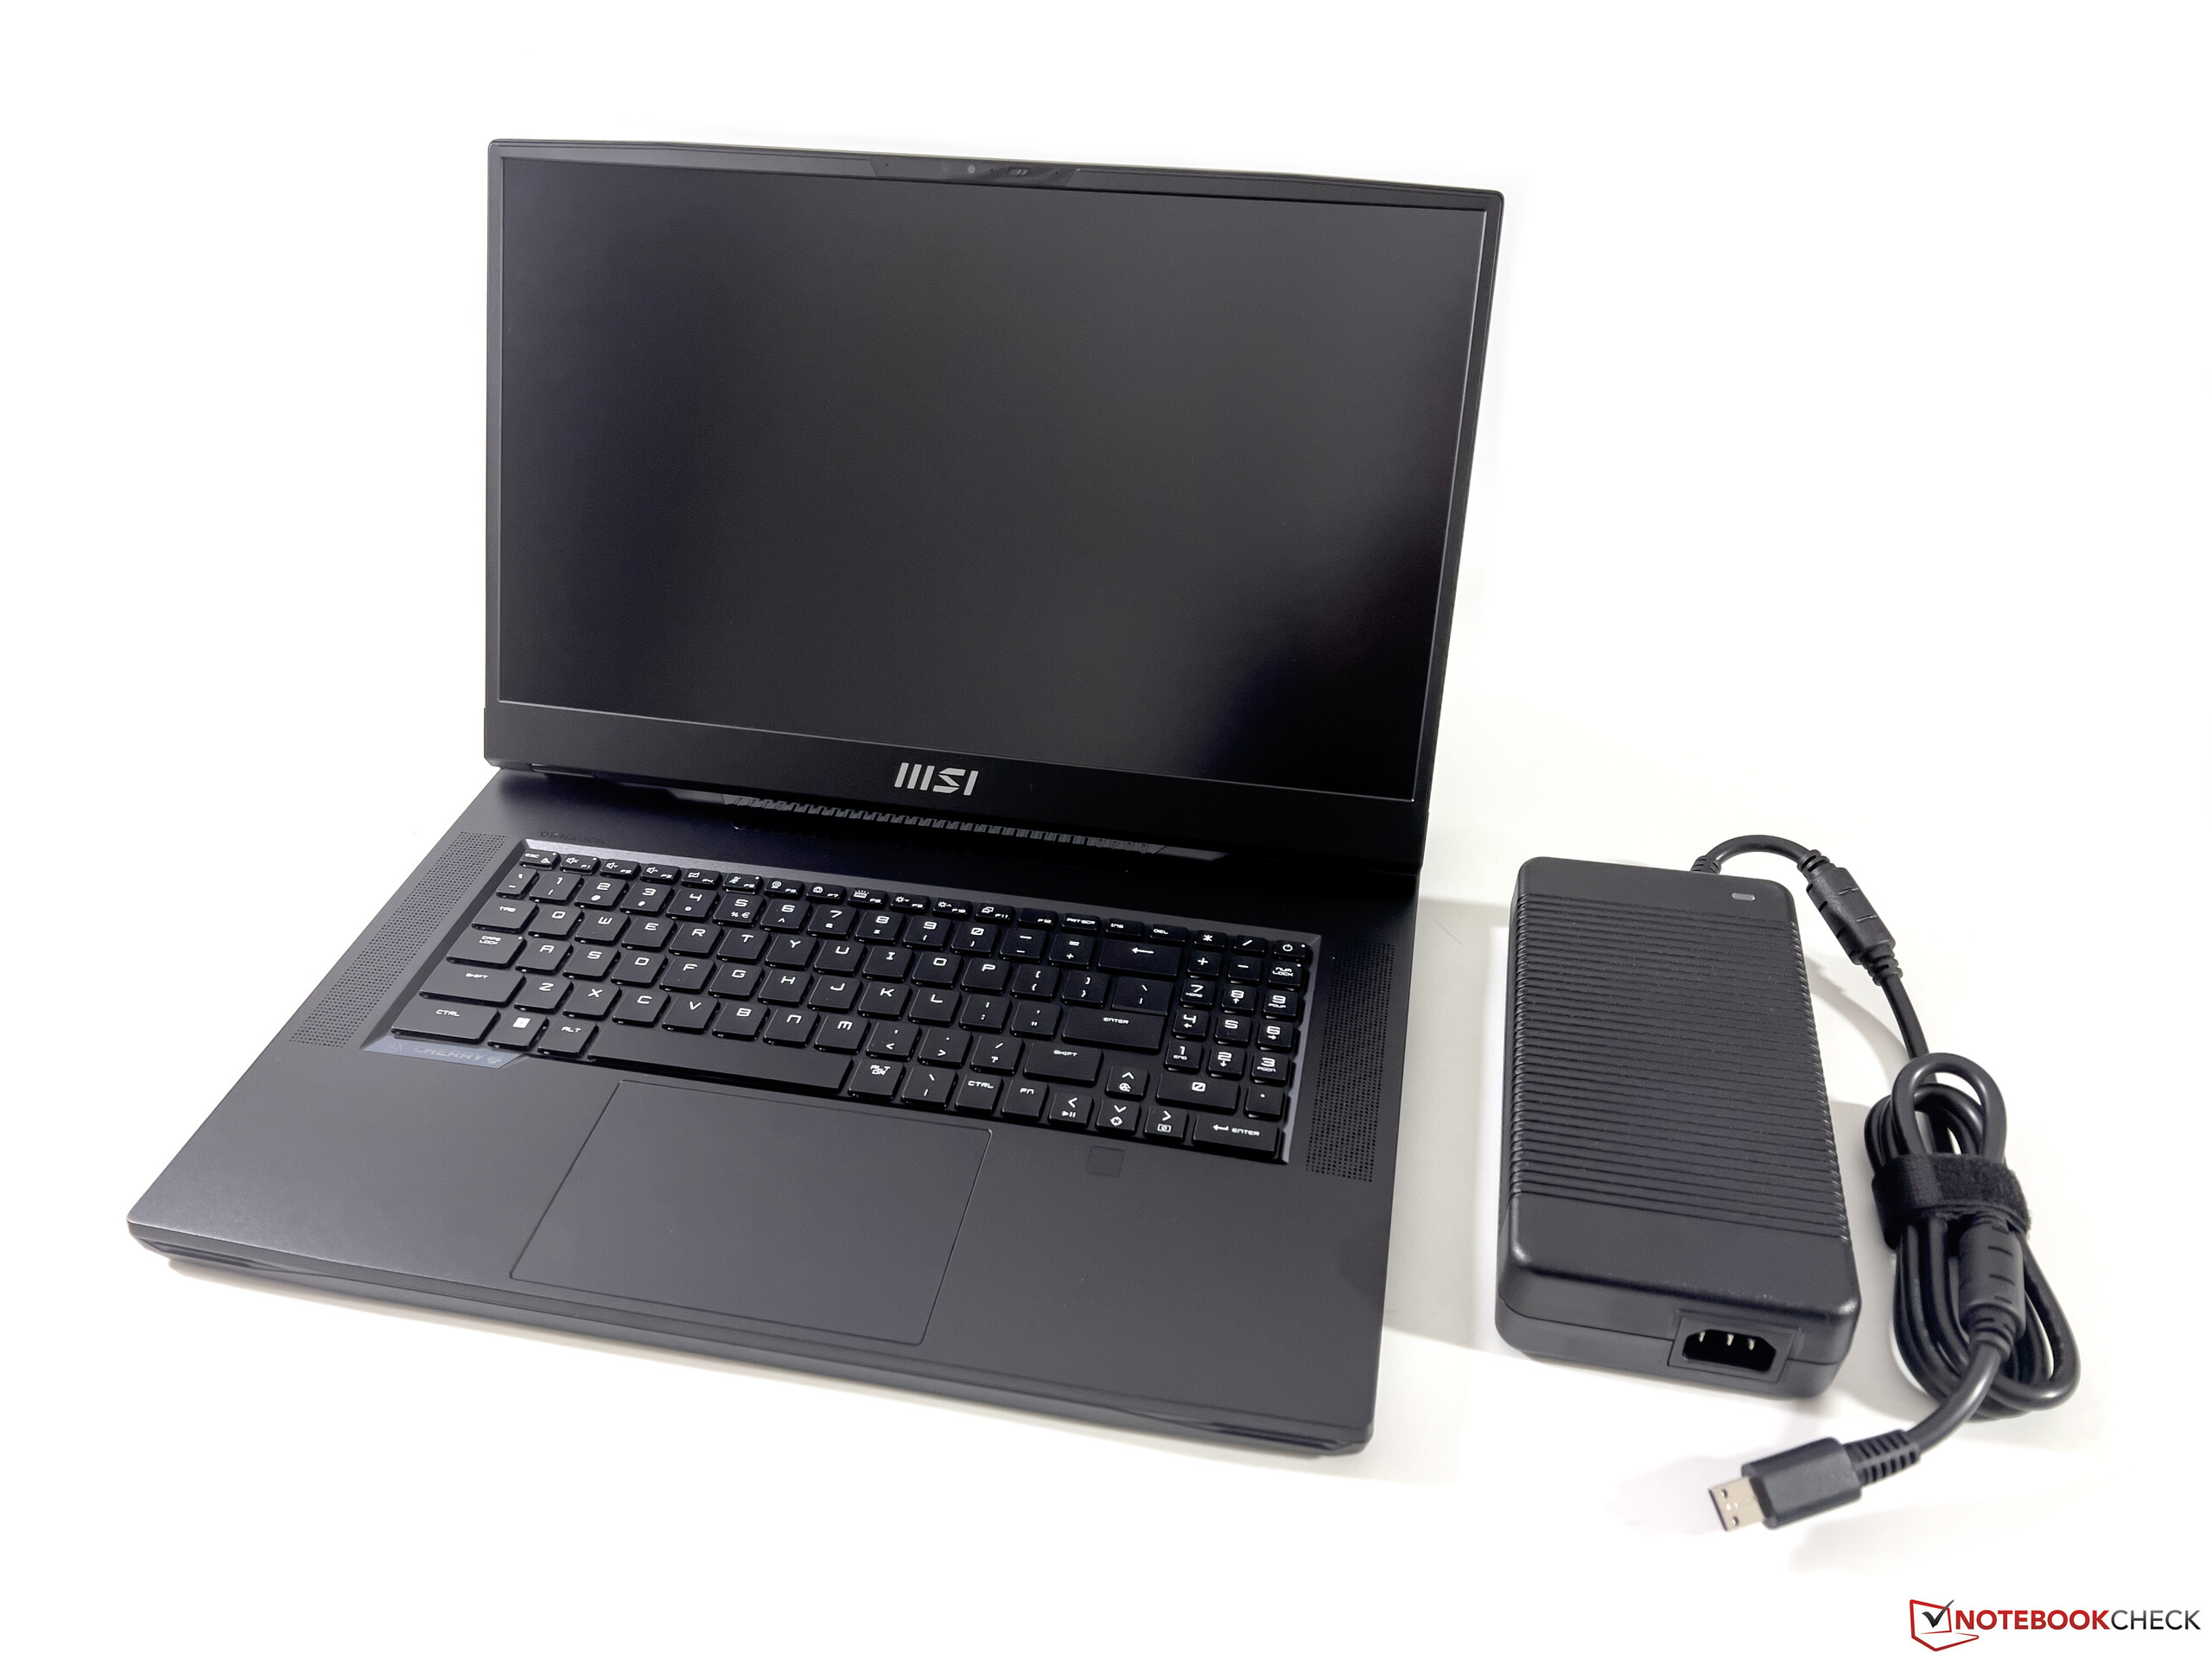
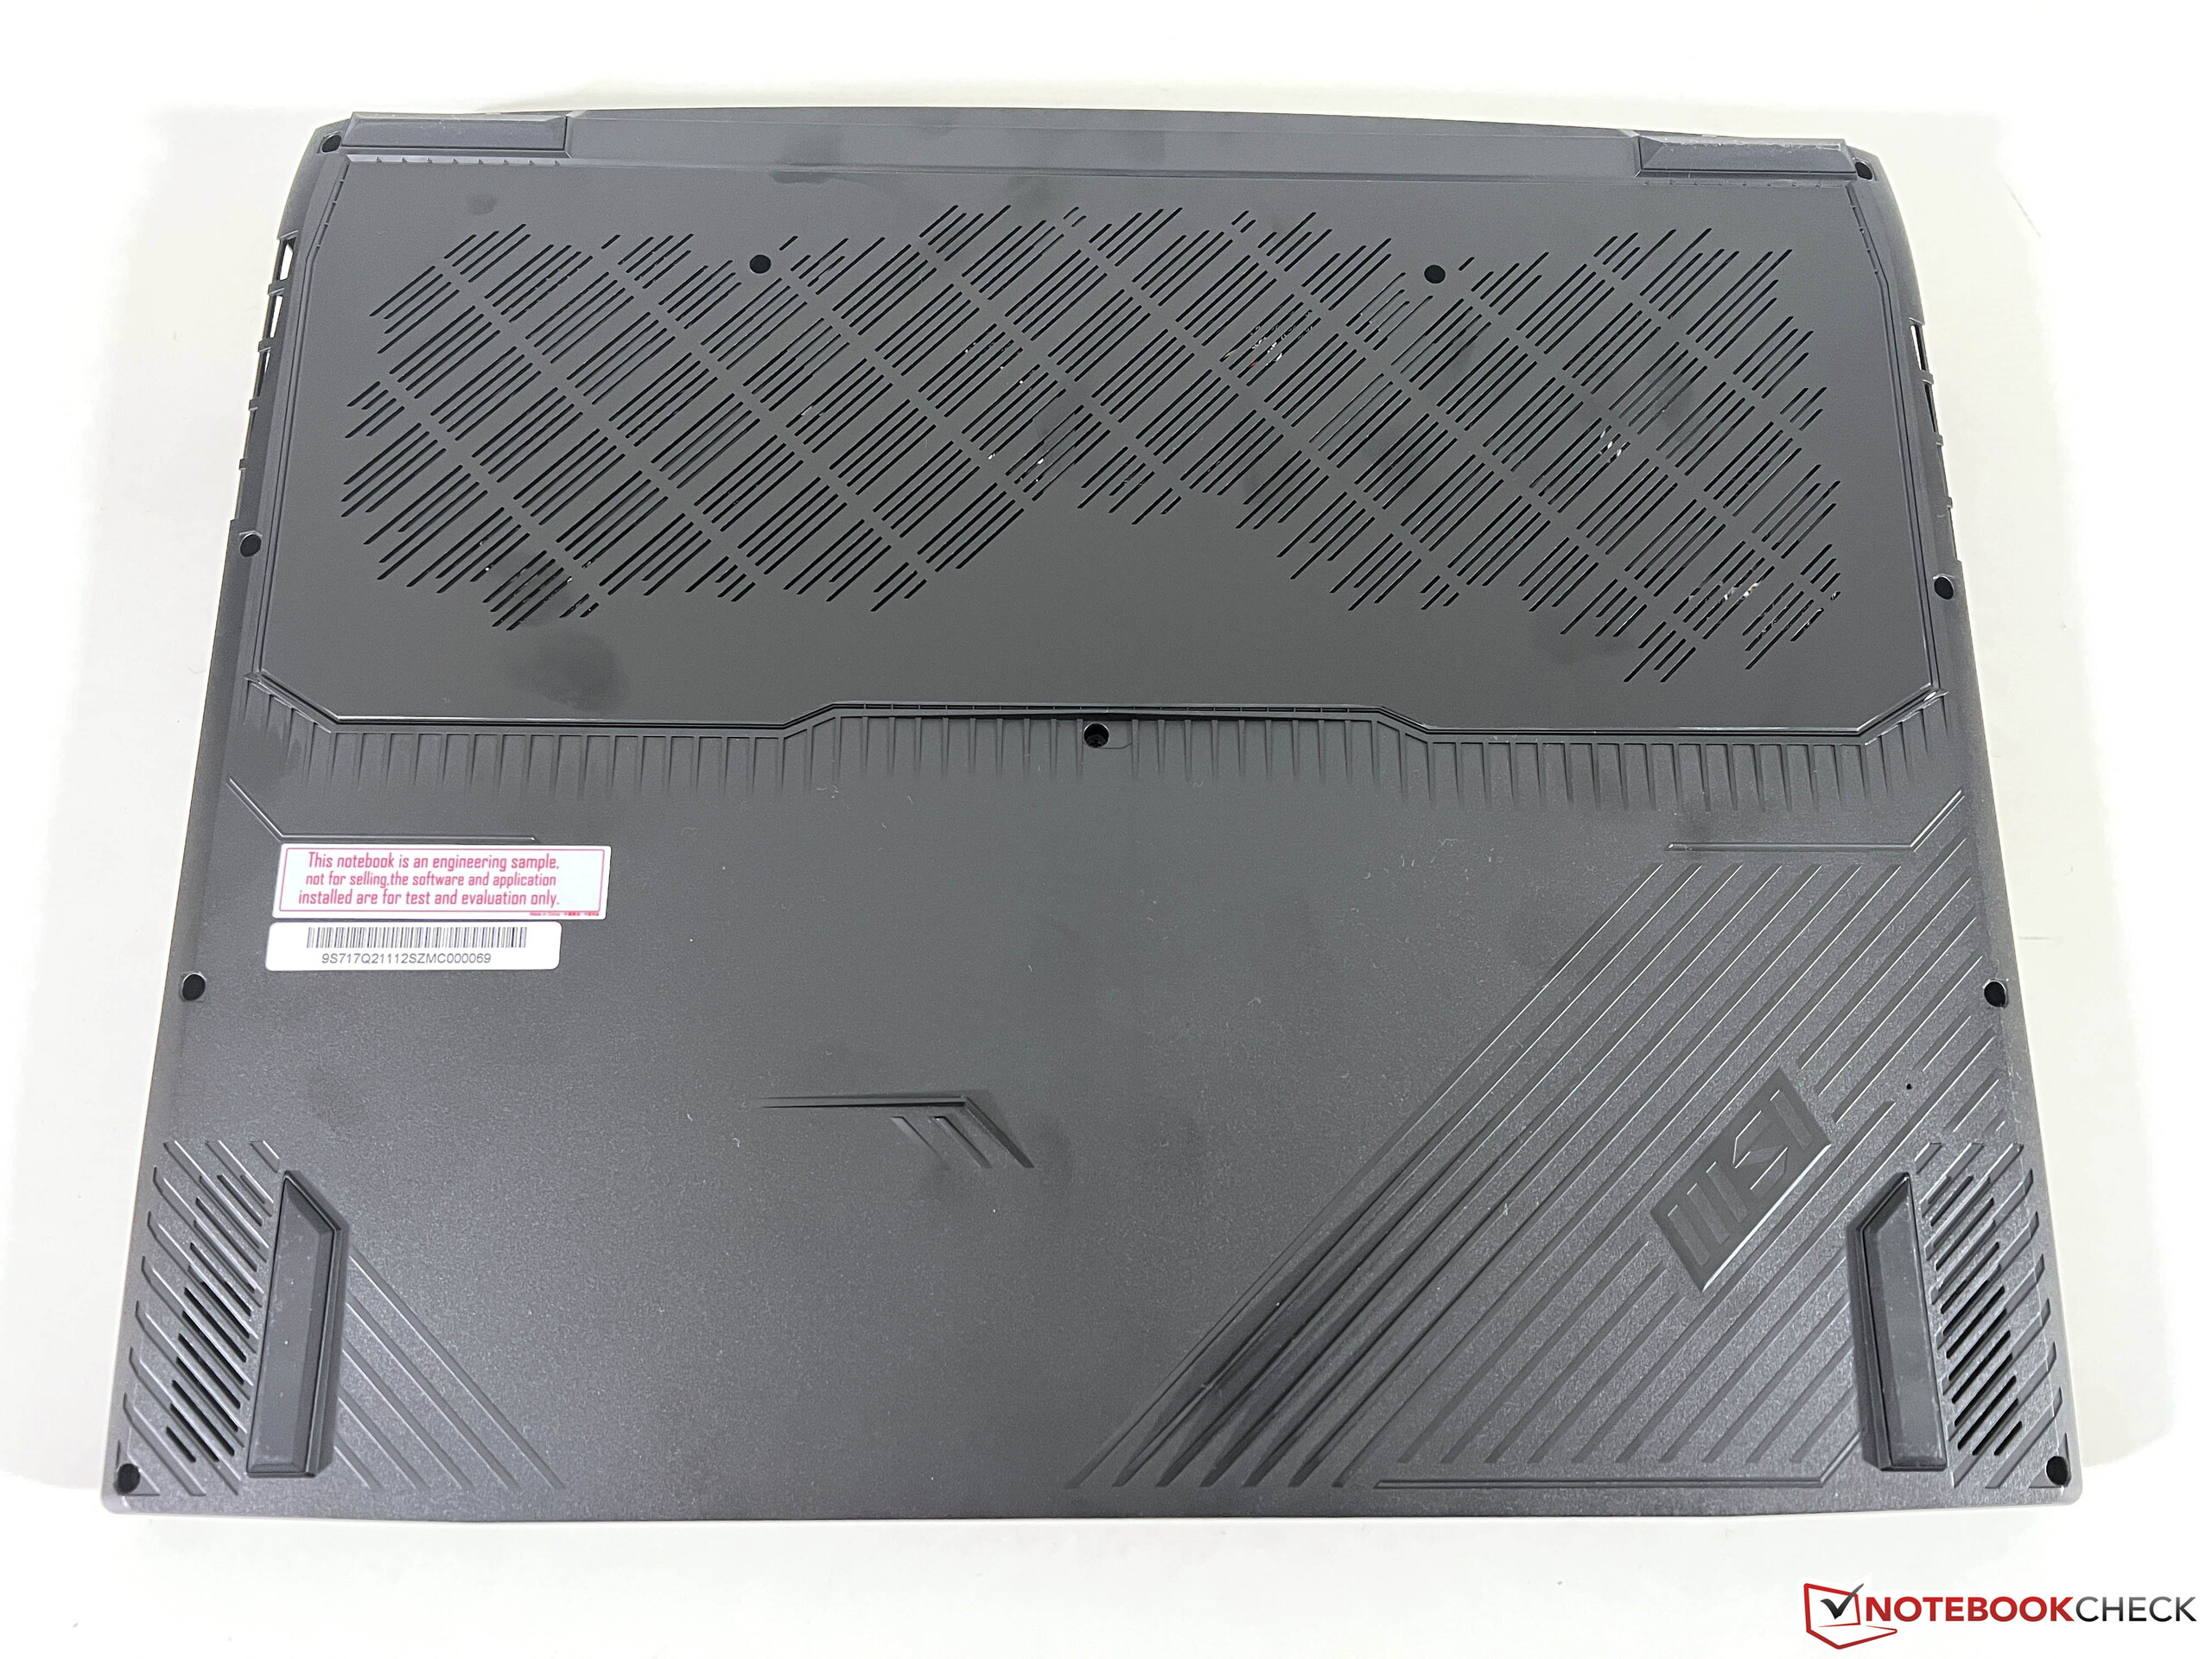
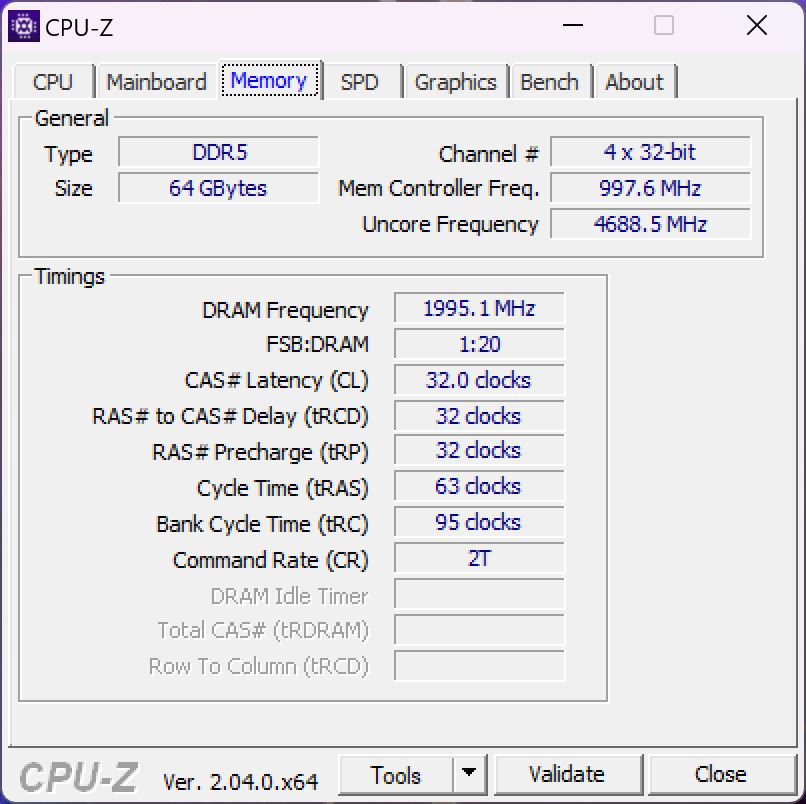
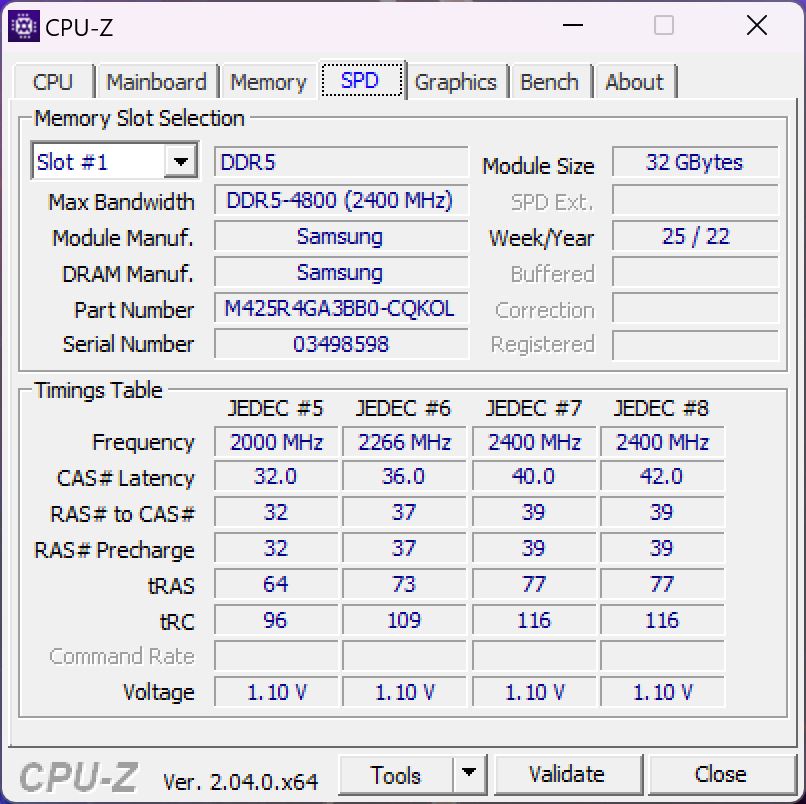
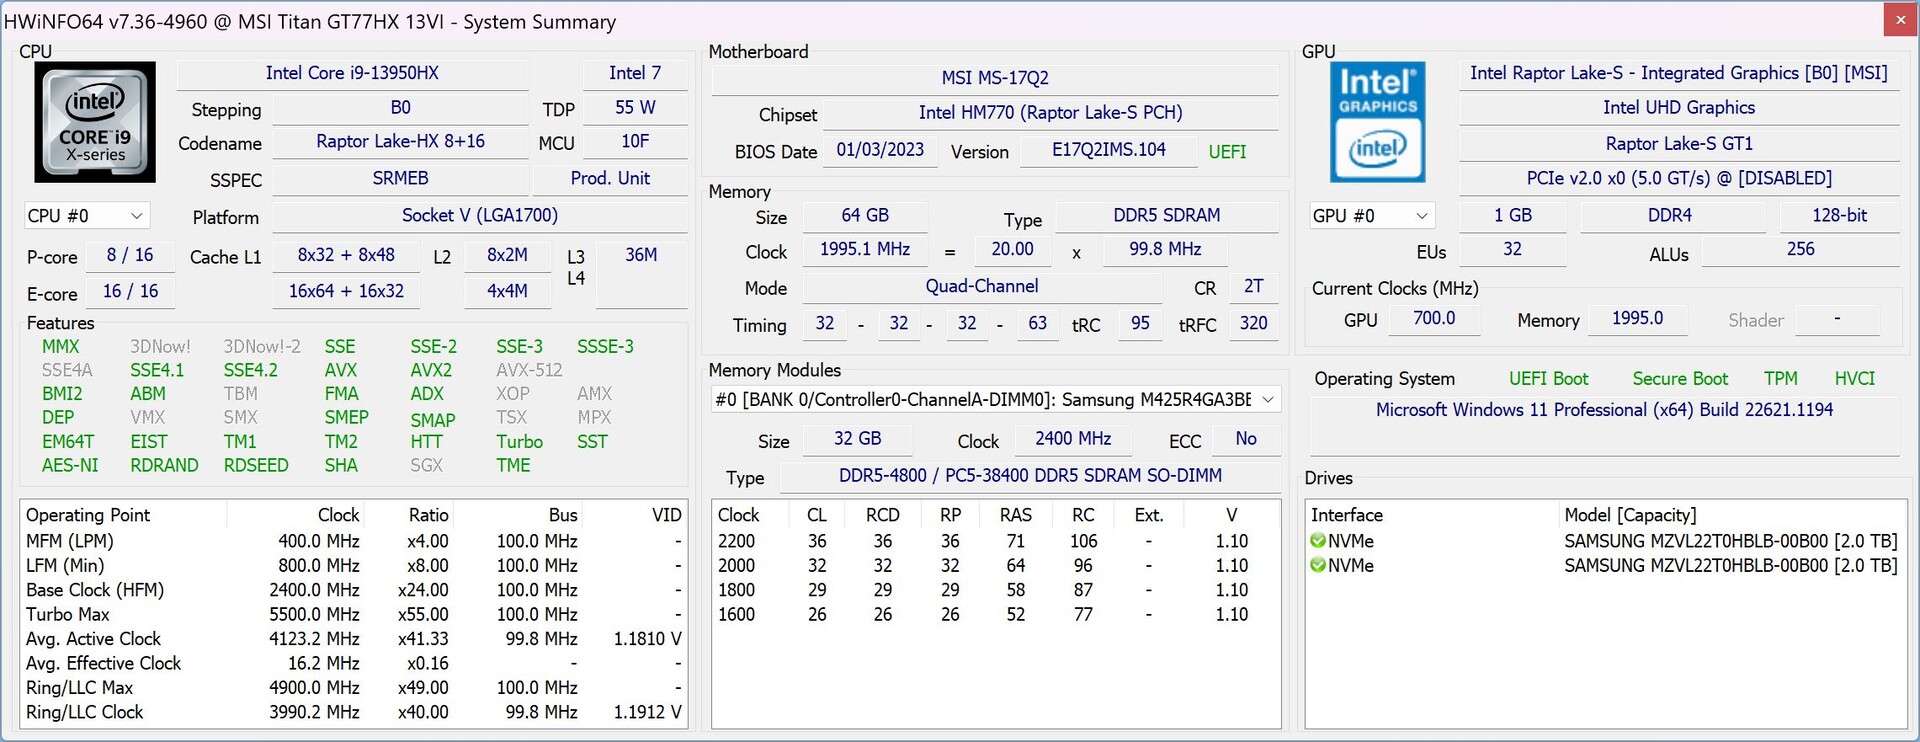
Az MSI Titan GT77-nek van néhány hátránya is, különösen a nagy árat figyelembe véve. Ezek közé tartozik az olcsó műanyag használata (különösen az alsó rész borítása), a lassú DDR5-4800-as RAM és a gyenge 720p-s webkamera. A két 2 TB-os SSD teljesítménye RAID 0 konfigurációban nagyon magas, viszont nem stabil. A GT77 az első 17 hüvelykes gamer laptop az új hardverrel a tesztünkben, és már alig várjuk, hogy a következő hetekben teszteljük a konkurenciát.
Ár és Elérhetőség
Az új MSI Titan GT77 HX 13 VI 5299 dollárért kapható az MSI áruházában.
MSI Titan GT77 HX 13VI
- 02/07/2023 v7 (old)
Andreas Osthoff
Átláthatóság
A felülvizsgálandó készülékek kiválasztását szerkesztőségünk végzi. A tesztmintát a gyártó vagy a kiskereskedő kölcsönként bocsátotta a szerző rendelkezésére a felülvizsgálat céljából. A hitelezőnek nem volt befolyása erre a felülvizsgálatra, és a gyártó sem kapott másolatot erről a felülvizsgálatról a közzététel előtt. Nem volt kötelesség ezt az ismertetőt közzétenni. Független médiavállalatként a Notebookcheck nincs alávetve a gyártók, kiskereskedők vagy kiadók felhatalmazásának.
Így tesztel a Notebookcheck
A Notebookcheck minden évben független, laptopok és okostelefonok százait vizsgálja meg szabványosított eljárások alkalmazásával annak érdekében, hogy minden eredmény összehasonlítható legyen. Körülbelül 20 éve folyamatosan fejlesztjük vizsgálati módszereinket, és ennek során iparági szabványokat állítottunk fel. Tesztlaboratóriumainkban kiváló minőségű mérőberendezéseket használnak tapasztalt technikusok és szerkesztők. Ezek a tesztek többlépcsős validációs folyamatot foglalnak magukban. Komplex minősítési rendszerünk több száz megalapozott mérésen és benchmarkon alapul, ami megőrzi az objektivitást.Price comparison

