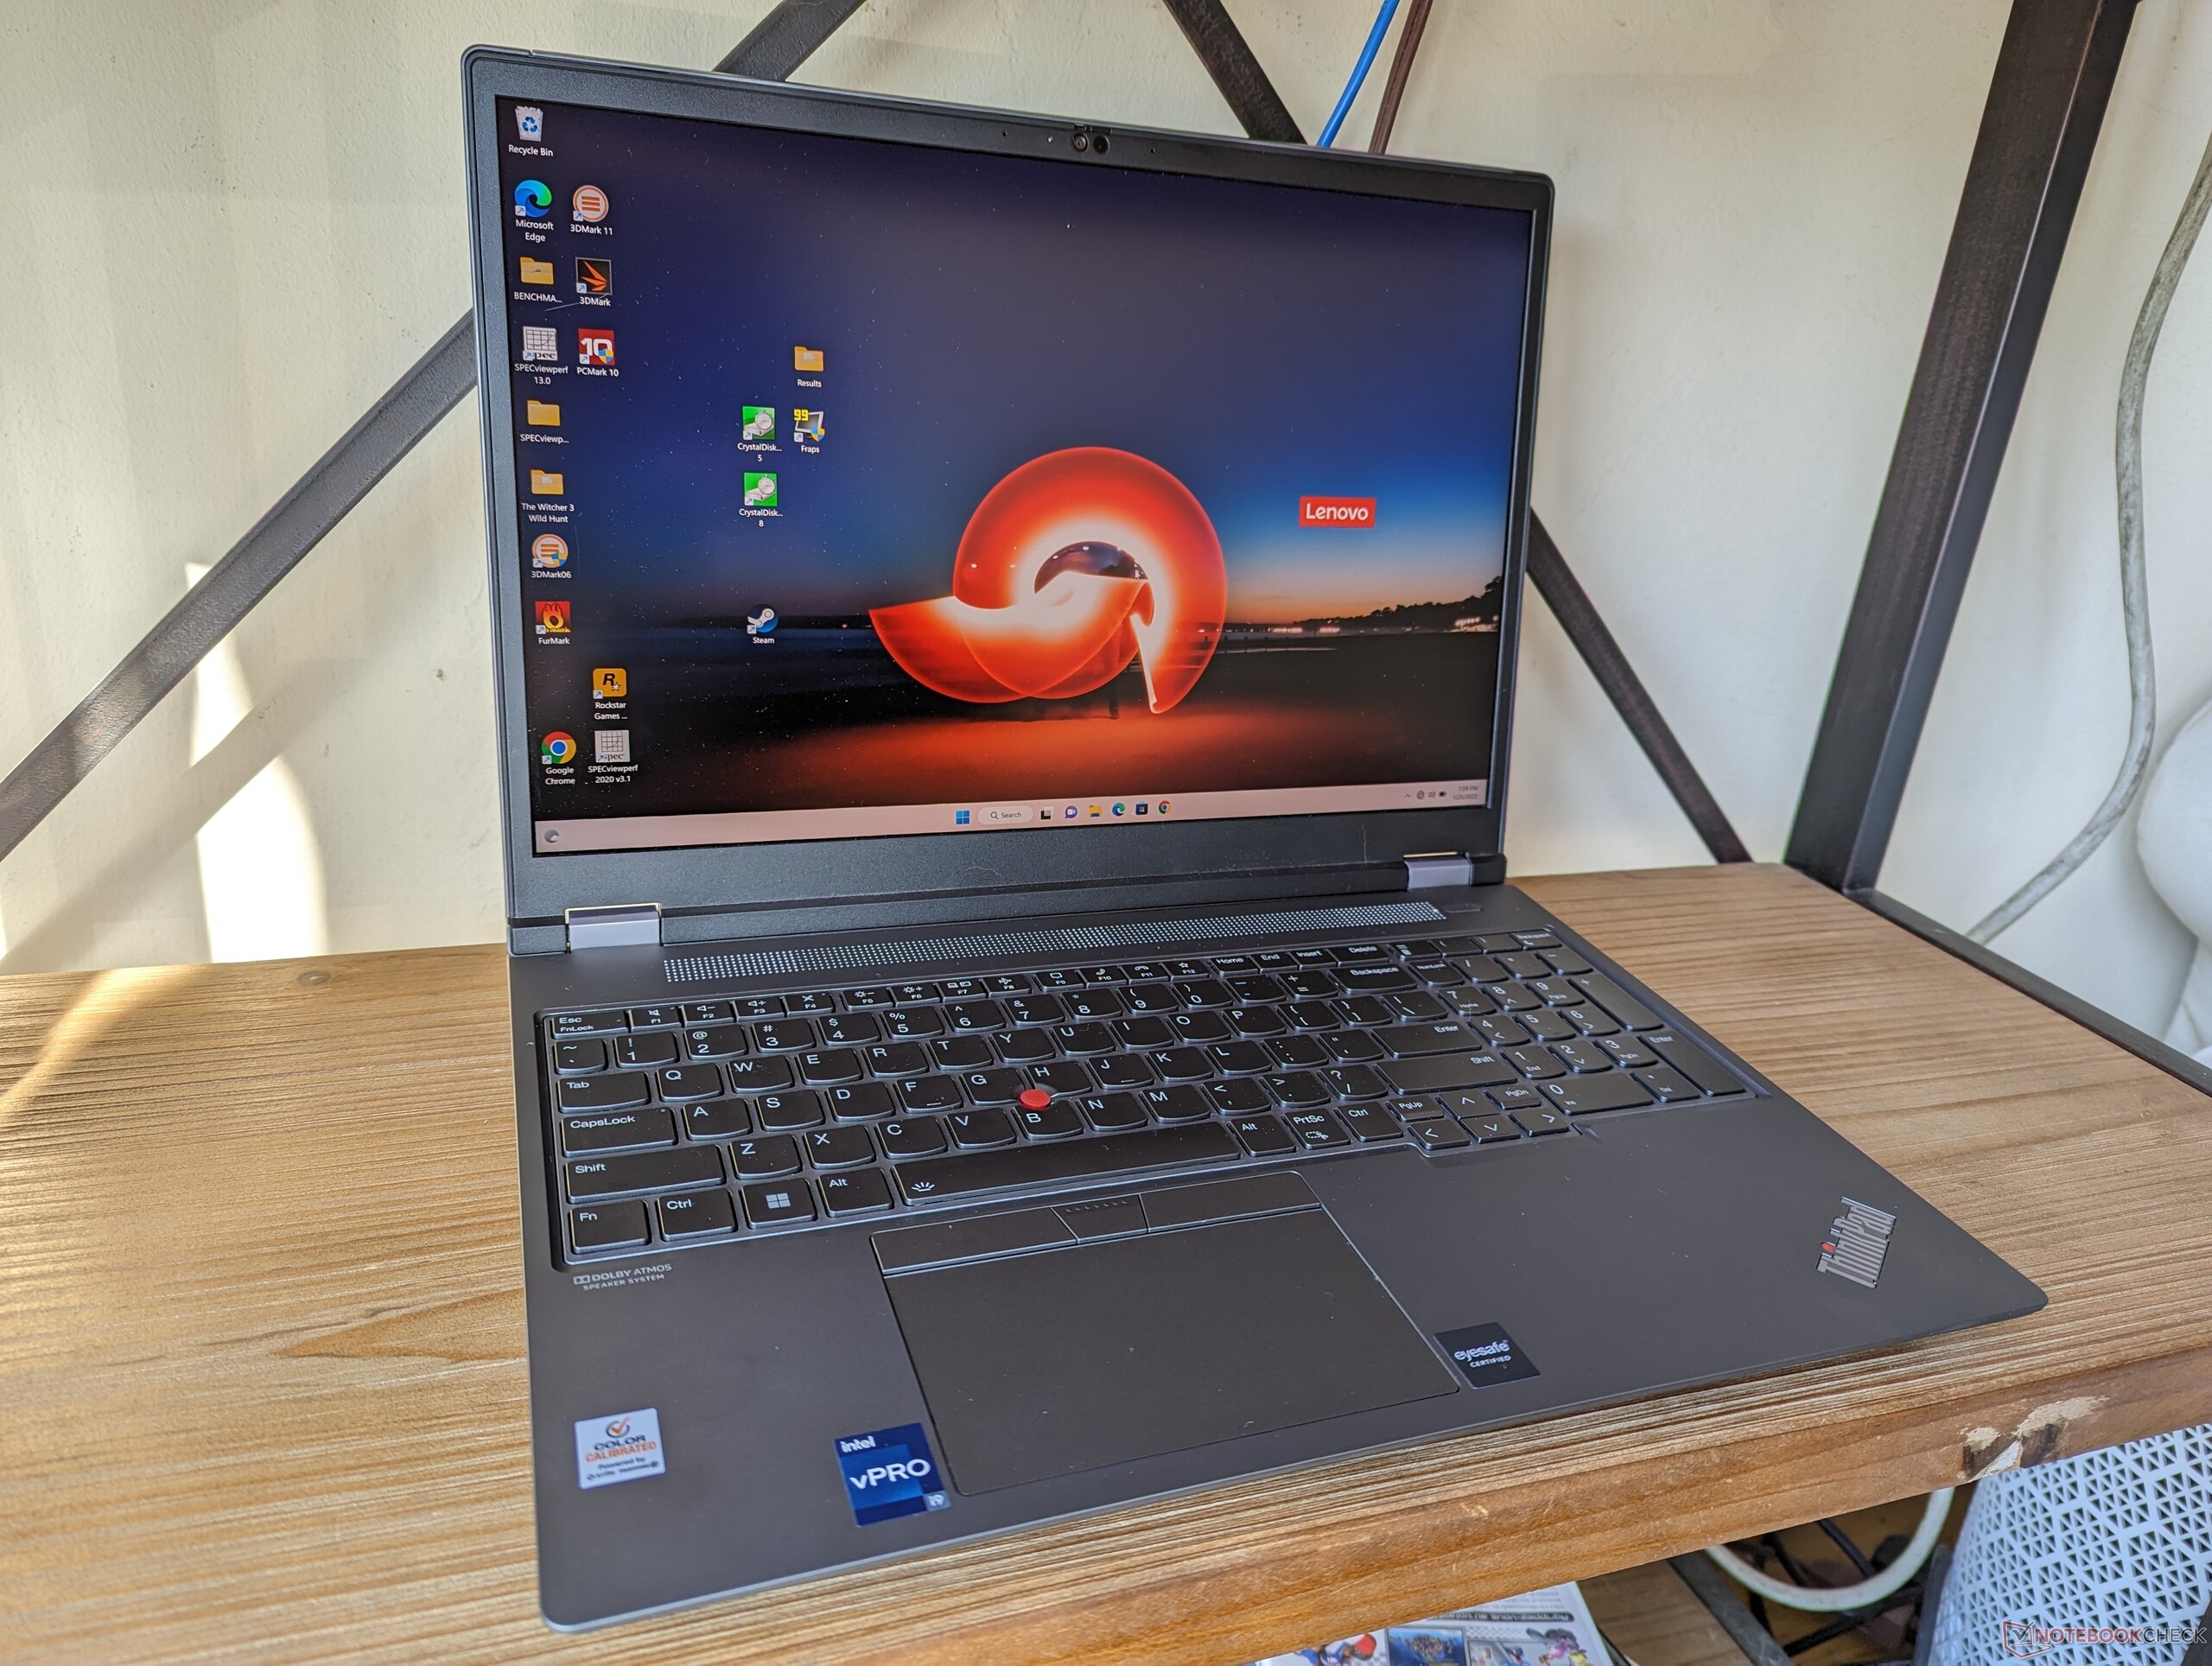
Lenovo ThinkPad P16 G1 RTX A5500 munkaállomás rövid értékelés: Gyorsabb, mint a Dell Precision 7670
Potential Competitors in Comparison
Értékelés | Dátum | Modell | Súly | Magasság | Méret | Felbontás | Legjobb ár |
|---|---|---|---|---|---|---|---|
| 91 % v7 (old) | 04/2023 | Lenovo ThinkPad P16 G1 RTX A5500 i9-12950HX, RTX A5500 Laptop GPU | 3 kg | 30.23 mm | 16.00" | 3840x2400 | |
v (old) | Asus ProArt StudioBook 16 W7600H5A-2BL2 W-11955M, RTX A5000 Laptop GPU | 2.4 kg | 21.4 mm | 16.00" | 3840x2400 | ||
| 89.1 % v7 (old) | Dell Precision 7000 7670 Performance i9-12950HX, RTX A5500 Laptop GPU | 2.8 kg | 25.95 mm | 16.00" | 3840x2400 | ||
| 88.2 % v7 (old) | 06/2023 | Lenovo ThinkPad P16 G1 21D6001DMB i7-12850HX, RTX A2000 Laptop GPU | 3 kg | 30.23 mm | 16.00" | 2560x1600 | |
| 84.3 % v7 (old) | MSI CreatorPro Z16P B12UKST i7-12700H, RTX A3000 Laptop GPU | 2.4 kg | 19 mm | 16.00" | 2560x1600 | ||
| 90.1 % v7 (old) | 12/2022 | HP ZBook Studio 16 G9 62U04EA i7-12800H, RTX A2000 Laptop GPU | 1.8 kg | 19 mm | 16.00" | 3840x2400 |
| SD Card Reader | |
| average JPG Copy Test (av. of 3 runs) | |
| Dell Precision 7000 7670 Performance (Toshiba Exceria Pro SDXC 64 GB UHS-II) | |
| MSI CreatorPro Z16P B12UKST (AV Pro V60) | |
| Lenovo ThinkPad P16 G1 RTX A5500 (Toshiba Exceria Pro SDXC 64 GB UHS-II) | |
| HP ZBook Studio 16 G9 62U04EA (Angelbird AV PRO V60) | |
| Asus ProArt StudioBook 16 W7600H5A-2BL2 (AV Pro SD microSD 128 GB V60) | |
| Lenovo ThinkPad P16 G1 21D6001DMB (AV Pro V60) | |
| maximum AS SSD Seq Read Test (1GB) | |
| Dell Precision 7000 7670 Performance (Toshiba Exceria Pro SDXC 64 GB UHS-II) | |
| Asus ProArt StudioBook 16 W7600H5A-2BL2 (AV Pro SD microSD 128 GB V60) | |
| MSI CreatorPro Z16P B12UKST (AV Pro V60) | |
| Lenovo ThinkPad P16 G1 RTX A5500 (Toshiba Exceria Pro SDXC 64 GB UHS-II) | |
| HP ZBook Studio 16 G9 62U04EA (Angelbird AV PRO V60) | |
| Lenovo ThinkPad P16 G1 21D6001DMB (AV Pro V60) | |
| Networking | |
| iperf3 transmit AX12 | |
| Asus ProArt StudioBook 16 W7600H5A-2BL2 | |
| iperf3 receive AX12 | |
| Asus ProArt StudioBook 16 W7600H5A-2BL2 | |
| iperf3 receive AXE11000 6GHz | |
| MSI CreatorPro Z16P B12UKST | |
| HP ZBook Studio 16 G9 62U04EA | |
| Dell Precision 7000 7670 Performance | |
| Lenovo ThinkPad P16 G1 RTX A5500 | |
| iperf3 receive AXE11000 | |
| Lenovo ThinkPad P16 G1 21D6001DMB | |
| Lenovo ThinkPad P16 G1 RTX A5500 | |
| Dell Precision 7000 7670 Performance | |
| iperf3 transmit AXE11000 | |
| Lenovo ThinkPad P16 G1 RTX A5500 | |
| Lenovo ThinkPad P16 G1 21D6001DMB | |
| Dell Precision 7000 7670 Performance | |
| iperf3 transmit AXE11000 6GHz | |
| MSI CreatorPro Z16P B12UKST | |
| HP ZBook Studio 16 G9 62U04EA | |
| Lenovo ThinkPad P16 G1 RTX A5500 | |
| Dell Precision 7000 7670 Performance | |


| |||||||||||||||||||||||||
Fényerő megoszlás: 77 %
Centrumban: 601.9 cd/m²
Kontraszt: 1281:1 (Fekete: 0.47 cd/m²)
ΔE ColorChecker Calman: 2.45 | ∀{0.5-29.43 Ø4.71}
ΔE Greyscale Calman: 2.6 | ∀{0.09-98 Ø4.96}
95.9% AdobeRGB 1998 (Argyll 3D)
98.9% sRGB (Argyll 3D)
82.9% Display P3 (Argyll 3D)
Gamma: 2.3
CCT: 6805 K
| Lenovo ThinkPad P16 G1 RTX A5500 LP160UQ1-SPB1, IPS, 3840x2400, 16" | Asus ProArt StudioBook 16 W7600H5A-2BL2 ATNA60YV02-0, OLED, 3840x2400, 16" | Dell Precision 7000 7670 Performance Samsung 160YV03, OLED, 3840x2400, 16" | Lenovo ThinkPad P16 G1 21D6001DMB NE160QDM-N63 , IPS LED, 2560x1600, 16" | MSI CreatorPro Z16P B12UKST B160QAN02.N, IPS, 2560x1600, 16" | HP ZBook Studio 16 G9 62U04EA BOE0A52, IPS, 3840x2400, 16" | |
|---|---|---|---|---|---|---|
| Display | 8% | 8% | -12% | 3% | 3% | |
| Display P3 Coverage (%) | 82.9 | 99.9 21% | 99.9 21% | 71.5 -14% | 97.6 18% | 97.5 18% |
| sRGB Coverage (%) | 98.9 | 100 1% | 100 1% | 100 1% | 99.9 1% | 99.9 1% |
| AdobeRGB 1998 Coverage (%) | 95.9 | 98.6 3% | 98.1 2% | 73.3 -24% | 87.4 -9% | 86.3 -10% |
| Response Times | 96% | 96% | 23% | 76% | 75% | |
| Response Time Grey 50% / Grey 80% * (ms) | 45.6 ? | 2 ? 96% | 1.84 ? 96% | 37.7 ? 17% | 12.8 ? 72% | 15.3 ? 66% |
| Response Time Black / White * (ms) | 36.8 ? | 2 ? 95% | 1.92 ? 95% | 26.3 ? 29% | 7.4 ? 80% | 6.1 ? 83% |
| PWM Frequency (Hz) | 240 ? | 59.52 ? | ||||
| Screen | -2% | -36% | -4% | 9% | 16% | |
| Brightness middle (cd/m²) | 601.9 | 353 -41% | 325.2 -46% | 424 -30% | 407 -32% | 554 -8% |
| Brightness (cd/m²) | 569 | 360 -37% | 328 -42% | 398 -30% | 388 -32% | 516 -9% |
| Brightness Distribution (%) | 77 | 96 25% | 97 26% | 90 17% | 88 14% | 84 9% |
| Black Level * (cd/m²) | 0.47 | 0.24 49% | 0.36 23% | 0.47 -0% | ||
| Contrast (:1) | 1281 | 1767 38% | 1131 -12% | 1179 -8% | ||
| Colorchecker dE 2000 * | 2.45 | 2.45 -0% | 4.59 -87% | 2.6 -6% | 1.3 47% | 1 59% |
| Colorchecker dE 2000 max. * | 4.46 | 3.75 16% | 7.65 -72% | 4.9 -10% | 2.5 44% | 2.4 46% |
| Greyscale dE 2000 * | 2.6 | 1.88 28% | 2.5 4% | 4.1 -58% | 2.1 19% | 1.6 38% |
| Gamma | 2.3 96% | 2.31 95% | 2.1 105% | 2.13 103% | 2.26 97% | 2.29 96% |
| CCT | 6805 96% | 6441 101% | 6541 99% | 7252 90% | 6437 101% | 6458 101% |
| Colorchecker dE 2000 calibrated * | 2.77 | 0.8 | 0.7 | 0.6 | ||
| Teljes átlag (program / beállítások) | 34% /
19% | 23% /
-0% | 2% /
-2% | 29% /
18% | 31% /
22% |
* ... a kisebb jobb
Megjelenítési válaszidők
| ↔ Válaszidő Fekete-fehér | ||
|---|---|---|
| 36.8 ms ... emelkedés és süllyedés ↘ kombinálva | ↗ 19.6 ms emelkedés | 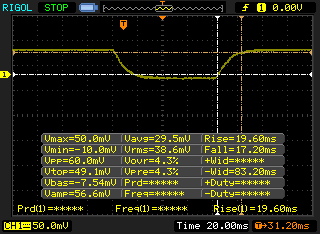 |
| ↘ 17.2 ms ősz | ||
| A képernyő lassú reakciósebességet mutat tesztjeinkben, és nem lesz kielégítő a játékosok számára. Összehasonlításképpen, az összes tesztelt eszköz 0.1 (minimum) és 240 (maximum) ms között mozog. » 95 % of all devices are better. Ez azt jelenti, hogy a mért válaszidő rosszabb, mint az összes vizsgált eszköz átlaga (19.8 ms). | ||
| ↔ Válaszidő 50% szürke és 80% szürke között | ||
| 45.6 ms ... emelkedés és süllyedés ↘ kombinálva | ↗ 21.2 ms emelkedés | 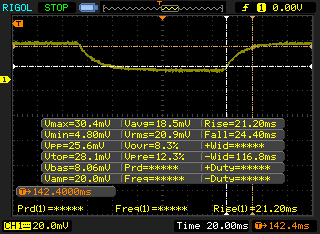 |
| ↘ 24.4 ms ősz | ||
| A képernyő lassú reakciósebességet mutat tesztjeinkben, és nem lesz kielégítő a játékosok számára. Összehasonlításképpen, az összes tesztelt eszköz 0.165 (minimum) és 636 (maximum) ms között mozog. » 78 % of all devices are better. Ez azt jelenti, hogy a mért válaszidő rosszabb, mint az összes vizsgált eszköz átlaga (31 ms). | ||
Képernyő villogása / PWM (impulzusszélesség-moduláció)
| Képernyő villogása / PWM nem érzékelhető |  | ||
Összehasonlításképpen: az összes tesztelt eszköz 52 %-a nem használja a PWM-et a kijelző elsötétítésére. Ha PWM-et észleltek, akkor átlagosan 7747 (minimum: 5 - maximum: 343500) Hz-t mértek. | |||
Cinebench R15 Multi Loop
Cinebench R23: Multi Core | Single Core
Cinebench R20: CPU (Multi Core) | CPU (Single Core)
Cinebench R15: CPU Multi 64Bit | CPU Single 64Bit
Blender: v2.79 BMW27 CPU
7-Zip 18.03: 7z b 4 | 7z b 4 -mmt1
Geekbench 5.5: Multi-Core | Single-Core
HWBOT x265 Benchmark v2.2: 4k Preset
LibreOffice : 20 Documents To PDF
R Benchmark 2.5: Overall mean
| CPU Performance rating | |
| Intel NUC13 Raptor Canyon | |
| Lenovo Legion 7 16IAX7-82TD004SGE | |
| Lenovo ThinkPad P16 G1 RTX A5500 | |
| Átlagos Intel Core i9-12950HX | |
| MSI Creator Z16P B12UHST | |
| Lenovo ThinkPad P16 G1 21D6001DMB | |
| HP ZBook Studio 16 G9 62U04EA | |
| Dell Precision 7000 7670 Performance | |
| MSI CreatorPro Z16P B12UKST | |
| Dell Precision 5000 5470 | |
| MSI WE76 11UM-456 -1! | |
| HP ZBook Studio 15 G8 | |
| Asus ProArt StudioBook 16 W7600H5A-2BL2 | |
| HP ZBook Fury 15 G8 -2! | |
| HP ZBook Studio G7 | |
| Cinebench R23 / Multi Core | |
| Intel NUC13 Raptor Canyon | |
| Lenovo Legion 7 16IAX7-82TD004SGE | |
| Lenovo ThinkPad P16 G1 RTX A5500 | |
| Átlagos Intel Core i9-12950HX (16277 - 23113, n=7) | |
| MSI Creator Z16P B12UHST | |
| Lenovo ThinkPad P16 G1 21D6001DMB | |
| MSI CreatorPro Z16P B12UKST | |
| HP ZBook Studio 16 G9 62U04EA | |
| Dell Precision 7000 7670 Performance | |
| MSI WE76 11UM-456 | |
| Dell Precision 5000 5470 | |
| HP ZBook Fury 15 G8 | |
| HP ZBook Studio 15 G8 | |
| Asus ProArt StudioBook 16 W7600H5A-2BL2 | |
| HP ZBook Studio G7 | |
| Cinebench R23 / Single Core | |
| Intel NUC13 Raptor Canyon | |
| Lenovo Legion 7 16IAX7-82TD004SGE | |
| MSI Creator Z16P B12UHST | |
| Lenovo ThinkPad P16 G1 RTX A5500 | |
| HP ZBook Studio 16 G9 62U04EA | |
| Lenovo ThinkPad P16 G1 21D6001DMB | |
| Átlagos Intel Core i9-12950HX (1465 - 1922, n=7) | |
| Dell Precision 5000 5470 | |
| MSI CreatorPro Z16P B12UKST | |
| MSI WE76 11UM-456 | |
| HP ZBook Fury 15 G8 | |
| HP ZBook Studio 15 G8 | |
| Asus ProArt StudioBook 16 W7600H5A-2BL2 | |
| Dell Precision 7000 7670 Performance | |
| HP ZBook Studio G7 | |
| Cinebench R20 / CPU (Multi Core) | |
| Intel NUC13 Raptor Canyon | |
| Lenovo Legion 7 16IAX7-82TD004SGE | |
| Lenovo ThinkPad P16 G1 RTX A5500 | |
| Átlagos Intel Core i9-12950HX (6625 - 8777, n=7) | |
| MSI Creator Z16P B12UHST | |
| Lenovo ThinkPad P16 G1 21D6001DMB | |
| MSI CreatorPro Z16P B12UKST | |
| Dell Precision 7000 7670 Performance | |
| HP ZBook Studio 16 G9 62U04EA | |
| HP ZBook Fury 15 G8 | |
| HP ZBook Studio 15 G8 | |
| Dell Precision 5000 5470 | |
| MSI WE76 11UM-456 | |
| Asus ProArt StudioBook 16 W7600H5A-2BL2 | |
| HP ZBook Studio G7 | |
| Cinebench R20 / CPU (Single Core) | |
| Intel NUC13 Raptor Canyon | |
| Lenovo Legion 7 16IAX7-82TD004SGE | |
| MSI Creator Z16P B12UHST | |
| Átlagos Intel Core i9-12950HX (703 - 741, n=7) | |
| Lenovo ThinkPad P16 G1 RTX A5500 | |
| HP ZBook Studio 16 G9 62U04EA | |
| Lenovo ThinkPad P16 G1 21D6001DMB | |
| Dell Precision 7000 7670 Performance | |
| Dell Precision 5000 5470 | |
| MSI CreatorPro Z16P B12UKST | |
| MSI WE76 11UM-456 | |
| HP ZBook Fury 15 G8 | |
| HP ZBook Studio 15 G8 | |
| Asus ProArt StudioBook 16 W7600H5A-2BL2 | |
| HP ZBook Studio G7 | |
| Cinebench R15 / CPU Multi 64Bit | |
| Intel NUC13 Raptor Canyon | |
| Lenovo Legion 7 16IAX7-82TD004SGE | |
| Lenovo ThinkPad P16 G1 RTX A5500 | |
| Átlagos Intel Core i9-12950HX (2464 - 3530, n=7) | |
| Lenovo ThinkPad P16 G1 21D6001DMB | |
| MSI Creator Z16P B12UHST | |
| Dell Precision 7000 7670 Performance | |
| HP ZBook Studio 16 G9 62U04EA | |
| Dell Precision 5000 5470 | |
| MSI CreatorPro Z16P B12UKST | |
| MSI WE76 11UM-456 | |
| Asus ProArt StudioBook 16 W7600H5A-2BL2 | |
| HP ZBook Studio 15 G8 | |
| HP ZBook Fury 15 G8 | |
| HP ZBook Studio G7 | |
| Cinebench R15 / CPU Single 64Bit | |
| Intel NUC13 Raptor Canyon | |
| Lenovo Legion 7 16IAX7-82TD004SGE | |
| MSI Creator Z16P B12UHST | |
| Lenovo ThinkPad P16 G1 RTX A5500 | |
| HP ZBook Studio 16 G9 62U04EA | |
| Lenovo ThinkPad P16 G1 21D6001DMB | |
| Dell Precision 7000 7670 Performance | |
| Átlagos Intel Core i9-12950HX (167 - 276, n=7) | |
| Dell Precision 5000 5470 | |
| MSI WE76 11UM-456 | |
| HP ZBook Fury 15 G8 | |
| MSI CreatorPro Z16P B12UKST | |
| HP ZBook Studio 15 G8 | |
| Asus ProArt StudioBook 16 W7600H5A-2BL2 | |
| HP ZBook Studio G7 | |
| Blender / v2.79 BMW27 CPU | |
| HP ZBook Studio G7 | |
| Asus ProArt StudioBook 16 W7600H5A-2BL2 | |
| HP ZBook Fury 15 G8 | |
| HP ZBook Studio 15 G8 | |
| Dell Precision 5000 5470 | |
| MSI CreatorPro Z16P B12UKST | |
| Dell Precision 7000 7670 Performance | |
| HP ZBook Studio 16 G9 62U04EA | |
| MSI Creator Z16P B12UHST | |
| Lenovo ThinkPad P16 G1 21D6001DMB | |
| Átlagos Intel Core i9-12950HX (138 - 193, n=7) | |
| Lenovo ThinkPad P16 G1 RTX A5500 | |
| Lenovo Legion 7 16IAX7-82TD004SGE | |
| Intel NUC13 Raptor Canyon | |
| 7-Zip 18.03 / 7z b 4 | |
| Intel NUC13 Raptor Canyon | |
| Lenovo Legion 7 16IAX7-82TD004SGE | |
| Lenovo ThinkPad P16 G1 RTX A5500 | |
| Átlagos Intel Core i9-12950HX (65637 - 85019, n=7) | |
| MSI Creator Z16P B12UHST | |
| Lenovo ThinkPad P16 G1 21D6001DMB | |
| HP ZBook Studio 16 G9 62U04EA | |
| MSI CreatorPro Z16P B12UKST | |
| Dell Precision 7000 7670 Performance | |
| MSI WE76 11UM-456 | |
| Dell Precision 5000 5470 | |
| HP ZBook Fury 15 G8 | |
| HP ZBook Studio 15 G8 | |
| Asus ProArt StudioBook 16 W7600H5A-2BL2 | |
| HP ZBook Studio G7 | |
| 7-Zip 18.03 / 7z b 4 -mmt1 | |
| Intel NUC13 Raptor Canyon | |
| Lenovo Legion 7 16IAX7-82TD004SGE | |
| Átlagos Intel Core i9-12950HX (6022 - 6318, n=7) | |
| Lenovo ThinkPad P16 G1 RTX A5500 | |
| MSI Creator Z16P B12UHST | |
| Dell Precision 7000 7670 Performance | |
| HP ZBook Studio 16 G9 62U04EA | |
| Lenovo ThinkPad P16 G1 21D6001DMB | |
| HP ZBook Studio 15 G8 | |
| MSI CreatorPro Z16P B12UKST | |
| HP ZBook Fury 15 G8 | |
| MSI WE76 11UM-456 | |
| HP ZBook Studio G7 | |
| Dell Precision 5000 5470 | |
| Asus ProArt StudioBook 16 W7600H5A-2BL2 | |
| Geekbench 5.5 / Multi-Core | |
| Intel NUC13 Raptor Canyon | |
| Lenovo Legion 7 16IAX7-82TD004SGE | |
| Lenovo ThinkPad P16 G1 RTX A5500 | |
| Átlagos Intel Core i9-12950HX (14028 - 16009, n=7) | |
| MSI Creator Z16P B12UHST | |
| Dell Precision 7000 7670 Performance | |
| Lenovo ThinkPad P16 G1 21D6001DMB | |
| HP ZBook Studio 16 G9 62U04EA | |
| Dell Precision 5000 5470 | |
| MSI CreatorPro Z16P B12UKST | |
| MSI WE76 11UM-456 | |
| Asus ProArt StudioBook 16 W7600H5A-2BL2 | |
| HP ZBook Studio G7 | |
| HP ZBook Studio 15 G8 | |
| Geekbench 5.5 / Single-Core | |
| Intel NUC13 Raptor Canyon | |
| Lenovo ThinkPad P16 G1 RTX A5500 | |
| Dell Precision 7000 7670 Performance | |
| Átlagos Intel Core i9-12950HX (1847 - 1945, n=7) | |
| MSI Creator Z16P B12UHST | |
| Lenovo Legion 7 16IAX7-82TD004SGE | |
| HP ZBook Studio 16 G9 62U04EA | |
| Dell Precision 5000 5470 | |
| MSI CreatorPro Z16P B12UKST | |
| Lenovo ThinkPad P16 G1 21D6001DMB | |
| HP ZBook Studio 15 G8 | |
| MSI WE76 11UM-456 | |
| Asus ProArt StudioBook 16 W7600H5A-2BL2 | |
| HP ZBook Studio G7 | |
| HWBOT x265 Benchmark v2.2 / 4k Preset | |
| Intel NUC13 Raptor Canyon | |
| Lenovo Legion 7 16IAX7-82TD004SGE | |
| Lenovo ThinkPad P16 G1 RTX A5500 | |
| Átlagos Intel Core i9-12950HX (18.6 - 26.5, n=7) | |
| HP ZBook Studio 16 G9 62U04EA | |
| MSI CreatorPro Z16P B12UKST | |
| MSI Creator Z16P B12UHST | |
| Dell Precision 7000 7670 Performance | |
| Lenovo ThinkPad P16 G1 21D6001DMB | |
| MSI WE76 11UM-456 | |
| HP ZBook Studio 15 G8 | |
| HP ZBook Fury 15 G8 | |
| Asus ProArt StudioBook 16 W7600H5A-2BL2 | |
| Dell Precision 5000 5470 | |
| HP ZBook Studio G7 | |
| LibreOffice / 20 Documents To PDF | |
| HP ZBook Studio G7 | |
| HP ZBook Fury 15 G8 | |
| HP ZBook Studio 15 G8 | |
| MSI WE76 11UM-456 | |
| Lenovo ThinkPad P16 G1 21D6001DMB | |
| Dell Precision 5000 5470 | |
| Dell Precision 7000 7670 Performance | |
| HP ZBook Studio 16 G9 62U04EA | |
| Intel NUC13 Raptor Canyon | |
| Átlagos Intel Core i9-12950HX (34.7 - 45.4, n=7) | |
| Lenovo ThinkPad P16 G1 RTX A5500 | |
| MSI Creator Z16P B12UHST | |
| MSI CreatorPro Z16P B12UKST | |
| Lenovo Legion 7 16IAX7-82TD004SGE | |
| Asus ProArt StudioBook 16 W7600H5A-2BL2 | |
| R Benchmark 2.5 / Overall mean | |
| Asus ProArt StudioBook 16 W7600H5A-2BL2 | |
| HP ZBook Studio G7 | |
| HP ZBook Studio 15 G8 | |
| MSI WE76 11UM-456 | |
| HP ZBook Fury 15 G8 | |
| Dell Precision 5000 5470 | |
| MSI CreatorPro Z16P B12UKST | |
| Lenovo ThinkPad P16 G1 21D6001DMB | |
| Dell Precision 7000 7670 Performance | |
| HP ZBook Studio 16 G9 62U04EA | |
| Lenovo ThinkPad P16 G1 RTX A5500 | |
| Átlagos Intel Core i9-12950HX (0.4251 - 0.4515, n=7) | |
| MSI Creator Z16P B12UHST | |
| Lenovo Legion 7 16IAX7-82TD004SGE | |
| Intel NUC13 Raptor Canyon | |
Cinebench R23: Multi Core | Single Core
Cinebench R20: CPU (Multi Core) | CPU (Single Core)
Cinebench R15: CPU Multi 64Bit | CPU Single 64Bit
Blender: v2.79 BMW27 CPU
7-Zip 18.03: 7z b 4 | 7z b 4 -mmt1
Geekbench 5.5: Multi-Core | Single-Core
HWBOT x265 Benchmark v2.2: 4k Preset
LibreOffice : 20 Documents To PDF
R Benchmark 2.5: Overall mean
* ... a kisebb jobb
AIDA64: FP32 Ray-Trace | FPU Julia | CPU SHA3 | CPU Queen | FPU SinJulia | FPU Mandel | CPU AES | CPU ZLib | FP64 Ray-Trace | CPU PhotoWorxx
| Performance rating | |
| Átlagos Intel Core i9-12950HX | |
| Lenovo ThinkPad P16 G1 RTX A5500 | |
| Lenovo ThinkPad P16 G1 21D6001DMB | |
| MSI CreatorPro Z16P B12UKST | |
| HP ZBook Studio 16 G9 62U04EA | |
| Dell Precision 7000 7670 Performance | |
| Asus ProArt StudioBook 16 W7600H5A-2BL2 -9! | |
| AIDA64 / FP32 Ray-Trace | |
| Lenovo ThinkPad P16 G1 RTX A5500 | |
| Átlagos Intel Core i9-12950HX (15499 - 22868, n=7) | |
| Lenovo ThinkPad P16 G1 21D6001DMB | |
| Dell Precision 7000 7670 Performance | |
| HP ZBook Studio 16 G9 62U04EA | |
| MSI CreatorPro Z16P B12UKST | |
| AIDA64 / FPU Julia | |
| Lenovo ThinkPad P16 G1 RTX A5500 | |
| Átlagos Intel Core i9-12950HX (77846 - 115907, n=7) | |
| Lenovo ThinkPad P16 G1 21D6001DMB | |
| HP ZBook Studio 16 G9 62U04EA | |
| Dell Precision 7000 7670 Performance | |
| MSI CreatorPro Z16P B12UKST | |
| AIDA64 / CPU SHA3 | |
| Lenovo ThinkPad P16 G1 RTX A5500 | |
| Átlagos Intel Core i9-12950HX (3426 - 5069, n=7) | |
| Lenovo ThinkPad P16 G1 21D6001DMB | |
| HP ZBook Studio 16 G9 62U04EA | |
| MSI CreatorPro Z16P B12UKST | |
| Dell Precision 7000 7670 Performance | |
| AIDA64 / CPU Queen | |
| HP ZBook Studio 16 G9 62U04EA | |
| Átlagos Intel Core i9-12950HX (102752 - 104726, n=7) | |
| Lenovo ThinkPad P16 G1 RTX A5500 | |
| Dell Precision 7000 7670 Performance | |
| MSI CreatorPro Z16P B12UKST | |
| Lenovo ThinkPad P16 G1 21D6001DMB | |
| AIDA64 / FPU SinJulia | |
| Lenovo ThinkPad P16 G1 RTX A5500 | |
| Átlagos Intel Core i9-12950HX (10134 - 12823, n=7) | |
| Lenovo ThinkPad P16 G1 21D6001DMB | |
| Dell Precision 7000 7670 Performance | |
| HP ZBook Studio 16 G9 62U04EA | |
| MSI CreatorPro Z16P B12UKST | |
| AIDA64 / FPU Mandel | |
| Lenovo ThinkPad P16 G1 RTX A5500 | |
| Átlagos Intel Core i9-12950HX (37146 - 57340, n=7) | |
| Lenovo ThinkPad P16 G1 21D6001DMB | |
| HP ZBook Studio 16 G9 62U04EA | |
| Dell Precision 7000 7670 Performance | |
| MSI CreatorPro Z16P B12UKST | |
| AIDA64 / CPU AES | |
| MSI CreatorPro Z16P B12UKST | |
| Átlagos Intel Core i9-12950HX (72599 - 181128, n=7) | |
| Lenovo ThinkPad P16 G1 RTX A5500 | |
| Lenovo ThinkPad P16 G1 21D6001DMB | |
| HP ZBook Studio 16 G9 62U04EA | |
| Dell Precision 7000 7670 Performance | |
| AIDA64 / CPU ZLib | |
| Lenovo ThinkPad P16 G1 RTX A5500 | |
| Átlagos Intel Core i9-12950HX (996 - 1417, n=7) | |
| Lenovo ThinkPad P16 G1 21D6001DMB | |
| HP ZBook Studio 16 G9 62U04EA | |
| MSI CreatorPro Z16P B12UKST | |
| Dell Precision 7000 7670 Performance | |
| Asus ProArt StudioBook 16 W7600H5A-2BL2 | |
| Asus ProArt StudioBook 16 W7600H5A-2BL2 | |
| AIDA64 / FP64 Ray-Trace | |
| Lenovo ThinkPad P16 G1 RTX A5500 | |
| Átlagos Intel Core i9-12950HX (8455 - 12432, n=7) | |
| Lenovo ThinkPad P16 G1 21D6001DMB | |
| HP ZBook Studio 16 G9 62U04EA | |
| Dell Precision 7000 7670 Performance | |
| MSI CreatorPro Z16P B12UKST | |
| AIDA64 / CPU PhotoWorxx | |
| MSI CreatorPro Z16P B12UKST | |
| Dell Precision 7000 7670 Performance | |
| Átlagos Intel Core i9-12950HX (35479 - 42655, n=7) | |
| Lenovo ThinkPad P16 G1 RTX A5500 | |
| HP ZBook Studio 16 G9 62U04EA | |
| Lenovo ThinkPad P16 G1 21D6001DMB | |
CrossMark: Overall | Productivity | Creativity | Responsiveness
| PCMark 10 / Score | |
| Lenovo ThinkPad P16 G1 RTX A5500 | |
| MSI CreatorPro Z16P B12UKST | |
| Átlagos Intel Core i9-12950HX, NVIDIA RTX A5500 Laptop GPU (6883 - 7236, n=3) | |
| Asus ProArt StudioBook 16 W7600H5A-2BL2 | |
| Dell Precision 7000 7670 Performance | |
| HP ZBook Studio 16 G9 62U04EA | |
| Lenovo ThinkPad P16 G1 21D6001DMB | |
| PCMark 10 / Essentials | |
| Dell Precision 7000 7670 Performance | |
| Átlagos Intel Core i9-12950HX, NVIDIA RTX A5500 Laptop GPU (10898 - 11465, n=3) | |
| Lenovo ThinkPad P16 G1 RTX A5500 | |
| MSI CreatorPro Z16P B12UKST | |
| Asus ProArt StudioBook 16 W7600H5A-2BL2 | |
| Lenovo ThinkPad P16 G1 21D6001DMB | |
| HP ZBook Studio 16 G9 62U04EA | |
| PCMark 10 / Productivity | |
| Lenovo ThinkPad P16 G1 RTX A5500 | |
| MSI CreatorPro Z16P B12UKST | |
| Lenovo ThinkPad P16 G1 21D6001DMB | |
| Asus ProArt StudioBook 16 W7600H5A-2BL2 | |
| Átlagos Intel Core i9-12950HX, NVIDIA RTX A5500 Laptop GPU (8054 - 9489, n=3) | |
| Dell Precision 7000 7670 Performance | |
| HP ZBook Studio 16 G9 62U04EA | |
| PCMark 10 / Digital Content Creation | |
| Asus ProArt StudioBook 16 W7600H5A-2BL2 | |
| Lenovo ThinkPad P16 G1 RTX A5500 | |
| MSI CreatorPro Z16P B12UKST | |
| Dell Precision 7000 7670 Performance | |
| Átlagos Intel Core i9-12950HX, NVIDIA RTX A5500 Laptop GPU (9155 - 9944, n=3) | |
| HP ZBook Studio 16 G9 62U04EA | |
| Lenovo ThinkPad P16 G1 21D6001DMB | |
| CrossMark / Overall | |
| MSI CreatorPro Z16P B12UKST | |
| Lenovo ThinkPad P16 G1 RTX A5500 | |
| Átlagos Intel Core i9-12950HX, NVIDIA RTX A5500 Laptop GPU (1801 - 1889, n=3) | |
| HP ZBook Studio 16 G9 62U04EA | |
| Dell Precision 7000 7670 Performance | |
| Lenovo ThinkPad P16 G1 21D6001DMB | |
| CrossMark / Productivity | |
| MSI CreatorPro Z16P B12UKST | |
| Lenovo ThinkPad P16 G1 RTX A5500 | |
| Átlagos Intel Core i9-12950HX, NVIDIA RTX A5500 Laptop GPU (1684 - 1785, n=3) | |
| HP ZBook Studio 16 G9 62U04EA | |
| Dell Precision 7000 7670 Performance | |
| Lenovo ThinkPad P16 G1 21D6001DMB | |
| CrossMark / Creativity | |
| Lenovo ThinkPad P16 G1 RTX A5500 | |
| Átlagos Intel Core i9-12950HX, NVIDIA RTX A5500 Laptop GPU (2042 - 2192, n=3) | |
| HP ZBook Studio 16 G9 62U04EA | |
| MSI CreatorPro Z16P B12UKST | |
| Dell Precision 7000 7670 Performance | |
| Lenovo ThinkPad P16 G1 21D6001DMB | |
| CrossMark / Responsiveness | |
| MSI CreatorPro Z16P B12UKST | |
| HP ZBook Studio 16 G9 62U04EA | |
| Átlagos Intel Core i9-12950HX, NVIDIA RTX A5500 Laptop GPU (1501 - 1585, n=3) | |
| Dell Precision 7000 7670 Performance | |
| Lenovo ThinkPad P16 G1 RTX A5500 | |
| Lenovo ThinkPad P16 G1 21D6001DMB | |
| PCMark 10 Score | 7236 pontok | |
Segítség | ||
| AIDA64 / Memory Copy | |
| Dell Precision 7000 7670 Performance | |
| Átlagos Intel Core i9-12950HX (59731 - 64732, n=7) | |
| Lenovo ThinkPad P16 G1 RTX A5500 | |
| MSI CreatorPro Z16P B12UKST | |
| HP ZBook Studio 16 G9 62U04EA | |
| Lenovo ThinkPad P16 G1 21D6001DMB | |
| AIDA64 / Memory Read | |
| Dell Precision 7000 7670 Performance | |
| Átlagos Intel Core i9-12950HX (59744 - 70359, n=7) | |
| MSI CreatorPro Z16P B12UKST | |
| HP ZBook Studio 16 G9 62U04EA | |
| Lenovo ThinkPad P16 G1 RTX A5500 | |
| Lenovo ThinkPad P16 G1 21D6001DMB | |
| AIDA64 / Memory Write | |
| MSI CreatorPro Z16P B12UKST | |
| Dell Precision 7000 7670 Performance | |
| HP ZBook Studio 16 G9 62U04EA | |
| Átlagos Intel Core i9-12950HX (57750 - 67899, n=7) | |
| Lenovo ThinkPad P16 G1 RTX A5500 | |
| Lenovo ThinkPad P16 G1 21D6001DMB | |
| AIDA64 / Memory Latency | |
| Lenovo ThinkPad P16 G1 21D6001DMB | |
| MSI CreatorPro Z16P B12UKST | |
| Lenovo ThinkPad P16 G1 RTX A5500 | |
| HP ZBook Studio 16 G9 62U04EA | |
| Átlagos Intel Core i9-12950HX (84.5 - 92.2, n=7) | |
| Dell Precision 7000 7670 Performance | |
| Asus ProArt StudioBook 16 W7600H5A-2BL2 | |
| Asus ProArt StudioBook 16 W7600H5A-2BL2 | |
* ... a kisebb jobb
| DPC Latencies / LatencyMon - interrupt to process latency (max), Web, Youtube, Prime95 | |
| Dell Precision 7000 7670 Performance | |
| Lenovo ThinkPad P16 G1 RTX A5500 | |
| Asus ProArt StudioBook 16 W7600H5A-2BL2 | |
| Lenovo ThinkPad P16 G1 21D6001DMB | |
| HP ZBook Studio 16 G9 62U04EA | |
| MSI CreatorPro Z16P B12UKST | |
* ... a kisebb jobb

| Drive Performance rating - Percent | |
| MSI CreatorPro Z16P B12UKST -8! | |
| Lenovo ThinkPad P16 G1 21D6001DMB | |
| HP ZBook Studio 16 G9 62U04EA | |
| Dell Precision 7000 7670 Performance | |
| Lenovo ThinkPad P16 G1 RTX A5500 | |
| Asus ProArt StudioBook 16 W7600H5A-2BL2 | |
| DiskSpd | |
| seq read | |
| HP ZBook Studio 16 G9 62U04EA | |
| Lenovo ThinkPad P16 G1 RTX A5500 | |
| Lenovo ThinkPad P16 G1 21D6001DMB | |
| Dell Precision 7000 7670 Performance | |
| Asus ProArt StudioBook 16 W7600H5A-2BL2 | |
| Asus ProArt StudioBook 16 W7600H5A-2BL2 | |
| seq write | |
| Dell Precision 7000 7670 Performance | |
| Lenovo ThinkPad P16 G1 21D6001DMB | |
| Lenovo ThinkPad P16 G1 RTX A5500 | |
| HP ZBook Studio 16 G9 62U04EA | |
| Asus ProArt StudioBook 16 W7600H5A-2BL2 | |
| Asus ProArt StudioBook 16 W7600H5A-2BL2 | |
| seq q8 t1 read | |
| Lenovo ThinkPad P16 G1 RTX A5500 | |
| Lenovo ThinkPad P16 G1 21D6001DMB | |
| HP ZBook Studio 16 G9 62U04EA | |
| Asus ProArt StudioBook 16 W7600H5A-2BL2 | |
| Asus ProArt StudioBook 16 W7600H5A-2BL2 | |
| Dell Precision 7000 7670 Performance | |
| seq q8 t1 write | |
| Dell Precision 7000 7670 Performance | |
| Asus ProArt StudioBook 16 W7600H5A-2BL2 | |
| Asus ProArt StudioBook 16 W7600H5A-2BL2 | |
| Lenovo ThinkPad P16 G1 21D6001DMB | |
| Lenovo ThinkPad P16 G1 RTX A5500 | |
| HP ZBook Studio 16 G9 62U04EA | |
| 4k q1 t1 read | |
| Lenovo ThinkPad P16 G1 21D6001DMB | |
| Lenovo ThinkPad P16 G1 RTX A5500 | |
| Asus ProArt StudioBook 16 W7600H5A-2BL2 | |
| Asus ProArt StudioBook 16 W7600H5A-2BL2 | |
| HP ZBook Studio 16 G9 62U04EA | |
| Dell Precision 7000 7670 Performance | |
| 4k q1 t1 write | |
| Lenovo ThinkPad P16 G1 21D6001DMB | |
| HP ZBook Studio 16 G9 62U04EA | |
| Dell Precision 7000 7670 Performance | |
| Lenovo ThinkPad P16 G1 RTX A5500 | |
| Asus ProArt StudioBook 16 W7600H5A-2BL2 | |
| Asus ProArt StudioBook 16 W7600H5A-2BL2 | |
| 4k q32 t16 read | |
| Lenovo ThinkPad P16 G1 21D6001DMB | |
| Dell Precision 7000 7670 Performance | |
| Lenovo ThinkPad P16 G1 RTX A5500 | |
| HP ZBook Studio 16 G9 62U04EA | |
| Asus ProArt StudioBook 16 W7600H5A-2BL2 | |
| Asus ProArt StudioBook 16 W7600H5A-2BL2 | |
| 4k q32 t16 write | |
| Lenovo ThinkPad P16 G1 21D6001DMB | |
| Dell Precision 7000 7670 Performance | |
| Asus ProArt StudioBook 16 W7600H5A-2BL2 | |
| Asus ProArt StudioBook 16 W7600H5A-2BL2 | |
| HP ZBook Studio 16 G9 62U04EA | |
| Lenovo ThinkPad P16 G1 RTX A5500 | |
| AS SSD | |
| Score Total | |
| MSI CreatorPro Z16P B12UKST | |
| Lenovo ThinkPad P16 G1 21D6001DMB | |
| HP ZBook Studio 16 G9 62U04EA | |
| Lenovo ThinkPad P16 G1 RTX A5500 | |
| Asus ProArt StudioBook 16 W7600H5A-2BL2 | |
| Dell Precision 7000 7670 Performance | |
| Score Read | |
| MSI CreatorPro Z16P B12UKST | |
| Lenovo ThinkPad P16 G1 21D6001DMB | |
| Asus ProArt StudioBook 16 W7600H5A-2BL2 | |
| Dell Precision 7000 7670 Performance | |
| Lenovo ThinkPad P16 G1 RTX A5500 | |
| HP ZBook Studio 16 G9 62U04EA | |
| Score Write | |
| MSI CreatorPro Z16P B12UKST | |
| HP ZBook Studio 16 G9 62U04EA | |
| Lenovo ThinkPad P16 G1 21D6001DMB | |
| Lenovo ThinkPad P16 G1 RTX A5500 | |
| Asus ProArt StudioBook 16 W7600H5A-2BL2 | |
| Dell Precision 7000 7670 Performance | |
| Seq Read | |
| Dell Precision 7000 7670 Performance | |
| Lenovo ThinkPad P16 G1 RTX A5500 | |
| MSI CreatorPro Z16P B12UKST | |
| HP ZBook Studio 16 G9 62U04EA | |
| Asus ProArt StudioBook 16 W7600H5A-2BL2 | |
| Lenovo ThinkPad P16 G1 21D6001DMB | |
| Seq Write | |
| Dell Precision 7000 7670 Performance | |
| MSI CreatorPro Z16P B12UKST | |
| Lenovo ThinkPad P16 G1 21D6001DMB | |
| Lenovo ThinkPad P16 G1 RTX A5500 | |
| HP ZBook Studio 16 G9 62U04EA | |
| Asus ProArt StudioBook 16 W7600H5A-2BL2 | |
| 4K Read | |
| MSI CreatorPro Z16P B12UKST | |
| HP ZBook Studio 16 G9 62U04EA | |
| Dell Precision 7000 7670 Performance | |
| Lenovo ThinkPad P16 G1 RTX A5500 | |
| Asus ProArt StudioBook 16 W7600H5A-2BL2 | |
| Lenovo ThinkPad P16 G1 21D6001DMB | |
| 4K Write | |
| MSI CreatorPro Z16P B12UKST | |
| HP ZBook Studio 16 G9 62U04EA | |
| Dell Precision 7000 7670 Performance | |
| Lenovo ThinkPad P16 G1 RTX A5500 | |
| Asus ProArt StudioBook 16 W7600H5A-2BL2 | |
| Lenovo ThinkPad P16 G1 21D6001DMB | |
| 4K-64 Read | |
| MSI CreatorPro Z16P B12UKST | |
| Lenovo ThinkPad P16 G1 21D6001DMB | |
| Asus ProArt StudioBook 16 W7600H5A-2BL2 | |
| Lenovo ThinkPad P16 G1 RTX A5500 | |
| HP ZBook Studio 16 G9 62U04EA | |
| Dell Precision 7000 7670 Performance | |
| 4K-64 Write | |
| MSI CreatorPro Z16P B12UKST | |
| HP ZBook Studio 16 G9 62U04EA | |
| Lenovo ThinkPad P16 G1 21D6001DMB | |
| Lenovo ThinkPad P16 G1 RTX A5500 | |
| Asus ProArt StudioBook 16 W7600H5A-2BL2 | |
| Dell Precision 7000 7670 Performance | |
| Access Time Read | |
| Lenovo ThinkPad P16 G1 21D6001DMB | |
| Lenovo ThinkPad P16 G1 RTX A5500 | |
| Asus ProArt StudioBook 16 W7600H5A-2BL2 | |
| Dell Precision 7000 7670 Performance | |
| HP ZBook Studio 16 G9 62U04EA | |
| MSI CreatorPro Z16P B12UKST | |
| Access Time Write | |
| Lenovo ThinkPad P16 G1 RTX A5500 | |
| Dell Precision 7000 7670 Performance | |
| Asus ProArt StudioBook 16 W7600H5A-2BL2 | |
| Lenovo ThinkPad P16 G1 21D6001DMB | |
| HP ZBook Studio 16 G9 62U04EA | |
| MSI CreatorPro Z16P B12UKST | |
* ... a kisebb jobb
Disk Throttling: DiskSpd Read Loop, Queue Depth 8
| 3DMark Performance rating - Percent | |
| Lenovo Legion 7 16IAX7-82TD004SGE -34! | |
| Lenovo ThinkPad P16 G1 RTX A5500 | |
| Dell Precision 7000 7670 Performance -1! | |
| Átlagos NVIDIA RTX A5500 Laptop GPU | |
| Asus ProArt StudioBook 16 W7600H5A-2BL2 -19! | |
| MSI WE76 11UM-456 -9! | |
| HP ZBook Fury 15 G8 -1! | |
| MSI CreatorPro Z16P B12UKST -17! | |
| HP ZBook Studio 15 G8 -17! | |
| HP ZBook Studio G7 -17! | |
| HP ZBook Studio 16 G9 62U04EA -9! | |
| Dell Precision 5000 5470 -9! | |
| Lenovo ThinkPad P16 G1 21D6001DMB -17! | |
| 3DMark 11 - 1280x720 Performance GPU | |
| Lenovo Legion 7 16IAX7-82TD004SGE | |
| MSI WE76 11UM-456 | |
| Lenovo ThinkPad P16 G1 RTX A5500 | |
| Átlagos NVIDIA RTX A5500 Laptop GPU (33715 - 38139, n=3) | |
| Dell Precision 7000 7670 Performance | |
| HP ZBook Fury 15 G8 | |
| HP ZBook Studio 15 G8 | |
| MSI CreatorPro Z16P B12UKST | |
| HP ZBook Studio 16 G9 62U04EA | |
| HP ZBook Studio G7 | |
| Lenovo ThinkPad P16 G1 21D6001DMB | |
| Dell Precision 5000 5470 | |
| 3DMark 11 Performance | 32536 pontok | |
| 3DMark Cloud Gate Standard Score | 54323 pontok | |
| 3DMark Fire Strike Score | 25940 pontok | |
| 3DMark Time Spy Score | 10760 pontok | |
Segítség | ||
| Blender | |
| v3.3 Classroom OPTIX/RTX | |
| Dell Precision 5000 5470 | |
| Lenovo ThinkPad P16 G1 21D6001DMB | |
| HP ZBook Studio 16 G9 62U04EA | |
| MSI CreatorPro Z16P B12UKST | |
| Dell Precision 7000 7670 Performance | |
| Átlagos NVIDIA RTX A5500 Laptop GPU (21 - 25, n=3) | |
| Lenovo Legion 7 16IAX7-82TD004SGE | |
| Lenovo ThinkPad P16 G1 RTX A5500 | |
| v3.3 Classroom CUDA | |
| Dell Precision 5000 5470 | |
| HP ZBook Studio 16 G9 62U04EA | |
| Lenovo ThinkPad P16 G1 21D6001DMB | |
| MSI CreatorPro Z16P B12UKST | |
| Dell Precision 7000 7670 Performance | |
| Átlagos NVIDIA RTX A5500 Laptop GPU (35 - 40, n=3) | |
| Lenovo Legion 7 16IAX7-82TD004SGE | |
| Lenovo ThinkPad P16 G1 RTX A5500 | |
| v3.3 Classroom CPU | |
| Dell Precision 5000 5470 | |
| MSI CreatorPro Z16P B12UKST | |
| HP ZBook Studio 16 G9 62U04EA | |
| Dell Precision 7000 7670 Performance | |
| Lenovo ThinkPad P16 G1 21D6001DMB | |
| Átlagos NVIDIA RTX A5500 Laptop GPU (273 - 337, n=3) | |
| Lenovo ThinkPad P16 G1 RTX A5500 | |
| Lenovo Legion 7 16IAX7-82TD004SGE | |
* ... a kisebb jobb
Witcher 3 FPS Chart
| alacsony | közepes | magas | ultra | QHD | 4K | |
|---|---|---|---|---|---|---|
| GTA V (2015) | 185.9 | 183.4 | 177.7 | 124.4 | 103.5 | |
| The Witcher 3 (2015) | 489.4 | 329.9 | 211.8 | 110.4 | 63.7 | |
| Dota 2 Reborn (2015) | 194.3 | 174.5 | 166.1 | 156.3 | 132.8 | |
| Final Fantasy XV Benchmark (2018) | 212 | 142.5 | 113.1 | 83.5 | 45.4 | |
| X-Plane 11.11 (2018) | 155.8 | 137.6 | 108.8 | 93.7 | ||
| Strange Brigade (2018) | 442 | 264 | 223 | 197.7 | 138.6 | |
| Cyberpunk 2077 1.6 (2022) | 132.3 | 117.7 | 96.1 | 80.7 | 47 | 20.4 |
Zajszint
| Üresjárat |
| 23.1 / 23.1 / 23.1 dB(A) |
| Terhelés |
| 28.9 / 51.4 dB(A) |
 | ||
30 dB csendes 40 dB(A) hallható 50 dB(A) hangos |
||
min: | ||
| Lenovo ThinkPad P16 G1 RTX A5500 RTX A5500 Laptop GPU, i9-12950HX, WDC PC SN810 2TB | Asus ProArt StudioBook 16 W7600H5A-2BL2 RTX A5000 Laptop GPU, W-11955M, 2x Micron 2300 2TB MTFDHBA2T0TDV (RAID 0) | Dell Precision 7000 7670 Performance RTX A5500 Laptop GPU, i9-12950HX | Lenovo ThinkPad P16 G1 21D6001DMB RTX A2000 Laptop GPU, i7-12850HX, Micron 3400 1TB MTFDKBA1T0TFH | MSI CreatorPro Z16P B12UKST RTX A3000 Laptop GPU, i7-12700H, Samsung PM9A1 MZVL21T0HCLR | HP ZBook Studio 16 G9 62U04EA RTX A2000 Laptop GPU, i7-12800H, Micron 3400 1TB MTFDKBA1T0TFH | |
|---|---|---|---|---|---|---|
| Noise | -14% | -16% | -6% | -11% | -9% | |
| off / környezet * (dB) | 23.1 | 26 -13% | 23.9 -3% | 23.2 -0% | 24.1 -4% | 24 -4% |
| Idle Minimum * (dB) | 23.1 | 26 -13% | 24 -4% | 23.2 -0% | 27.1 -17% | 24 -4% |
| Idle Average * (dB) | 23.1 | 26 -13% | 24 -4% | 23.2 -0% | 27.1 -17% | 27.7 -20% |
| Idle Maximum * (dB) | 23.1 | 26.5 -15% | 38 -65% | 23.2 -0% | 27.1 -17% | 27.7 -20% |
| Load Average * (dB) | 28.9 | 42 -45% | 46.3 -60% | 47.8 -65% | 42.9 -48% | 39.8 -38% |
| Witcher 3 ultra * (dB) | 51.6 | 41.9 19% | 34.1 34% | 44 15% | 44.3 14% | |
| Load Maximum * (dB) | 51.4 | 43 16% | 47.9 7% | 56.3 -10% | 47 9% | 47.7 7% |
* ... a kisebb jobb
(±) A felső oldalon a maximális hőmérséklet 44.8 °C / 113 F, összehasonlítva a 38.2 °C / 101 F átlagával , 22.2 és 69.8 °C között a Workstation osztálynál.
(-) Az alsó maximum 49.8 °C / 122 F-ig melegszik fel, összehasonlítva a 41.1 °C / 106 F átlagával
(+) Üresjáratban a felső oldal átlagos hőmérséklete 28.6 °C / 83 F, összehasonlítva a 32 °C / ### eszközátlaggal class_avg_f### F.
(±) A The Witcher 3 játék során a felső oldal átlaghőmérséklete 36.4 °C / 98 F, összehasonlítva a 32 °C / ## eszközátlaggal #class_avg_f### F.
(+) A csuklótámasz és az érintőpad eléri a bőr maximális hőmérsékletét (32.4 °C / 90.3 F), ezért nem forrók.
(-) A hasonló eszközök csuklótámasz területének átlagos hőmérséklete 27.8 °C / 82 F volt (-4.6 °C / -8.3 F).
| Lenovo ThinkPad P16 G1 RTX A5500 Intel Core i9-12950HX, NVIDIA RTX A5500 Laptop GPU | Asus ProArt StudioBook 16 W7600H5A-2BL2 Intel Xeon W-11955M, NVIDIA RTX A5000 Laptop GPU | Dell Precision 7000 7670 Performance Intel Core i9-12950HX, NVIDIA RTX A5500 Laptop GPU | Lenovo ThinkPad P16 G1 21D6001DMB Intel Core i7-12850HX, NVIDIA RTX A2000 Laptop GPU | MSI CreatorPro Z16P B12UKST Intel Core i7-12700H, NVIDIA RTX A3000 Laptop GPU | HP ZBook Studio 16 G9 62U04EA Intel Core i7-12800H, NVIDIA RTX A2000 Laptop GPU | |
|---|---|---|---|---|---|---|
| Heat | -1% | -3% | 17% | -3% | 9% | |
| Maximum Upper Side * (°C) | 44.8 | 45.7 -2% | 53 -18% | 43.1 4% | 56.3 -26% | 38.7 14% |
| Maximum Bottom * (°C) | 49.8 | 48.3 3% | 43.2 13% | 39.9 20% | 68.3 -37% | 53.4 -7% |
| Idle Upper Side * (°C) | 30.6 | 35.3 -15% | 36.8 -20% | 26 15% | 25.2 18% | 27.3 11% |
| Idle Bottom * (°C) | 38.6 | 34.4 11% | 33.8 12% | 27.6 28% | 25.9 33% | 31.6 18% |
* ... a kisebb jobb
Lenovo ThinkPad P16 G1 RTX A5500 hangelemzés
(±) | a hangszóró hangereje átlagos, de jó (80.8 dB)
Basszus 100 - 315 Hz
(±) | csökkentett basszus – átlagosan 11.1%-kal alacsonyabb, mint a medián
(±) | a basszus linearitása átlagos (9.7% delta az előző frekvenciához)
Közepes 400-2000 Hz
(+) | kiegyensúlyozott középpontok – csak 4.1% választja el a mediántól
(+) | a középpontok lineárisak (3.3% delta az előző frekvenciához)
Maximum 2-16 kHz
(+) | kiegyensúlyozott csúcsok – csak 2.9% választja el a mediántól
(+) | a csúcsok lineárisak (5.2% delta az előző frekvenciához képest)
Összességében 100 - 16.000 Hz
(+) | általános hangzás lineáris (13.2% eltérés a mediánhoz képest)
Ugyanazon osztályhoz képest
» 23%Ebben az osztályban az összes tesztelt eszköz %-a jobb volt, 6% hasonló, 71%-kal rosszabb
» A legjobb delta értéke 7%, az átlag 17%, a legrosszabb 35% volt
Az összes tesztelt eszközzel összehasonlítva
» 13% az összes tesztelt eszköz jobb volt, 3% hasonló, 84%-kal rosszabb
» A legjobb delta értéke 4%, az átlag 23%, a legrosszabb 134% volt
Apple MacBook Pro 16 2021 M1 Pro hangelemzés
(+) | a hangszórók viszonylag hangosan tudnak játszani (84.7 dB)
Basszus 100 - 315 Hz
(+) | jó basszus – csak 3.8% választja el a mediántól
(+) | a basszus lineáris (5.2% delta az előző frekvenciához)
Közepes 400-2000 Hz
(+) | kiegyensúlyozott középpontok – csak 1.3% választja el a mediántól
(+) | a középpontok lineárisak (2.1% delta az előző frekvenciához)
Maximum 2-16 kHz
(+) | kiegyensúlyozott csúcsok – csak 1.9% választja el a mediántól
(+) | a csúcsok lineárisak (2.7% delta az előző frekvenciához képest)
Összességében 100 - 16.000 Hz
(+) | általános hangzás lineáris (4.6% eltérés a mediánhoz képest)
Ugyanazon osztályhoz képest
» 0%Ebben az osztályban az összes tesztelt eszköz %-a jobb volt, 0% hasonló, 100%-kal rosszabb
» A legjobb delta értéke 5%, az átlag 17%, a legrosszabb 45% volt
Az összes tesztelt eszközzel összehasonlítva
» 0% az összes tesztelt eszköz jobb volt, 0% hasonló, 100%-kal rosszabb
» A legjobb delta értéke 4%, az átlag 23%, a legrosszabb 134% volt
| Kikapcsolt állapot / Készenlét | |
| Üresjárat | |
| Terhelés |
|
Kulcs:
min: | |
| Lenovo ThinkPad P16 G1 RTX A5500 i9-12950HX, RTX A5500 Laptop GPU, WDC PC SN810 2TB, IPS, 3840x2400, 16" | Asus ProArt StudioBook 16 W7600H5A-2BL2 W-11955M, RTX A5000 Laptop GPU, 2x Micron 2300 2TB MTFDHBA2T0TDV (RAID 0), OLED, 3840x2400, 16" | Dell Precision 7000 7670 Performance i9-12950HX, RTX A5500 Laptop GPU, , OLED, 3840x2400, 16" | Lenovo ThinkPad P16 G1 21D6001DMB i7-12850HX, RTX A2000 Laptop GPU, Micron 3400 1TB MTFDKBA1T0TFH, IPS LED, 2560x1600, 16" | MSI CreatorPro Z16P B12UKST i7-12700H, RTX A3000 Laptop GPU, Samsung PM9A1 MZVL21T0HCLR, IPS, 2560x1600, 16" | HP ZBook Studio 16 G9 62U04EA i7-12800H, RTX A2000 Laptop GPU, Micron 3400 1TB MTFDKBA1T0TFH, IPS, 3840x2400, 16" | |
|---|---|---|---|---|---|---|
| Power Consumption | 14% | -35% | 45% | 19% | 28% | |
| Idle Minimum * (Watt) | 7.5 | 12.4 -65% | 16.4 -119% | 5.1 32% | 10.8 -44% | 7.2 4% |
| Idle Average * (Watt) | 20.1 | 16.5 18% | 35.9 -79% | 9.2 54% | 16.3 19% | 18.1 10% |
| Idle Maximum * (Watt) | 40 | 25 37% | 47 -18% | 9.9 75% | 16.9 58% | 18.5 54% |
| Load Average * (Watt) | 137 | 132 4% | 147.1 -7% | 124.1 9% | 111.7 18% | 112.8 18% |
| Witcher 3 ultra * (Watt) | 208 | 132 37% | 158.8 24% | 87.7 58% | 152.1 27% | 106.7 49% |
| Load Maximum * (Watt) | 285.9 | 134 53% | 311 -9% | 168.9 41% | 177.4 38% | 186 35% |
* ... a kisebb jobb
Power Consumption Witcher 3 / Stresstest
Power Consumption external Monitor
| Lenovo ThinkPad P16 G1 RTX A5500 i9-12950HX, RTX A5500 Laptop GPU, 94 Wh | Asus ProArt StudioBook 16 W7600H5A-2BL2 W-11955M, RTX A5000 Laptop GPU, 90 Wh | Dell Precision 7000 7670 Performance i9-12950HX, RTX A5500 Laptop GPU, 93 Wh | Lenovo ThinkPad P16 G1 21D6001DMB i7-12850HX, RTX A2000 Laptop GPU, 94 Wh | MSI CreatorPro Z16P B12UKST i7-12700H, RTX A3000 Laptop GPU, 90 Wh | HP ZBook Studio 16 G9 62U04EA i7-12800H, RTX A2000 Laptop GPU, 86 Wh | |
|---|---|---|---|---|---|---|
| Akkumulátor üzemidő | -14% | -19% | 62% | 0% | 9% | |
| WiFi v1.3 (h) | 5.8 | 5 -14% | 4.7 -19% | 9.4 62% | 5.8 0% | 6.3 9% |
| H.264 (h) | 1.8 | 8.5 | ||||
| Witcher 3 ultra (h) | 1.6 | |||||
| Load (h) | 1.8 | 1.1 |
Pro
Kontra
Összegzés - A 230 wattos Hálózati Adapter Nem Elegendő
Tisztán teljesítmény szempontjából a ThinkPad P16 G1 az egyik leggyorsabb mobil munkaállomás, amely jelenleg kapható, függetlenül a képernyő méretétől. A Core i9-12950HX CPU és az RTX A5500 GPU enyhén, de következetesen felülmúlja a Precision 7670-et, még akkor is, ha a Dell modell hasonló processzor opciókkal rendelkezik.
Két kulcsfontosságú hátránya van, amelyeket reméljük, hogy a Lenovo a jövőbeli iterációkban ki tud majd javítani. Először is, a CPU hőmérséklete az átlagosnál jóval melegebb a nagyobb terhelések futtatásakor. A magas hőmérséklet természetesen nem váratlan, de a 100 C-os csúcshőmérséklet egyszerűen túl meleg ahhoz, hogy nyugodtak maradjunk, amikor ugyanez a CPU a fent említett Dell modellben hasonló körülmények között alig érné el a 80 C-os csúcsot. Talán ez a magas hőmérséklet az ára a kissé nagyobb teljesítménynek.
Másodszor, a 230 wattos hálózati adapter vért izzad azért, hogy biztosíthassa a több mint 100 wattos CPU és a 130 wattos GPU tápellátását. Az erőfeszítés nagyobb terhelések futtatásakor megfigyelhető, mivel a rendszer töltési sebessége jelentősen lelassul, sőt, bizonyos helyzetekben az akkumulátor elkezd merülni. Ha 285 W-os maximális fogyasztást tudunk mérni egy mindössze 230 W-os hálózati adapteren, akkor itt egyértelműen gond van. Egy nagyobb, 280 vagy 330 W-os hálózati adapter megfelelőbb lett volna, a mi konfigurációnk szintjét figyelembe véve.
A ThinkPad P16 Gen 1 akkor is maximalizálja a teljesítményt, ha ez nagyobb energiafogyasztást és magasabb hőmérsékletet jelent. A 230 W-os hálózati adapter azonban talán túl konzervatív, tekintve a tesztelt csúcskonfiguráció nagyon energiaigényes processzorait.
Az összességében nagy rendszerteljesítmény viszont a magas hőmérséklet és az elégtelen 230 W-os hálózati adapter ellenére is tagadhatatlan. A jó töltési sebesség érdekében mindenképpen érdemes kilépni az igényesebb alkalmazásokból.
Ár és Elérhetőség
Lenovo ThinkPad P16 G1 RTX A5500
- 02/06/2023 v7 (old)
Allen Ngo
Átláthatóság
A felülvizsgálandó készülékek kiválasztását szerkesztőségünk végzi. A tesztmintát a gyártó vagy a kiskereskedő kölcsönként bocsátotta a szerző rendelkezésére a felülvizsgálat céljából. A hitelezőnek nem volt befolyása erre a felülvizsgálatra, és a gyártó sem kapott másolatot erről a felülvizsgálatról a közzététel előtt. Nem volt kötelesség ezt az ismertetőt közzétenni. Független médiavállalatként a Notebookcheck nincs alávetve a gyártók, kiskereskedők vagy kiadók felhatalmazásának.
Így tesztel a Notebookcheck
A Notebookcheck minden évben független, laptopok és okostelefonok százait vizsgálja meg szabványosított eljárások alkalmazásával annak érdekében, hogy minden eredmény összehasonlítható legyen. Körülbelül 20 éve folyamatosan fejlesztjük vizsgálati módszereinket, és ennek során iparági szabványokat állítottunk fel. Tesztlaboratóriumainkban kiváló minőségű mérőberendezéseket használnak tapasztalt technikusok és szerkesztők. Ezek a tesztek többlépcsős validációs folyamatot foglalnak magukban. Komplex minősítési rendszerünk több száz megalapozott mérésen és benchmarkon alapul, ami megőrzi az objektivitást.Price comparison

