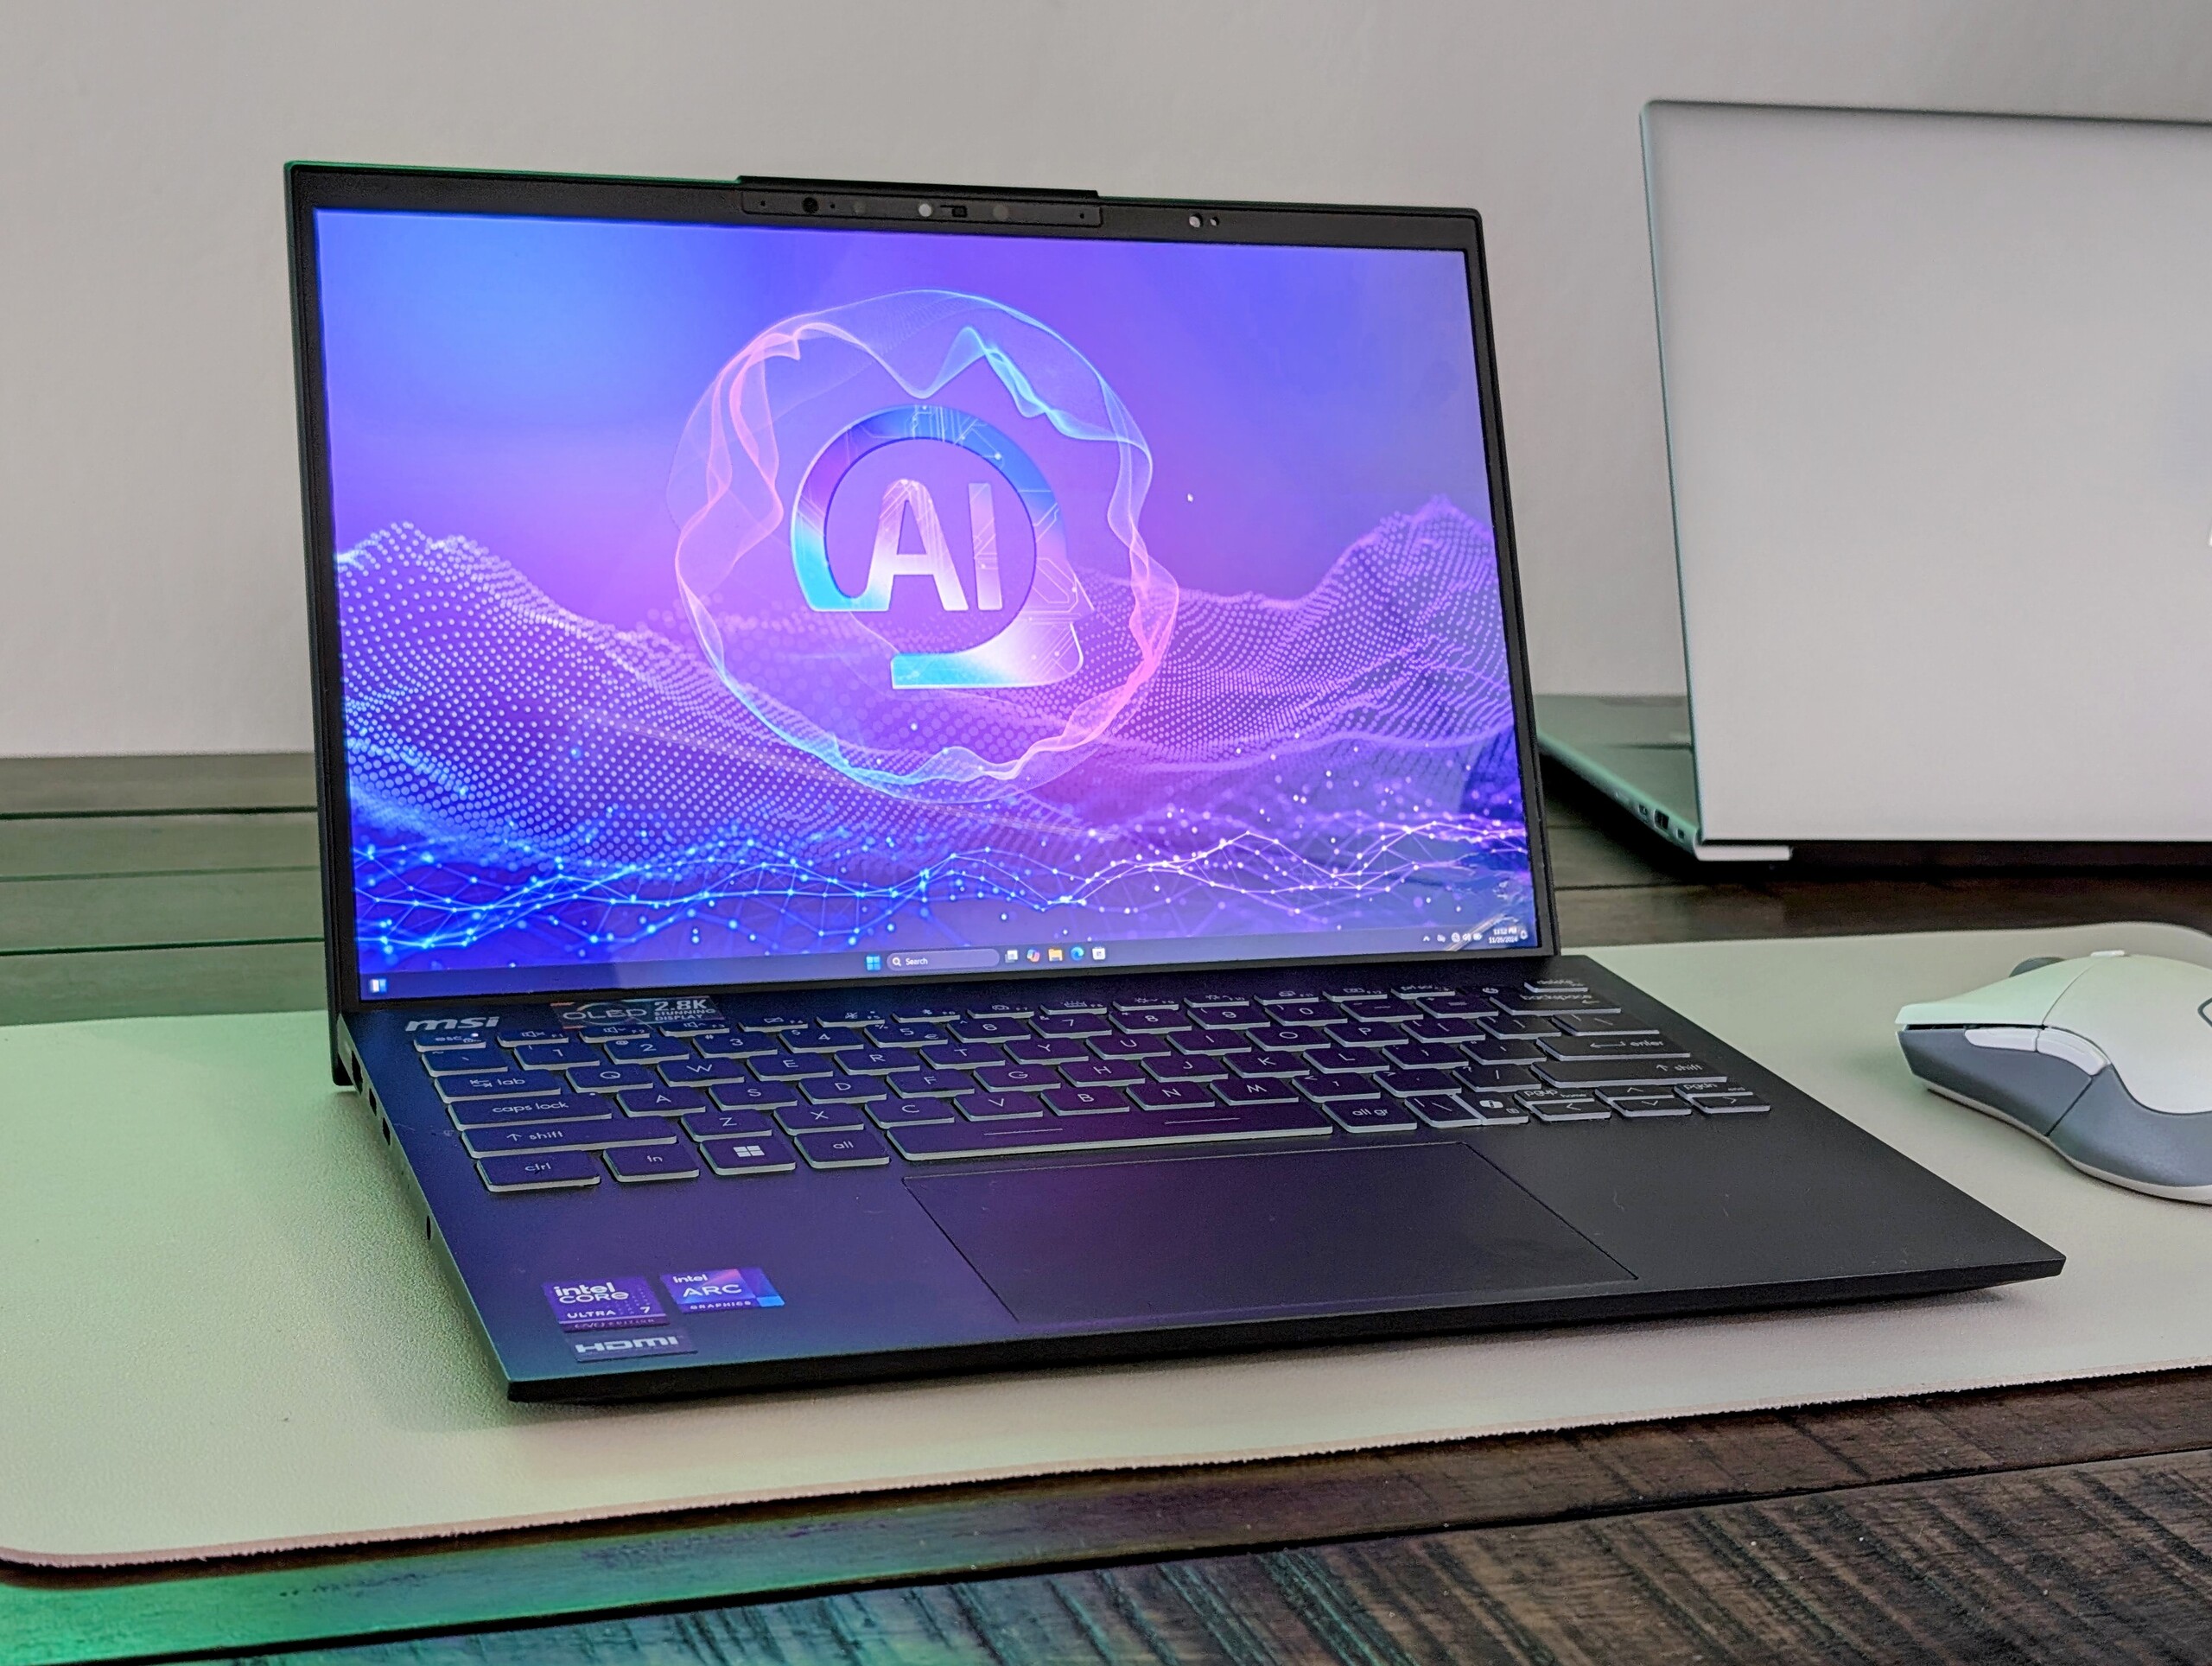
MSI Prestige 13 AI Plus Evo laptop felülvizsgálata: Nagyszerű grafikus teljesítmény 1 kg alatt
Core Ultra 7 258V vs. Core Ultra 7 155H.
Az MSI felfrissítette legkönnyebb 13 hüvelykes laptopját Lunar Lake processzorokkal a régebbi Meteor Lake opciók helyett. A változtatásoknak köszönhetően mind az akkumulátoros üzemidő, mind a grafikus potenciál növekedett anélkül, hogy a ventilátorok zaja vagy a súly növekedett volna.Allen Ngo, 👁 Allen Ngo (fordította DeepL / Ninh Duy) Közzétett 🇺🇸 🇫🇷 ...
Ítélet - Lenyűgöző teljesítmény és portok a súlyhoz képest
Az egyik fő panaszunk az eredeti Prestige 13 AI Evo-val kapcsolatban az volt, hogy a vártnál meredekebb volt a processzor throttlingja, amikor CPU-intenzív terhelést futtattunk. Az új Lunar Lake CPU úgy orvosolja ezt a problémát, hogy csökkenti a maximális Turbo Boost potenciált, miközben emeli a minimális teljesítményszintet ilyen terhelések futtatása esetén. Ez idővel egyenletesebb és gyorsabb teljesítményt tett lehetővé, ami a tartalomkészítők vagy szerkesztők számára vonzó lehet, akiknek nagyobb fájlokat vagy videókat kell feldolgozniuk vagy kódolniuk. Ráadásul úgy tűnik, hogy ezek az előnyök nem befolyásolják észrevehetően az akkumulátor élettartamát, a hőmérsékletet vagy a ventilátor zaját a Prestige 13 AI Evo és az újabb Prestige 13 AI Plus Evo között.
A grafikus teljesítmény jelentősen megnőtt. 1,5-2-szeresére az alkalmazástól függően. Bár messze nem egy játékgép, az Arc 140V mégis lenyűgöző, tekintve, hogy milyen könnyű az MSI laptop.
Bár a teljesítmény szinte mindenhol javult, a Prestige 13 AI Evo értékelésünkben említett összes többi hátránya változatlan maradt. Az 1800p OLED kijelző, bár éles és élénk, csak 60 Hz-re korlátozódik, és nincs VRR vagy érintőképernyő opció. A webkamera minősége és az alváz merevsége is néhány lépéssel hátrébb van, mint a nehezebb alternatíváké a következőktől Dell vagy a HP. Ennek ellenére az MSI sok teljesítményt és portot kínál, tekintve, hogy milyen könnyű.
Pro
Kontra
Ár és elérhetőség
Az Amazon most szállítja az MSI Prestige 13 AI Plus Evo-t, ahogyan azt $1400 USD-ért áttekintették.
Lehetséges versenytársak összehasonlításban
Kép | Modell / Review | Legjobb ár | Súly | Magasság | Kijelző |
|---|---|---|---|---|---|
| MSI Prestige 13 AI Plus Evo A2VMG Intel Core Ultra 7 258V ⎘ Intel Arc Graphics 140V ⎘ 32 GB Memória | Amazon: List Price: 1400 USD | 970 g | 16.9 mm | 13.30" 2880x1800 255 PPI OLED | |
| MSI Prestige 13 AI Evo Intel Core Ultra 7 155H ⎘ Intel Arc 8-Core iGPU ⎘ 32 GB Memória, 1024 GB SSD | Amazon: List Price: 1599€ | 967 g | 16.9 mm | 13.30" 2880x1800 OLED | |
| Dell XPS 13 9350 Intel Core Ultra 7 256V ⎘ Intel Arc Graphics 140V ⎘ 16 GB Memória, 512 GB SSD | Amazon: 1. Dell XPS 13 9350 AI Business... 2. Dell XPS 13 9350 AI Business... 3. JD25G 90V7W 0N7T6 P54G 5K9CP... List Price: 1400 USD | 1.2 kg | 15.3 mm | 13.40" 1920x1200 169 PPI IPS | |
| Framework Laptop 13.5 Core Ultra 7 155H Intel Core Ultra 7 155H ⎘ Intel Arc 8-Core iGPU ⎘ 32 GB Memória | List Price: 1500 USD | 1.4 kg | 15.85 mm | 13.50" 2880x1920 256 PPI IPS | |
| Lenovo Yoga Book 9 13IMU9 Intel Core Ultra 7 155U ⎘ Intel Graphics 4-Core iGPU (Meteor / Arrow Lake) ⎘ 16 GB Memória | List Price: 2000 USD | 1.4 kg | 15.95 mm | 13.30" 2880x1800 255 PPI OLED | |
| HP Dragonfly G4 Intel Core i7-1365U ⎘ Intel Iris Xe Graphics G7 96EUs ⎘ 16 GB Memória, 512 GB SSD | Amazon: List Price: 1700 USD | 1.1 kg | 16.3 mm | 13.50" 1920x1280 171 PPI IPS |
Mindössze hat hónap telt el az eredeti Prestige 13 AI Evo megjelenése óta, és az MSI máris felfrissítette a modellt újabb Intel processzorokkal. A Prestige 13 AI Plus Evo névre keresztelt legújabb iteráció a Meteor Lake helyett Lunar Lake CPU-kkal érkezik.
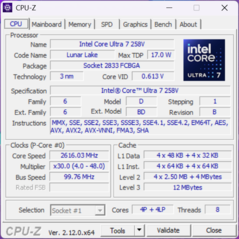
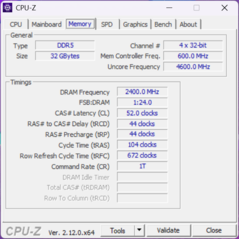
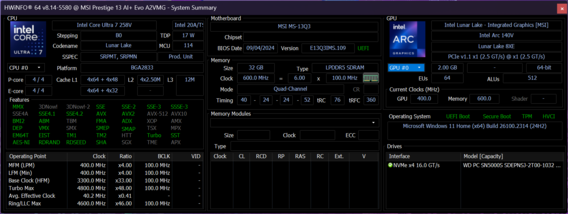
Tesztkészülékünk egy középső konfiguráció Core Ultra 7 258V-vel, 32 GB LPDDR5x-8533 RAM-mal és 1800p OLED kijelzővel, körülbelül 1400 dollárért. Más SKU-kat Core Ultra 9 288V vagy Core Ultra 7 256V helyett Core Ultra 7 256V-vel szállítanak, feleannyi RAM-mal.
A versenytársak közé tartoznak más csúcskategóriás szubnotebookok, mint például a Dell XPS 13 9350, Framework Laptop 13.5vagy a HP Dragonfly 14.
További MSI értékelések:
Műszaki adatok
» A Top 10 multimédiás noteszgép - tesztek alapján
» A Top 10 játékos noteszgép
» A Top 10 belépő szintű üzleti noteszgép
» A Top 10 üzleti noteszgép
» A Top 10 notebook munkaállomása
» A Top 10 okostelefon - tesztek alapján
» A Top 10 táblagép
» A Top 10 Windows tabletje
» A Top 10 subnotebook - tesztek alapján
» A Top 10 300 euró alatti okostelefonja
» A Top 10 120 euró alatti okostelefonja
» A Top 10 phabletje (>5.5-inch)
» A Top 10 noteszgép 500 EUR (~160.000 HUF) alatt
» A Top 10 "pehelysúlyú" gaming notebookja
Ügy
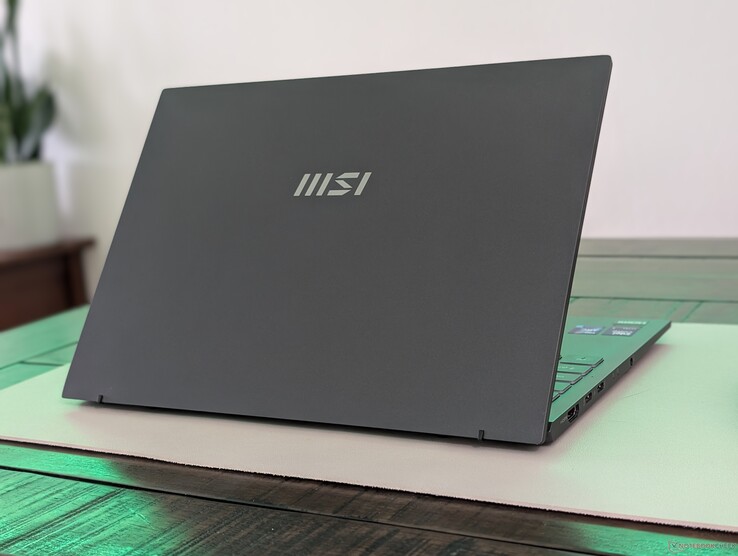
Javasoljuk, hogy tekintse meg a Prestige 13 AI Evo felülvizsgálatát, mivel nincsenek külső különbségek a Prestige 13 AI Plus Evo és a Prestige 13 AI Plus Evo között. A rendszer az egyik legkönnyebb 13 hüvelykes szubnotebook a piacon a maga 1 kg alatti súlyával, de a váz hajlamosabb hajlítani és nyikorogni, mint az XPS 13-hoz hasonló nehezebb modellek esetében.
Csatlakoztathatóság
A Prestige 13 AI egyike azon kevés megmaradt szubnotebookoknak, amelyek integrált HDMI és USB-A porttal is rendelkeznek. Nagyra értékeljük, hogy a rendszer nem támaszkodik teljesen csak az USB-C portokra.
SD kártyaolvasó
| SD Card Reader | |
| average JPG Copy Test (av. of 3 runs) | |
| Framework Laptop 13.5 Core Ultra 7 155H (Toshiba Exceria Pro SDXC 64 GB UHS-II) | |
| MSI Prestige 13 AI Evo (Angelbird AV Pro V60) | |
| MSI Prestige 13 AI Plus Evo A2VMG (Angelbird AV Pro V60) | |
| maximum AS SSD Seq Read Test (1GB) | |
| Framework Laptop 13.5 Core Ultra 7 155H (Toshiba Exceria Pro SDXC 64 GB UHS-II) | |
| MSI Prestige 13 AI Evo (Angelbird AV Pro V60) | |
| MSI Prestige 13 AI Plus Evo A2VMG (Angelbird AV Pro V60) | |
Kommunikáció
Érdekes módon a mi készülékünket az Intel Killer AX1775-ös Intel Killer AX1775-össel szállítják a Core Ultra 7 155H konfigurációban található BE1750W helyett. Az AX1775s nem támogatja a Wi-Fi 7-et, ellentétben a BE1750W-vel.
| Networking | |
| iperf3 transmit AXE11000 | |
| MSI Prestige 13 AI Evo | |
| HP Dragonfly G4 | |
| Dell XPS 13 9350 | |
| Lenovo Yoga Book 9 13IMU9 | |
| Framework Laptop 13.5 Core Ultra 7 155H | |
| MSI Prestige 13 AI Plus Evo A2VMG | |
| iperf3 receive AXE11000 | |
| MSI Prestige 13 AI Evo | |
| Lenovo Yoga Book 9 13IMU9 | |
| HP Dragonfly G4 | |
| Framework Laptop 13.5 Core Ultra 7 155H | |
| Dell XPS 13 9350 | |
| MSI Prestige 13 AI Plus Evo A2VMG | |
| iperf3 transmit AXE11000 6GHz | |
| MSI Prestige 13 AI Plus Evo A2VMG | |
| HP Dragonfly G4 | |
| Dell XPS 13 9350 | |
| Framework Laptop 13.5 Core Ultra 7 155H | |
| Lenovo Yoga Book 9 13IMU9 | |
| iperf3 receive AXE11000 6GHz | |
| Dell XPS 13 9350 | |
| MSI Prestige 13 AI Plus Evo A2VMG | |
| HP Dragonfly G4 | |
| Framework Laptop 13.5 Core Ultra 7 155H | |
| Lenovo Yoga Book 9 13IMU9 | |
Webkamera
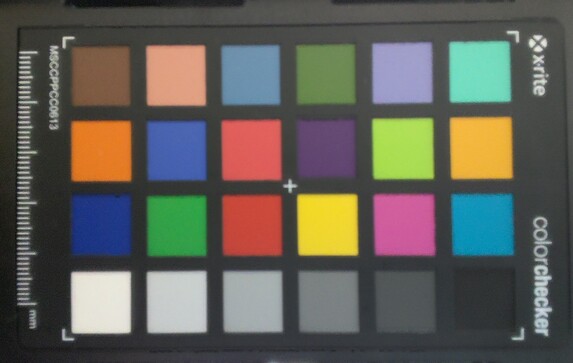
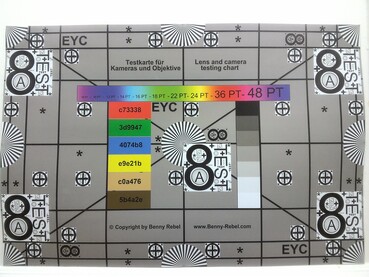
A webkamera minősége az eredeti modell 2 MP-ről 5 MP-re javult az élesebb képek érdekében.
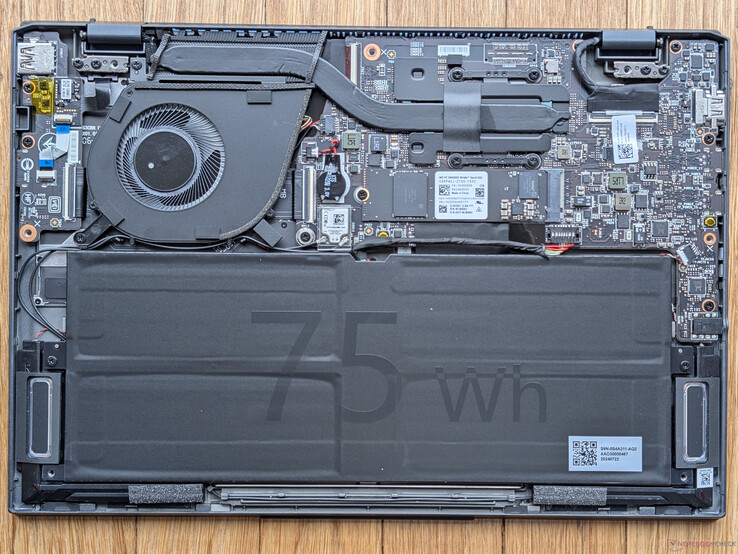
Karbantartás
Fenntarthatóság
A modell az EPEAT Silver fenntarthatósági irányelveit követi, míg a csomagolás többnyire kartonból és papírból áll, némi műanyag csomagolással a laptop és a hálózati adapter körül.
Megjelenítés
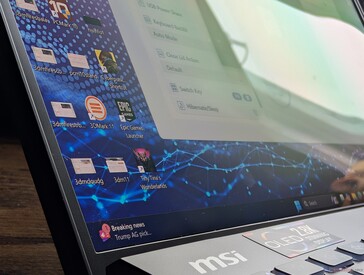
Az 1800p-s Samsung OLED kijelző ugyanaz marad, mint korábban. Bár a képminőség kiváló, és nincsenek szemcsésedési problémák, jobban örültünk volna egy frissítési frekvencia frissítésnek 90 Hz-re vagy 120 Hz-re, mivel a 60 Hz kezd elavultnak tűnni egy csúcskategóriás szubnotebook esetében.
A maximális fényerő HDR módban akár 598 nits is lehet. Egyébként SDR üzemmódban 382 nitnél éri el a csúcsot.
| |||||||||||||||||||||||||
Fényerő megoszlás: 99 %
Centrumban: 382.4 cd/m²
Kontraszt: ∞:1 (Fekete: 0 cd/m²)
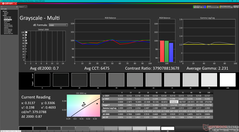
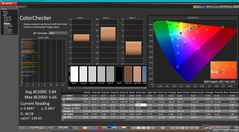
ΔE ColorChecker Calman: 3.84 | ∀{0.5-29.43 Ø4.76}
calibrated: 0.41
ΔE Greyscale Calman: 0.7 | ∀{0.09-98 Ø5}
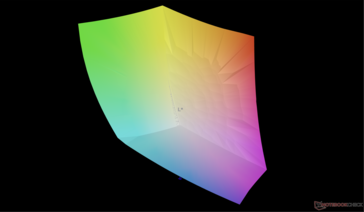
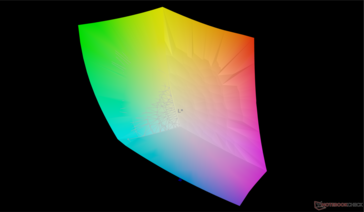
95.8% AdobeRGB 1998 (Argyll 3D)
100% sRGB (Argyll 3D)
99.9% Display P3 (Argyll 3D)
Gamma: 2.23
CCT: 6475 K
| MSI Prestige 13 AI Plus Evo A2VMG ATNA33AA07-0, OLED, 2880x1800, 13.3", 60 Hz | MSI Prestige 13 AI Evo ATNA33AA07-0, OLED, 2880x1800, 13.3", 60 Hz | Dell XPS 13 9350 LG Philips 134WU2, IPS, 1920x1200, 13.4", 120 Hz | Framework Laptop 13.5 Core Ultra 7 155H BOE NE135A1M-NY1, IPS, 2880x1920, 13.5", 120 Hz | Lenovo Yoga Book 9 13IMU9 SDC ATNA33AA02-0, OLED, 2880x1800, 13.3", 60 Hz | HP Dragonfly G4 Chi Mei CMN13C0, IPS, 1920x1280, 13.5", 60 Hz | |
|---|---|---|---|---|---|---|
| Display | 1% | -21% | -17% | 0% | -20% | |
| Display P3 Coverage (%) | 99.9 | 99.9 0% | 67.3 -33% | 72.8 -27% | 99.7 0% | 68.4 -32% |
| sRGB Coverage (%) | 100 | 100 0% | 99 -1% | 98.6 -1% | 100 0% | 98.3 -2% |
| AdobeRGB 1998 Coverage (%) | 95.8 | 97.8 2% | 68.6 -28% | 72.9 -24% | 97 1% | 70.4 -27% |
| Response Times | 25% | -1503% | -1567% | -1% | -1933% | |
| Response Time Grey 50% / Grey 80% * (ms) | 1.94 ? | 1.54 ? 21% | 37.3 ? -1823% | 41.9 ? -2060% | 1.88 ? 3% | 48.8 ? -2415% |
| Response Time Black / White * (ms) | 2.02 ? | 1.44 ? 29% | 25.9 ? -1182% | 23.7 ? -1073% | 2.1 ? -4% | 31.3 ? -1450% |
| PWM Frequency (Hz) | 60 ? | 240 ? | 60 ? | |||
| PWM Amplitude * (%) | 21.9 | |||||
| Screen | 3% | 17% | -108% | -50% | -27% | |
| Brightness middle (cd/m²) | 382.4 | 404 6% | 462.8 21% | 498.5 30% | 362.6 -5% | 408.8 7% |
| Brightness (cd/m²) | 383 | 407 6% | 435 14% | 464 21% | 368 -4% | 399 4% |
| Brightness Distribution (%) | 99 | 98 -1% | 87 -12% | 86 -13% | 97 -2% | 90 -9% |
| Black Level * (cd/m²) | 0.19 | 0.36 | 0.32 | |||
| Colorchecker dE 2000 * | 3.84 | 2.1 45% | 1.92 50% | 4.27 -11% | 4.66 -21% | 2.02 47% |
| Colorchecker dE 2000 max. * | 6.66 | 4.3 35% | 3.45 48% | 7.08 -6% | 7.25 -9% | 3.84 42% |
| Colorchecker dE 2000 calibrated * | 0.41 | 0.48 -17% | 1.26 -207% | 0.56 -37% | 0.61 -49% | |
| Greyscale dE 2000 * | 0.7 | 1.2 -71% | 0.6 14% | 4.7 -571% | 2.6 -271% | 2.3 -229% |
| Gamma | 2.23 99% | 2.16 102% | 2.19 100% | 2.09 105% | 2.2 100% | 2.2 100% |
| CCT | 6475 100% | 6465 101% | 6539 99% | 7417 88% | 6055 107% | 6203 105% |
| Contrast (:1) | 2436 | 1385 | 1278 | |||
| Teljes átlag (program / beállítások) | 10% /
7% | -502% /
-246% | -564% /
-329% | -17% /
-29% | -660% /
-343% |
* ... a kisebb jobb
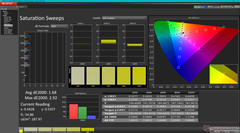
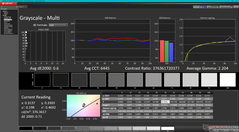
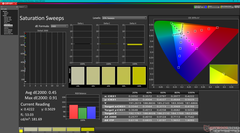
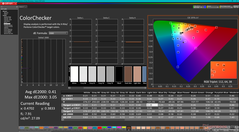
A kijelző a dobozból kivéve jól kalibrált a P3 szabványhoz képest, az átlagos szürkeárnyalat- és ColorChecker deltaE-értékek mindössze 0,7, illetve 3,84 értékek.
Megjelenítési válaszidők
| ↔ Válaszidő Fekete-fehér | ||
|---|---|---|
| 2.02 ms ... emelkedés és süllyedés ↘ kombinálva | ↗ 0.92 ms emelkedés | |
| ↘ 1.1 ms ősz | ||
| A képernyő tesztjeinkben nagyon gyors reakciósebességet mutatott, és nagyon jól használható gyors tempójú játékokhoz. Összehasonlításképpen, az összes tesztelt eszköz 0.1 (minimum) és 240 (maximum) ms között mozog. » 11 % of all devices are better. Ez azt jelenti, hogy a mért válaszidő jobb, mint az összes vizsgált eszköz átlaga (20.1 ms). | ||
| ↔ Válaszidő 50% szürke és 80% szürke között | ||
| 1.94 ms ... emelkedés és süllyedés ↘ kombinálva | ↗ 1 ms emelkedés | |
| ↘ 0.94 ms ősz | ||
| A képernyő tesztjeinkben nagyon gyors reakciósebességet mutatott, és nagyon jól használható gyors tempójú játékokhoz. Összehasonlításképpen, az összes tesztelt eszköz 0.165 (minimum) és 636 (maximum) ms között mozog. » 9 % of all devices are better. Ez azt jelenti, hogy a mért válaszidő jobb, mint az összes vizsgált eszköz átlaga (31.5 ms). | ||
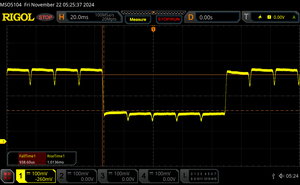
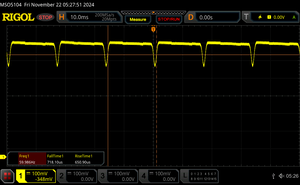
Képernyő villogása / PWM (impulzusszélesség-moduláció)
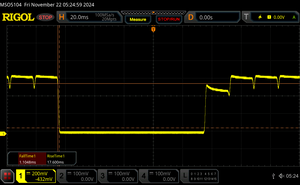
| Képernyő villogása / PWM észlelve | 60 Hz Amplitude: 21.9 % | ≤ 100 % fényerő beállítása | |
A kijelző háttérvilágítása 60 Hz-en villog (a legrosszabb esetben, pl. PWM használatával) Villódzás észlelve a 100 % vagy annál kisebb fényerő-beállításnál. E fényerő-beállítás felett nem lehet villogás vagy PWM. A 60 Hz frekvenciája nagyon alacsony, így a villogás hosszabb használat után szemfájdalmat és fejfájást okozhat. Összehasonlításképpen: az összes tesztelt eszköz 53 %-a nem használja a PWM-et a kijelző elsötétítésére. Ha PWM-et észleltek, akkor átlagosan 8036 (minimum: 5 - maximum: 343500) Hz-t mértek. | |||
Teljesítmény
Vizsgálati feltételek
Az alábbi összehasonlító tesztek futtatása előtt mind a Windowst, mind az MSI Központot teljesítmény üzemmódba állítottuk. A Cooler Boost üzemmód (más néven maximális ventilátor üzemmód) is elérhető, de ez nem befolyásolja jelentősen a teljesítményt, ahogy az alábbi benchmarkjaink is mutatják.
Processzor
A Core Ultra 7 155H-hoz képest a Core Ultra 7 258V lassabb Turbo Boost potenciállal rendelkezik, de hosszabb távon egyenletesebb és gyorsabb teljesítményt nyújt. Ez nyilvánvaló a CineBench R15 xT ciklusban történő futtatásakor, amint azt az alábbi grafikon is mutatja, ahol a Core Ultra 7 155H konfiguráció csak a teszt kezdetén teljesít jobban, mint a Core Ultra 7 258V konfigurációnk, mielőtt végül már az első ciklus után erősebben lecsökkenne.
Cinebench R15 Multi Loop
Cinebench R23: Multi Core | Single Core
Cinebench R20: CPU (Multi Core) | CPU (Single Core)
Cinebench R15: CPU Multi 64Bit | CPU Single 64Bit
Blender: v2.79 BMW27 CPU
7-Zip 18.03: 7z b 4 | 7z b 4 -mmt1
Geekbench 6.5: Multi-Core | Single-Core
Geekbench 5.5: Multi-Core | Single-Core
HWBOT x265 Benchmark v2.2: 4k Preset
LibreOffice : 20 Documents To PDF
R Benchmark 2.5: Overall mean
| CPU Performance rating | |
| Asus ProArt PX13 HN7306 | |
| Lenovo ThinkPad Z13 Gen 2 | |
| Framework Laptop 13.5 Core Ultra 7 155H | |
| MSI Prestige 13 AI Plus Evo A2VMG | |
| Dell XPS 13 9350 | |
| Átlagos Intel Core Ultra 7 258V | |
| Lenovo ThinkPad X13 Gen 4 21J3001VGE | |
| MSI Prestige 13 AI Evo | |
| HP Dragonfly G4 -2! | |
| Dell Latitude 13 7350 | |
| Asus ZenBook S13 OLED UX5304 -2! | |
| Lenovo ThinkPad X13 2-in-1 Gen 5 | |
| Dell Latitude 7350 Detachable | |
| Dell XPS 13 Plus 9320 i5-1240p -2! | |
| Lenovo ThinkPad X13 G3 21CM002UGE -2! | |
| HP Elite Dragonfly G3 -2! | |
| Lenovo Yoga 6 13ALC6 -4! | |
| Cinebench R23 / Multi Core | |
| Asus ProArt PX13 HN7306 | |
| Lenovo ThinkPad Z13 Gen 2 | |
| Framework Laptop 13.5 Core Ultra 7 155H | |
| MSI Prestige 13 AI Plus Evo A2VMG | |
| Lenovo ThinkPad X13 Gen 4 21J3001VGE | |
| Dell XPS 13 9350 | |
| Átlagos Intel Core Ultra 7 258V (7920 - 11097, n=23) | |
| MSI Prestige 13 AI Evo | |
| Dell XPS 13 Plus 9320 i5-1240p | |
| Dell Latitude 13 7350 | |
| Dell Latitude 7350 Detachable | |
| Lenovo ThinkPad X13 2-in-1 Gen 5 | |
| Lenovo ThinkPad X13 G3 21CM002UGE | |
| HP Dragonfly G4 | |
| Lenovo Yoga 6 13ALC6 | |
| Asus ZenBook S13 OLED UX5304 | |
| HP Elite Dragonfly G3 | |
| Cinebench R23 / Single Core | |
| Asus ProArt PX13 HN7306 | |
| HP Dragonfly G4 | |
| Dell XPS 13 9350 | |
| Átlagos Intel Core Ultra 7 258V (1664 - 1957, n=23) | |
| MSI Prestige 13 AI Plus Evo A2VMG | |
| Framework Laptop 13.5 Core Ultra 7 155H | |
| Asus ZenBook S13 OLED UX5304 | |
| Lenovo ThinkPad X13 Gen 4 21J3001VGE | |
| Lenovo ThinkPad Z13 Gen 2 | |
| MSI Prestige 13 AI Evo | |
| Dell XPS 13 Plus 9320 i5-1240p | |
| Dell Latitude 7350 Detachable | |
| Dell Latitude 13 7350 | |
| HP Elite Dragonfly G3 | |
| Lenovo ThinkPad X13 2-in-1 Gen 5 | |
| Lenovo ThinkPad X13 G3 21CM002UGE | |
| Lenovo Yoga 6 13ALC6 | |
| Cinebench R20 / CPU (Multi Core) | |
| Asus ProArt PX13 HN7306 | |
| Lenovo ThinkPad Z13 Gen 2 | |
| Framework Laptop 13.5 Core Ultra 7 155H | |
| MSI Prestige 13 AI Plus Evo A2VMG | |
| Lenovo ThinkPad X13 Gen 4 21J3001VGE | |
| Dell XPS 13 9350 | |
| Átlagos Intel Core Ultra 7 258V (3130 - 4314, n=23) | |
| MSI Prestige 13 AI Evo | |
| Dell Latitude 13 7350 | |
| Dell XPS 13 Plus 9320 i5-1240p | |
| Lenovo ThinkPad X13 2-in-1 Gen 5 | |
| Dell Latitude 7350 Detachable | |
| Lenovo ThinkPad X13 G3 21CM002UGE | |
| Lenovo Yoga 6 13ALC6 | |
| HP Dragonfly G4 | |
| Asus ZenBook S13 OLED UX5304 | |
| HP Elite Dragonfly G3 | |
| Cinebench R20 / CPU (Single Core) | |
| Asus ProArt PX13 HN7306 | |
| Dell XPS 13 9350 | |
| Átlagos Intel Core Ultra 7 258V (643 - 749, n=23) | |
| MSI Prestige 13 AI Plus Evo A2VMG | |
| HP Dragonfly G4 | |
| Asus ZenBook S13 OLED UX5304 | |
| Lenovo ThinkPad Z13 Gen 2 | |
| Framework Laptop 13.5 Core Ultra 7 155H | |
| Lenovo ThinkPad X13 Gen 4 21J3001VGE | |
| MSI Prestige 13 AI Evo | |
| Dell XPS 13 Plus 9320 i5-1240p | |
| Dell Latitude 13 7350 | |
| Lenovo ThinkPad X13 2-in-1 Gen 5 | |
| Dell Latitude 7350 Detachable | |
| HP Elite Dragonfly G3 | |
| Lenovo ThinkPad X13 G3 21CM002UGE | |
| Lenovo Yoga 6 13ALC6 | |
| Cinebench R15 / CPU Multi 64Bit | |
| Asus ProArt PX13 HN7306 | |
| Framework Laptop 13.5 Core Ultra 7 155H | |
| Lenovo ThinkPad Z13 Gen 2 | |
| MSI Prestige 13 AI Evo | |
| Dell Latitude 13 7350 | |
| MSI Prestige 13 AI Plus Evo A2VMG | |
| Dell XPS 13 Plus 9320 i5-1240p | |
| Lenovo ThinkPad X13 Gen 4 21J3001VGE | |
| Dell XPS 13 9350 | |
| Átlagos Intel Core Ultra 7 258V (1280 - 1656, n=23) | |
| Lenovo ThinkPad X13 2-in-1 Gen 5 | |
| Asus ZenBook S13 OLED UX5304 | |
| HP Dragonfly G4 | |
| Dell Latitude 7350 Detachable | |
| Lenovo ThinkPad X13 G3 21CM002UGE | |
| HP Elite Dragonfly G3 | |
| Lenovo Yoga 6 13ALC6 | |
| Cinebench R15 / CPU Single 64Bit | |
| Asus ProArt PX13 HN7306 | |
| Dell XPS 13 9350 | |
| Átlagos Intel Core Ultra 7 258V (258 - 298, n=23) | |
| MSI Prestige 13 AI Plus Evo A2VMG | |
| Lenovo ThinkPad Z13 Gen 2 | |
| HP Dragonfly G4 | |
| Framework Laptop 13.5 Core Ultra 7 155H | |
| Lenovo ThinkPad X13 Gen 4 21J3001VGE | |
| Asus ZenBook S13 OLED UX5304 | |
| MSI Prestige 13 AI Evo | |
| Lenovo ThinkPad X13 G3 21CM002UGE | |
| Dell Latitude 13 7350 | |
| Dell XPS 13 Plus 9320 i5-1240p | |
| Dell Latitude 7350 Detachable | |
| HP Elite Dragonfly G3 | |
| Lenovo ThinkPad X13 2-in-1 Gen 5 | |
| Lenovo Yoga 6 13ALC6 | |
| Blender / v2.79 BMW27 CPU | |
| Lenovo ThinkPad X13 G3 21CM002UGE | |
| Lenovo ThinkPad X13 G3 21CM002UGE | |
| HP Elite Dragonfly G3 | |
| Asus ZenBook S13 OLED UX5304 | |
| Asus ZenBook S13 OLED UX5304 | |
| HP Dragonfly G4 | |
| Dell Latitude 7350 Detachable | |
| Lenovo ThinkPad X13 Gen 4 21J3001VGE | |
| Lenovo ThinkPad X13 2-in-1 Gen 5 | |
| Lenovo Yoga 6 13ALC6 | |
| Dell XPS 13 Plus 9320 i5-1240p | |
| Dell Latitude 13 7350 | |
| Átlagos Intel Core Ultra 7 258V (315 - 452, n=23) | |
| MSI Prestige 13 AI Evo | |
| Dell XPS 13 9350 | |
| MSI Prestige 13 AI Plus Evo A2VMG | |
| Framework Laptop 13.5 Core Ultra 7 155H | |
| Lenovo ThinkPad Z13 Gen 2 | |
| Asus ProArt PX13 HN7306 | |
| 7-Zip 18.03 / 7z b 4 | |
| Asus ProArt PX13 HN7306 | |
| Lenovo ThinkPad Z13 Gen 2 | |
| Framework Laptop 13.5 Core Ultra 7 155H | |
| MSI Prestige 13 AI Evo | |
| Dell XPS 13 Plus 9320 i5-1240p | |
| Lenovo Yoga 6 13ALC6 | |
| Dell Latitude 13 7350 | |
| Lenovo ThinkPad X13 G3 21CM002UGE | |
| Dell XPS 13 9350 | |
| MSI Prestige 13 AI Plus Evo A2VMG | |
| Átlagos Intel Core Ultra 7 258V (28482 - 36724, n=23) | |
| Lenovo ThinkPad X13 Gen 4 21J3001VGE | |
| HP Dragonfly G4 | |
| Asus ZenBook S13 OLED UX5304 | |
| Lenovo ThinkPad X13 2-in-1 Gen 5 | |
| HP Elite Dragonfly G3 | |
| Dell Latitude 7350 Detachable | |
| 7-Zip 18.03 / 7z b 4 -mmt1 | |
| Asus ProArt PX13 HN7306 | |
| Lenovo ThinkPad X13 Gen 4 21J3001VGE | |
| HP Dragonfly G4 | |
| Dell XPS 13 9350 | |
| Átlagos Intel Core Ultra 7 258V (5265 - 5869, n=23) | |
| Asus ZenBook S13 OLED UX5304 | |
| Lenovo ThinkPad Z13 Gen 2 | |
| MSI Prestige 13 AI Plus Evo A2VMG | |
| MSI Prestige 13 AI Evo | |
| Framework Laptop 13.5 Core Ultra 7 155H | |
| Lenovo ThinkPad X13 G3 21CM002UGE | |
| HP Elite Dragonfly G3 | |
| Dell XPS 13 Plus 9320 i5-1240p | |
| Dell Latitude 13 7350 | |
| Lenovo ThinkPad X13 2-in-1 Gen 5 | |
| Dell Latitude 7350 Detachable | |
| Lenovo Yoga 6 13ALC6 | |
| Geekbench 5.5 / Multi-Core | |
| Asus ProArt PX13 HN7306 | |
| Framework Laptop 13.5 Core Ultra 7 155H | |
| Lenovo ThinkPad Z13 Gen 2 | |
| MSI Prestige 13 AI Evo | |
| Lenovo ThinkPad X13 Gen 4 21J3001VGE | |
| MSI Prestige 13 AI Plus Evo A2VMG | |
| Átlagos Intel Core Ultra 7 258V (7574 - 9918, n=23) | |
| Dell XPS 13 9350 | |
| HP Dragonfly G4 | |
| Dell Latitude 13 7350 | |
| Asus ZenBook S13 OLED UX5304 | |
| HP Elite Dragonfly G3 | |
| Lenovo ThinkPad X13 2-in-1 Gen 5 | |
| Dell Latitude 7350 Detachable | |
| Lenovo ThinkPad X13 G3 21CM002UGE | |
| Dell XPS 13 Plus 9320 i5-1240p | |
| Geekbench 5.5 / Single-Core | |
| Asus ProArt PX13 HN7306 | |
| Dell XPS 13 9350 | |
| Átlagos Intel Core Ultra 7 258V (1891 - 2046, n=23) | |
| MSI Prestige 13 AI Plus Evo A2VMG | |
| HP Dragonfly G4 | |
| Lenovo ThinkPad X13 Gen 4 21J3001VGE | |
| Lenovo ThinkPad Z13 Gen 2 | |
| Asus ZenBook S13 OLED UX5304 | |
| MSI Prestige 13 AI Evo | |
| Framework Laptop 13.5 Core Ultra 7 155H | |
| Lenovo ThinkPad X13 2-in-1 Gen 5 | |
| Dell XPS 13 Plus 9320 i5-1240p | |
| Dell Latitude 13 7350 | |
| Dell Latitude 7350 Detachable | |
| HP Elite Dragonfly G3 | |
| Lenovo ThinkPad X13 G3 21CM002UGE | |
| HWBOT x265 Benchmark v2.2 / 4k Preset | |
| Asus ProArt PX13 HN7306 | |
| Lenovo ThinkPad Z13 Gen 2 | |
| MSI Prestige 13 AI Plus Evo A2VMG | |
| Framework Laptop 13.5 Core Ultra 7 155H | |
| Lenovo ThinkPad X13 Gen 4 21J3001VGE | |
| Dell XPS 13 9350 | |
| Átlagos Intel Core Ultra 7 258V (9.65 - 14.2, n=23) | |
| Dell XPS 13 Plus 9320 i5-1240p | |
| MSI Prestige 13 AI Evo | |
| Dell Latitude 13 7350 | |
| Lenovo ThinkPad X13 G3 21CM002UGE | |
| Lenovo Yoga 6 13ALC6 | |
| Lenovo ThinkPad X13 2-in-1 Gen 5 | |
| Dell Latitude 7350 Detachable | |
| HP Dragonfly G4 | |
| Asus ZenBook S13 OLED UX5304 | |
| HP Elite Dragonfly G3 | |
| LibreOffice / 20 Documents To PDF | |
| Lenovo ThinkPad X13 G3 21CM002UGE | |
| Dell XPS 13 Plus 9320 i5-1240p | |
| Lenovo Yoga 6 13ALC6 | |
| HP Elite Dragonfly G3 | |
| Asus ProArt PX13 HN7306 | |
| Lenovo ThinkPad X13 2-in-1 Gen 5 | |
| Dell XPS 13 9350 | |
| Dell Latitude 13 7350 | |
| MSI Prestige 13 AI Plus Evo A2VMG | |
| Átlagos Intel Core Ultra 7 258V (41.1 - 59.3, n=23) | |
| Lenovo ThinkPad Z13 Gen 2 | |
| Dell Latitude 7350 Detachable | |
| Framework Laptop 13.5 Core Ultra 7 155H | |
| Asus ZenBook S13 OLED UX5304 | |
| Lenovo ThinkPad X13 Gen 4 21J3001VGE | |
| HP Dragonfly G4 | |
| MSI Prestige 13 AI Evo | |
| R Benchmark 2.5 / Overall mean | |
| Lenovo ThinkPad X13 G3 21CM002UGE | |
| Lenovo Yoga 6 13ALC6 | |
| Lenovo ThinkPad X13 2-in-1 Gen 5 | |
| Dell Latitude 13 7350 | |
| HP Elite Dragonfly G3 | |
| Dell Latitude 7350 Detachable | |
| Dell XPS 13 Plus 9320 i5-1240p | |
| Lenovo ThinkPad Z13 Gen 2 | |
| Framework Laptop 13.5 Core Ultra 7 155H | |
| Asus ZenBook S13 OLED UX5304 | |
| Lenovo ThinkPad X13 Gen 4 21J3001VGE | |
| MSI Prestige 13 AI Evo | |
| MSI Prestige 13 AI Plus Evo A2VMG | |
| Átlagos Intel Core Ultra 7 258V (0.443 - 0.4998, n=23) | |
| HP Dragonfly G4 | |
| Dell XPS 13 9350 | |
| Asus ProArt PX13 HN7306 | |
Cinebench R23: Multi Core | Single Core
Cinebench R20: CPU (Multi Core) | CPU (Single Core)
Cinebench R15: CPU Multi 64Bit | CPU Single 64Bit
Blender: v2.79 BMW27 CPU
7-Zip 18.03: 7z b 4 | 7z b 4 -mmt1
Geekbench 6.5: Multi-Core | Single-Core
Geekbench 5.5: Multi-Core | Single-Core
HWBOT x265 Benchmark v2.2: 4k Preset
LibreOffice : 20 Documents To PDF
R Benchmark 2.5: Overall mean
* ... a kisebb jobb
AIDA64: FP32 Ray-Trace | FPU Julia | CPU SHA3 | CPU Queen | FPU SinJulia | FPU Mandel | CPU AES | CPU ZLib | FP64 Ray-Trace | CPU PhotoWorxx
| Performance rating | |
| Framework Laptop 13.5 Core Ultra 7 155H | |
| MSI Prestige 13 AI Plus Evo A2VMG | |
| Dell XPS 13 9350 | |
| Átlagos Intel Core Ultra 7 258V | |
| Lenovo Yoga Book 9 13IMU9 | |
| MSI Prestige 13 AI Evo | |
| HP Dragonfly G4 | |
| AIDA64 / FP32 Ray-Trace | |
| MSI Prestige 13 AI Plus Evo A2VMG | |
| Dell XPS 13 9350 | |
| Átlagos Intel Core Ultra 7 258V (8454 - 12781, n=25) | |
| Framework Laptop 13.5 Core Ultra 7 155H | |
| Lenovo Yoga Book 9 13IMU9 | |
| HP Dragonfly G4 | |
| MSI Prestige 13 AI Evo | |
| AIDA64 / FPU Julia | |
| MSI Prestige 13 AI Plus Evo A2VMG | |
| Dell XPS 13 9350 | |
| Framework Laptop 13.5 Core Ultra 7 155H | |
| Átlagos Intel Core Ultra 7 258V (40875 - 63401, n=25) | |
| MSI Prestige 13 AI Evo | |
| Lenovo Yoga Book 9 13IMU9 | |
| HP Dragonfly G4 | |
| AIDA64 / CPU SHA3 | |
| MSI Prestige 13 AI Plus Evo A2VMG | |
| Framework Laptop 13.5 Core Ultra 7 155H | |
| Dell XPS 13 9350 | |
| Átlagos Intel Core Ultra 7 258V (1930 - 2817, n=25) | |
| Lenovo Yoga Book 9 13IMU9 | |
| MSI Prestige 13 AI Evo | |
| HP Dragonfly G4 | |
| AIDA64 / CPU Queen | |
| Framework Laptop 13.5 Core Ultra 7 155H | |
| HP Dragonfly G4 | |
| MSI Prestige 13 AI Evo | |
| MSI Prestige 13 AI Plus Evo A2VMG | |
| Átlagos Intel Core Ultra 7 258V (48816 - 49818, n=24) | |
| Dell XPS 13 9350 | |
| Lenovo Yoga Book 9 13IMU9 | |
| AIDA64 / FPU SinJulia | |
| Framework Laptop 13.5 Core Ultra 7 155H | |
| MSI Prestige 13 AI Evo | |
| Lenovo Yoga Book 9 13IMU9 | |
| HP Dragonfly G4 | |
| Dell XPS 13 9350 | |
| MSI Prestige 13 AI Plus Evo A2VMG | |
| Átlagos Intel Core Ultra 7 258V (3817 - 4440, n=25) | |
| AIDA64 / FPU Mandel | |
| MSI Prestige 13 AI Plus Evo A2VMG | |
| Dell XPS 13 9350 | |
| Átlagos Intel Core Ultra 7 258V (21670 - 33565, n=25) | |
| Framework Laptop 13.5 Core Ultra 7 155H | |
| MSI Prestige 13 AI Evo | |
| Lenovo Yoga Book 9 13IMU9 | |
| HP Dragonfly G4 | |
| AIDA64 / CPU AES | |
| Framework Laptop 13.5 Core Ultra 7 155H | |
| MSI Prestige 13 AI Evo | |
| Lenovo Yoga Book 9 13IMU9 | |
| Dell XPS 13 9350 | |
| MSI Prestige 13 AI Plus Evo A2VMG | |
| Átlagos Intel Core Ultra 7 258V (30957 - 40753, n=25) | |
| HP Dragonfly G4 | |
| AIDA64 / CPU ZLib | |
| Framework Laptop 13.5 Core Ultra 7 155H | |
| Lenovo Yoga Book 9 13IMU9 | |
| MSI Prestige 13 AI Plus Evo A2VMG | |
| Átlagos Intel Core Ultra 7 258V (422 - 632, n=25) | |
| MSI Prestige 13 AI Evo | |
| Dell XPS 13 9350 | |
| HP Dragonfly G4 | |
| AIDA64 / FP64 Ray-Trace | |
| MSI Prestige 13 AI Plus Evo A2VMG | |
| Dell XPS 13 9350 | |
| Átlagos Intel Core Ultra 7 258V (4258 - 6930, n=25) | |
| Framework Laptop 13.5 Core Ultra 7 155H | |
| Lenovo Yoga Book 9 13IMU9 | |
| MSI Prestige 13 AI Evo | |
| HP Dragonfly G4 | |
| AIDA64 / CPU PhotoWorxx | |
| MSI Prestige 13 AI Plus Evo A2VMG | |
| Átlagos Intel Core Ultra 7 258V (44223 - 59245, n=25) | |
| Dell XPS 13 9350 | |
| Framework Laptop 13.5 Core Ultra 7 155H | |
| Lenovo Yoga Book 9 13IMU9 | |
| MSI Prestige 13 AI Evo | |
| HP Dragonfly G4 | |
Rendszer teljesítménye
CrossMark: Overall | Productivity | Creativity | Responsiveness
WebXPRT 3: Overall
WebXPRT 4: Overall
Mozilla Kraken 1.1: Total
| PCMark 10 / Score | |
| Dell XPS 13 9350 | |
| Átlagos Intel Core Ultra 7 258V, Intel Arc Graphics 140V (6265 - 7314, n=22) | |
| Framework Laptop 13.5 Core Ultra 7 155H | |
| MSI Prestige 13 AI Plus Evo A2VMG | |
| Lenovo Yoga Book 9 13IMU9 | |
| MSI Prestige 13 AI Evo | |
| HP Dragonfly G4 | |
| PCMark 10 / Essentials | |
| Lenovo Yoga Book 9 13IMU9 | |
| HP Dragonfly G4 | |
| Framework Laptop 13.5 Core Ultra 7 155H | |
| Átlagos Intel Core Ultra 7 258V, Intel Arc Graphics 140V (9295 - 11467, n=22) | |
| MSI Prestige 13 AI Plus Evo A2VMG | |
| Dell XPS 13 9350 | |
| MSI Prestige 13 AI Evo | |
| PCMark 10 / Productivity | |
| Dell XPS 13 9350 | |
| Átlagos Intel Core Ultra 7 258V, Intel Arc Graphics 140V (7357 - 9619, n=22) | |
| MSI Prestige 13 AI Evo | |
| Framework Laptop 13.5 Core Ultra 7 155H | |
| MSI Prestige 13 AI Plus Evo A2VMG | |
| Lenovo Yoga Book 9 13IMU9 | |
| HP Dragonfly G4 | |
| PCMark 10 / Digital Content Creation | |
| MSI Prestige 13 AI Plus Evo A2VMG | |
| Dell XPS 13 9350 | |
| Átlagos Intel Core Ultra 7 258V, Intel Arc Graphics 140V (8914 - 10308, n=22) | |
| Framework Laptop 13.5 Core Ultra 7 155H | |
| Lenovo Yoga Book 9 13IMU9 | |
| MSI Prestige 13 AI Evo | |
| HP Dragonfly G4 | |
| CrossMark / Overall | |
| Dell XPS 13 9350 | |
| MSI Prestige 13 AI Plus Evo A2VMG | |
| Framework Laptop 13.5 Core Ultra 7 155H | |
| Átlagos Intel Core Ultra 7 258V, Intel Arc Graphics 140V (1551 - 1742, n=21) | |
| HP Dragonfly G4 | |
| Lenovo Yoga Book 9 13IMU9 | |
| MSI Prestige 13 AI Evo | |
| CrossMark / Productivity | |
| Dell XPS 13 9350 | |
| MSI Prestige 13 AI Plus Evo A2VMG | |
| Átlagos Intel Core Ultra 7 258V, Intel Arc Graphics 140V (1479 - 1684, n=21) | |
| HP Dragonfly G4 | |
| Framework Laptop 13.5 Core Ultra 7 155H | |
| MSI Prestige 13 AI Evo | |
| Lenovo Yoga Book 9 13IMU9 | |
| CrossMark / Creativity | |
| MSI Prestige 13 AI Plus Evo A2VMG | |
| Dell XPS 13 9350 | |
| Framework Laptop 13.5 Core Ultra 7 155H | |
| Átlagos Intel Core Ultra 7 258V, Intel Arc Graphics 140V (1727 - 1977, n=21) | |
| HP Dragonfly G4 | |
| Lenovo Yoga Book 9 13IMU9 | |
| MSI Prestige 13 AI Evo | |
| CrossMark / Responsiveness | |
| HP Dragonfly G4 | |
| Framework Laptop 13.5 Core Ultra 7 155H | |
| Dell XPS 13 9350 | |
| MSI Prestige 13 AI Plus Evo A2VMG | |
| Átlagos Intel Core Ultra 7 258V, Intel Arc Graphics 140V (1246 - 1411, n=21) | |
| MSI Prestige 13 AI Evo | |
| Lenovo Yoga Book 9 13IMU9 | |
| WebXPRT 3 / Overall | |
| Dell XPS 13 9350 | |
| HP Dragonfly G4 | |
| MSI Prestige 13 AI Plus Evo A2VMG | |
| Framework Laptop 13.5 Core Ultra 7 155H | |
| Átlagos Intel Core Ultra 7 258V, Intel Arc Graphics 140V (219 - 317, n=21) | |
| Lenovo Yoga Book 9 13IMU9 | |
| MSI Prestige 13 AI Evo | |
| WebXPRT 4 / Overall | |
| MSI Prestige 13 AI Plus Evo A2VMG | |
| Dell XPS 13 9350 | |
| Átlagos Intel Core Ultra 7 258V, Intel Arc Graphics 140V (199.5 - 291, n=21) | |
| HP Dragonfly G4 | |
| Framework Laptop 13.5 Core Ultra 7 155H | |
| Lenovo Yoga Book 9 13IMU9 | |
| MSI Prestige 13 AI Evo | |
| Mozilla Kraken 1.1 / Total | |
| Lenovo Yoga Book 9 13IMU9 | |
| MSI Prestige 13 AI Evo | |
| Framework Laptop 13.5 Core Ultra 7 155H | |
| HP Dragonfly G4 | |
| Átlagos Intel Core Ultra 7 258V, Intel Arc Graphics 140V (468 - 559, n=23) | |
| MSI Prestige 13 AI Plus Evo A2VMG | |
| Dell XPS 13 9350 | |
* ... a kisebb jobb
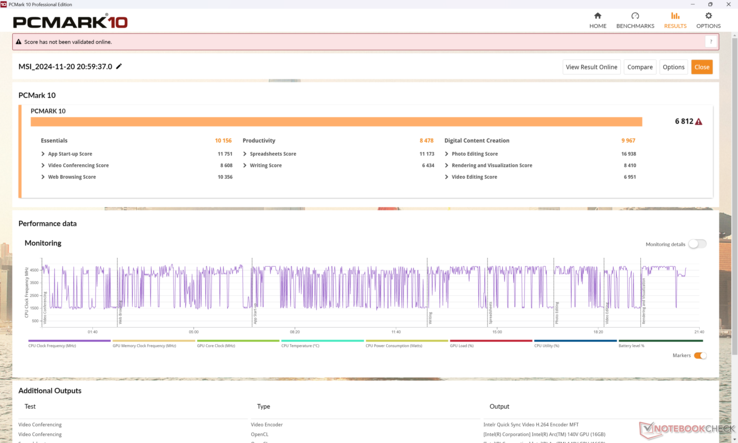
| PCMark 10 Score | 6812 pontok | |
Segítség | ||
| AIDA64 / Memory Copy | |
| MSI Prestige 13 AI Plus Evo A2VMG | |
| Átlagos Intel Core Ultra 7 258V (104408 - 114336, n=25) | |
| Dell XPS 13 9350 | |
| MSI Prestige 13 AI Evo | |
| Lenovo Yoga Book 9 13IMU9 | |
| Framework Laptop 13.5 Core Ultra 7 155H | |
| HP Dragonfly G4 | |
| AIDA64 / Memory Read | |
| Dell XPS 13 9350 | |
| Átlagos Intel Core Ultra 7 258V (82846 - 89417, n=25) | |
| MSI Prestige 13 AI Plus Evo A2VMG | |
| Framework Laptop 13.5 Core Ultra 7 155H | |
| MSI Prestige 13 AI Evo | |
| Lenovo Yoga Book 9 13IMU9 | |
| HP Dragonfly G4 | |
| AIDA64 / Memory Write | |
| MSI Prestige 13 AI Plus Evo A2VMG | |
| Átlagos Intel Core Ultra 7 258V (108842 - 117989, n=25) | |
| Dell XPS 13 9350 | |
| MSI Prestige 13 AI Evo | |
| Framework Laptop 13.5 Core Ultra 7 155H | |
| HP Dragonfly G4 | |
| Lenovo Yoga Book 9 13IMU9 | |
| AIDA64 / Memory Latency | |
| MSI Prestige 13 AI Evo | |
| Lenovo Yoga Book 9 13IMU9 | |
| Framework Laptop 13.5 Core Ultra 7 155H | |
| MSI Prestige 13 AI Plus Evo A2VMG | |
| Dell XPS 13 9350 | |
| Átlagos Intel Core Ultra 7 258V (95 - 101.1, n=25) | |
| HP Dragonfly G4 | |
* ... a kisebb jobb
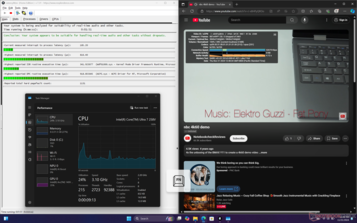
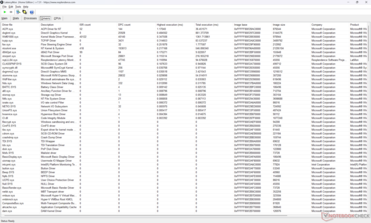
DPC késleltetés
| DPC Latencies / LatencyMon - interrupt to process latency (max), Web, Youtube, Prime95 | |
| MSI Prestige 13 AI Evo | |
| Lenovo Yoga Book 9 13IMU9 | |
| HP Dragonfly G4 | |
| MSI Prestige 13 AI Plus Evo A2VMG | |
| Framework Laptop 13.5 Core Ultra 7 155H | |
* ... a kisebb jobb
Tárolóeszközök
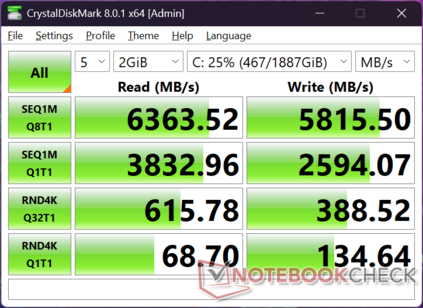
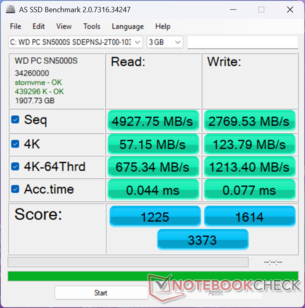
A mi készülékünk a WD SN5000S a Samsung PM9A1 helyett, mint a Core Ultra 7 155H konfigurációnkban. A meghajtó nem mutatja azokat a throttling problémákat, amelyeket az eredeti Prestige 13 AI-nál tapasztaltunk.
| Drive Performance rating - Percent | |
| MSI Prestige 13 AI Evo | |
| Framework Laptop 13.5 Core Ultra 7 155H | |
| HP Dragonfly G4 | |
| MSI Prestige 13 AI Plus Evo A2VMG | |
| Lenovo Yoga Book 9 13IMU9 | |
| Dell XPS 13 9350 | |
* ... a kisebb jobb
Disk Throttling: DiskSpd Read Loop, Queue Depth 8
GPU teljesítmény
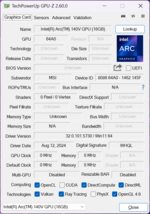
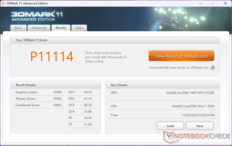
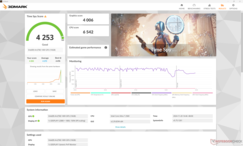
Az új integrált Arc 140V GPU vitathatatlanul az egyik legnagyobb fejlesztés a Arc 8-hoz képest a Core Ultra 7 155H konfigurációban. a 3DMark eredmények 1,5x-2x gyorsabbak, és ez elég jól lefordítható olyan játékforgatókönyvekre, mint a GTA V vagy akár a Cyberpunk 2077 , ahol a Core Ultra 7 155H konfiguráció hajlamos alulteljesíteni.
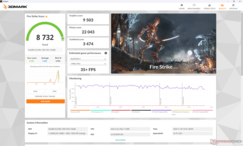
| Teljesítményprofil | Grafikai pontszám | Fizikai pontszám | Kombinált pontszám |
| Teljesítmény mód (Cooler Boost bekapcsolva) | 9513 | 21842 | 3426 |
| Teljesítmény üzemmód (Cooler Boost ki) | 9503 | 22043 | 3474 |
| Kiegyensúlyozott üzemmód | 9376 | 21037 | 3019 |
| Akkumulátor teljesítmény | 9471 | 21837 | 3440 |
Ha a rendszert a Cooler Boost funkcióval vagy Balanced üzemmódban, vagy akár csak akkumulátorról működtetjük, az nem befolyásolja jelentősen a teljesítményt, amint azt a fenti Fire Strike eredménytáblázatunk is mutatja.
| 3DMark Performance rating - Percent | |
| Asus ProArt PX13 HN7306 -1! | |
| Dell XPS 13 9350 | |
| Átlagos Intel Arc Graphics 140V | |
| MSI Prestige 13 AI Plus Evo A2VMG | |
| Framework Laptop 13.5 Core Ultra 7 155H | |
| Lenovo ThinkPad X13 2-in-1 Gen 5 | |
| Dell Latitude 13 7350 | |
| Lenovo ThinkPad Z13 Gen 2 -1! | |
| Lenovo ThinkPad X13 G3 21CM002UGE | |
| HP Elite Dragonfly G3 | |
| Lenovo ThinkPad X13 Gen 4 21J3001VGE -2! | |
| Dell Latitude 7350 Detachable | |
| Lenovo Yoga 6 13ALC6 | |
| MSI Prestige 13 AI Evo -1! | |
| HP Dragonfly G4 -1! | |
| Dell XPS 13 Plus 9320 i5-1240p | |
| Asus ZenBook S13 OLED UX5304 -1! | |
| 3DMark 11 Performance | 11114 pontok | |
| 3DMark Cloud Gate Standard Score | 33012 pontok | |
| 3DMark Fire Strike Score | 8732 pontok | |
| 3DMark Time Spy Score | 4253 pontok | |
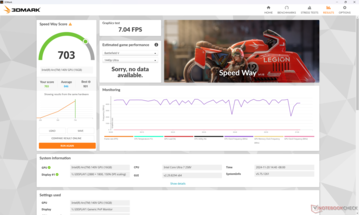
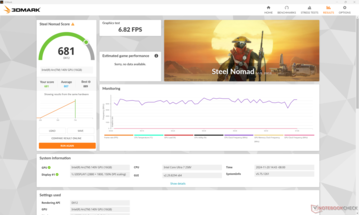
| 3DMark Steel Nomad Score | 681 pontok | |
Segítség | ||
| Blender | |
| v3.3 Classroom HIP/AMD | |
| Lenovo ThinkPad X13 G3 21CM002UGE | |
| v3.3 Classroom OPTIX/RTX | |
| Asus ProArt PX13 HN7306 | |
| v3.3 Classroom CUDA | |
| Asus ProArt PX13 HN7306 | |
| v3.3 Classroom CPU | |
| Lenovo ThinkPad X13 G3 21CM002UGE | |
| HP Elite Dragonfly G3 | |
| Asus ZenBook S13 OLED UX5304 | |
| Lenovo ThinkPad X13 2-in-1 Gen 5 | |
| HP Dragonfly G4 | |
| Dell Latitude 7350 Detachable | |
| Dell Latitude 13 7350 | |
| Lenovo ThinkPad X13 Gen 4 21J3001VGE | |
| MSI Prestige 13 AI Evo | |
| Átlagos Intel Arc Graphics 140V (506 - 772, n=35) | |
| Dell XPS 13 9350 | |
| MSI Prestige 13 AI Plus Evo A2VMG | |
| Framework Laptop 13.5 Core Ultra 7 155H | |
| Lenovo ThinkPad Z13 Gen 2 | |
| v3.3 Classroom oneAPI/Intel | |
| Dell Latitude 7350 Detachable | |
| Dell Latitude 13 7350 | |
| Lenovo ThinkPad X13 2-in-1 Gen 5 | |
| Átlagos Intel Arc Graphics 140V (195 - 405, n=22) | |
| Framework Laptop 13.5 Core Ultra 7 155H | |
| Dell XPS 13 9350 | |
| MSI Prestige 13 AI Plus Evo A2VMG | |
* ... a kisebb jobb
| Performance rating - Percent | |
| MSI Prestige 13 AI Plus Evo A2VMG | |
| Dell XPS 13 9350 | |
| Framework Laptop 13.5 Core Ultra 7 155H | |
| MSI Prestige 13 AI Evo -2! | |
| Lenovo Yoga Book 9 13IMU9 -2! | |
| HP Dragonfly G4 -2! | |
| Cyberpunk 2077 - 1920x1080 Ultra Preset (FSR off) | |
| MSI Prestige 13 AI Plus Evo A2VMG | |
| Framework Laptop 13.5 Core Ultra 7 155H | |
| Dell XPS 13 9350 | |
| Lenovo Yoga Book 9 13IMU9 | |
| Baldur's Gate 3 - 1920x1080 Ultra Preset AA:T | |
| MSI Prestige 13 AI Plus Evo A2VMG | |
| Framework Laptop 13.5 Core Ultra 7 155H | |
| Dell XPS 13 9350 | |
| GTA V - 1920x1080 Highest AA:4xMSAA + FX AF:16x | |
| MSI Prestige 13 AI Plus Evo A2VMG | |
| Dell XPS 13 9350 | |
| Framework Laptop 13.5 Core Ultra 7 155H | |
| HP Dragonfly G4 | |
| MSI Prestige 13 AI Evo | |
| Final Fantasy XV Benchmark - 1920x1080 High Quality | |
| MSI Prestige 13 AI Plus Evo A2VMG | |
| Dell XPS 13 9350 | |
| Framework Laptop 13.5 Core Ultra 7 155H | |
| MSI Prestige 13 AI Evo | |
| HP Dragonfly G4 | |
| Lenovo Yoga Book 9 13IMU9 | |
| Strange Brigade - 1920x1080 ultra AA:ultra AF:16 | |
| Dell XPS 13 9350 | |
| MSI Prestige 13 AI Plus Evo A2VMG | |
| Framework Laptop 13.5 Core Ultra 7 155H | |
| MSI Prestige 13 AI Evo | |
| Lenovo Yoga Book 9 13IMU9 | |
| HP Dragonfly G4 | |
| Dota 2 Reborn - 1920x1080 ultra (3/3) best looking | |
| MSI Prestige 13 AI Plus Evo A2VMG | |
| Dell XPS 13 9350 | |
| Framework Laptop 13.5 Core Ultra 7 155H | |
| Lenovo Yoga Book 9 13IMU9 | |
| HP Dragonfly G4 | |
| MSI Prestige 13 AI Evo | |
| X-Plane 11.11 - 1920x1080 high (fps_test=3) | |
| MSI Prestige 13 AI Plus Evo A2VMG | |
| Framework Laptop 13.5 Core Ultra 7 155H | |
| MSI Prestige 13 AI Evo | |
| Dell XPS 13 9350 | |
| HP Dragonfly G4 | |
| Lenovo Yoga Book 9 13IMU9 | |
Cyberpunk 2077 ultra FPS Chart
| alacsony | közepes | magas | ultra | |
|---|---|---|---|---|
| GTA V (2015) | 161.6 | 155.6 | 67.4 | 26.7 |
| Dota 2 Reborn (2015) | 97.2 | 87.8 | 72.1 | 83 |
| Final Fantasy XV Benchmark (2018) | 84 | 46.2 | 31.7 | |
| X-Plane 11.11 (2018) | 56.6 | 42.6 | 36.9 | |
| Far Cry 5 (2018) | 92 | 57 | 49 | 45 |
| Strange Brigade (2018) | 216 | 74.6 | 63 | 55.4 |
| Tiny Tina's Wonderlands (2022) | 72.1 | 53.3 | 36 | 28 |
| F1 22 (2022) | 96.2 | 88.5 | 63.9 | 19.9 |
| Baldur's Gate 3 (2023) | 39.6 | 33.5 | 29.8 | 29.1 |
| Cyberpunk 2077 (2023) | 46.6 | 37.4 | 32.5 | 28.5 |
Kibocsátás
Rendszerzaj
A ventilátor zaja általában hangosabb, mint korábban, amikor nagyobb igénybevételt jelentő terheléseket, például játékokat futtat. A Cyberpunk 2077 futtatása Performance módban 45 dB(A) ventilátorzajt okoz, míg Cooler Boost módban közel 51 dB(A).
Zajszint
| Üresjárat |
| 24.8 / 24.8 / 26.7 dB(A) |
| Terhelés |
| 36.8 / 50.8 dB(A) |
 | ||
30 dB csendes 40 dB(A) hallható 50 dB(A) hangos |
||
min: | ||
| MSI Prestige 13 AI Plus Evo A2VMG Arc 140V, Core Ultra 7 258V | MSI Prestige 13 AI Evo Arc 8-Core, Ultra 7 155H, Samsung PM9A1 MZVL21T0HCLR | Dell XPS 13 9350 Arc 140V, Core Ultra 7 256V, Micron 2550 512GB | Framework Laptop 13.5 Core Ultra 7 155H Arc 8-Core, Ultra 7 155H | Lenovo Yoga Book 9 13IMU9 Graphics 4-Core iGPU (Arrow Lake), Ultra 7 155U | HP Dragonfly G4 Iris Xe G7 96EUs, i7-1365U, Micron 3400 MTFDKBA512TFH 512GB | |
|---|---|---|---|---|---|---|
| Noise | 6% | 11% | 1% | 16% | 12% | |
| off / környezet * (dB) | 24.1 | 23.4 3% | 24.1 -0% | 24 -0% | 23.3 3% | 23.3 3% |
| Idle Minimum * (dB) | 24.8 | 23.4 6% | 24.4 2% | 24.1 3% | 23.3 6% | 23.5 5% |
| Idle Average * (dB) | 24.8 | 26.9 -8% | 24.4 2% | 25.1 -1% | 23.3 6% | 23.5 5% |
| Idle Maximum * (dB) | 26.7 | 26.9 -1% | 24.4 9% | 27 -1% | 24.6 8% | 26.8 -0% |
| Load Average * (dB) | 36.8 | 32 13% | 26.2 29% | 38.4 -4% | 26.2 29% | 27.2 26% |
| Cyberpunk 2077 ultra * (dB) | 44.5 | 34.2 23% | 43.7 2% | |||
| Load Maximum * (dB) | 50.8 | 40.3 21% | 45.2 11% | 45.8 10% | 27.3 46% | 35 31% |
| Witcher 3 ultra * (dB) | 32 | 27.3 | 32.7 |
* ... a kisebb jobb
Hőmérséklet
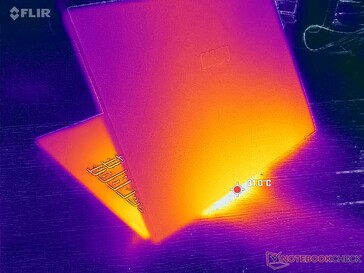
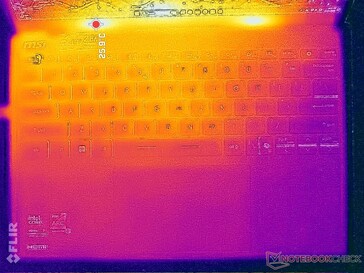
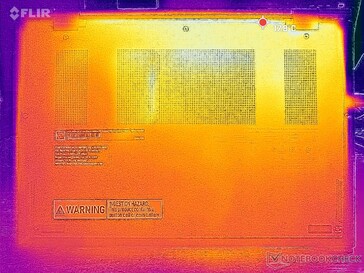
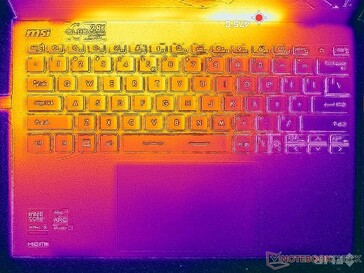
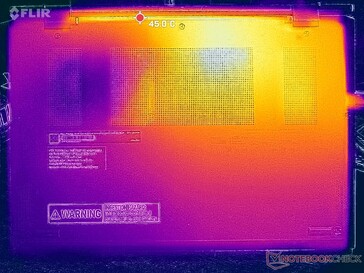
(±) A felső oldalon a maximális hőmérséklet 43.4 °C / 110 F, összehasonlítva a 35.9 °C / 97 F átlagával , 21.4 és 59 °C között a Subnotebook osztálynál.
(±) Az alsó maximum 42.4 °C / 108 F-ig melegszik fel, összehasonlítva a 39.3 °C / 103 F átlagával
(+) Üresjáratban a felső oldal átlagos hőmérséklete 23.4 °C / 74 F, összehasonlítva a 30.8 °C / ### eszközátlaggal class_avg_f### F.
(+) A csuklótámasz és az érintőpad hűvösebb, mint a bőr hőmérséklete, maximum 29.8 °C / 85.6 F, ezért hűvös tapintású.
(±) A hasonló eszközök csuklótámasz területének átlagos hőmérséklete 28.2 °C / 82.8 F volt (-1.6 °C / -2.8 F).
| MSI Prestige 13 AI Plus Evo A2VMG Intel Core Ultra 7 258V, Intel Arc Graphics 140V | MSI Prestige 13 AI Evo Intel Core Ultra 7 155H, Intel Arc 8-Core iGPU | Dell XPS 13 9350 Intel Core Ultra 7 256V, Intel Arc Graphics 140V | Framework Laptop 13.5 Core Ultra 7 155H Intel Core Ultra 7 155H, Intel Arc 8-Core iGPU | Lenovo Yoga Book 9 13IMU9 Intel Core Ultra 7 155U, Intel Graphics 4-Core iGPU (Meteor / Arrow Lake) | HP Dragonfly G4 Intel Core i7-1365U, Intel Iris Xe Graphics G7 96EUs | |
|---|---|---|---|---|---|---|
| Heat | 3% | 8% | -6% | -9% | -2% | |
| Maximum Upper Side * (°C) | 43.4 | 40.9 6% | 34.8 20% | 42.8 1% | 39.2 10% | 38.6 11% |
| Maximum Bottom * (°C) | 42.4 | 40.4 5% | 37.4 12% | 45.2 -7% | 41 3% | 40.4 5% |
| Idle Upper Side * (°C) | 25.4 | 25 2% | 25.4 -0% | 27.2 -7% | 32.2 -27% | 28.2 -11% |
| Idle Bottom * (°C) | 25.6 | 25.5 -0% | 26.2 -2% | 28.6 -12% | 31.6 -23% | 29 -13% |
* ... a kisebb jobb
Stressz teszt
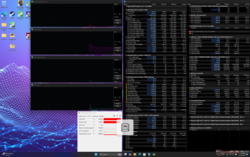
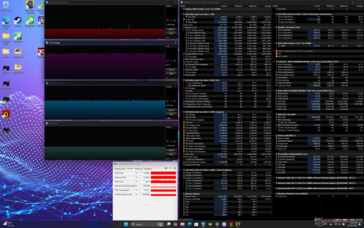
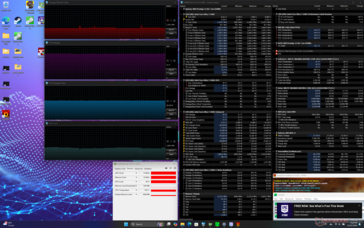
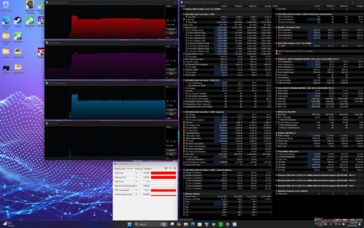
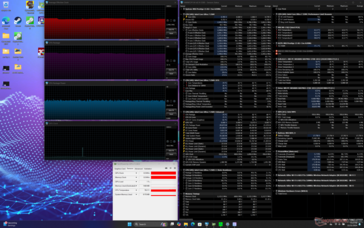
A Prime95 stressz futtatásakor a CPU 3,6 GHz-re, 40 W-ra és 82 C-ra gyorsult fel, ami körülbelül 30 másodpercig tartott. Ezután gyorsan csökken és 2,9 GHz-en és 27 W-on stabilizálódik, hogy a maghőmérséklet hűvösebb, 77 C-on maradjon. Ha a Cooler Boost engedélyezve van, a maghőmérséklet enyhén csökken, miközben az órajelek szinte változatlanok maradnak.
Játék esetén a maghőmérséklet 75 C-on stabilizálódna, szemben a hasonló Lunar Lake CPU-val rendelkező Dell XPS 13 71 C-jával.
| Átlagos CPU órajel (GHz) | GPU órajel (MHz) | Átlagos CPU hőmérséklet (°C) | |
| Rendszer üresjáratban | -- | 400 | 32 |
| Prime95 Stressz (Cooler Boost ki) | 2,9 | -- | 77 |
| Prime95 Stressz (Cooler Boost be) | 3,0 | -- | 75 |
| Prime95 + FurMark Stressz | 1,6 | 1800 | 76 |
| Cyberpunk 2077 Stressz | 1.5 | 1950 | 75 |
MSI Prestige 13 AI Plus Evo A2VMG hangelemzés
(+) | a hangszórók viszonylag hangosan tudnak játszani (84.5 dB)
Basszus 100 - 315 Hz
(-) | szinte nincs basszus – átlagosan 19.4%-kal alacsonyabb a mediánnál
(±) | a basszus linearitása átlagos (9.6% delta az előző frekvenciához)
Közepes 400-2000 Hz
(±) | magasabb középértékek – átlagosan 6.4%-kal magasabb, mint a medián
(+) | a középpontok lineárisak (5.1% delta az előző frekvenciához)
Maximum 2-16 kHz
(±) | magasabb csúcsok – átlagosan 6.1%-kal magasabb, mint a medián
(+) | a csúcsok lineárisak (4.6% delta az előző frekvenciához képest)
Összességében 100 - 16.000 Hz
(±) | az általános hang linearitása átlagos (18.2% eltérés a mediánhoz képest)
Ugyanazon osztályhoz képest
» 51%Ebben az osztályban az összes tesztelt eszköz %-a jobb volt, 7% hasonló, 41%-kal rosszabb
» A legjobb delta értéke 5%, az átlag 18%, a legrosszabb 53% volt
Az összes tesztelt eszközzel összehasonlítva
» 38% az összes tesztelt eszköz jobb volt, 8% hasonló, 54%-kal rosszabb
» A legjobb delta értéke 4%, az átlag 24%, a legrosszabb 134% volt
Apple MacBook Pro 16 2021 M1 Pro hangelemzés
(+) | a hangszórók viszonylag hangosan tudnak játszani (84.7 dB)
Basszus 100 - 315 Hz
(+) | jó basszus – csak 3.8% választja el a mediántól
(+) | a basszus lineáris (5.2% delta az előző frekvenciához)
Közepes 400-2000 Hz
(+) | kiegyensúlyozott középpontok – csak 1.3% választja el a mediántól
(+) | a középpontok lineárisak (2.1% delta az előző frekvenciához)
Maximum 2-16 kHz
(+) | kiegyensúlyozott csúcsok – csak 1.9% választja el a mediántól
(+) | a csúcsok lineárisak (2.7% delta az előző frekvenciához képest)
Összességében 100 - 16.000 Hz
(+) | általános hangzás lineáris (4.6% eltérés a mediánhoz képest)
Ugyanazon osztályhoz képest
» 0%Ebben az osztályban az összes tesztelt eszköz %-a jobb volt, 0% hasonló, 100%-kal rosszabb
» A legjobb delta értéke 5%, az átlag 17%, a legrosszabb 45% volt
Az összes tesztelt eszközzel összehasonlítva
» 0% az összes tesztelt eszköz jobb volt, 0% hasonló, 100%-kal rosszabb
» A legjobb delta értéke 4%, az átlag 24%, a legrosszabb 134% volt
Energiagazdálkodás
Energiafogyasztás
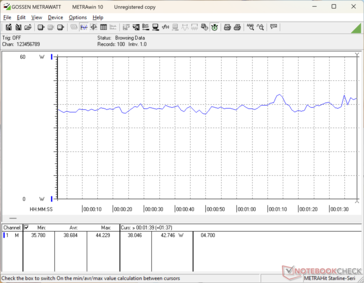
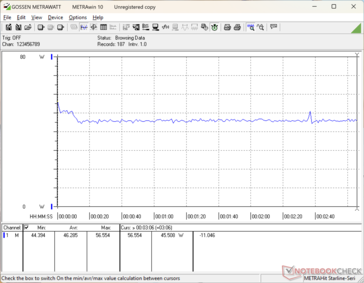
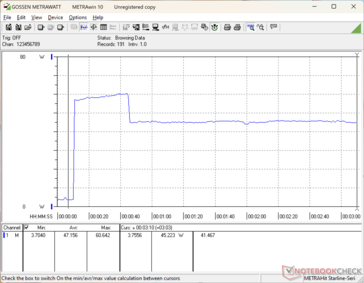
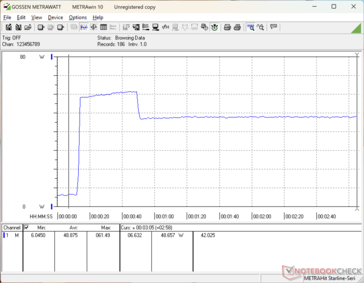
A rendszer hosszabb ideig tartó CPU-nehéz feladatok futtatásakor a Core Ultra 7 155H konfigurációhoz képest nagyobb igénybevételt jelent, mivel a rendszer nem szabályoz olyan erősen, mint a Core Ultra 7 155H konfiguráció. A fogyasztás játék közben is körülbelül 50 százalékkal magasabb, ami igazodik a sokkal gyorsabb grafikus teljesítményhez.
| Kikapcsolt állapot / Készenlét | |
| Üresjárat | |
| Terhelés |
|
Kulcs:
min: | |
| MSI Prestige 13 AI Plus Evo A2VMG Core Ultra 7 258V, Arc 140V, , OLED, 2880x1800, 13.3" | MSI Prestige 13 AI Evo Ultra 7 155H, Arc 8-Core, Samsung PM9A1 MZVL21T0HCLR, OLED, 2880x1800, 13.3" | Dell XPS 13 9350 Core Ultra 7 256V, Arc 140V, Micron 2550 512GB, IPS, 1920x1200, 13.4" | Framework Laptop 13.5 Core Ultra 7 155H Ultra 7 155H, Arc 8-Core, , IPS, 2880x1920, 13.5" | Lenovo Yoga Book 9 13IMU9 Ultra 7 155U, Graphics 4-Core iGPU (Arrow Lake), , OLED, 2880x1800, 13.3" | HP Dragonfly G4 i7-1365U, Iris Xe G7 96EUs, Micron 3400 MTFDKBA512TFH 512GB, IPS, 1920x1280, 13.5" | |
|---|---|---|---|---|---|---|
| Power Consumption | -10% | 27% | 4% | -56% | -5% | |
| Idle Minimum * (Watt) | 3.5 | 4.5 -29% | 1.3 63% | 2.5 29% | 7.1 -103% | 4.1 -17% |
| Idle Average * (Watt) | 5.9 | 8 -36% | 2.5 58% | 5.2 12% | 9.1 -54% | 7.5 -27% |
| Idle Maximum * (Watt) | 10 | 8.7 13% | 4.1 59% | 5.8 42% | 18.4 -84% | 8.2 18% |
| Load Average * (Watt) | 38.7 | 36.1 7% | 40.1 -4% | 47.5 -23% | 51.3 -33% | 35.5 8% |
| Cyberpunk 2077 ultra external monitor * (Watt) | 45.6 | 43.1 5% | 52.4 -15% | |||
| Cyberpunk 2077 ultra * (Watt) | 46.3 | 46.1 -0% | 54.5 -18% | |||
| Load Maximum * (Watt) | 61.5 | 65 -6% | 57.3 7% | 61.5 -0% | 65.5 -7% | 66.5 -8% |
| Witcher 3 ultra * (Watt) | 29.7 | 41.5 | 37.5 |
* ... a kisebb jobb
Power Consumption Cyberpunk / Stress Test
Power Consumption external Monitor
Az akkumulátor élettartama
A futási idő a hatékonyabb Lunar Lake processzornak köszönhetően majdnem két órával hosszabb, mint a Core Ultra 7 155H konfigurációban.
| MSI Prestige 13 AI Plus Evo A2VMG Core Ultra 7 258V, Arc 140V, 75 Wh | MSI Prestige 13 AI Evo Ultra 7 155H, Arc 8-Core, 75 Wh | Dell XPS 13 9350 Core Ultra 7 256V, Arc 140V, 55 Wh | Framework Laptop 13.5 Core Ultra 7 155H Ultra 7 155H, Arc 8-Core, 61 Wh | Lenovo Yoga Book 9 13IMU9 Ultra 7 155U, Graphics 4-Core iGPU (Arrow Lake), 80 Wh | HP Dragonfly G4 i7-1365U, Iris Xe G7 96EUs, 68 Wh | |
|---|---|---|---|---|---|---|
| Akkumulátor üzemidő | -13% | 54% | -22% | -25% | 19% | |
| WiFi v1.3 (h) | 13.4 | 11.6 -13% | 20.6 54% | 10.5 -22% | 10.1 -25% | 15.9 19% |
| H.264 (h) | 16.7 | |||||
| Load (h) | 2.8 | 2.4 | 1.5 | 3.2 | ||
| Reader / Idle (h) | 56.8 | 38.3 | 42.5 |
Notebookcheck Értékelés
MSI Prestige 13 AI Plus Evo A2VMG
- 11/26/2024 v8
Allen Ngo
Átláthatóság
A felülvizsgálandó készülékek kiválasztását szerkesztőségünk végzi. A tesztmintát a gyártó vagy a kiskereskedő kölcsönként bocsátotta a szerző rendelkezésére a felülvizsgálat céljából. A hitelezőnek nem volt befolyása erre a felülvizsgálatra, és a gyártó sem kapott másolatot erről a felülvizsgálatról a közzététel előtt. Nem volt kötelesség ezt az ismertetőt közzétenni. Független médiavállalatként a Notebookcheck nincs alávetve a gyártók, kiskereskedők vagy kiadók felhatalmazásának.
Így tesztel a Notebookcheck
A Notebookcheck minden évben független, laptopok és okostelefonok százait vizsgálja meg szabványosított eljárások alkalmazásával annak érdekében, hogy minden eredmény összehasonlítható legyen. Körülbelül 20 éve folyamatosan fejlesztjük vizsgálati módszereinket, és ennek során iparági szabványokat állítottunk fel. Tesztlaboratóriumainkban kiváló minőségű mérőberendezéseket használnak tapasztalt technikusok és szerkesztők. Ezek a tesztek többlépcsős validációs folyamatot foglalnak magukban. Komplex minősítési rendszerünk több száz megalapozott mérésen és benchmarkon alapul, ami megőrzi az objektivitást.











 Total Sustainability Score:
