MSI GP63 Leopard 8RE (i7-8750H, GTX 1060, FHD) Xotic PC Edition Laptop rövid értékelés
| SD Card Reader | |
| average JPG Copy Test (av. of 3 runs) (érték szerinti rendezés) | |
| MSI GP63 Leopard 8RE-013US (Toshiba Exceria Pro SDXC 64 GB UHS-II) | |
| HP Omen 15-ce002ng (Toshiba Exceria Pro SDXC 64 GB UHS-II) | |
| Acer Aspire VN7-593G-73HP V15 Nitro BE | |
| Asus Strix GL703VM-DB74 (Toshiba Exceria Pro SDXC 64 GB UHS-II) | |
| Eurocom Q6 (Toshiba Exceria Pro SDXC 64 GB UHS-II) | |
| maximum AS SSD Seq Read Test (1GB) (érték szerinti rendezés) | |
| MSI GP63 Leopard 8RE-013US (Toshiba Exceria Pro SDXC 64 GB UHS-II) | |
| HP Omen 15-ce002ng (Toshiba Exceria Pro SDXC 64 GB UHS-II) | |
| Acer Aspire VN7-593G-73HP V15 Nitro BE | |
| Asus Strix GL703VM-DB74 (Toshiba Exceria Pro SDXC 64 GB UHS-II) | |
| Eurocom Q6 (Toshiba Exceria Pro SDXC 64 GB UHS-II) | |
| |||||||||||||||||||||||||
Fényerő megoszlás: 87 %
Centrumban: 368.5 cd/m²
Kontraszt: 1084:1 (Fekete: 0.34 cd/m²)
ΔE ColorChecker Calman: 8.91 | ∀{0.5-29.43 Ø4.73}
calibrated: 2.87
ΔE Greyscale Calman: 12 | ∀{0.09-98 Ø4.97}
99.98% sRGB (Argyll 1.6.3 3D)
85.94% AdobeRGB 1998 (Argyll 1.6.3 3D)
85.9% AdobeRGB 1998 (Argyll 3D)
100% sRGB (Argyll 3D)
91.5% Display P3 (Argyll 3D)
Gamma: 1.825
CCT: 11519 K
| MSI GP63 Leopard 8RE-013US Chi Mei CMN15F4 (N156HHE-GA1 CMN), TN LED, 120 Hz, 15.6", 1920x1080 | HP Omen 15-ce002ng AUO42ED, IPS, 15.6", 1920x1080 | Lenovo Legion Y720 80VR002XGE LG Philips LGD0533 LP156WF6-SPK3, IPS, 15.6", 1920x1080 | Acer Aspire VN7-593G-73HP V15 Nitro BE LG Display LP156WF6-SPP1, AH-IPS, Normally Black, Transmissive, 15.6", 1920x1080 | MSI GE63VR 7RF Raider Chi Mei N156HHE-GA1 (CMN15F4), TN LED, 15.6", 1920x1080 | |
|---|---|---|---|---|---|
| Display | -20% | -52% | -24% | 0% | |
| Display P3 Coverage (%) | 91.5 | 65.8 -28% | 38.43 -58% | 65.8 -28% | 91.3 0% |
| sRGB Coverage (%) | 100 | 90.9 -9% | 57.5 -43% | 85.1 -15% | 100 0% |
| AdobeRGB 1998 Coverage (%) | 85.9 | 66.5 -23% | 39.75 -54% | 62.2 -28% | 86.7 1% |
| Response Times | -176% | -133% | -188% | 37% | |
| Response Time Grey 50% / Grey 80% * (ms) | 24 ? | 43.2 ? -80% | 43 ? -79% | 41 ? -71% | 9.6 ? 60% |
| Response Time Black / White * (ms) | 8.4 ? | 31.2 ? -271% | 24 ? -186% | 34 ? -305% | 7.2 ? 14% |
| PWM Frequency (Hz) | 26040 ? | 21000 ? | 26000 ? | ||
| Screen | 14% | -4% | 6% | 19% | |
| Brightness middle (cd/m²) | 368.5 | 304 -18% | 288 -22% | 322 -13% | 285 -23% |
| Brightness (cd/m²) | 341 | 289 -15% | 275 -19% | 297 -13% | 273 -20% |
| Brightness Distribution (%) | 87 | 86 -1% | 86 -1% | 86 -1% | 84 -3% |
| Black Level * (cd/m²) | 0.34 | 0.26 24% | 0.36 -6% | 0.31 9% | 0.23 32% |
| Contrast (:1) | 1084 | 1169 8% | 800 -26% | 1039 -4% | 1239 14% |
| Colorchecker dE 2000 * | 8.91 | 3.46 61% | 5.29 41% | 4.73 47% | 3.52 60% |
| Colorchecker dE 2000 max. * | 14.39 | 7.72 46% | 9.97 31% | 12.37 14% | 5.18 64% |
| Colorchecker dE 2000 calibrated * | 2.87 | ||||
| Greyscale dE 2000 * | 12 | 2.46 79% | 4.5 62% | 2.99 75% | 3.41 72% |
| Gamma | 1.825 121% | 2.38 92% | 2.39 92% | 2.32 95% | 2.05 107% |
| CCT | 11519 56% | 6915 94% | 6839 95% | 6905 94% | 7077 92% |
| Color Space (Percent of AdobeRGB 1998) (%) | 85.94 | 59 -31% | 37 -57% | 56 -35% | 77 -10% |
| Color Space (Percent of sRGB) (%) | 99.98 | 91 -9% | 57 -43% | 85 -15% | 100 0% |
| Teljes átlag (program / beállítások) | -61% /
-18% | -63% /
-31% | -69% /
-26% | 19% /
17% |
* ... a kisebb jobb
Megjelenítési válaszidők
| ↔ Válaszidő Fekete-fehér | ||
|---|---|---|
| 8.4 ms ... emelkedés és süllyedés ↘ kombinálva | ↗ 6 ms emelkedés | 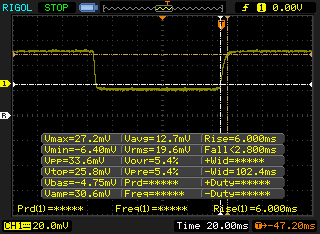 |
| ↘ 2.4 ms ősz | ||
| A képernyő gyors reakciósebességet mutat tesztjeinkben, és játékra is alkalmasnak kell lennie. Összehasonlításképpen, az összes tesztelt eszköz 0.1 (minimum) és 240 (maximum) ms között mozog. » 24 % of all devices are better. Ez azt jelenti, hogy a mért válaszidő jobb, mint az összes vizsgált eszköz átlaga (19.9 ms). | ||
| ↔ Válaszidő 50% szürke és 80% szürke között | ||
| 24 ms ... emelkedés és süllyedés ↘ kombinálva | ↗ 12.8 ms emelkedés | 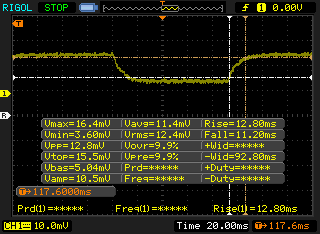 |
| ↘ 11.2 ms ősz | ||
| A képernyő jó reakciósebességet mutat tesztjeinkben, de túl lassú lehet a versenyképes játékosok számára. Összehasonlításképpen, az összes tesztelt eszköz 0.165 (minimum) és 636 (maximum) ms között mozog. » 34 % of all devices are better. Ez azt jelenti, hogy a mért válaszidő jobb, mint az összes vizsgált eszköz átlaga (31.1 ms). | ||
Képernyő villogása / PWM (impulzusszélesség-moduláció)
| Képernyő villogása / PWM észlelve | 26040 Hz | ≤ 19 % fényerő beállítása | 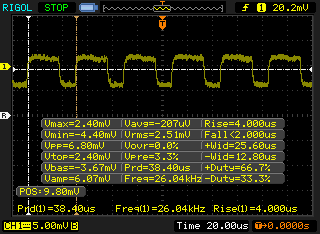 |
A kijelző háttérvilágítása 26040 Hz-en villog (a legrosszabb esetben, pl. PWM használatával) Villódzás észlelve a 19 % vagy annál kisebb fényerő-beállításnál. E fényerő-beállítás felett nem lehet villogás vagy PWM. A 26040 Hz frekvenciája meglehetősen magas, így a legtöbb PWM-re érzékeny felhasználó nem észlel semmilyen villogást. Összehasonlításképpen: az összes tesztelt eszköz 52 %-a nem használja a PWM-et a kijelző elsötétítésére. Ha PWM-et észleltek, akkor átlagosan 7794 (minimum: 5 - maximum: 343500) Hz-t mértek. | |||
| PCMark 8 Home Score Accelerated v2 | 4415 pontok | |
| PCMark 8 Creative Score Accelerated v2 | 5336 pontok | |
| PCMark 8 Work Score Accelerated v2 | 5354 pontok | |
Segítség | ||
| MSI GP63 Leopard 8RE-013US Samsung PM871b MZNLN128HAHQ | Gigabyte Aero 15X Samsung SM961 MZVKW512HMJP m.2 PCI-e | Eurocom Q6 Samsung SSD 960 Pro 512 GB m.2 | MSI GE63VR 7RF Raider Toshiba HG6 THNSNJ256G8NY | Dell Inspiron 15 7000 7577 Samsung PM961 MZVLW256HEHP | |
|---|---|---|---|---|---|
| AS SSD | 259% | 282% | 16% | 145% | |
| Copy Game MB/s (MB/s) | 220.7 | 933 323% | 633 187% | 382.5 73% | |
| Copy Program MB/s (MB/s) | 328.1 | 323.8 -1% | 363.4 11% | 274.8 -16% | |
| Copy ISO MB/s (MB/s) | 690 | 1851 168% | 1768 156% | 814 18% | |
| Score Total (Points) | 742 | 3570 381% | 3894 425% | 930 25% | 2405 224% |
| Score Write (Points) | 245 | 1333 444% | 1693 591% | 293 20% | 594 142% |
| Score Read (Points) | 325 | 1522 368% | 1477 354% | 420 29% | 1241 282% |
| Access Time Write * (ms) | 0.072 | 0.033 54% | 0.039 46% | 0.045 37% | 0.037 49% |
| Access Time Read * (ms) | 0.155 | 0.068 56% | 0.049 68% | 0.168 -8% | 0.058 63% |
| 4K-64 Write (MB/s) | 137.8 | 1106 703% | 1403 918% | 170.6 24% | 375.8 173% |
| 4K-64 Read (MB/s) | 253 | 1225 384% | 1195 372% | 350.3 38% | 929 267% |
| 4K Write (MB/s) | 60.8 | 113.8 87% | 96.2 58% | 77.3 27% | 100.2 65% |
| 4K Read (MB/s) | 21.88 | 46.56 113% | 29.62 35% | 19.55 -11% | 46.95 115% |
| Seq Write (MB/s) | 462.9 | 1124 143% | 1943 320% | 447 -3% | 1181 155% |
| Seq Read (MB/s) | 504 | 2508 398% | 2523 401% | 506 0% | 2652 426% |
* ... a kisebb jobb

| 3DMark 11 Performance | 14174 pontok | |
| 3DMark Cloud Gate Standard Score | 32310 pontok | |
| 3DMark Fire Strike Score | 10722 pontok | |
| 3DMark Fire Strike Extreme Score | 5536 pontok | |
Segítség | ||
| The Witcher 3 | |
| 1366x768 Medium Graphics & Postprocessing | |
| Eurocom Q6 | |
| MSI GP63 Leopard 8RE-013US | |
| Asus GL702ZC-GC104T | |
| HP Omen 15-ce002ng | |
| Lenovo Legion Y720 80VR002XGE | |
| 1920x1080 High Graphics & Postprocessing (Nvidia HairWorks Off) | |
| Eurocom Q6 | |
| Gigabyte Aero 15X v8 | |
| Dell Inspiron 15 7000 7577 | |
| MSI GP63 Leopard 8RE-013US | |
| Asus GL702ZC-GC104T | |
| Lenovo Legion Y720 80VR002XGE | |
| HP Omen 15-ce002ng | |
| 1920x1080 Ultra Graphics & Postprocessing (HBAO+) | |
| MSI GE63VR 7RF Raider | |
| Gigabyte Aero 15X v8 | |
| Eurocom Q6 | |
| MSI GP63 Leopard 8RE-013US | |
| Asus Strix GL703VM-DB74 | |
| Asus GL702ZC-GC104T | |
| Lenovo Legion Y720 80VR002XGE | |
| Dell Inspiron 15 7000 7577 | |
| HP Omen 15-ce002ng | |
| Rise of the Tomb Raider | |
| 1366x768 Medium Preset AF:2x | |
| Eurocom Q6 | |
| MSI GP63 Leopard 8RE-013US | |
| HP Omen 15-ce002ng | |
| Asus GL702ZC-GC104T | |
| MSI GP62 7REX-1045US | |
| 1920x1080 High Preset AA:FX AF:4x | |
| MSI GE63VR 7RF Raider | |
| Eurocom Q6 | |
| MSI GP63 Leopard 8RE-013US | |
| Dell Inspiron 15 7000 7577 | |
| HP Omen 15-ce002ng | |
| Asus GL702ZC-GC104T | |
| MSI GP62 7REX-1045US | |
| 1920x1080 Very High Preset AA:FX AF:16x | |
| MSI GE63VR 7RF Raider | |
| Eurocom Q6 | |
| MSI GP63 Leopard 8RE-013US | |
| Asus Strix GL703VM-DB74 | |
| Dell Inspiron 15 7000 7577 | |
| Asus GL702ZC-GC104T | |
| HP Omen 15-ce002ng | |
| MSI GP62 7REX-1045US | |
| BioShock Infinite | |
| 1366x768 Medium Preset | |
| Eurocom Q6 | |
| MSI GP63 Leopard 8RE-013US | |
| Lenovo Legion Y720 80VR002XGE | |
| MSI GP62 7REX-1045US | |
| 1366x768 High Preset | |
| Eurocom Q6 | |
| MSI GP63 Leopard 8RE-013US | |
| Lenovo Legion Y720 80VR002XGE | |
| MSI GP62 7REX-1045US | |
| 1920x1080 Ultra Preset, DX11 (DDOF) | |
| Eurocom Q6 | |
| MSI GP63 Leopard 8RE-013US | |
| Asus Strix GL703VM-DB74 | |
| Lenovo Legion Y720 80VR002XGE | |
| Dell Inspiron 15 7000 7577 | |
| MSI GP62 7REX-1045US | |
| alacsony | közepes | magas | ultra | |
|---|---|---|---|---|
| BioShock Infinite (2013) | 272.4 | 233.2 | 225.4 | 115.4 |
| The Witcher 3 (2015) | 197.4 | 138.7 | 68.5 | 42.3 |
| Rise of the Tomb Raider (2016) | 180.3 | 138.2 | 77.3 | 66.6 |
Zajszint
| Üresjárat |
| 32.8 / 32.8 / 33 dB(A) |
| Terhelés |
| 35.8 / 52.3 dB(A) |
 | ||
30 dB csendes 40 dB(A) hallható 50 dB(A) hangos |
||
min: | ||
| MSI GP63 Leopard 8RE-013US GeForce GTX 1060 Mobile, i7-8750H, Samsung PM871b MZNLN128HAHQ | HP Omen 15-ce002ng GeForce GTX 1060 Max-Q, i7-7700HQ, Samsung PM961 MZVLW256HEHP | Lenovo Legion Y720 80VR002XGE GeForce GTX 1060 Mobile, i7-7700HQ, Samsung PM961 MZVLW256HEHP | Acer Aspire VN7-593G-73HP V15 Nitro BE GeForce GTX 1060 Mobile, i7-7700HQ, Seagate Mobile HDD 1TB ST1000LM035 | Asus Strix GL703VM-DB74 GeForce GTX 1060 Mobile, i7-7700HQ, Seagate Mobile HDD 1TB ST1000LX015-1U7172 | |
|---|---|---|---|---|---|
| Noise | -0% | 6% | 3% | 2% | |
| off / környezet * (dB) | 28.4 | 30 -6% | 30.3 -7% | 30.4 -7% | 28.4 -0% |
| Idle Minimum * (dB) | 32.8 | 30 9% | 31 5% | 30.9 6% | 30.2 8% |
| Idle Average * (dB) | 32.8 | 33 -1% | 30.9 6% | 30.9 6% | 30.2 8% |
| Idle Maximum * (dB) | 33 | 37 -12% | 31.5 5% | 31.5 5% | 30.2 8% |
| Load Average * (dB) | 35.8 | 41 -15% | 38.7 -8% | 40.7 -14% | 38.4 -7% |
| Witcher 3 ultra * (dB) | 51 | 42 18% | 42 18% | 45.5 11% | 49.7 3% |
| Load Maximum * (dB) | 52.3 | 50 4% | 41.9 20% | 43.9 16% | 54.5 -4% |
* ... a kisebb jobb
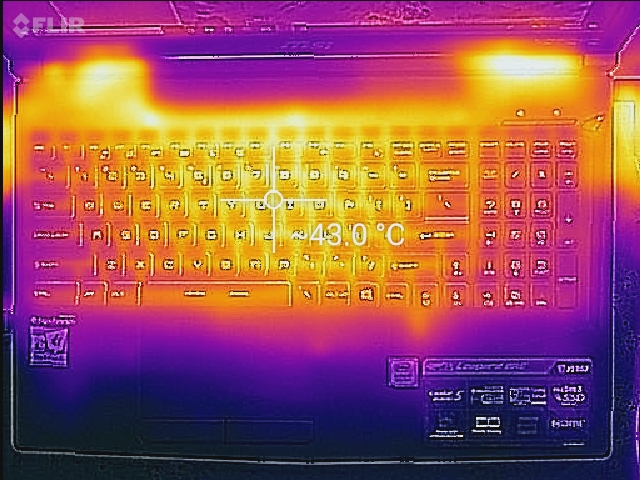
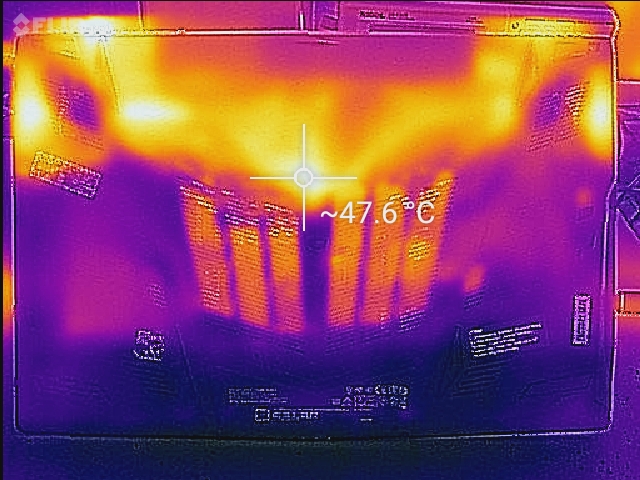
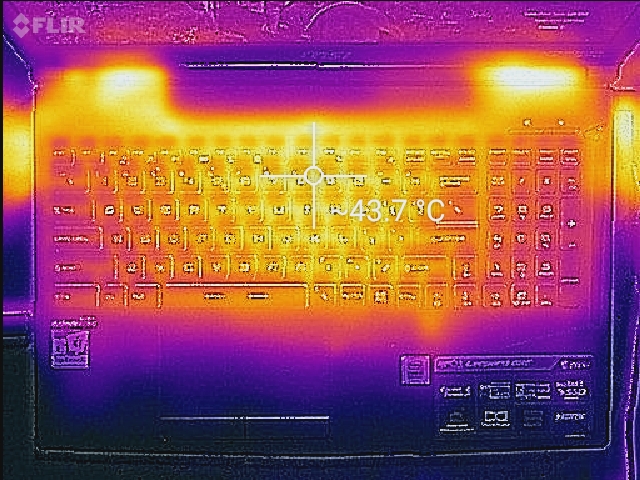
(±) A felső oldalon a maximális hőmérséklet 42.2 °C / 108 F, összehasonlítva a 40.4 °C / 105 F átlagával , 21.2 és 68.8 °C között a Gaming osztálynál.
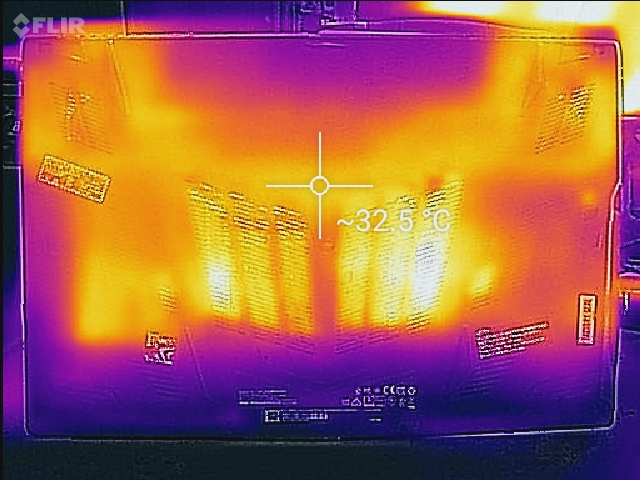
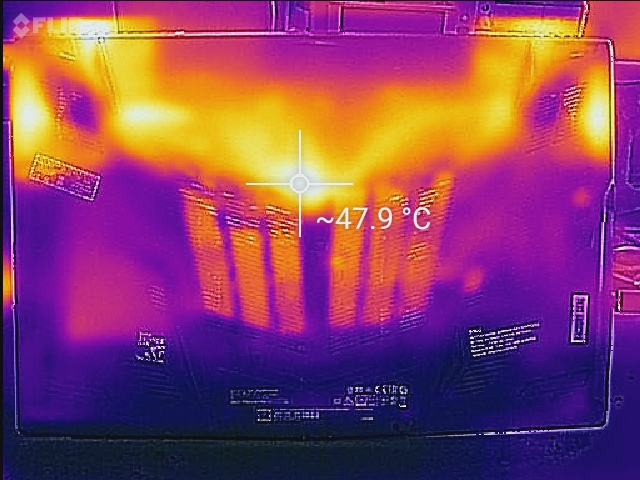
(-) Az alsó maximum 47.8 °C / 118 F-ig melegszik fel, összehasonlítva a 43.2 °C / 110 F átlagával
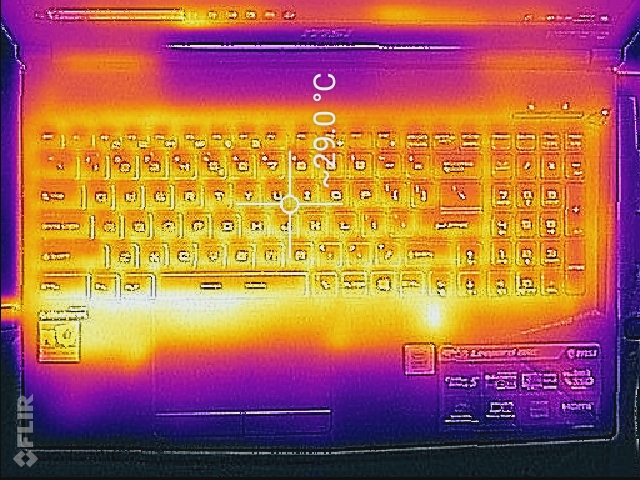
(+) Üresjáratban a felső oldal átlagos hőmérséklete 25.9 °C / 79 F, összehasonlítva a 33.9 °C / ### eszközátlaggal class_avg_f### F.
(±) A The Witcher 3 játék során a felső oldal átlaghőmérséklete 34.7 °C / 94 F, összehasonlítva a 33.9 °C / ## eszközátlaggal #class_avg_f### F.
(+) A csuklótámasz és az érintőpad hűvösebb, mint a bőr hőmérséklete, maximum 29.6 °C / 85.3 F, ezért hűvös tapintású.
(±) A hasonló eszközök csuklótámasz területének átlagos hőmérséklete 28.8 °C / 83.8 F volt (-0.8 °C / -1.5 F).
MSI GP63 Leopard 8RE-013US hangelemzés
(±) | a hangszóró hangereje átlagos, de jó (78.3 dB)
Basszus 100 - 315 Hz
(-) | szinte nincs basszus – átlagosan 23.1%-kal alacsonyabb a mediánnál
(±) | a basszus linearitása átlagos (10.6% delta az előző frekvenciához)
Közepes 400-2000 Hz
(+) | kiegyensúlyozott középpontok – csak 3% választja el a mediántól
(±) | a középpontok linearitása átlagos (7.1% delta az előző gyakorisághoz)
Maximum 2-16 kHz
(±) | magasabb csúcsok – átlagosan 5.8%-kal magasabb, mint a medián
(+) | a csúcsok lineárisak (6% delta az előző frekvenciához képest)
Összességében 100 - 16.000 Hz
(±) | az általános hang linearitása átlagos (21.2% eltérés a mediánhoz képest)
Ugyanazon osztályhoz képest
» 76%Ebben az osztályban az összes tesztelt eszköz %-a jobb volt, 4% hasonló, 19%-kal rosszabb
» A legjobb delta értéke 6%, az átlag 18%, a legrosszabb 132% volt
Az összes tesztelt eszközzel összehasonlítva
» 59% az összes tesztelt eszköz jobb volt, 7% hasonló, 34%-kal rosszabb
» A legjobb delta értéke 4%, az átlag 24%, a legrosszabb 134% volt
Apple MacBook 12 (Early 2016) 1.1 GHz hangelemzés
(+) | a hangszórók viszonylag hangosan tudnak játszani (83.6 dB)
Basszus 100 - 315 Hz
(±) | csökkentett basszus – átlagosan 11.3%-kal alacsonyabb, mint a medián
(±) | a basszus linearitása átlagos (14.2% delta az előző frekvenciához)
Közepes 400-2000 Hz
(+) | kiegyensúlyozott középpontok – csak 2.4% választja el a mediántól
(+) | a középpontok lineárisak (5.5% delta az előző frekvenciához)
Maximum 2-16 kHz
(+) | kiegyensúlyozott csúcsok – csak 2% választja el a mediántól
(+) | a csúcsok lineárisak (4.5% delta az előző frekvenciához képest)
Összességében 100 - 16.000 Hz
(+) | általános hangzás lineáris (10.2% eltérés a mediánhoz képest)
Ugyanazon osztályhoz képest
» 7%Ebben az osztályban az összes tesztelt eszköz %-a jobb volt, 2% hasonló, 91%-kal rosszabb
» A legjobb delta értéke 5%, az átlag 18%, a legrosszabb 53% volt
Az összes tesztelt eszközzel összehasonlítva
» 5% az összes tesztelt eszköz jobb volt, 1% hasonló, 94%-kal rosszabb
» A legjobb delta értéke 4%, az átlag 24%, a legrosszabb 134% volt
| Kikapcsolt állapot / Készenlét | |
| Üresjárat | |
| Terhelés |
|
Kulcs:
min: | |
| MSI GP63 Leopard 8RE-013US i7-8750H, GeForce GTX 1060 Mobile, Samsung PM871b MZNLN128HAHQ, TN LED, 120 Hz, 1920x1080, 15.6" | HP Omen 15-ce002ng i7-7700HQ, GeForce GTX 1060 Max-Q, Samsung PM961 MZVLW256HEHP, IPS, 1920x1080, 15.6" | Lenovo Legion Y720 80VR002XGE i7-7700HQ, GeForce GTX 1060 Mobile, Samsung PM961 MZVLW256HEHP, IPS, 1920x1080, 15.6" | Dell Inspiron 15 7000 7577 i5-7300HQ, GeForce GTX 1060 Max-Q, Samsung PM961 MZVLW256HEHP, IPS, 1920x1080, 15.6" | MSI GP62 7REX-1045US i7-7700HQ, GeForce GTX 1050 Ti Mobile, Toshiba NVMe THNSN5128GP, TN LED, 1920x1080, 15.6" | |
|---|---|---|---|---|---|
| Power Consumption | -46% | 17% | 34% | -14% | |
| Idle Minimum * (Watt) | 7.99 | 18 -125% | 8 -0% | 7.1 11% | 14.6 -83% |
| Idle Average * (Watt) | 12.15 | 23 -89% | 10.9 10% | 7.6 37% | 17.2 -42% |
| Idle Maximum * (Watt) | 13.4 | 30 -124% | 11.8 12% | 8.6 36% | 17.3 -29% |
| Load Average * (Watt) | 103.62 | 85 18% | 70 32% | 59.5 43% | 82.7 20% |
| Witcher 3 ultra * (Watt) | 156.1 | 96 39% | 102 35% | 89 43% | 107 31% |
| Load Maximum * (Watt) | 164.29 | 158 4% | 148 10% | 112.8 31% | 136.7 17% |
* ... a kisebb jobb
| MSI GP63 Leopard 8RE-013US i7-8750H, GeForce GTX 1060 Mobile, 51 Wh | HP Omen 15-ce002ng i7-7700HQ, GeForce GTX 1060 Max-Q, 70 Wh | Lenovo Legion Y720 80VR002XGE i7-7700HQ, GeForce GTX 1060 Mobile, 60 Wh | Acer Aspire VN7-593G-73HP V15 Nitro BE i7-7700HQ, GeForce GTX 1060 Mobile, 69 Wh | MSI GP62 7REX-1045US i7-7700HQ, GeForce GTX 1050 Ti Mobile, 41 Wh | Dell Inspiron 15 7000 7577 i5-7300HQ, GeForce GTX 1060 Max-Q, 56 Wh | |
|---|---|---|---|---|---|---|
| Akkumulátor üzemidő | -10% | 40% | 68% | -35% | 56% | |
| Reader / Idle (h) | 7.5 | 4.3 -43% | 11.8 57% | 8.4 12% | 4.3 -43% | 11 47% |
| WiFi v1.3 (h) | 4.8 | 3.3 -31% | 6.3 31% | 6 25% | 2.9 -40% | 6.9 44% |
| Load (h) | 0.9 | 1.3 44% | 1.2 33% | 2.4 167% | 0.7 -22% | 1.6 78% |
Pro
Kontra

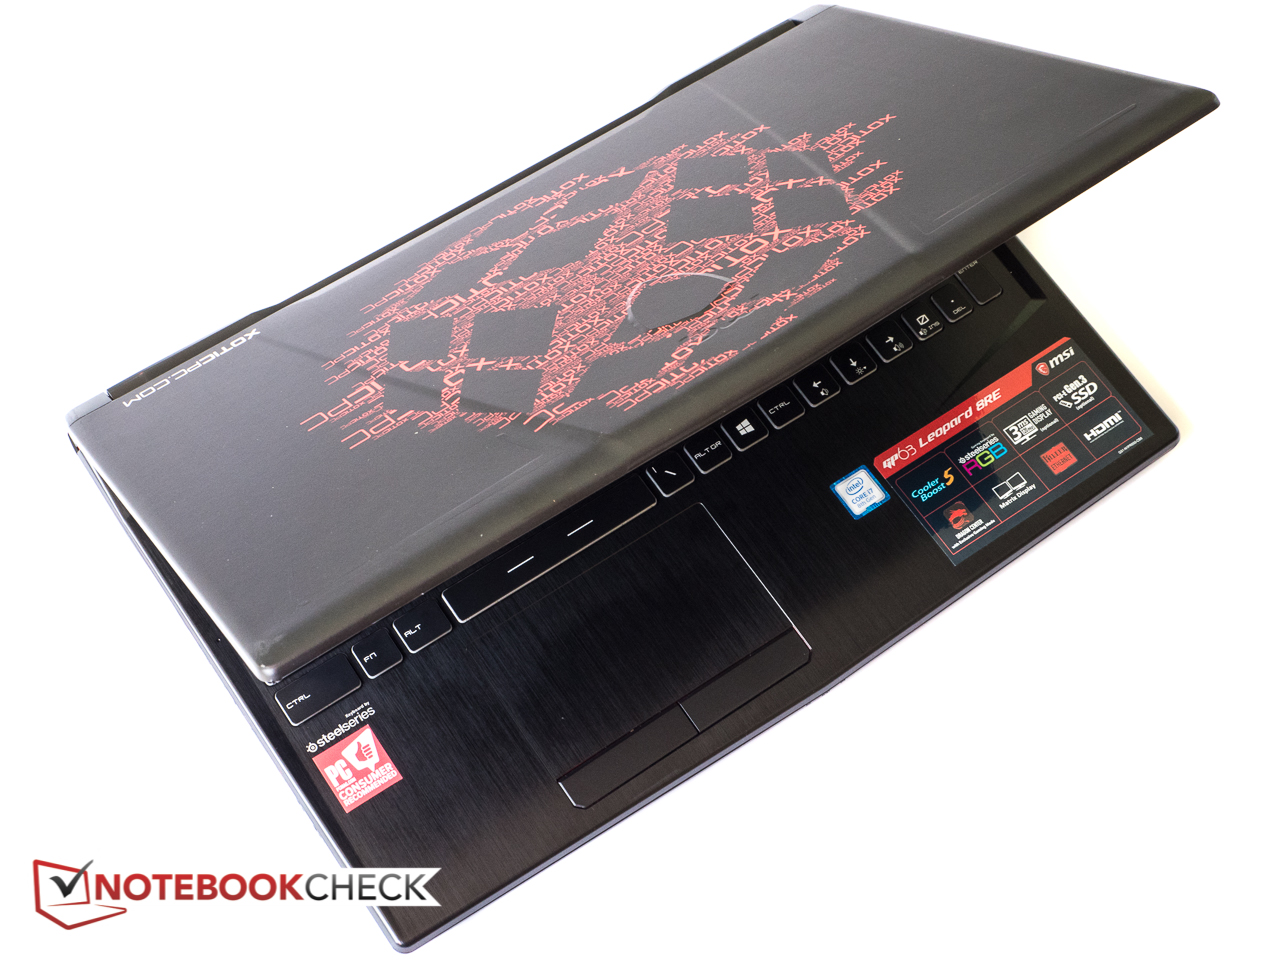
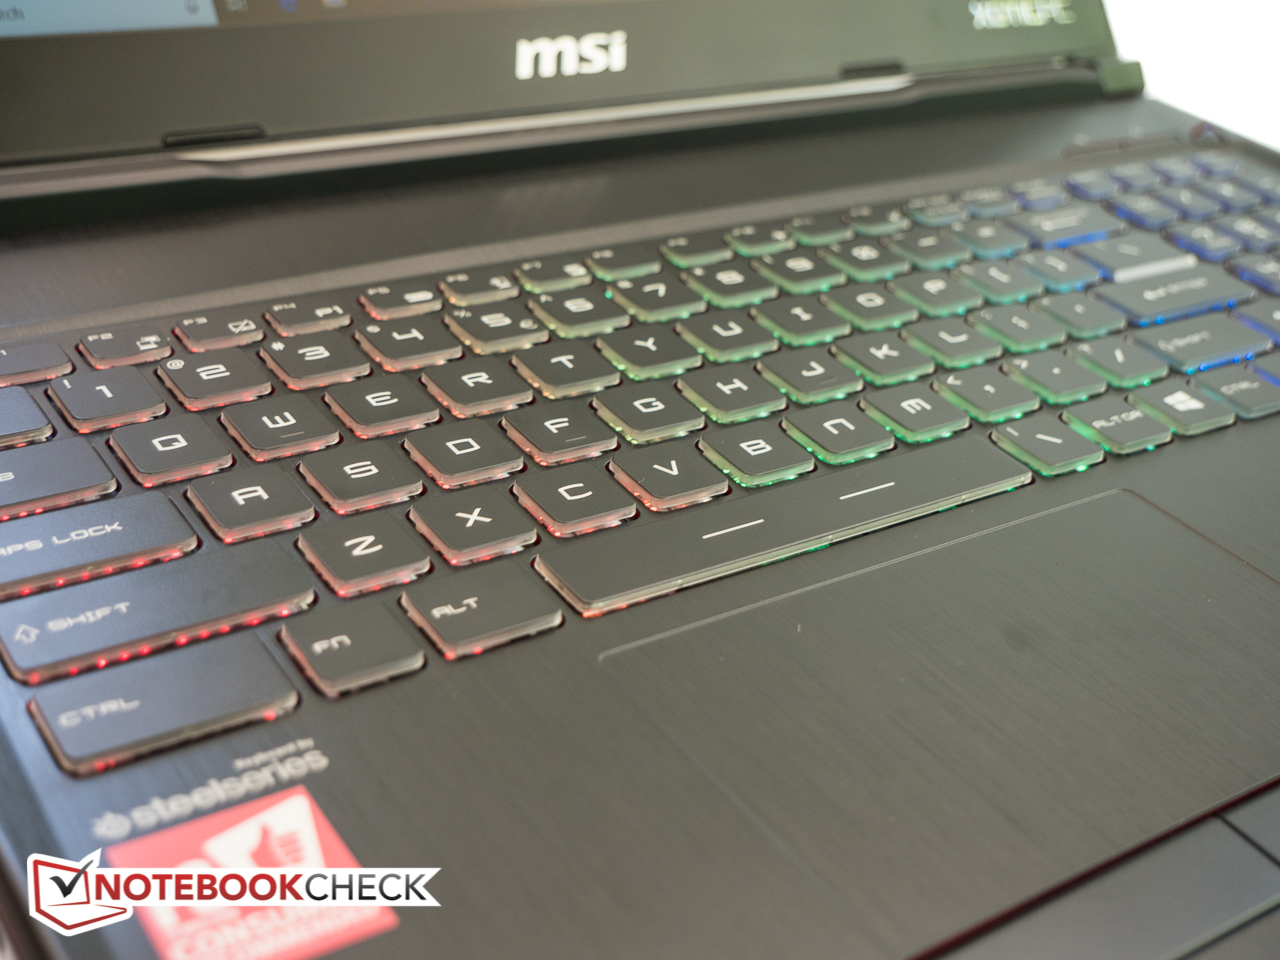
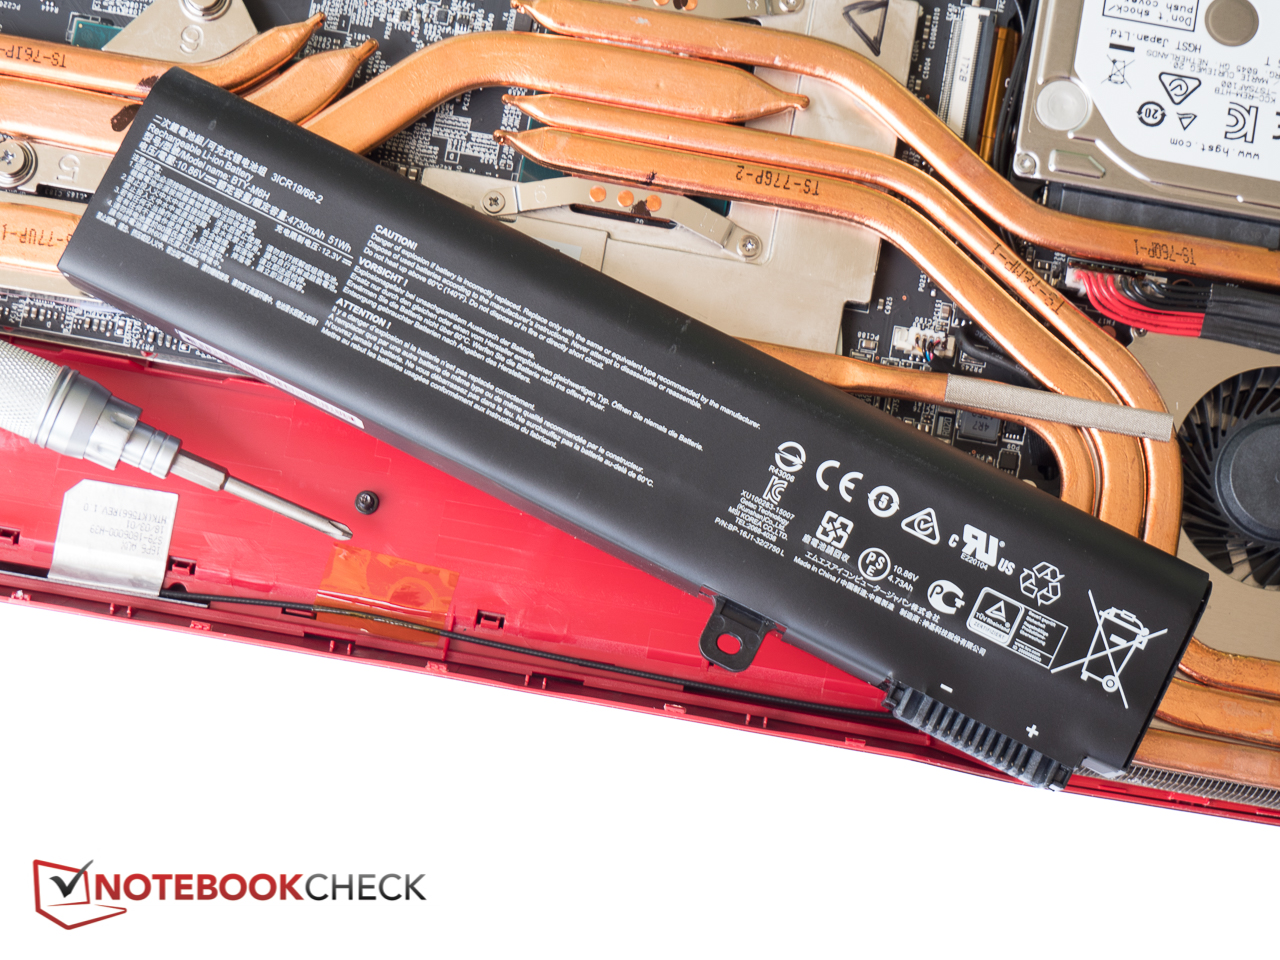
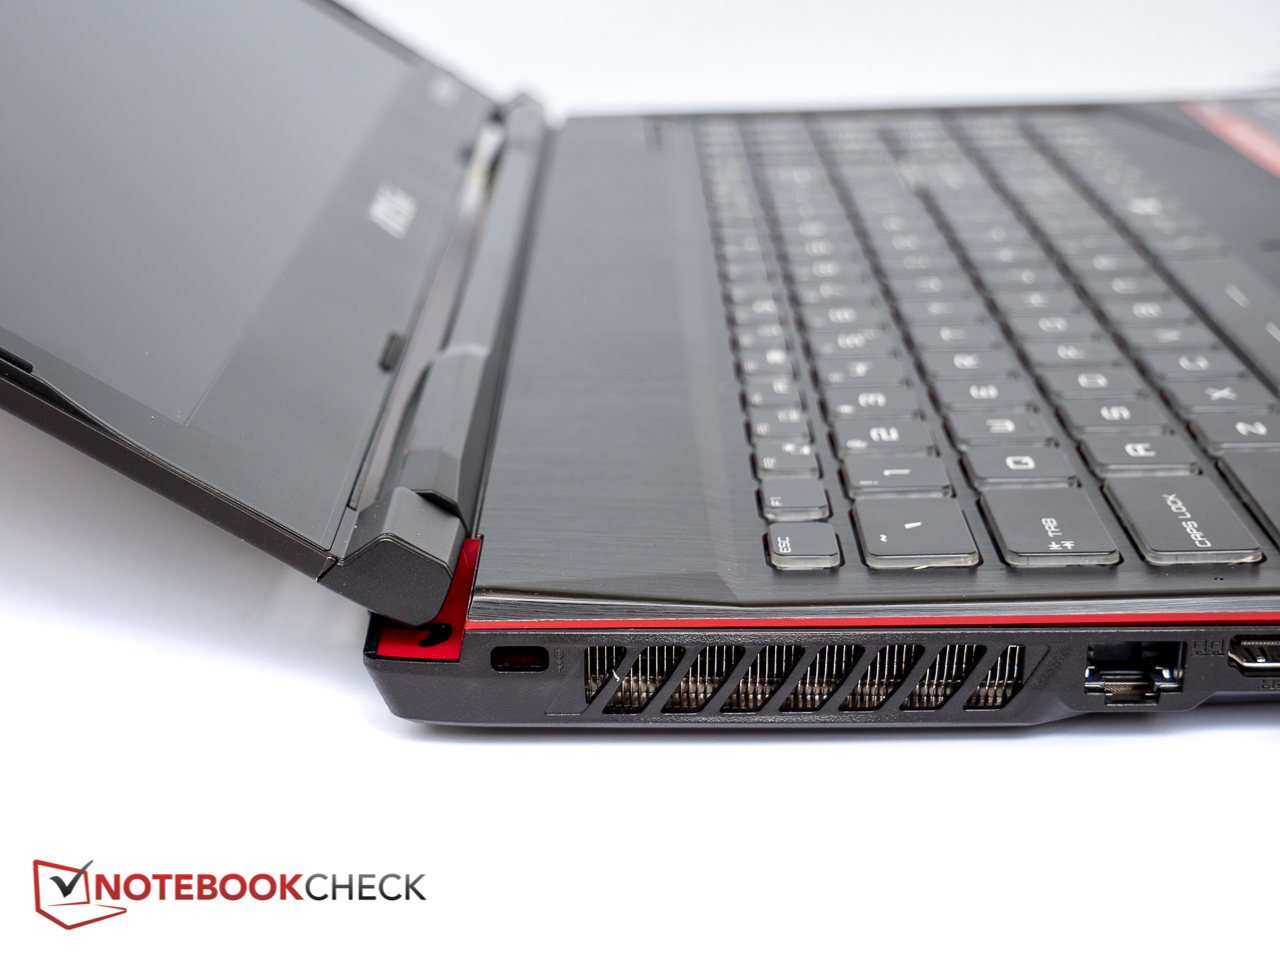
Az MSI GP63 Leopard Xotic PC Edition onnan folytatja, ahol az elődje, a GP62 abbahagyta. A ház minősége még mindig nem lenyűgöző, de a jobb hardver (hatmagos Coffee Lake-H CPU és a valamivel jobb GTX 1060 videokártya) garancia a teljesítmény jelentős növekedésére, valamint a jobb játékélményre. A plusz USB 3.0 a korábbi DVD+/-RW meghajtó helyén szintén örömteli változás. A három zónás, RGB háttérvilágítású billentyűzetet öröm használni, és a touchpad is megfelelő. A 120 Hz-es TN panel elég világos, betekintése elfogadható, színhűsége és szürkeárnyalatai - legalábbis kalibráció után - elég jók. A telep kapacitása is nőtt, így a gép korlátozottan, de mindenes notebooknak is beillik.
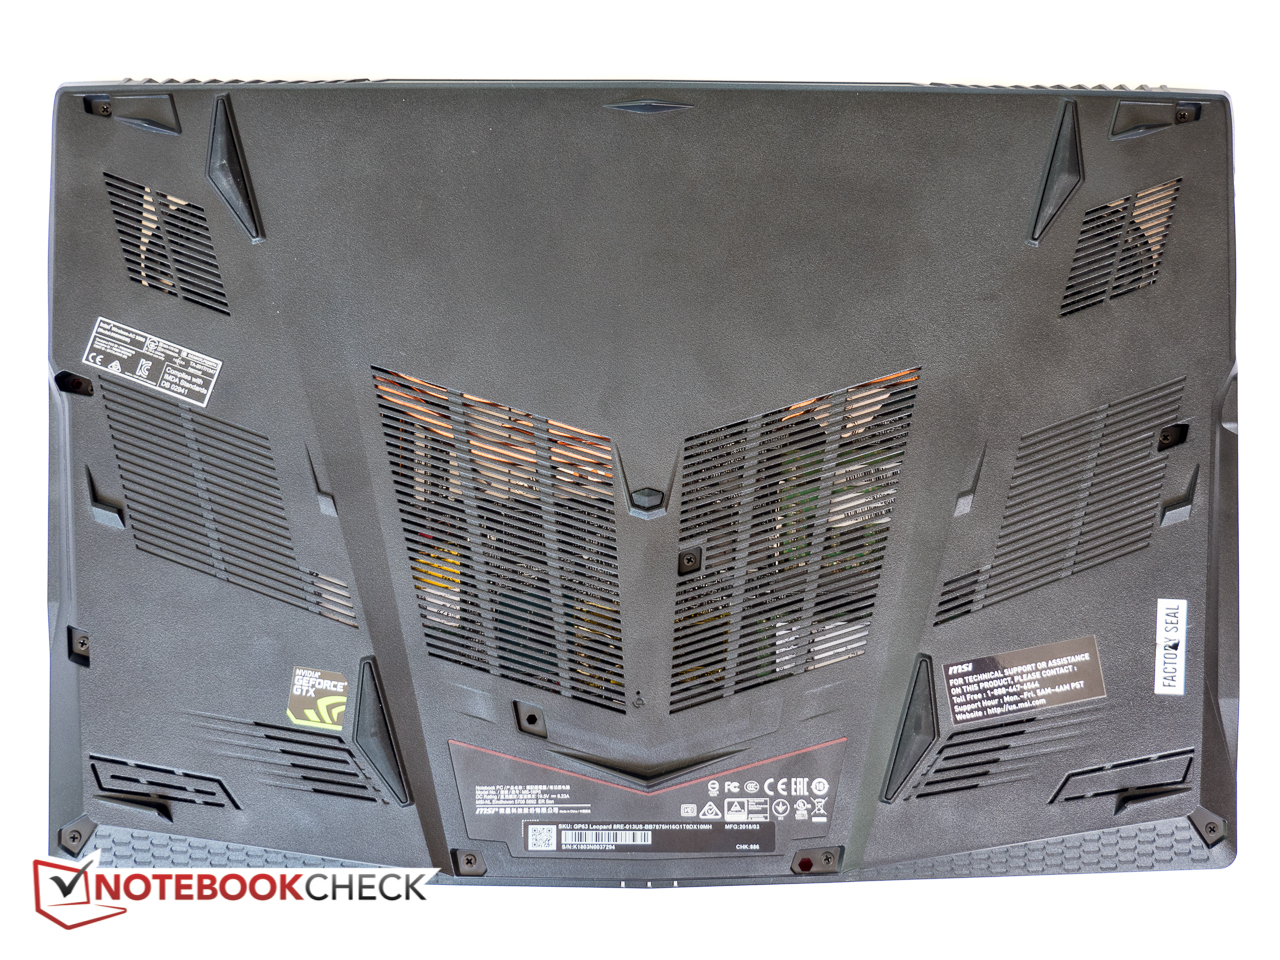
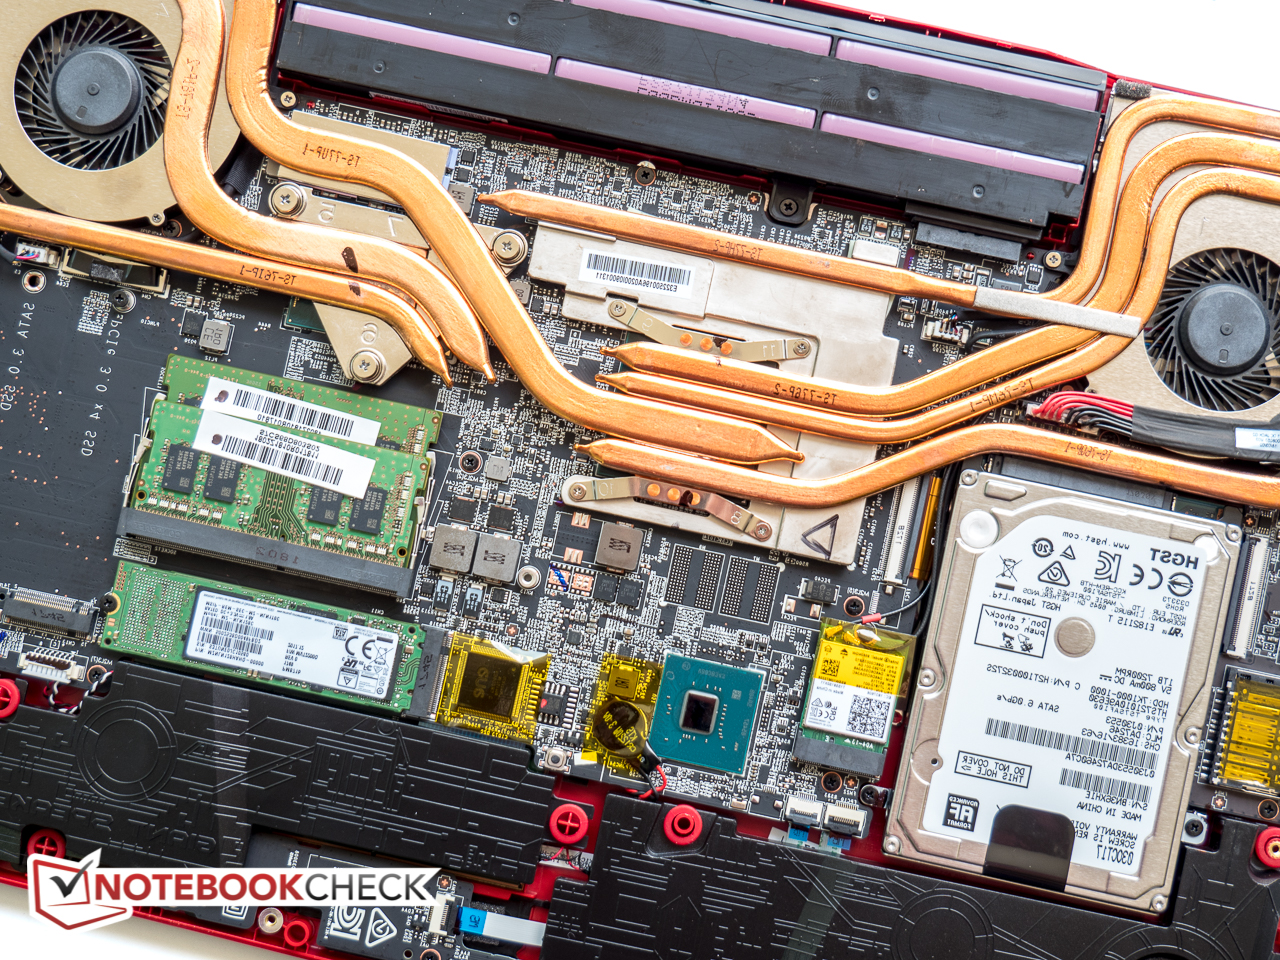
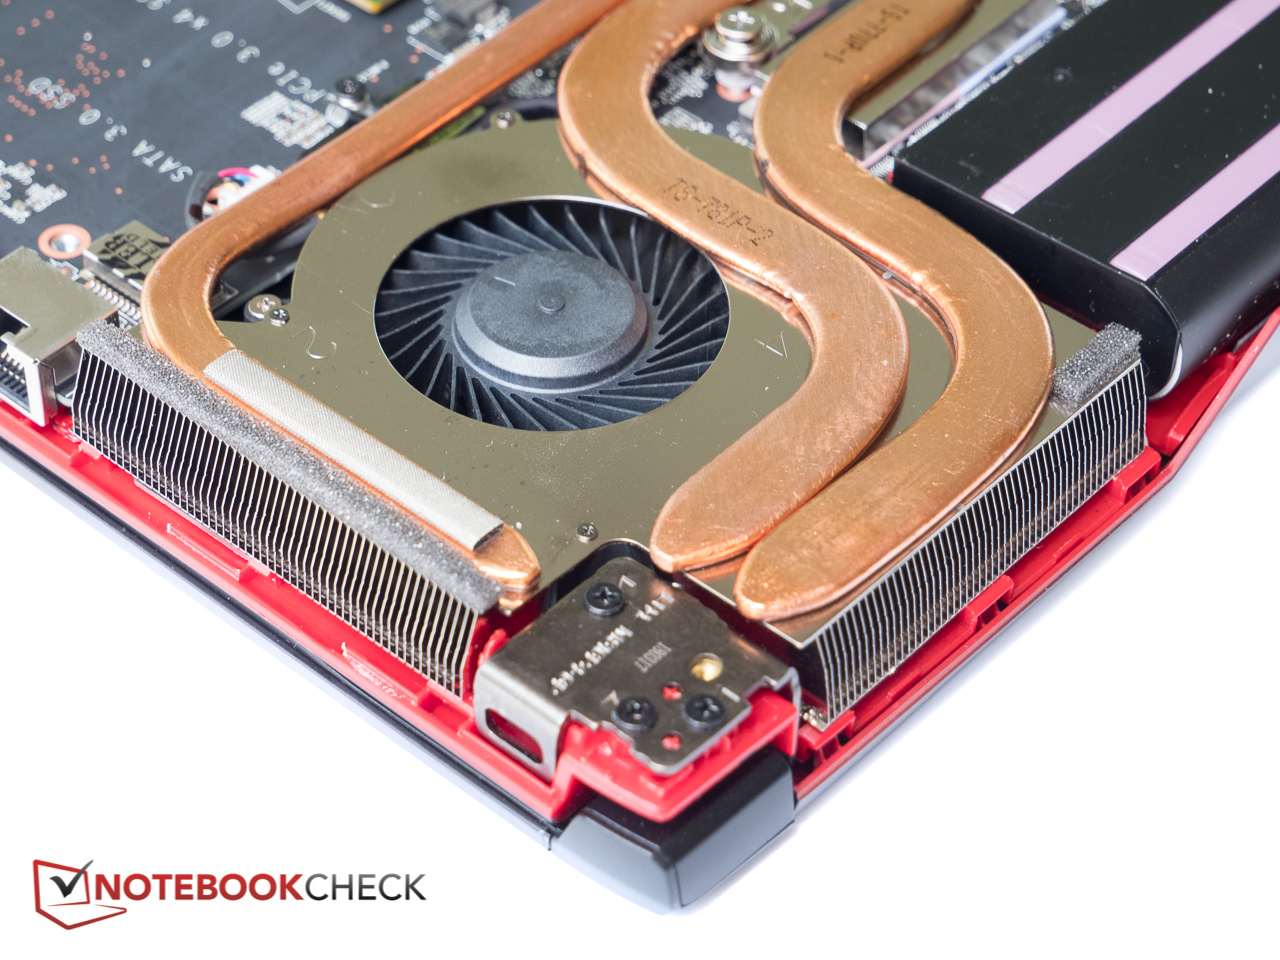
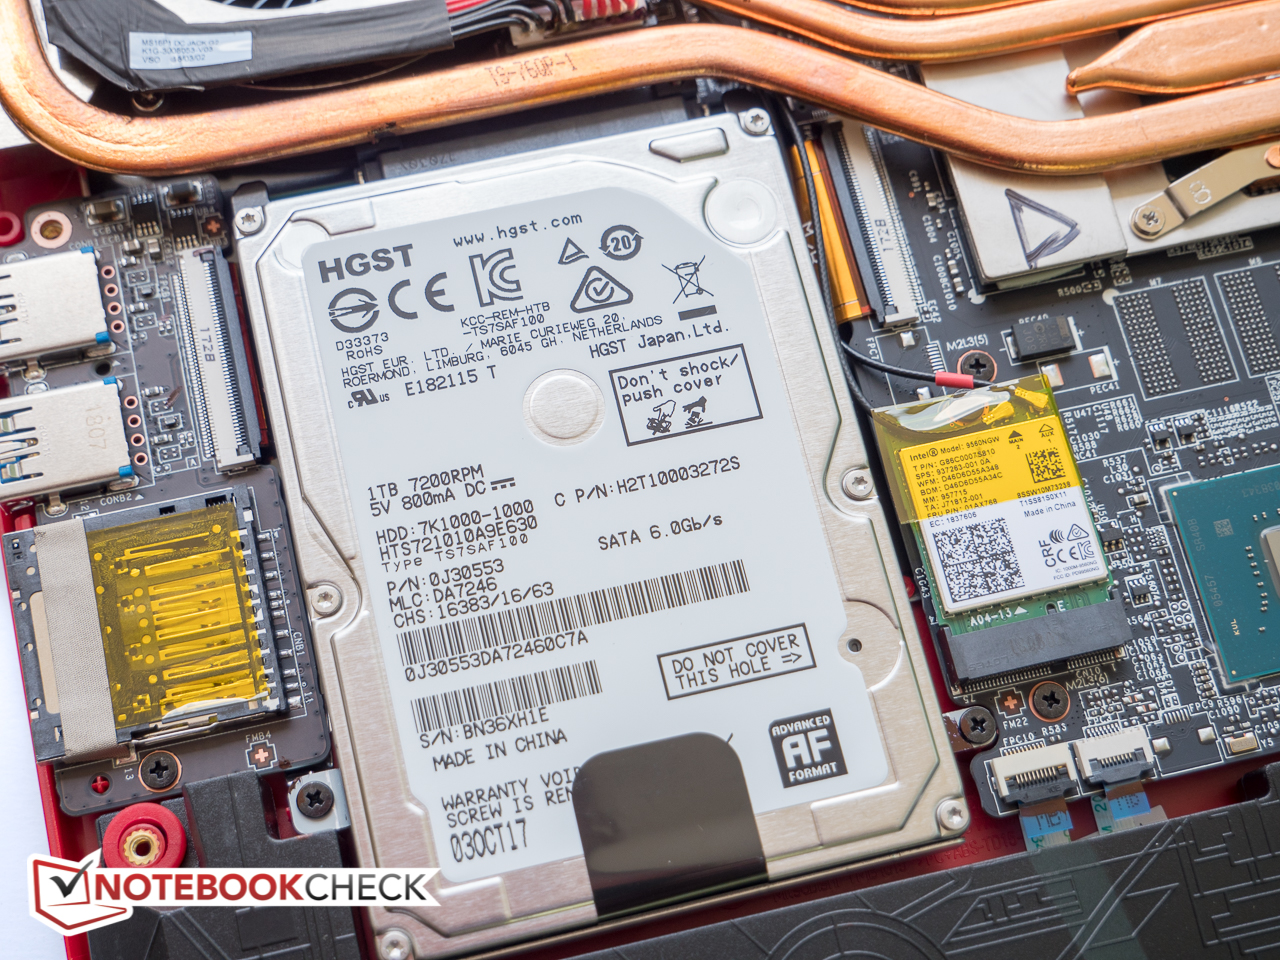
Az MSI hőmenedzsmentje elég konzervatív marad, az áttervezett és sokkal jobb hűtőrendszer ellenére is, amelyben jelenleg 7 hőelvezető található a korábbi hat helyett. Ugyan emiatt a CPU hőmérséklete általában alatta marad a vártnak, de a nyers számítási teljesítmény is. Szerintünk a 128 GB-os elsődleges SSD manapság már éppen csak a kötelező minimum szint, tehát nem ártana egy nagyobb és gyorsabb, 256 GB-os PCIe NVMe SSD. Annak ellenére, hogy a kijelző 120 Hz-es, a G-Sync nem támogatott.
Az MSI GP63 Leopard Xotic PC Edition jól megtervezett gamer laptop, ennek tökéletesen megfelelő teljesítménnyel - de éppenséggel nem olcsó darab.
Ez az eredeti értékelés rövidített változata. A teljes, angol nyelvű cikk itt olvasható.
MSI GP63 Leopard 8RE-013US
- 06/13/2018 v6 (old)
Bernie Pechlaner
Price comparison
