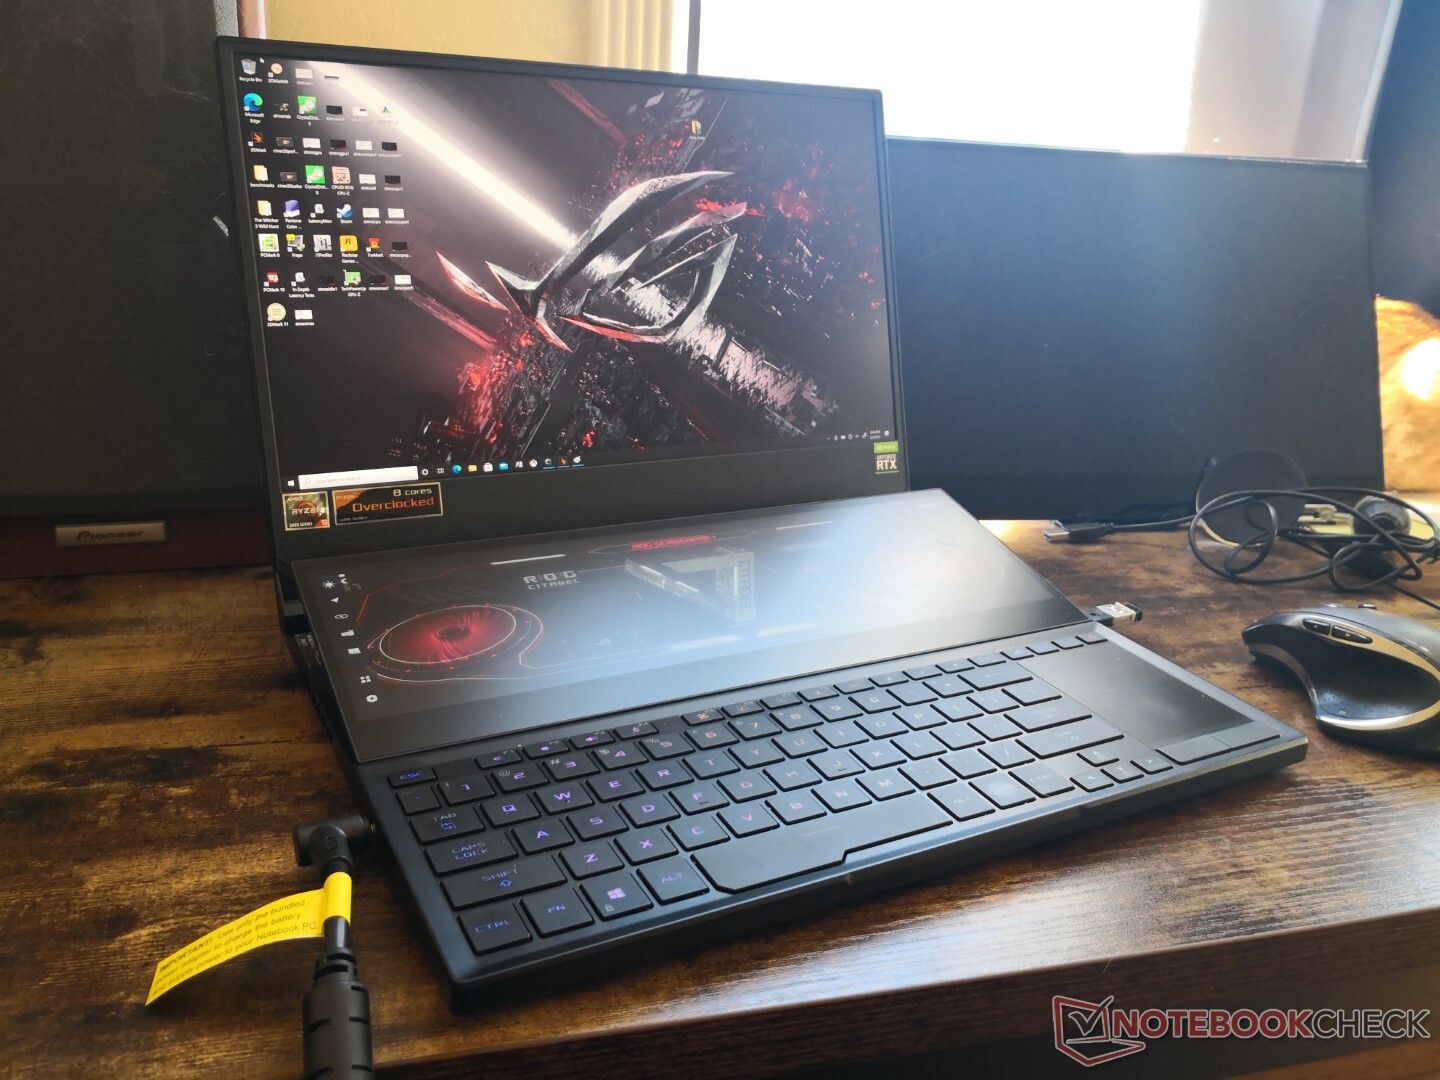
Az AMD Ryzen 9 5900HX egy mobil szörnyeteg: Asus ROG Zephyrus Duo 15 GX551QS Laptop rövid értékelés
potential competitors in comparison
Értékelés | Dátum | Modell | Súly | Magasság | Méret | Felbontás | Legjobb ár |
|---|---|---|---|---|---|---|---|
| 86.6 % v7 (old) | 07/2021 | Asus ROG Zephyrus Duo 15 SE GX551QS R9 5900HX, GeForce RTX 3080 Laptop GPU | 2.5 kg | 20.9 mm | 15.60" | 3840x2160 | |
| 84.5 % v7 (old) | 07/2020 | Asus ROG Zephyrus Duo 15 GX550LXS i9-10980HK, GeForce RTX 2080 Super Max-Q | 2.5 kg | 20 mm | 15.60" | 3840x2160 | |
| 85.9 % v7 (old) | 08/2020 | Razer Blade 15 RTX 2080 Super Max-Q i7-10875H, GeForce RTX 2080 Super Max-Q | 2.2 kg | 17.8 mm | 15.60" | 1920x1080 | |
| 84.6 % v7 (old) | Eurocom Sky X4C i9-9900KS i9-9900KS, GeForce RTX 2080 Mobile | 3.6 kg | 38 mm | 15.60" | 1920x1080 | ||
| 84.6 % v7 (old) | 12/2020 | MSI GE66 Raider 10SFS i9-10980HK, GeForce RTX 2070 Super Mobile | 2.4 kg | 23 mm | 15.60" | 1920x1080 | |
| 82.8 % v7 (old) | 07/2020 | MSI GS66 Stealth 10SFS i9-10980HK, GeForce RTX 2070 Super Max-Q | 2.2 kg | 20 mm | 15.60" | 1920x1080 |
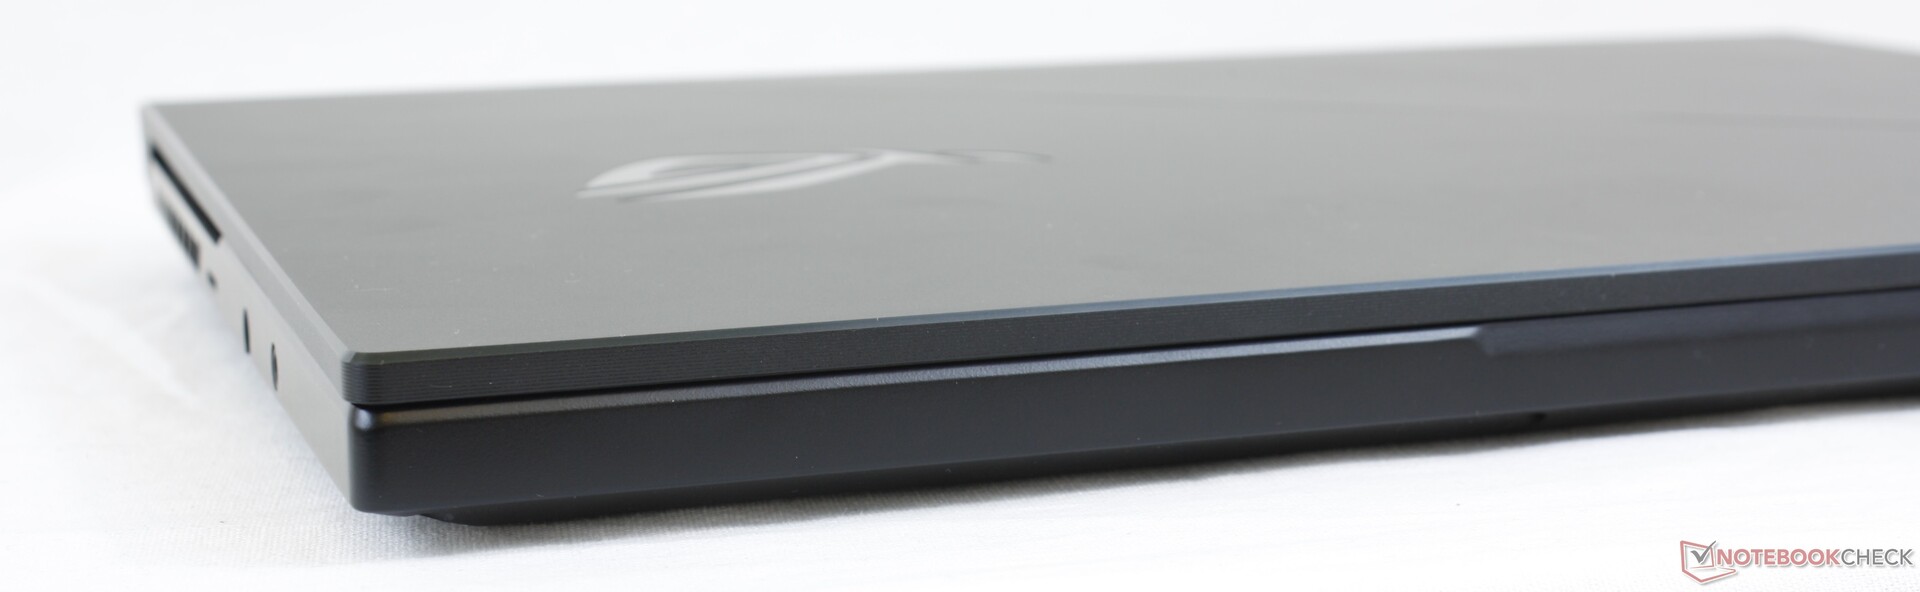
Case
| SD Card Reader | |
| average JPG Copy Test (av. of 3 runs) | |
| Razer Blade 15 RTX 2080 Super Max-Q (Toshiba Exceria Pro SDXC 64 GB UHS-II) | |
| Eurocom Sky X4C i9-9900KS (Toshiba Exceria Pro SDXC 64 GB UHS-II) | |
| MSI GE66 Raider 10SFS (Toshiba Exceria Pro SDXC 64 GB UHS-II) | |
| Asus ROG Zephyrus Duo 15 SE GX551QS (Toshiba Exceria Pro M501 microSDXC 32GB) | |
| maximum AS SSD Seq Read Test (1GB) | |
| Asus ROG Zephyrus Duo 15 SE GX551QS (Toshiba Exceria Pro M501 microSDXC 32GB) | |
| Razer Blade 15 RTX 2080 Super Max-Q (Toshiba Exceria Pro SDXC 64 GB UHS-II) | |
| Eurocom Sky X4C i9-9900KS (Toshiba Exceria Pro SDXC 64 GB UHS-II) | |
| MSI GE66 Raider 10SFS (Toshiba Exceria Pro SDXC 64 GB UHS-II) | |
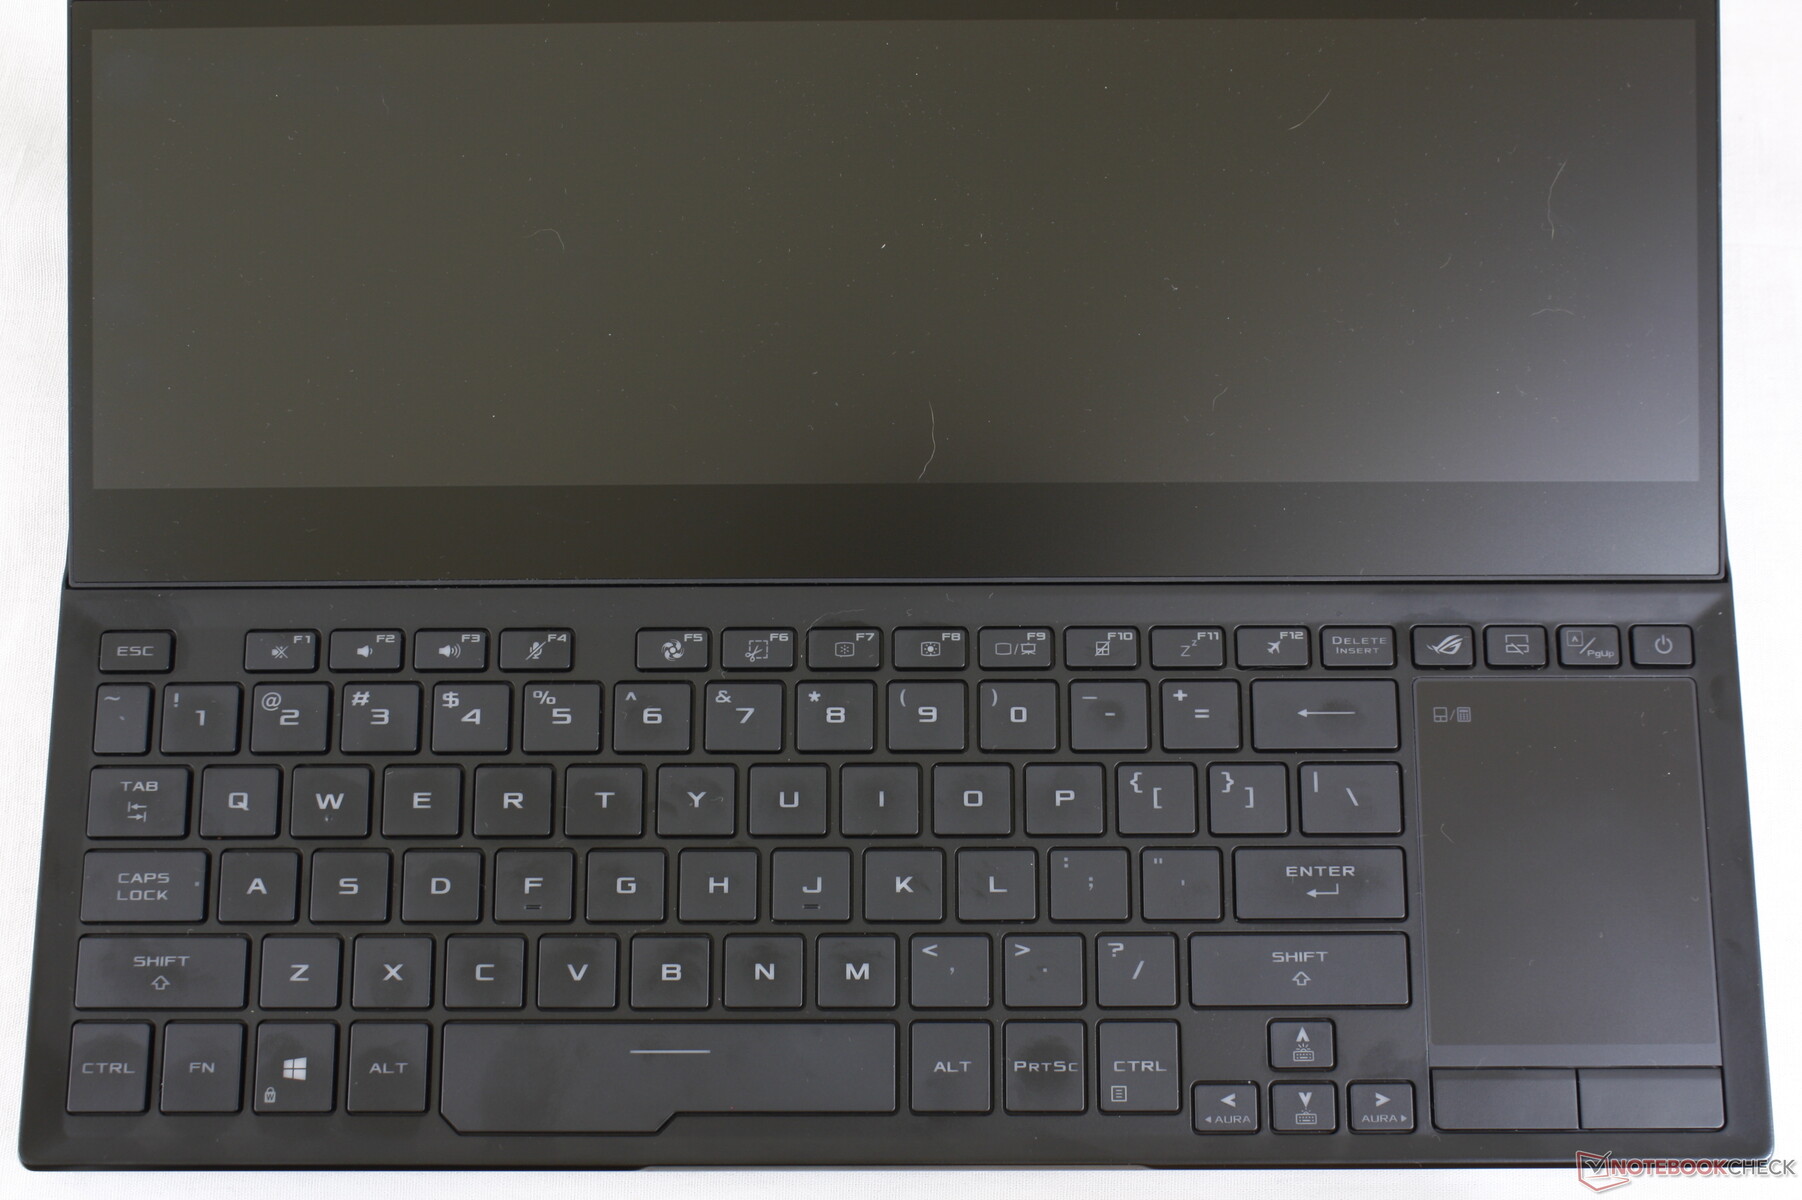
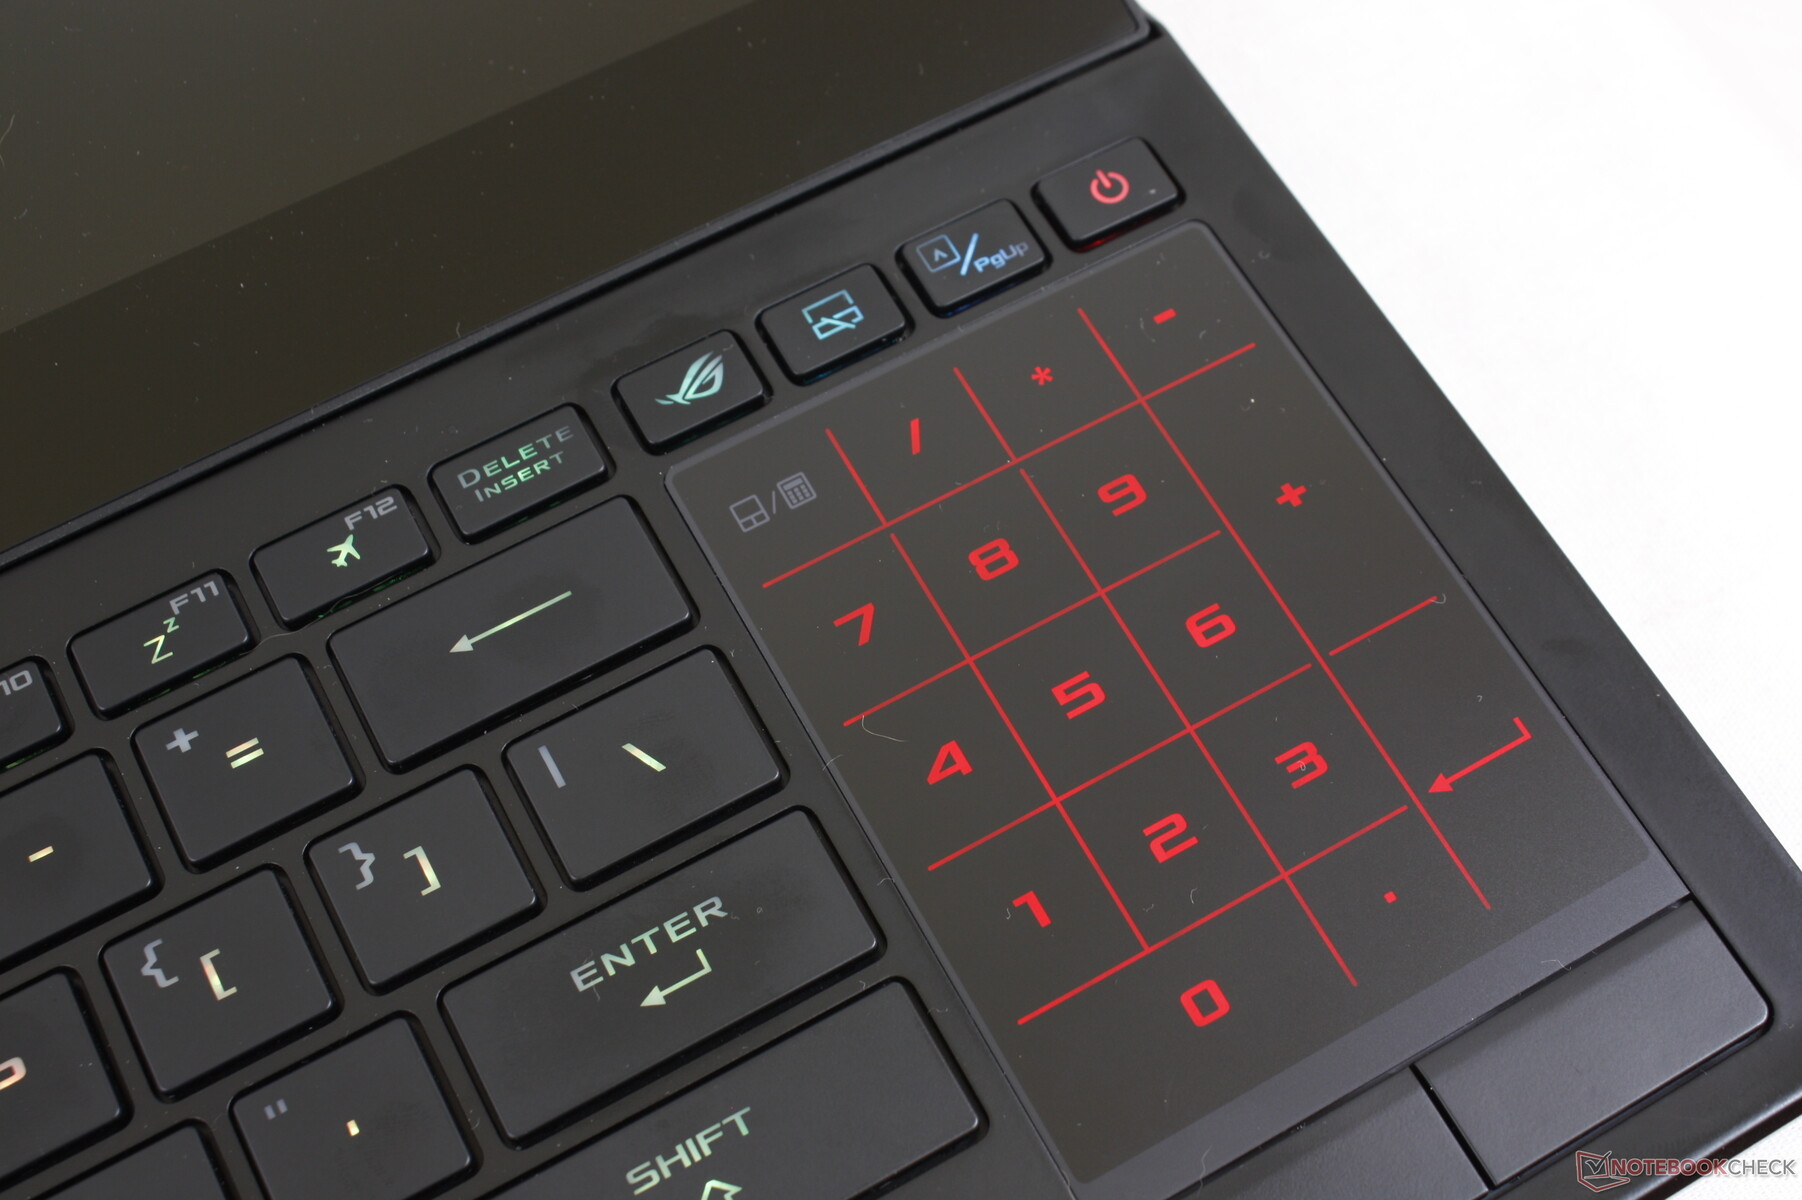
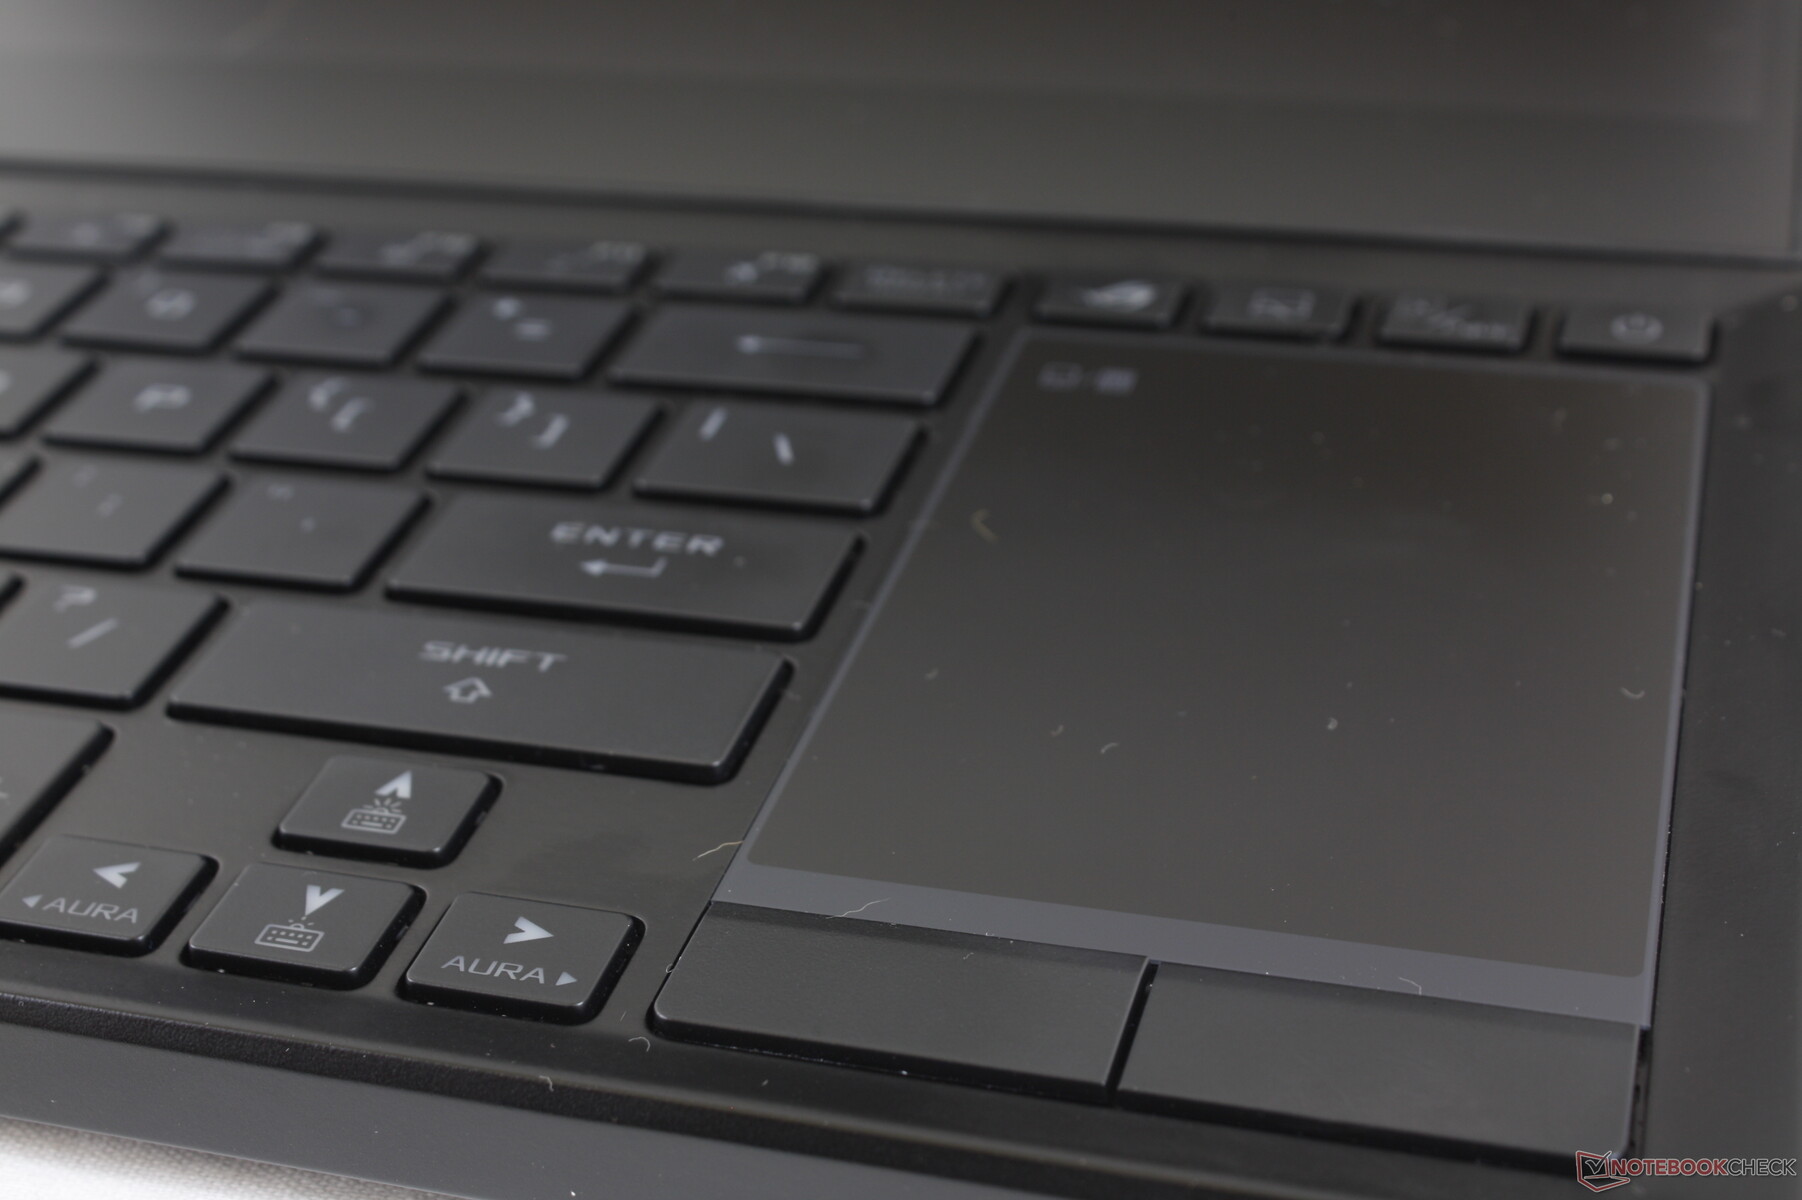
Input Devices

| |||||||||||||||||||||||||
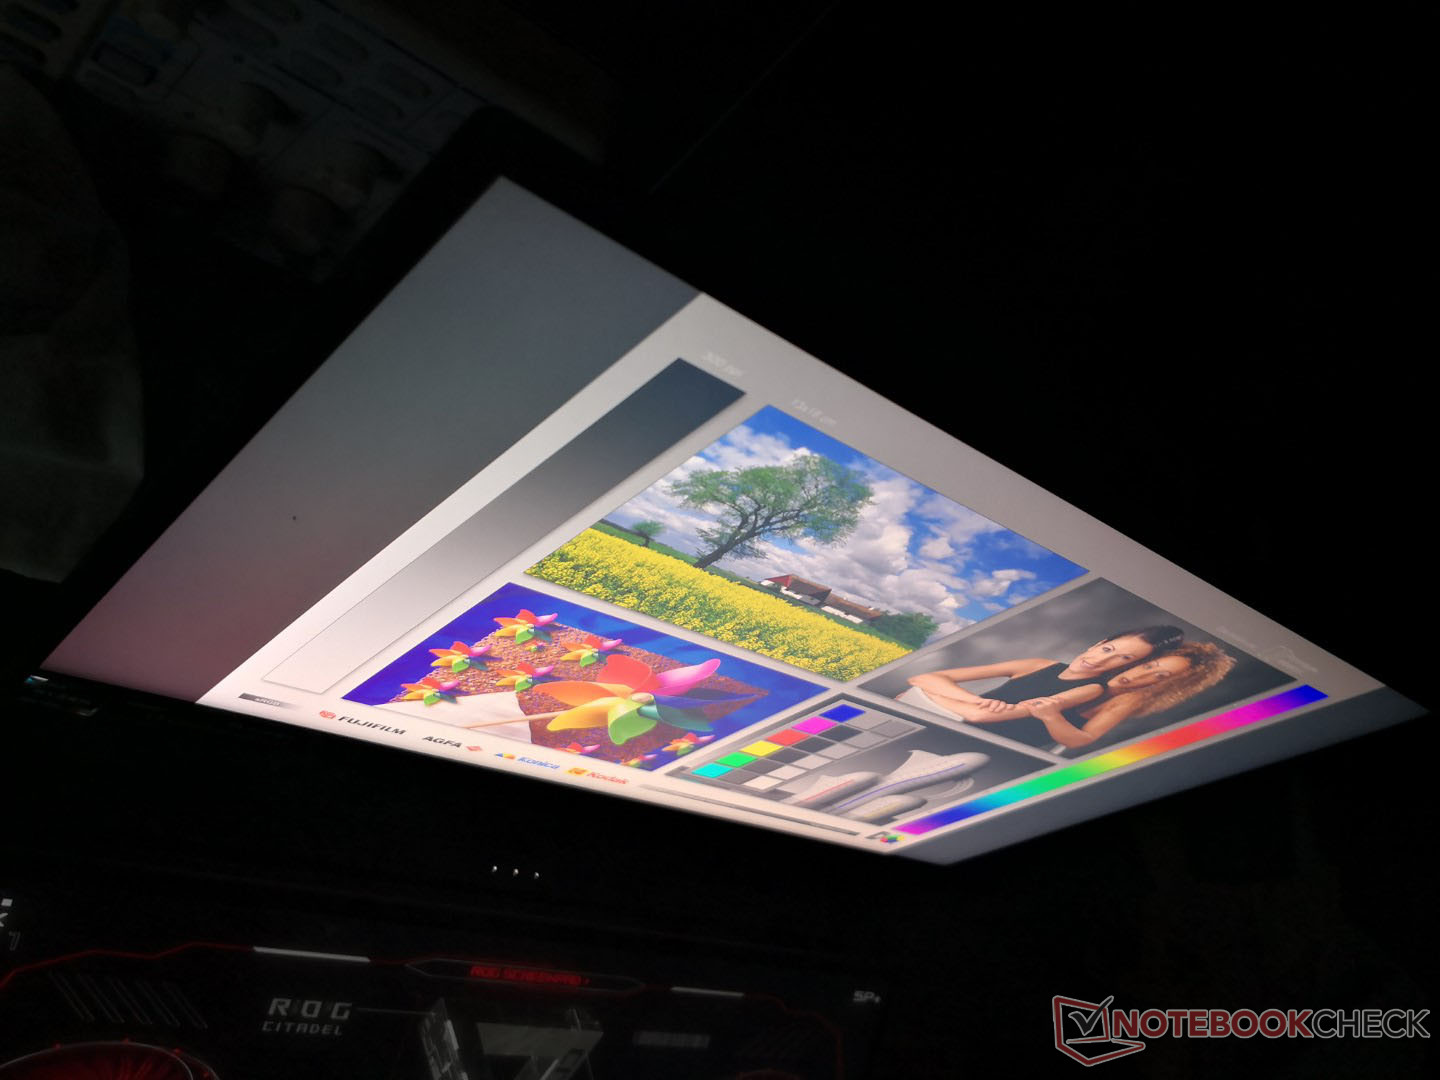
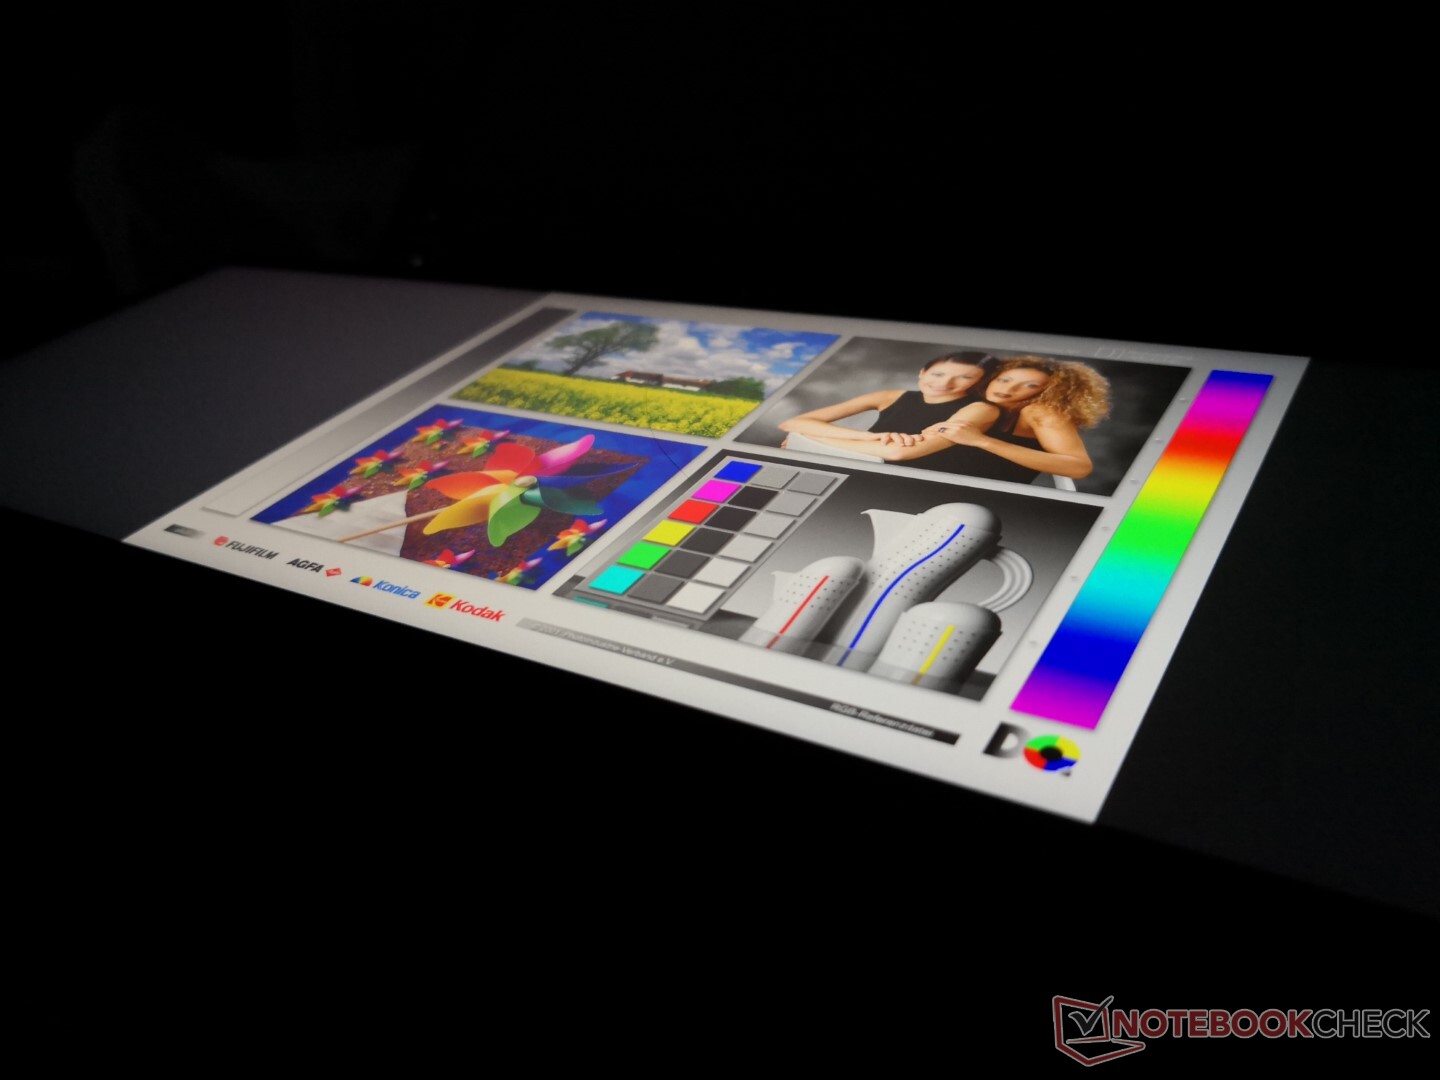
Fényerő megoszlás: 88 %
Centrumban: 210 cd/m²
Kontraszt: 967:1 (Fekete: 0.42 cd/m²)
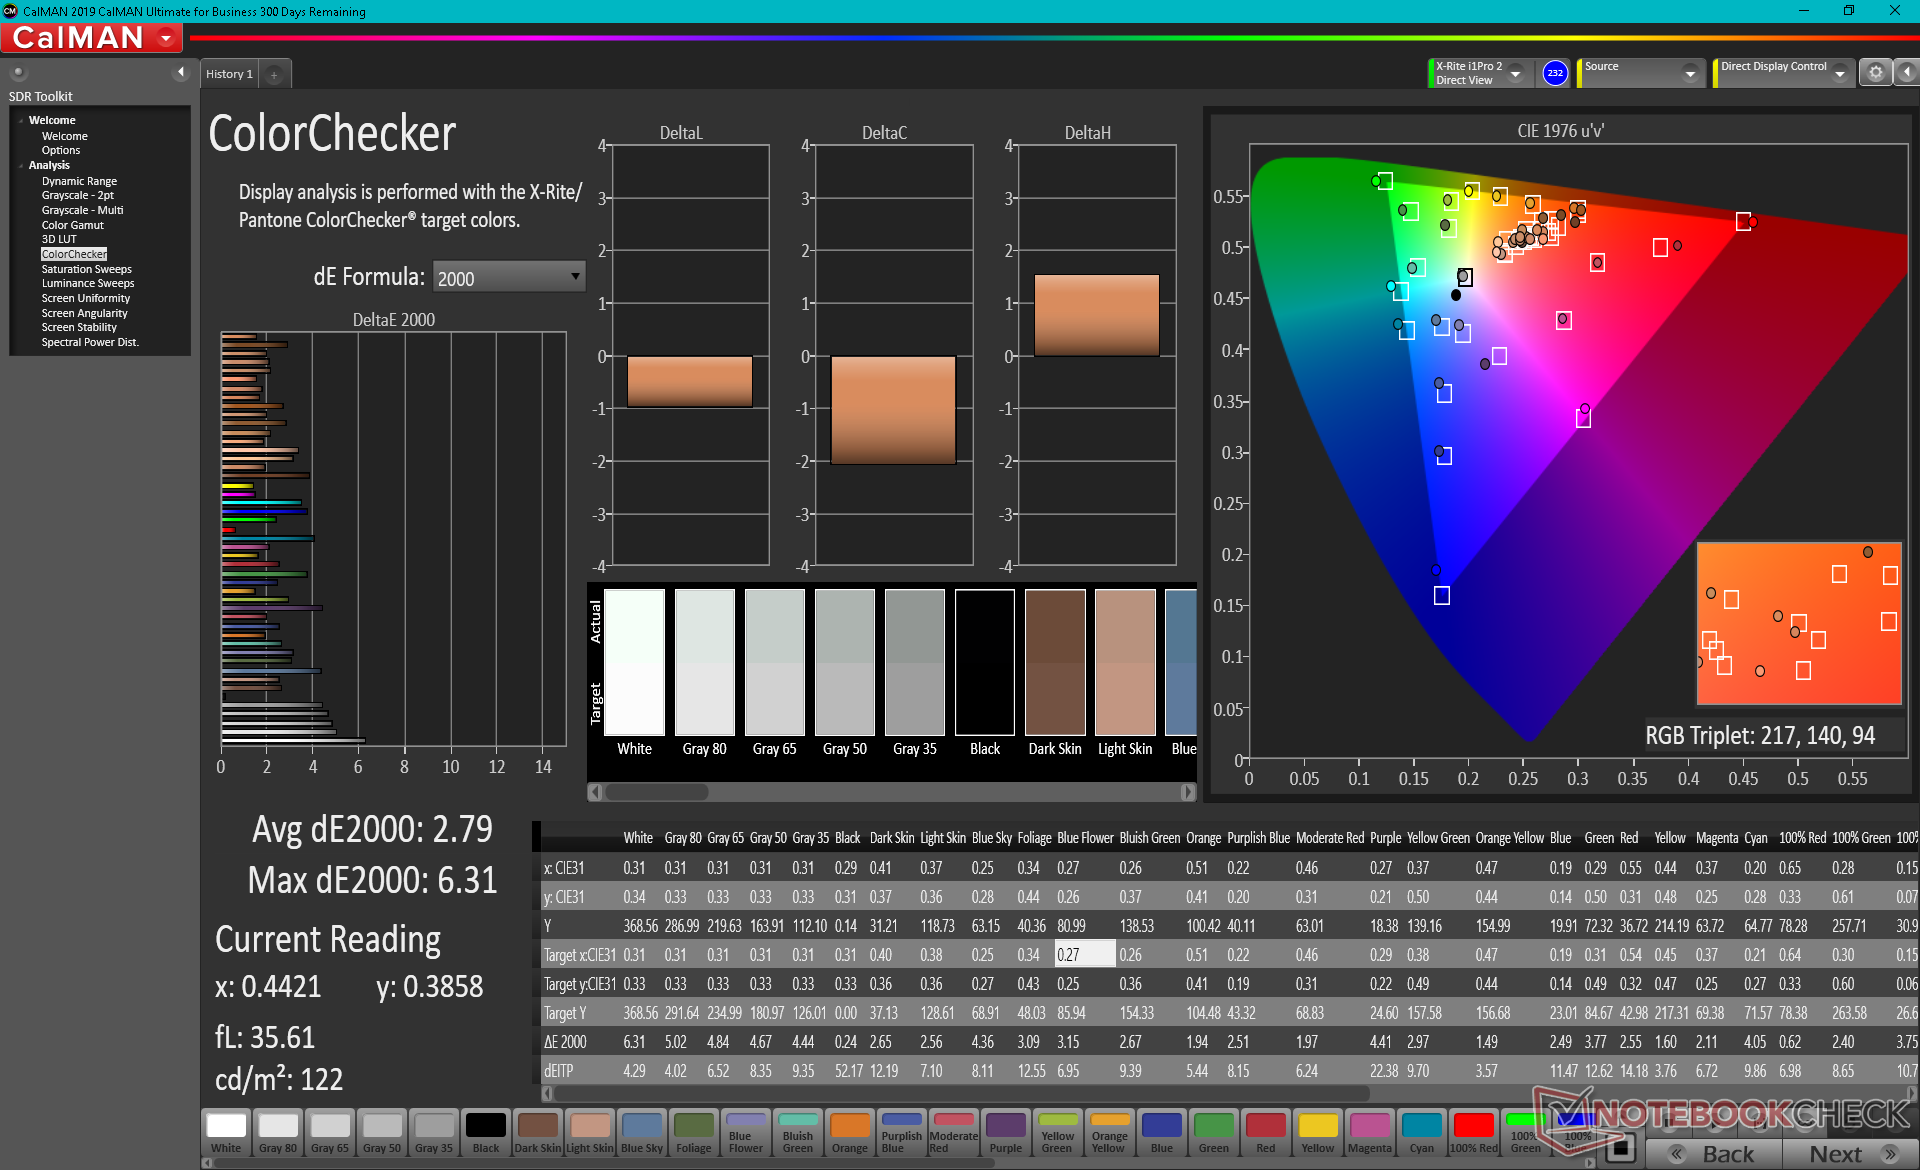
ΔE ColorChecker Calman: 4.36 | ∀{0.5-29.43 Ø4.73}
calibrated: 3.63
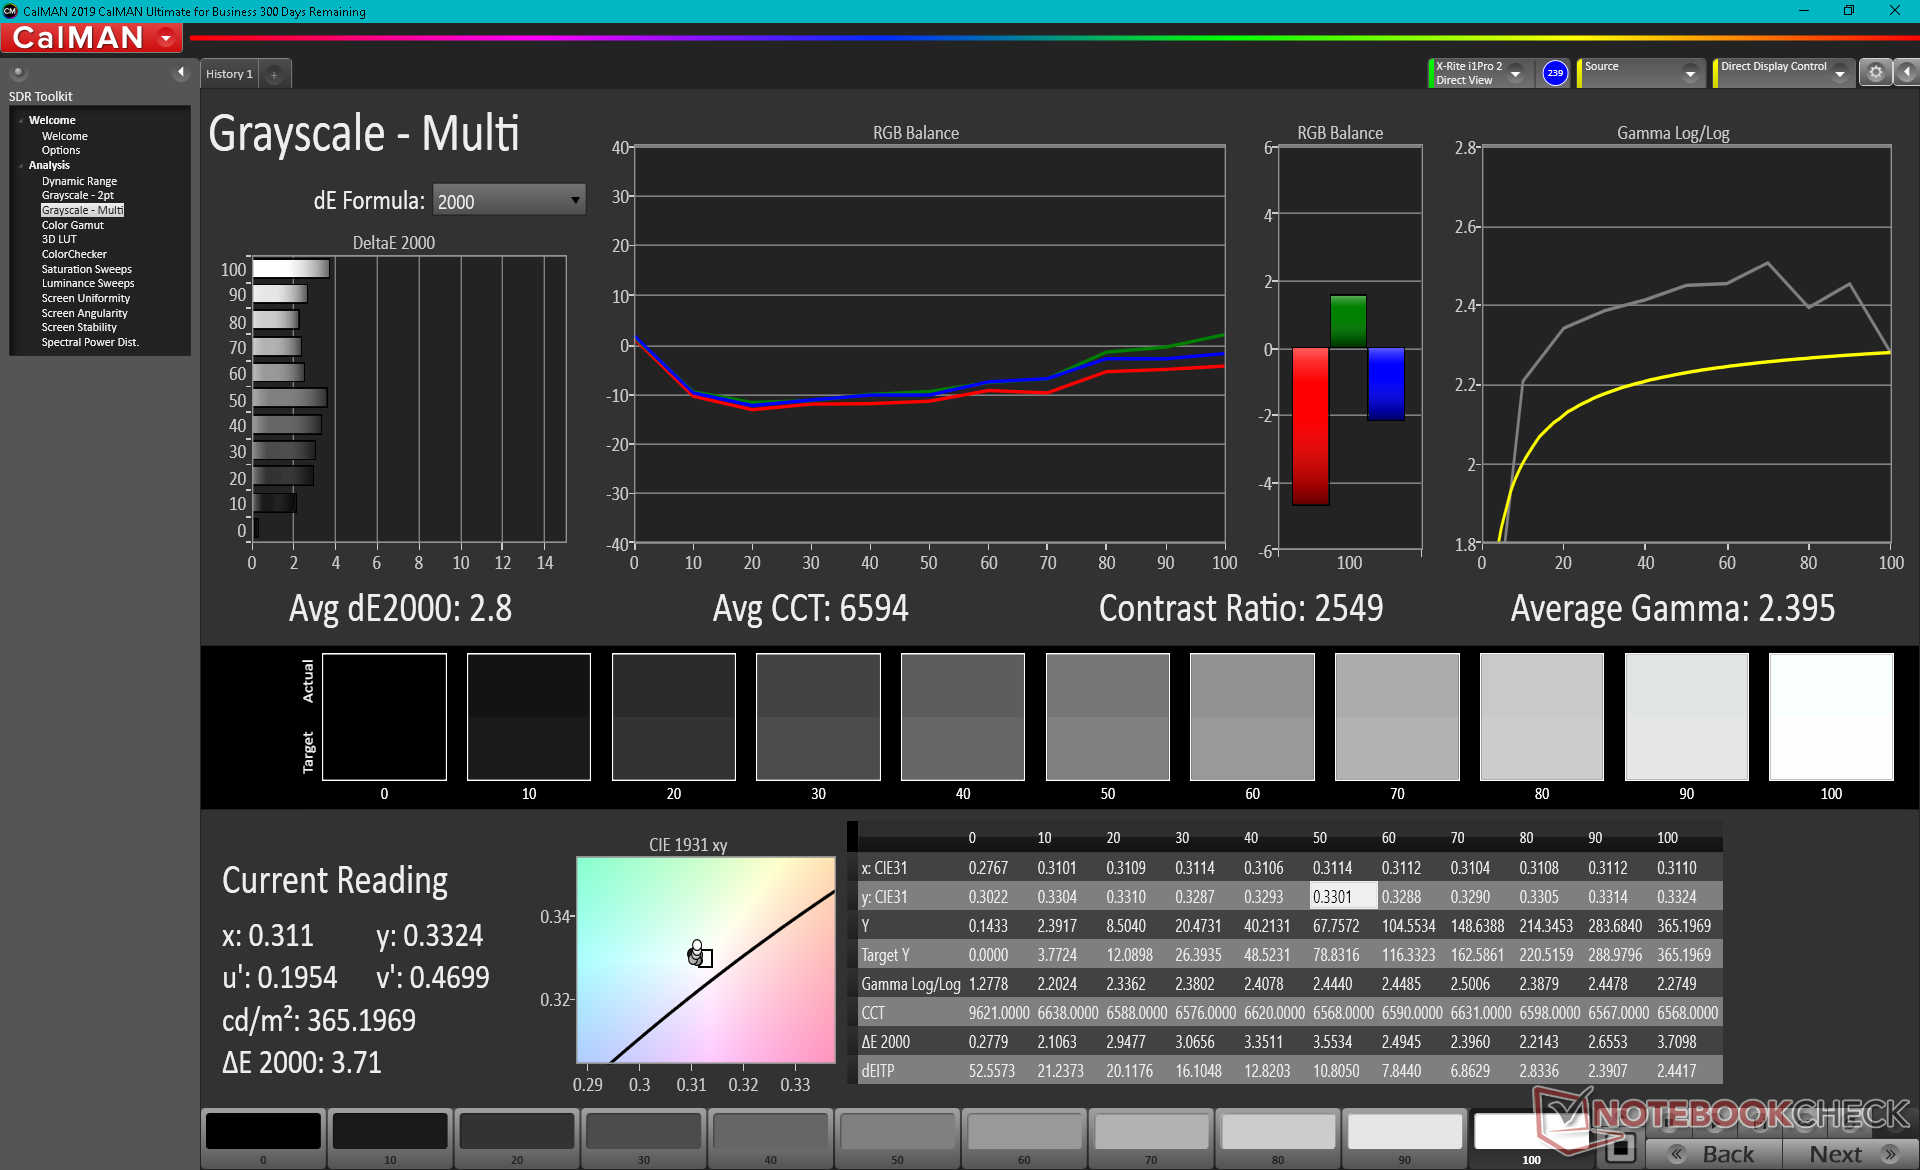
ΔE Greyscale Calman: 3.1 | ∀{0.09-98 Ø4.97}
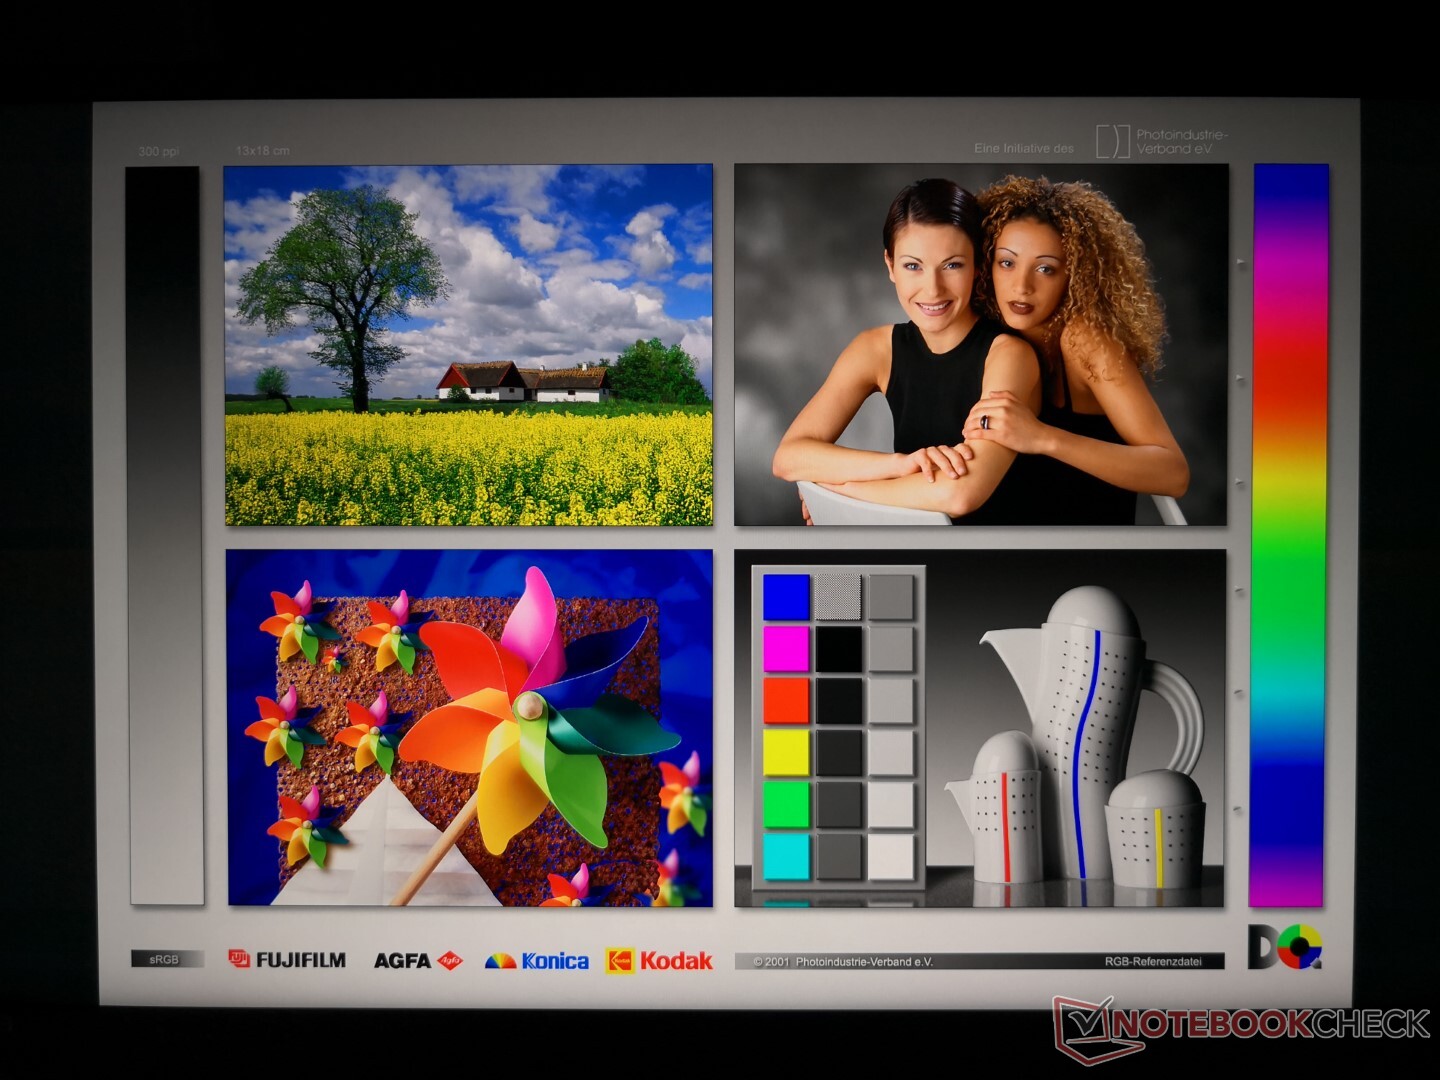
99.9% sRGB (Argyll 1.6.3 3D)
86.7% AdobeRGB 1998 (Argyll 1.6.3 3D)
99.1% AdobeRGB 1998 (Argyll 3D)
99.9% sRGB (Argyll 3D)
89.1% Display P3 (Argyll 3D)
Gamma: 2.36
CCT: 6371 K
| Asus ROG Zephyrus Duo 15 SE GX551QS AU Optronics B156ZAN05.1, IPS, 15.6", 3840x2160 | Asus ROG Zephyrus Duo 15 GX550LXS AU Optronics B156ZAN03.1, IPS, 15.6", 3840x2160 | Razer Blade 15 RTX 2080 Super Max-Q AU Optronics B156HAN12.0, IPS, 15.6", 1920x1080 | Eurocom Sky X4C i9-9900KS AU Optronics B156HAN07.0, IPS, 15.6", 1920x1080 | MSI GE66 Raider 10SFS Sharp LQ156M1JW03 (SHP14C5), IPS-Level, 15.6", 1920x1080 | Asus Zephyrus S15 GX502L B156HAN12.0 (AUOBC8C), IPS, 15.6", 1920x1080 | |
|---|---|---|---|---|---|---|
| Display | -0% | -17% | -24% | -18% | -17% | |
| Display P3 Coverage (%) | 89.1 | 87 -2% | 70.2 -21% | 63.6 -29% | 68 -24% | 69.7 -22% |
| sRGB Coverage (%) | 99.9 | 100 0% | 99 -1% | 90.9 -9% | 99 -1% | 99.7 0% |
| AdobeRGB 1998 Coverage (%) | 99.1 | 99.9 1% | 71.4 -28% | 64.7 -35% | 69.8 -30% | 71.1 -28% |
| Response Times | -362% | 20% | -55% | -50% | -32% | |
| Response Time Grey 50% / Grey 80% * (ms) | 8.2 ? | 56.4 ? -588% | 6 ? 27% | 16.8 ? -105% | 16.4 ? -100% | 14 ? -71% |
| Response Time Black / White * (ms) | 10.4 ? | 24.4 ? -135% | 9 ? 13% | 10.8 ? -4% | 10.4 ? -0% | 9.6 ? 8% |
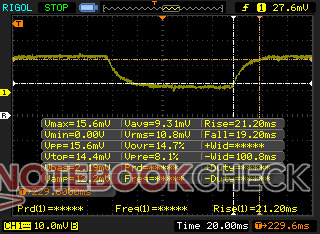
| PWM Frequency (Hz) | 23580 ? | |||||
| Screen | 28% | 15% | -18% | 15% | 10% | |
| Brightness middle (cd/m²) | 406 | 398 -2% | 347 -15% | 258.8 -36% | 291 -28% | 283 -30% |
| Brightness (cd/m²) | 407 | 385 -5% | 328 -19% | 258 -37% | 278 -32% | 289 -29% |
| Brightness Distribution (%) | 88 | 90 2% | 89 1% | 82 -7% | 91 3% | 90 2% |
| Black Level * (cd/m²) | 0.42 | 0.28 33% | 0.285 32% | 0.28 33% | 0.25 40% | 0.24 43% |
| Contrast (:1) | 967 | 1421 47% | 1218 26% | 924 -4% | 1164 20% | 1179 22% |
| Colorchecker dE 2000 * | 4.36 | 1.53 65% | 2.35 46% | 4.45 -2% | 1.19 73% | 2.26 48% |
| Colorchecker dE 2000 max. * | 7.55 | 3.69 51% | 4.15 45% | 9.85 -30% | 3.04 60% | 5.64 25% |
| Colorchecker dE 2000 calibrated * | 3.63 | 0.77 79% | 1.16 68% | 3 17% | 1.11 69% | |
| Greyscale dE 2000 * | 3.1 | 2.4 23% | 3.04 2% | 5.8 -87% | 1.9 39% | 3.4 -10% |
| Gamma | 2.36 93% | 2.19 100% | 2.35 94% | 2.36 93% | 2.216 99% | 2.228 99% |
| CCT | 6371 102% | 6996 93% | 6658 98% | 7651 85% | 7018 93% | 7249 90% |
| Color Space (Percent of AdobeRGB 1998) (%) | 86.7 | 100 15% | 65 -25% | 58.8 -32% | 70 -19% | 71 -18% |
| Color Space (Percent of sRGB) (%) | 99.9 | 100 0% | 99 -1% | 90.5 -9% | 92 -8% | 93 -7% |
| Teljes átlag (program / beállítások) | -111% /
-26% | 6% /
9% | -32% /
-24% | -18% /
-0% | -13% /
0% |
* ... a kisebb jobb
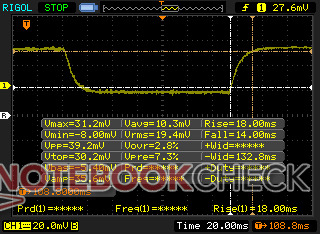
Megjelenítési válaszidők
| ↔ Válaszidő Fekete-fehér | ||
|---|---|---|
| 10.4 ms ... emelkedés és süllyedés ↘ kombinálva | ↗ 5.2 ms emelkedés | 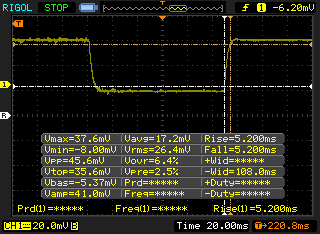 |
| ↘ 5.2 ms ősz | ||
| A képernyő jó reakciósebességet mutat tesztjeinkben, de túl lassú lehet a versenyképes játékosok számára. Összehasonlításképpen, az összes tesztelt eszköz 0.1 (minimum) és 240 (maximum) ms között mozog. » 28 % of all devices are better. Ez azt jelenti, hogy a mért válaszidő jobb, mint az összes vizsgált eszköz átlaga (19.9 ms). | ||
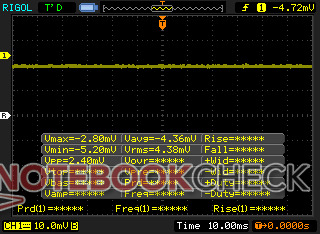
| ↔ Válaszidő 50% szürke és 80% szürke között | ||
| 8.2 ms ... emelkedés és süllyedés ↘ kombinálva | ↗ 3 ms emelkedés | 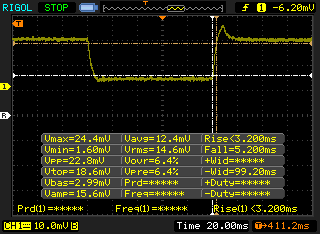 |
| ↘ 5.2 ms ősz | ||
| A képernyő gyors reakciósebességet mutat tesztjeinkben, és játékra is alkalmasnak kell lennie. Összehasonlításképpen, az összes tesztelt eszköz 0.165 (minimum) és 636 (maximum) ms között mozog. » 22 % of all devices are better. Ez azt jelenti, hogy a mért válaszidő jobb, mint az összes vizsgált eszköz átlaga (31.1 ms). | ||
Képernyő villogása / PWM (impulzusszélesség-moduláció)
| Képernyő villogása / PWM nem érzékelhető | 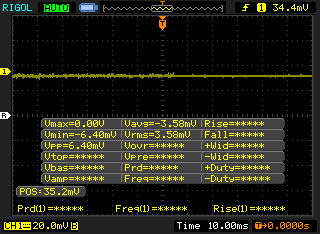 | ||
Összehasonlításképpen: az összes tesztelt eszköz 52 %-a nem használja a PWM-et a kijelző elsötétítésére. Ha PWM-et észleltek, akkor átlagosan 7794 (minimum: 5 - maximum: 343500) Hz-t mértek. | |||


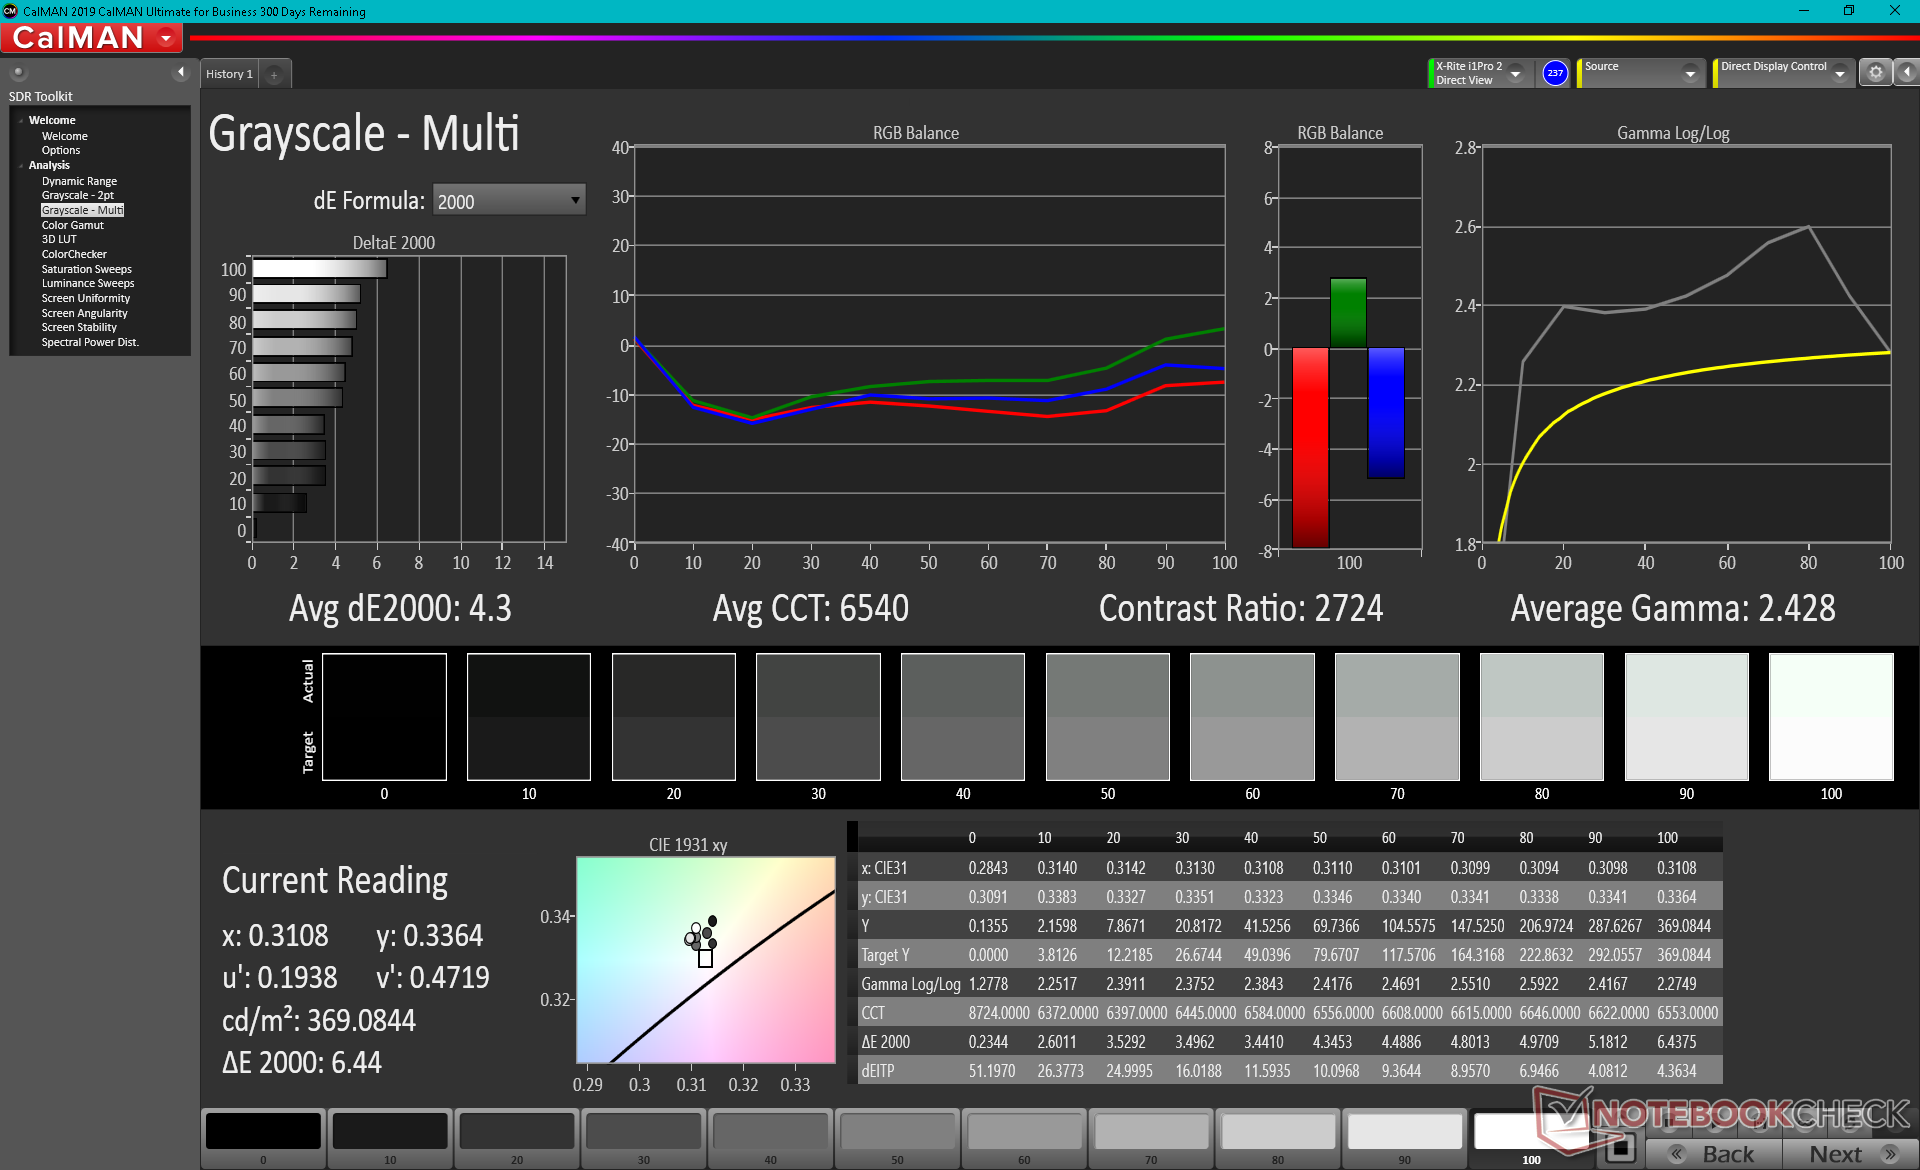


| Screen Size, Native Resolution | 14.09-inches, 3840 x 1100 (4K SKUs), 1920 x 550 (FHD SKUs) |
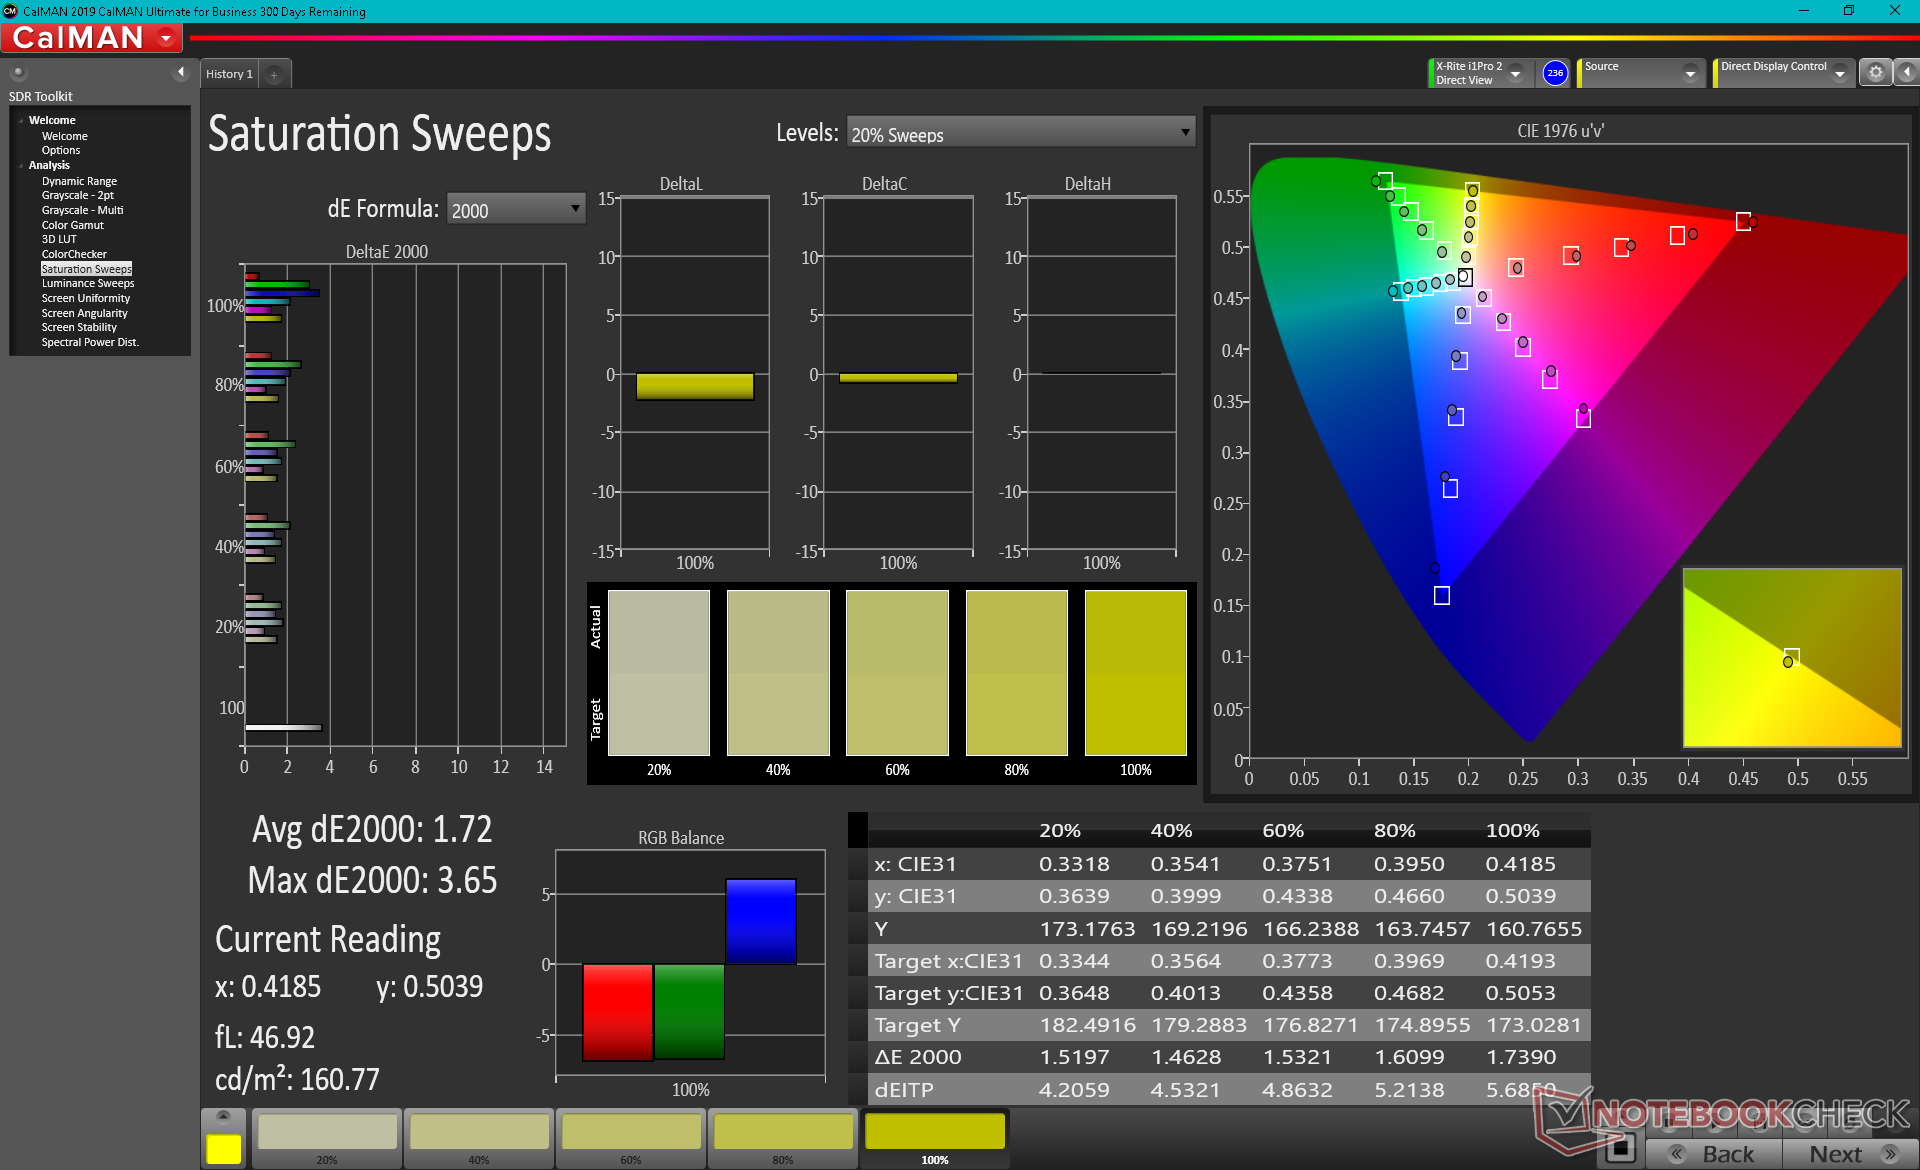
| Color Space | 95.3 percent sRGB, 62.6 percent AdobeRGB |
| Black-White Response Times | 18 ms rise, 14 ms fall |
| Gray-Gray Response Times | 21.2 ms rise, 19.2 ms fall |
| Maximum Brightness | 368.5 nits |
| Contrast Ratio | 2632:1 |
| Colorchecker DeltaE2000 | 2.79 |
| Greyscale DeltaE2000 | 4.3 |
| Gamma | 2.43 |
| CCT | 6540 |
Cinebench R15: CPU Multi 64Bit | CPU Single 64Bit
Blender: v2.79 BMW27 CPU
7-Zip 18.03: 7z b 4 -mmt1 | 7z b 4
Geekbench 5.5: Single-Core | Multi-Core
HWBOT x265 Benchmark v2.2: 4k Preset
LibreOffice : 20 Documents To PDF
R Benchmark 2.5: Overall mean
| Cinebench R20 / CPU (Multi Core) | |
| MSI GT76 Titan DT 10SGS | |
| Asus ROG Zephyrus Duo 15 SE GX551QS | |
| Átlagos AMD Ryzen 9 5900HX (2242 - 5476, n=30) | |
| Asus ROG Zephyrus G15 GA503Q | |
| Schenker XMG Neo 17 (Early 2021, RTX 3070, 5800H) | |
| Schenker XMG Core 15 GK5NR0O | |
| HP Omen 15-en0375ng | |
| Lenovo Legion 7 15IMH05-81YT001VGE | |
| Asus ROG Zephyrus G15 GA502IU-ES76 | |
| Eurocom Nightsky RX15 | |
| Asus ROG Zephyrus Duo 15 GX550LXS | |
| Asus ROG Strix G15 G512LW | |
| Razer Blade 15 RTX 2070 Super Max-Q | |
| Asus TUF Dash F15 FX516PR | |
| Cinebench R20 / CPU (Single Core) | |
| Átlagos AMD Ryzen 9 5900HX (471 - 584, n=29) | |
| Asus ROG Zephyrus Duo 15 SE GX551QS | |
| Asus ROG Zephyrus G15 GA503Q | |
| Schenker XMG Neo 17 (Early 2021, RTX 3070, 5800H) | |
| Asus TUF Dash F15 FX516PR | |
| Lenovo Legion 7 15IMH05-81YT001VGE | |
| Asus ROG Zephyrus Duo 15 GX550LXS | |
| MSI GT76 Titan DT 10SGS | |
| Razer Blade 15 RTX 2070 Super Max-Q | |
| HP Omen 15-en0375ng | |
| Asus ROG Zephyrus G15 GA502IU-ES76 | |
| Asus ROG Strix G15 G512LW | |
| Eurocom Nightsky RX15 | |
| Schenker XMG Core 15 GK5NR0O | |
| Cinebench R15 / CPU Multi 64Bit | |
| MSI GT76 Titan DT 10SGS | |
| Asus ROG Zephyrus Duo 15 SE GX551QS | |
| Schenker XMG Neo 17 (Early 2021, RTX 3070, 5800H) | |
| Átlagos AMD Ryzen 9 5900HX (1076 - 2267, n=29) | |
| Asus ROG Zephyrus G15 GA503Q | |
| Schenker XMG Core 15 GK5NR0O | |
| HP Omen 15-en0375ng | |
| Eurocom Nightsky RX15 | |
| Asus ROG Zephyrus Duo 15 GX550LXS | |
| Lenovo Legion 7 15IMH05-81YT001VGE | |
| Asus ROG Zephyrus G15 GA502IU-ES76 | |
| Razer Blade 15 RTX 2070 Super Max-Q | |
| Asus ROG Strix G15 G512LW | |
| Asus TUF Dash F15 FX516PR | |
| Cinebench R15 / CPU Single 64Bit | |
| Átlagos AMD Ryzen 9 5900HX (197 - 243, n=25) | |
| Asus ROG Zephyrus Duo 15 SE GX551QS | |
| Schenker XMG Neo 17 (Early 2021, RTX 3070, 5800H) | |
| Asus TUF Dash F15 FX516PR | |
| Asus ROG Zephyrus G15 GA503Q | |
| MSI GT76 Titan DT 10SGS | |
| Asus ROG Strix G15 G512LW | |
| Asus ROG Zephyrus Duo 15 GX550LXS | |
| Lenovo Legion 7 15IMH05-81YT001VGE | |
| Eurocom Nightsky RX15 | |
| Razer Blade 15 RTX 2070 Super Max-Q | |
| HP Omen 15-en0375ng | |
| Schenker XMG Core 15 GK5NR0O | |
| Asus ROG Zephyrus G15 GA502IU-ES76 | |
| Blender / v2.79 BMW27 CPU | |
| Eurocom Nightsky RX15 | |
| Asus TUF Dash F15 FX516PR | |
| Razer Blade 15 RTX 2070 Super Max-Q | |
| Asus ROG Strix G15 G512LW | |
| Asus ROG Zephyrus Duo 15 GX550LXS | |
| Asus ROG Zephyrus G15 GA502IU-ES76 | |
| Lenovo Legion 7 15IMH05-81YT001VGE | |
| HP Omen 15-en0375ng | |
| Schenker XMG Core 15 GK5NR0O | |
| Átlagos AMD Ryzen 9 5900HX (219 - 442, n=29) | |
| Asus ROG Zephyrus G15 GA503Q | |
| Schenker XMG Neo 17 (Early 2021, RTX 3070, 5800H) | |
| Asus ROG Zephyrus Duo 15 SE GX551QS | |
| MSI GT76 Titan DT 10SGS | |
| 7-Zip 18.03 / 7z b 4 -mmt1 | |
| Átlagos AMD Ryzen 9 5900HX (4791 - 5905, n=29) | |
| Asus ROG Zephyrus G15 GA503Q | |
| Asus ROG Zephyrus Duo 15 SE GX551QS | |
| Schenker XMG Neo 17 (Early 2021, RTX 3070, 5800H) | |
| Lenovo Legion 7 15IMH05-81YT001VGE | |
| Eurocom Nightsky RX15 | |
| Asus ROG Zephyrus Duo 15 GX550LXS | |
| MSI GT76 Titan DT 10SGS | |
| Razer Blade 15 RTX 2070 Super Max-Q | |
| Asus ROG Strix G15 G512LW | |
| Asus TUF Dash F15 FX516PR | |
| Schenker XMG Core 15 GK5NR0O | |
| Asus ROG Zephyrus G15 GA502IU-ES76 | |
| HP Omen 15-en0375ng | |
| 7-Zip 18.03 / 7z b 4 | |
| MSI GT76 Titan DT 10SGS | |
| Asus ROG Zephyrus Duo 15 SE GX551QS | |
| Asus ROG Zephyrus G15 GA503Q | |
| Schenker XMG Neo 17 (Early 2021, RTX 3070, 5800H) | |
| Átlagos AMD Ryzen 9 5900HX (36011 - 62503, n=29) | |
| HP Omen 15-en0375ng | |
| Lenovo Legion 7 15IMH05-81YT001VGE | |
| Asus ROG Zephyrus G15 GA502IU-ES76 | |
| Schenker XMG Core 15 GK5NR0O | |
| Asus ROG Zephyrus Duo 15 GX550LXS | |
| Eurocom Nightsky RX15 | |
| Razer Blade 15 RTX 2070 Super Max-Q | |
| Asus ROG Strix G15 G512LW | |
| Asus TUF Dash F15 FX516PR | |
| Geekbench 5.5 / Single-Core | |
| Átlagos AMD Ryzen 9 5900HX (1271 - 1574, n=27) | |
| Asus ROG Zephyrus Duo 15 SE GX551QS | |
| Asus ROG Zephyrus G15 GA503Q | |
| Asus ROG Zephyrus Duo 15 GX550LXS | |
| Asus TUF Dash F15 FX516PR | |
| Lenovo Legion 7 15IMH05-81YT001VGE | |
| Schenker XMG Neo 17 (Early 2021, RTX 3070, 5800H) | |
| MSI GT76 Titan DT 10SGS | |
| Asus ROG Strix G15 G512LW | |
| Razer Blade 15 RTX 2070 Super Max-Q | |
| HP Omen 15-en0375ng | |
| Asus ROG Zephyrus G15 GA502IU-ES76 | |
| Schenker XMG Core 15 GK5NR0O | |
| Geekbench 5.5 / Multi-Core | |
| MSI GT76 Titan DT 10SGS | |
| Asus ROG Zephyrus Duo 15 SE GX551QS | |
| Asus ROG Zephyrus Duo 15 GX550LXS | |
| Lenovo Legion 7 15IMH05-81YT001VGE | |
| Átlagos AMD Ryzen 9 5900HX (5057 - 9294, n=27) | |
| HP Omen 15-en0375ng | |
| Schenker XMG Neo 17 (Early 2021, RTX 3070, 5800H) | |
| Asus ROG Zephyrus G15 GA503Q | |
| Asus ROG Zephyrus G15 GA502IU-ES76 | |
| Razer Blade 15 RTX 2070 Super Max-Q | |
| Schenker XMG Core 15 GK5NR0O | |
| Asus ROG Strix G15 G512LW | |
| Asus TUF Dash F15 FX516PR | |
| HWBOT x265 Benchmark v2.2 / 4k Preset | |
| MSI GT76 Titan DT 10SGS | |
| Asus ROG Zephyrus Duo 15 SE GX551QS | |
| Schenker XMG Neo 17 (Early 2021, RTX 3070, 5800H) | |
| Átlagos AMD Ryzen 9 5900HX (8.26 - 17.1, n=29) | |
| Asus ROG Zephyrus G15 GA503Q | |
| Lenovo Legion 7 15IMH05-81YT001VGE | |
| HP Omen 15-en0375ng | |
| Asus ROG Zephyrus Duo 15 GX550LXS | |
| Eurocom Nightsky RX15 | |
| Schenker XMG Core 15 GK5NR0O | |
| Asus ROG Zephyrus G15 GA502IU-ES76 | |
| Asus ROG Strix G15 G512LW | |
| Razer Blade 15 RTX 2070 Super Max-Q | |
| Asus TUF Dash F15 FX516PR | |
| LibreOffice / 20 Documents To PDF | |
| HP Omen 15-en0375ng | |
| Schenker XMG Core 15 GK5NR0O | |
| Asus ROG Zephyrus G15 GA502IU-ES76 | |
| Asus TUF Dash F15 FX516PR | |
| Asus ROG Zephyrus G15 GA503Q | |
| Asus ROG Zephyrus Duo 15 GX550LXS | |
| Lenovo Legion 7 15IMH05-81YT001VGE | |
| Átlagos AMD Ryzen 9 5900HX (44.1 - 87.4, n=29) | |
| Schenker XMG Neo 17 (Early 2021, RTX 3070, 5800H) | |
| Asus ROG Strix G15 G512LW | |
| Razer Blade 15 RTX 2070 Super Max-Q | |
| MSI GT76 Titan DT 10SGS | |
| Asus ROG Zephyrus Duo 15 SE GX551QS | |
| R Benchmark 2.5 / Overall mean | |
| Asus ROG Strix G15 G512LW | |
| Razer Blade 15 RTX 2070 Super Max-Q | |
| Schenker XMG Core 15 GK5NR0O | |
| Asus ROG Zephyrus Duo 15 GX550LXS | |
| Asus ROG Zephyrus G15 GA502IU-ES76 | |
| HP Omen 15-en0375ng | |
| Lenovo Legion 7 15IMH05-81YT001VGE | |
| MSI GT76 Titan DT 10SGS | |
| Asus TUF Dash F15 FX516PR | |
| Asus ROG Zephyrus G15 GA503Q | |
| Schenker XMG Neo 17 (Early 2021, RTX 3070, 5800H) | |
| Asus ROG Zephyrus Duo 15 SE GX551QS | |
| Átlagos AMD Ryzen 9 5900HX (0.48 - 0.599, n=29) | |
Cinebench R15: CPU Multi 64Bit | CPU Single 64Bit
Blender: v2.79 BMW27 CPU
7-Zip 18.03: 7z b 4 -mmt1 | 7z b 4
Geekbench 5.5: Single-Core | Multi-Core
HWBOT x265 Benchmark v2.2: 4k Preset
LibreOffice : 20 Documents To PDF
R Benchmark 2.5: Overall mean
* ... a kisebb jobb
| PCMark 10 | |
| Score | |
| Eurocom Sky X4C i9-9900KS | |
| Asus ROG Zephyrus Duo 15 SE GX551QS | |
| MSI GS66 Stealth 10SFS | |
| MSI GE66 Raider 10SFS | |
| Asus ROG Zephyrus Duo 15 GX550LXS | |
| Razer Blade 15 RTX 2080 Super Max-Q | |
| Essentials | |
| Eurocom Sky X4C i9-9900KS | |
| Asus ROG Zephyrus Duo 15 SE GX551QS | |
| MSI GS66 Stealth 10SFS | |
| MSI GE66 Raider 10SFS | |
| Asus ROG Zephyrus Duo 15 GX550LXS | |
| Razer Blade 15 RTX 2080 Super Max-Q | |
| Productivity | |
| Eurocom Sky X4C i9-9900KS | |
| Asus ROG Zephyrus Duo 15 SE GX551QS | |
| MSI GS66 Stealth 10SFS | |
| Razer Blade 15 RTX 2080 Super Max-Q | |
| Asus ROG Zephyrus Duo 15 GX550LXS | |
| MSI GE66 Raider 10SFS | |
| Digital Content Creation | |
| Eurocom Sky X4C i9-9900KS | |
| Asus ROG Zephyrus Duo 15 SE GX551QS | |
| MSI GS66 Stealth 10SFS | |
| MSI GE66 Raider 10SFS | |
| Asus ROG Zephyrus Duo 15 GX550LXS | |
| Razer Blade 15 RTX 2080 Super Max-Q | |
| PCMark 8 | |
| Home Score Accelerated v2 | |
| Eurocom Sky X4C i9-9900KS | |
| Razer Blade 15 RTX 2080 Super Max-Q | |
| Asus ROG Zephyrus Duo 15 SE GX551QS | |
| Asus ROG Zephyrus Duo 15 GX550LXS | |
| Work Score Accelerated v2 | |
| Eurocom Sky X4C i9-9900KS | |
| Razer Blade 15 RTX 2080 Super Max-Q | |
| Asus ROG Zephyrus Duo 15 SE GX551QS | |
| Asus ROG Zephyrus Duo 15 GX550LXS | |
| PCMark 8 Home Score Accelerated v2 | 4414 pontok | |
| PCMark 8 Work Score Accelerated v2 | 5006 pontok | |
| PCMark 10 Score | 6807 pontok | |
Segítség | ||
| DPC Latencies / LatencyMon - interrupt to process latency (max), Web, Youtube, Prime95 | |
| Asus ROG Zephyrus Duo 15 GX550LXS | |
| MSI GS66 Stealth 10SFS | |
| Asus ROG Zephyrus Duo 15 SE GX551QS | |
| MSI GE66 Raider 10SFS | |
| Razer Blade 15 RTX 2080 Super Max-Q | |
* ... a kisebb jobb
Storage Devices
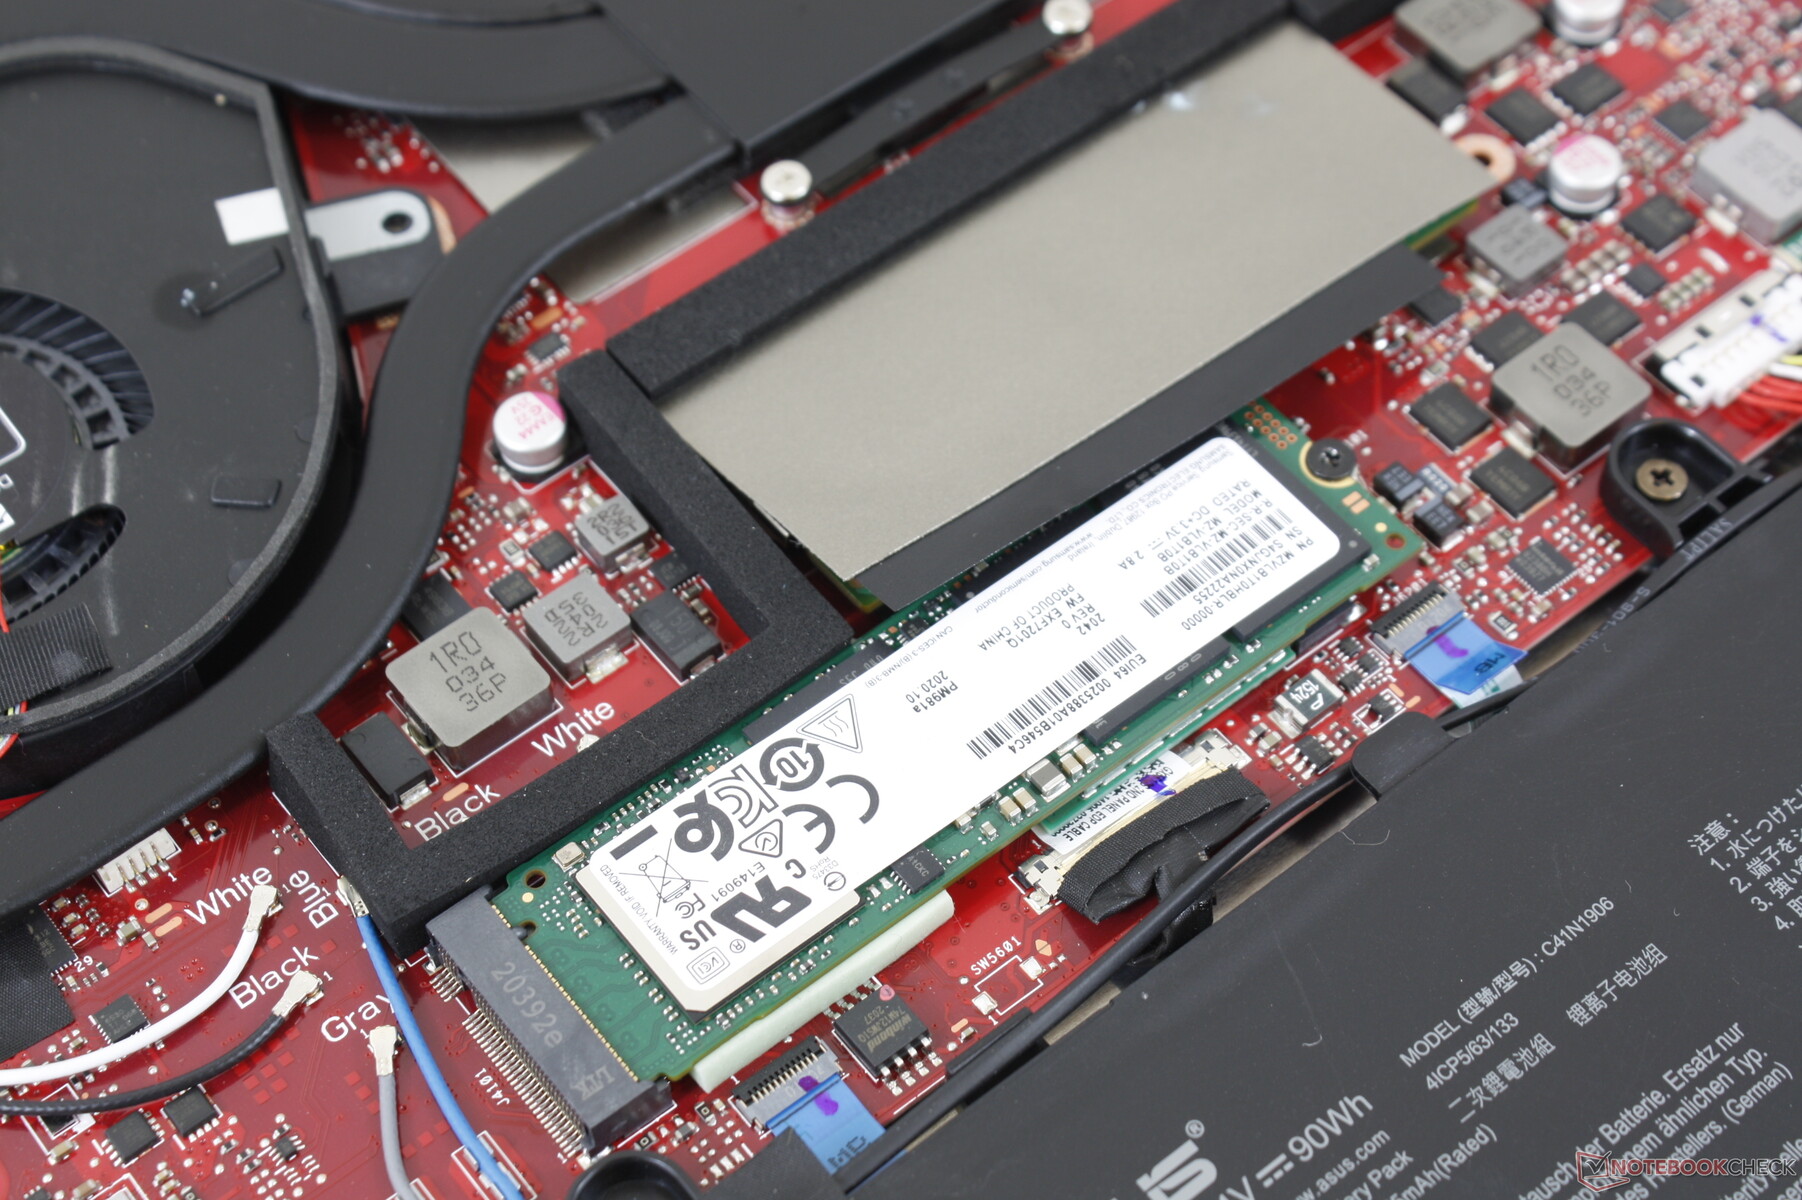
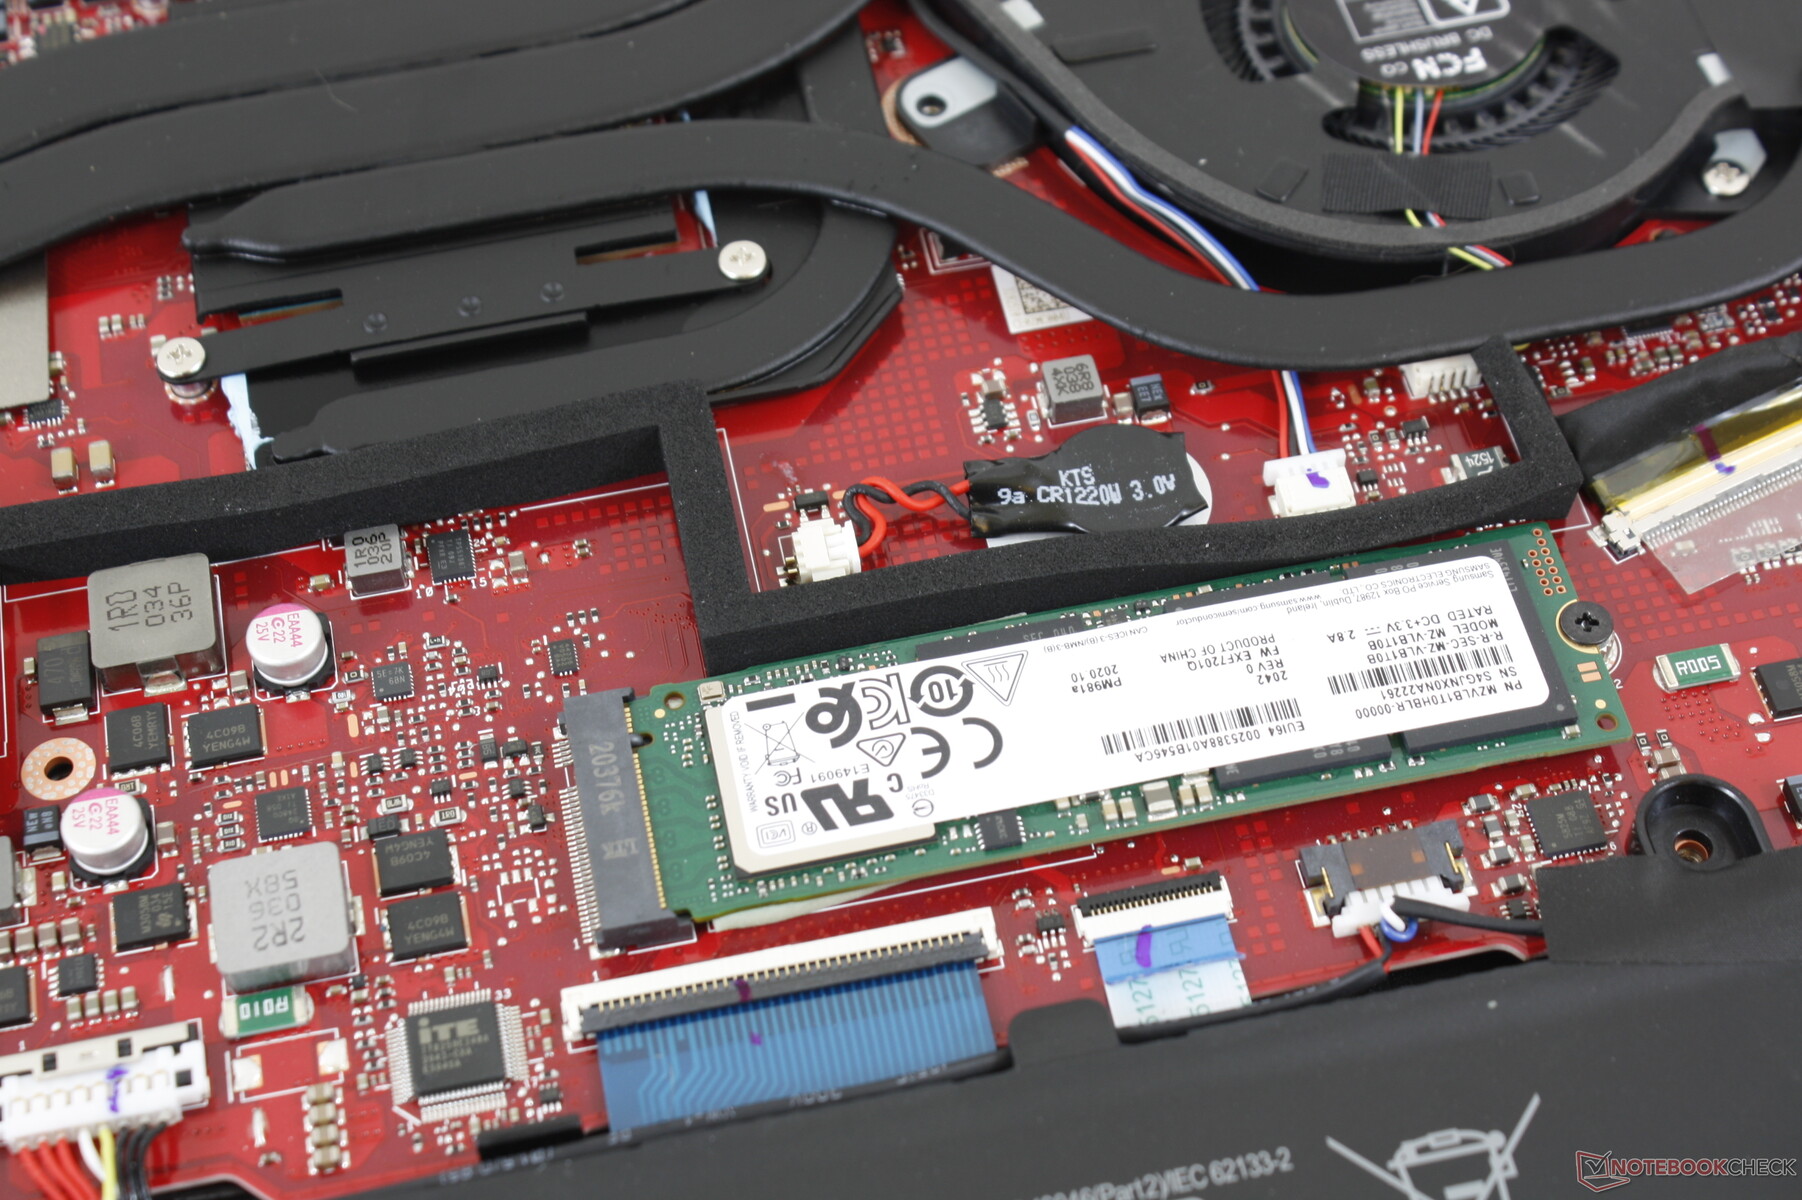
| Asus ROG Zephyrus Duo 15 SE GX551QS 2x Samsung PM981a MZVLB1T0HBLR (RAID 0) | Asus ROG Zephyrus Duo 15 GX550LXS 2x Samsung PM981a MZVLB1T0HBLR (RAID 0) | Eurocom Sky X4C i9-9900KS Samsung SSD 970 Pro 512GB | MSI GE66 Raider 10SFS WDC PC SN730 SDBPNTY-1T00 | MSI GS66 Stealth 10SFS Samsung SSD PM981 MZVLB1T0HALR | |
|---|---|---|---|---|---|
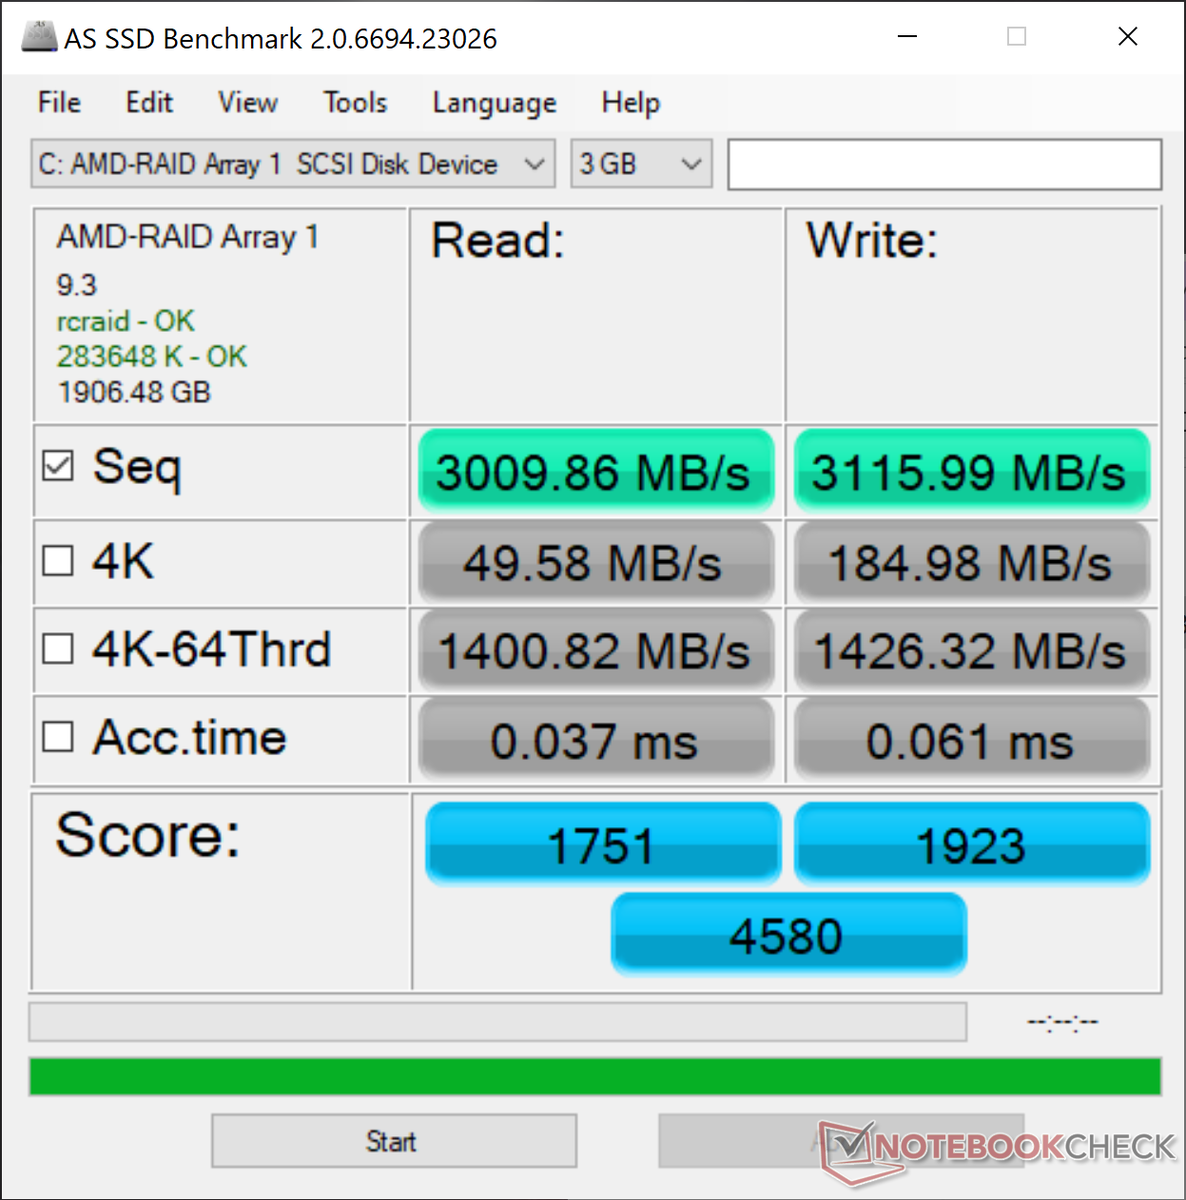
| AS SSD | -11% | -16% | 11% | -10% | |
| Seq Read (MB/s) | 3010 | 2981 -1% | 2280 -24% | 2979 -1% | 1065 -65% |
| Seq Write (MB/s) | 3116 | 2783 -11% | 2198 -29% | 2581 -17% | 2360 -24% |
| 4K Read (MB/s) | 49.58 | 43.98 -11% | 31.67 -36% | 47.33 -5% | 48.09 -3% |
| 4K Write (MB/s) | 185 | 113.9 -38% | 127.3 -31% | 140 -24% | 110.7 -40% |
| 4K-64 Read (MB/s) | 1401 | 1519 8% | 1293 -8% | 1710 22% | 1635 17% |
| 4K-64 Write (MB/s) | 1426 | 1296 -9% | 2124 49% | 2188 53% | 1829 28% |
| Access Time Read * (ms) | 0.037 | 0.062 -68% | 0.078 -111% | 0.05 -35% | 0.071 -92% |
| Access Time Write * (ms) | 0.061 | 0.033 46% | 0.098 -61% | 0.026 57% | 0.034 44% |
| Score Read (Points) | 1751 | 1861 6% | 1552 -11% | 2055 17% | 1790 2% |
| Score Write (Points) | 1923 | 1688 -12% | 2471 28% | 2586 34% | 2176 13% |
| Score Total (Points) | 4580 | 4492 -2% | 4811 5% | 5673 24% | 4950 8% |
| Copy ISO MB/s (MB/s) | 3196 | 2438 -24% | 3007 -6% | ||
| Copy Program MB/s (MB/s) | 710 | 604 -15% | 731 3% | ||
| Copy Game MB/s (MB/s) | 1669 | 1404 -16% | 1756 5% | ||
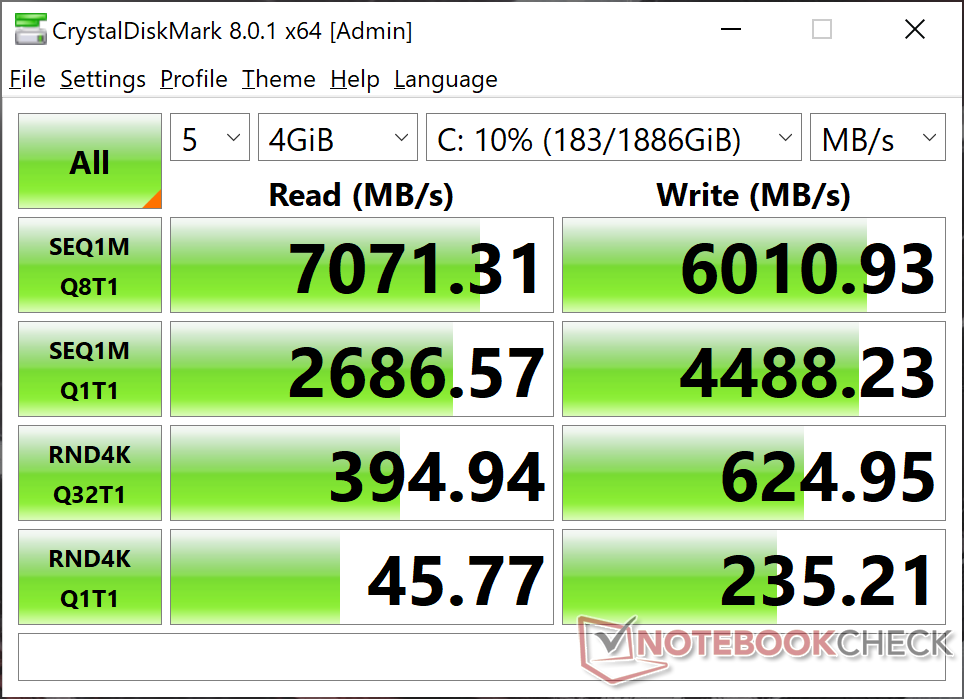
| CrystalDiskMark 5.2 / 6 | -18% | -19% | -20% | -28% | |
| Write 4K (MB/s) | 229.7 | 127.6 -44% | 188.8 -18% | 158.2 -31% | 131.3 -43% |
| Read 4K (MB/s) | 47.13 | 48.4 3% | 63.5 35% | 50.7 8% | 45.84 -3% |
| Write Seq (MB/s) | 4455 | 2958 -34% | 1836 -59% | 1790 -60% | 2370 -47% |
| Read Seq (MB/s) | 2933 | 2984 2% | 1891 -36% | 2469 -16% | 1509 -49% |
| Write 4K Q32T1 (MB/s) | 597 | 472.7 -21% | 490.5 -18% | 503 -16% | 481.5 -19% |
| Read 4K Q32T1 (MB/s) | 387 | 529 37% | 571 48% | 579 50% | 560 45% |
| Write Seq Q32T1 (MB/s) | 5623 | 3431 -39% | 2334 -58% | 3102 -45% | 2392 -57% |
| Read Seq Q32T1 (MB/s) | 7042 | 3536 -50% | 3559 -49% | 3413 -52% | 3232 -54% |
| Teljes átlag (program / beállítások) | -15% /
-13% | -18% /
-17% | -5% /
-2% | -19% /
-18% |
* ... a kisebb jobb

Disk Throttling: DiskSpd Read Loop, Queue Depth 8
| 3DMark 11 | |
| 1280x720 Performance GPU | |
| ASUS GeForce RTX 3080 ROG STRIX OC GAMING | |
| MSI GeForce RTX 3070 Gaming X Trio | |
| Asus ROG Zephyrus Duo 15 SE GX551QS | |
| Átlagos NVIDIA GeForce RTX 3080 Laptop GPU (31288 - 43744, n=40) | |
| Átlagos NVIDIA GeForce RTX 2080 Mobile (31826 - 38809, n=17) | |
| Eurocom Sky X4C i9-9900KS | |
| Asus ROG Strix G15 G512LW | |
| Asus ROG Zephyrus Duo 15 GX550LXS | |
| MSI RTX 2060 Gaming Z 6G | |
| Schenker XMG Core 15 GK5NR0O | |
| 1280x720 Performance Combined | |
| Eurocom Sky X4C i9-9900KS | |
| ASUS GeForce RTX 3080 ROG STRIX OC GAMING | |
| Átlagos NVIDIA GeForce RTX 3080 Laptop GPU (10637 - 20233, n=39) | |
| Asus ROG Zephyrus Duo 15 SE GX551QS | |
| Asus ROG Zephyrus Duo 15 GX550LXS | |
| MSI GeForce RTX 3070 Gaming X Trio | |
| Átlagos NVIDIA GeForce RTX 2080 Mobile (9038 - 18934, n=17) | |
| MSI RTX 2060 Gaming Z 6G | |
| Schenker XMG Core 15 GK5NR0O | |
| Asus ROG Strix G15 G512LW | |
| 3DMark 11 Performance | 29192 pontok | |
| 3DMark Cloud Gate Standard Score | 51675 pontok | |
| 3DMark Fire Strike Score | 25362 pontok | |
| 3DMark Time Spy Score | 11194 pontok | |
Segítség | ||
| alacsony | közepes | magas | ultra | QHD | 4K | |
|---|---|---|---|---|---|---|
| BioShock Infinite (2013) | 374 | 186.2 | ||||
| The Witcher 3 (2015) | 341.7 | 187.2 | 104.6 | 80.4 | ||
| Dota 2 Reborn (2015) | 144 | 139 | 124 | 119 | 99.9 | |
| Final Fantasy XV Benchmark (2018) | 177 | 133 | 105 | 81.3 | 49.5 | |
| X-Plane 11.11 (2018) | 107 | 93 | 77 | 60.9 | ||
| Far Cry 5 (2018) | 138 | 119 | 114 | 107 | 96 | 59 |
| Strange Brigade (2018) | 346 | 205 | 188 | 174 | 136 | 84.2 |
| Shadow of the Tomb Raider (2018) | 140 | 123 | 121 | 116 | 93 | 55 |
| Total War: Three Kingdoms (2019) | 270.2 | 148.6 | 108.4 | 83.8 | 56.8 | 29 |
| Doom Eternal (2020) | 323.2 | 197.5 | 183.1 | 183.7 | 145.8 | 83.4 |
| Gears Tactics (2020) | 127.6 | 187.8 | 142.8 | 114.7 | 85.9 | 47.2 |
| F1 2020 (2020) | 256 | 199 | 191 | 150 | 119 | 73 |
| Asus ROG Zephyrus Duo 15 SE GX551QS GeForce RTX 3080 Laptop GPU, R9 5900HX, 2x Samsung PM981a MZVLB1T0HBLR (RAID 0) | Asus ROG Zephyrus Duo 15 GX550LXS GeForce RTX 2080 Super Max-Q, i9-10980HK, 2x Samsung PM981a MZVLB1T0HBLR (RAID 0) | Razer Blade 15 RTX 2080 Super Max-Q GeForce RTX 2080 Super Max-Q, i7-10875H, Samsung PM981a MZVLB1T0HBLR | Eurocom Sky X4C i9-9900KS GeForce RTX 2080 Mobile, i9-9900KS, Samsung SSD 970 Pro 512GB | MSI GE66 Raider 10SFS GeForce RTX 2070 Super Mobile, i9-10980HK, WDC PC SN730 SDBPNTY-1T00 | MSI GS66 Stealth 10SFS GeForce RTX 2070 Super Max-Q, i9-10980HK, Samsung SSD PM981 MZVLB1T0HALR | |
|---|---|---|---|---|---|---|
| Noise | -20% | -13% | -9% | -30% | -25% | |
| off / környezet * (dB) | 27 | 30 -11% | 30.1 -11% | 28.1 -4% | 30 -11% | 30 -11% |
| Idle Minimum * (dB) | 27 | 33 -22% | 30.1 -11% | 28.5 -6% | 30 -11% | 32 -19% |
| Idle Average * (dB) | 27 | 34 -26% | 30.1 -11% | 28.7 -6% | 35 -30% | 34 -26% |
| Idle Maximum * (dB) | 27 | 35 -30% | 30.1 -11% | 29.5 -9% | 44 -63% | 39 -44% |
| Load Average * (dB) | 31.2 | 48 -54% | 46.8 -50% | 31.2 -0% | 53 -70% | 53 -70% |
| Witcher 3 ultra * (dB) | 44.5 | 48 -8% | 48.4 -9% | 55.1 -24% | 53 -19% | 48 -8% |
| Load Maximum * (dB) | 53.5 | 49 8% | 46 14% | 59.3 -11% | 55 -3% | 53 1% |
* ... a kisebb jobb
Zajszint
| Üresjárat |
| 27 / 27 / 27 dB(A) |
| Terhelés |
| 31.2 / 53.5 dB(A) |
 | ||
30 dB csendes 40 dB(A) hallható 50 dB(A) hangos |
||
min: | ||
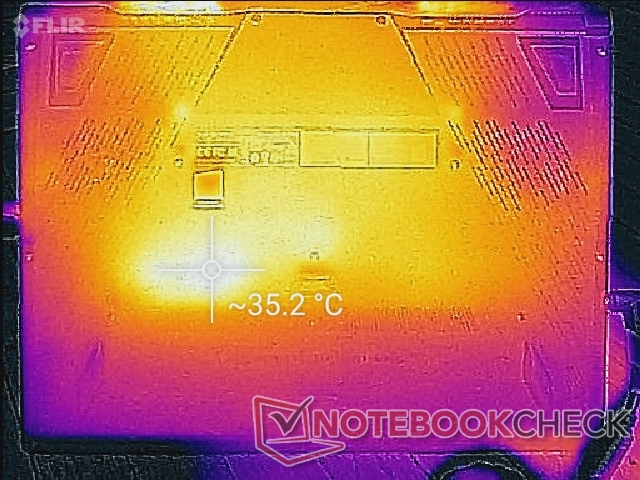
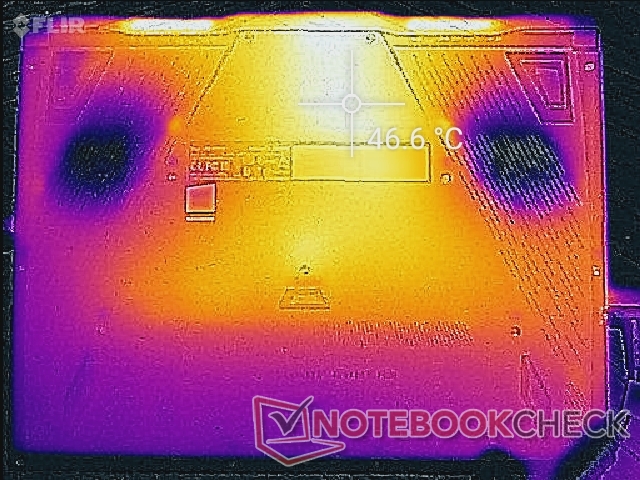
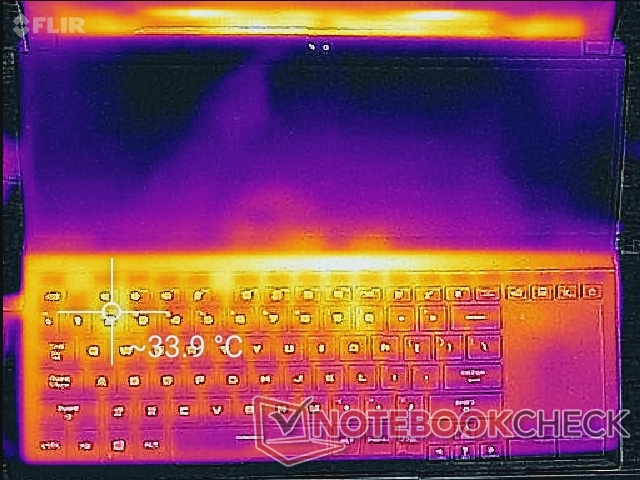
(+) A felső oldalon a maximális hőmérséklet 33.4 °C / 92 F, összehasonlítva a 40.4 °C / 105 F átlagával , 21.2 és 68.8 °C között a Gaming osztálynál.
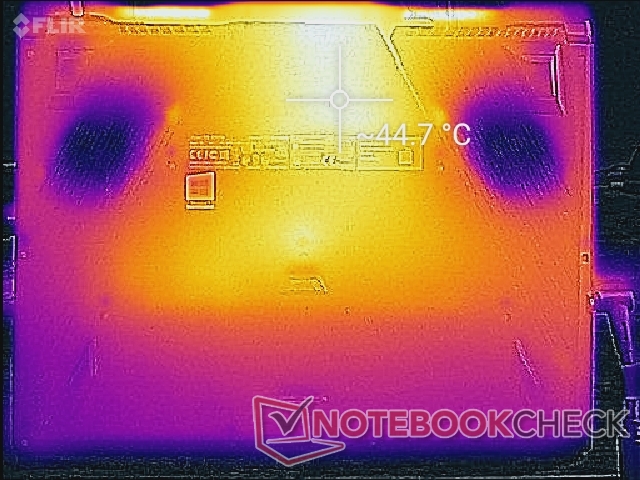
(±) Az alsó maximum 45 °C / 113 F-ig melegszik fel, összehasonlítva a 43.2 °C / 110 F átlagával
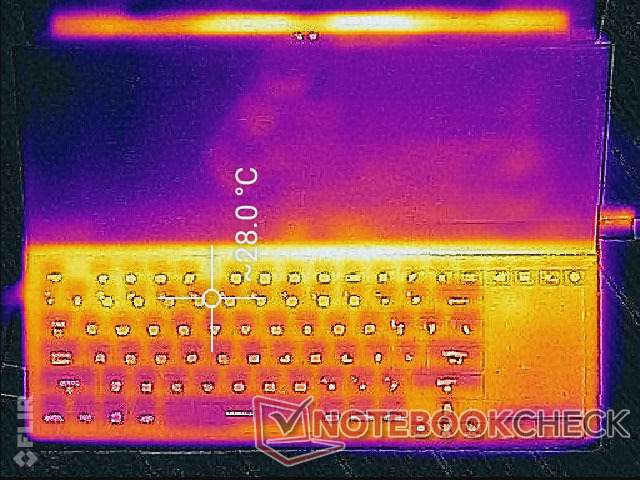
(+) Üresjáratban a felső oldal átlagos hőmérséklete 26.7 °C / 80 F, összehasonlítva a 33.9 °C / ### eszközátlaggal class_avg_f### F.
(+) A The Witcher 3 játék során a felső oldal átlaghőmérséklete 28.4 °C / 83 F, összehasonlítva a 33.9 °C / ## eszközátlaggal #class_avg_f### F.
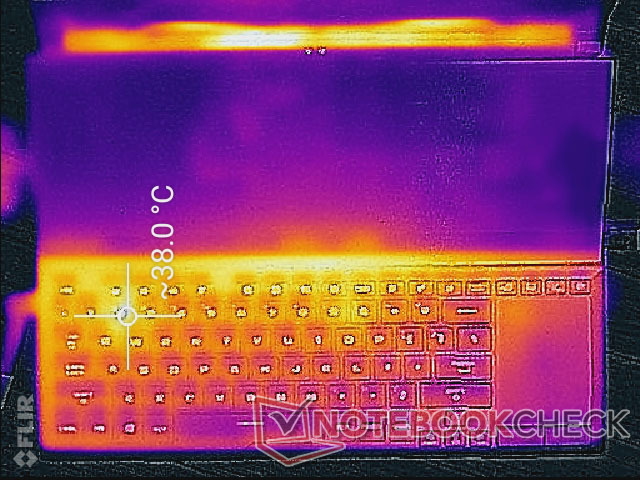
(±) A csuklótámasz és az érintőpad tapintásra nagyon felforrósodhat, maximum 38 °C / 100.4 F.
(-) A hasonló eszközök csuklótámasz területének átlagos hőmérséklete 28.8 °C / 83.8 F volt (-9.2 °C / -16.6 F).
| CPU Clock (GHz) | GPU Clock (MHz) | Average CPU Temperature (°C) | Average GPU Temperature (°C) | |
| Prime95 Stress (Performance mode) | 3.8 | -- | 91 | 65 |
| Prime95 Stress (Turbo mode) | 4.0 - 4.4 | -- | 75 | 47 |
| FurMark Stress (Turbo mode) | -- | 1185 | 67 | 69 |
| Prime95 + FurMark Stress (Turbo mode) | 0.4 - 4.4 | ~1530 | 78 | 62 |
| Witcher 3 Stress (Performance mode) | 3.2 | 1650 | 76 | 80 |
| Witcher 3 Stress (Turbo mode) | 3.2 | 1770 | 65 | 68 |
Asus ROG Zephyrus Duo 15 SE GX551QS hangelemzés
(±) | a hangszóró hangereje átlagos, de jó (79.8 dB)
Basszus 100 - 315 Hz
(±) | csökkentett basszus – átlagosan 9.1%-kal alacsonyabb, mint a medián
(±) | a basszus linearitása átlagos (13.4% delta az előző frekvenciához)
Közepes 400-2000 Hz
(+) | kiegyensúlyozott középpontok – csak 3.3% választja el a mediántól
(+) | a középpontok lineárisak (5.8% delta az előző frekvenciához)
Maximum 2-16 kHz
(+) | kiegyensúlyozott csúcsok – csak 3.2% választja el a mediántól
(+) | a csúcsok lineárisak (5.6% delta az előző frekvenciához képest)
Összességében 100 - 16.000 Hz
(+) | általános hangzás lineáris (11.3% eltérés a mediánhoz képest)
Ugyanazon osztályhoz képest
» 8%Ebben az osztályban az összes tesztelt eszköz %-a jobb volt, 3% hasonló, 88%-kal rosszabb
» A legjobb delta értéke 6%, az átlag 18%, a legrosszabb 132% volt
Az összes tesztelt eszközzel összehasonlítva
» 7% az összes tesztelt eszköz jobb volt, 2% hasonló, 91%-kal rosszabb
» A legjobb delta értéke 4%, az átlag 24%, a legrosszabb 134% volt
Apple MacBook 12 (Early 2016) 1.1 GHz hangelemzés
(+) | a hangszórók viszonylag hangosan tudnak játszani (83.6 dB)
Basszus 100 - 315 Hz
(±) | csökkentett basszus – átlagosan 11.3%-kal alacsonyabb, mint a medián
(±) | a basszus linearitása átlagos (14.2% delta az előző frekvenciához)
Közepes 400-2000 Hz
(+) | kiegyensúlyozott középpontok – csak 2.4% választja el a mediántól
(+) | a középpontok lineárisak (5.5% delta az előző frekvenciához)
Maximum 2-16 kHz
(+) | kiegyensúlyozott csúcsok – csak 2% választja el a mediántól
(+) | a csúcsok lineárisak (4.5% delta az előző frekvenciához képest)
Összességében 100 - 16.000 Hz
(+) | általános hangzás lineáris (10.2% eltérés a mediánhoz képest)
Ugyanazon osztályhoz képest
» 7%Ebben az osztályban az összes tesztelt eszköz %-a jobb volt, 2% hasonló, 91%-kal rosszabb
» A legjobb delta értéke 5%, az átlag 18%, a legrosszabb 53% volt
Az összes tesztelt eszközzel összehasonlítva
» 5% az összes tesztelt eszköz jobb volt, 1% hasonló, 94%-kal rosszabb
» A legjobb delta értéke 4%, az átlag 24%, a legrosszabb 134% volt
| Kikapcsolt állapot / Készenlét | |
| Üresjárat | |
| Terhelés |
|
Kulcs:
min: | |
| Asus ROG Zephyrus Duo 15 SE GX551QS R9 5900HX, GeForce RTX 3080 Laptop GPU, 2x Samsung PM981a MZVLB1T0HBLR (RAID 0), IPS, 3840x2160, 15.6" | Asus ROG Zephyrus Duo 15 GX550LXS i9-10980HK, GeForce RTX 2080 Super Max-Q, 2x Samsung PM981a MZVLB1T0HBLR (RAID 0), IPS, 3840x2160, 15.6" | Razer Blade 15 RTX 2080 Super Max-Q i7-10875H, GeForce RTX 2080 Super Max-Q, Samsung PM981a MZVLB1T0HBLR, IPS, 1920x1080, 15.6" | Eurocom Sky X4C i9-9900KS i9-9900KS, GeForce RTX 2080 Mobile, Samsung SSD 970 Pro 512GB, IPS, 1920x1080, 15.6" | MSI GE66 Raider 10SFS i9-10980HK, GeForce RTX 2070 Super Mobile, WDC PC SN730 SDBPNTY-1T00, IPS-Level, 1920x1080, 15.6" | MSI GS66 Stealth 10SFS i9-10980HK, GeForce RTX 2070 Super Max-Q, Samsung SSD PM981 MZVLB1T0HALR, IPS, 1920x1080, 15.6" | |
|---|---|---|---|---|---|---|
| Power Consumption | -16% | 26% | -57% | 16% | 14% | |
| Idle Minimum * (Watt) | 16.3 | 23 -41% | 10.6 35% | 33.4 -105% | 6 63% | 13 20% |
| Idle Average * (Watt) | 22.5 | 30 -33% | 13.1 42% | 40.5 -80% | 14 38% | 16 29% |
| Idle Maximum * (Watt) | 39.9 | 39 2% | 15.8 60% | 44 -10% | 25 37% | 27 32% |
| Load Average * (Watt) | 116.1 | 156 -34% | 131 -13% | 121.9 -5% | 108 7% | 109 6% |
| Witcher 3 ultra * (Watt) | 181.2 | 152 16% | 146 19% | 258.2 -42% | 195 -8% | 155 14% |
| Load Maximum * (Watt) | 196.7 | 208 -6% | 169 14% | 397.6 -102% | 280 -42% | 236 -20% |
* ... a kisebb jobb
| Asus ROG Zephyrus Duo 15 SE GX551QS R9 5900HX, GeForce RTX 3080 Laptop GPU, 90 Wh | Asus ROG Zephyrus Duo 15 GX550LXS i9-10980HK, GeForce RTX 2080 Super Max-Q, 90 Wh | Razer Blade 15 RTX 2080 Super Max-Q i7-10875H, GeForce RTX 2080 Super Max-Q, 80 Wh | Eurocom Sky X4C i9-9900KS i9-9900KS, GeForce RTX 2080 Mobile, 82 Wh | MSI GE66 Raider 10SFS i9-10980HK, GeForce RTX 2070 Super Mobile, 99.99 Wh | MSI GS66 Stealth 10SFS i9-10980HK, GeForce RTX 2070 Super Max-Q, 99.99 Wh | |
|---|---|---|---|---|---|---|
| Akkumulátor üzemidő | -8% | 34% | -47% | 26% | 27% | |
| Reader / Idle (h) | 6.8 | 8 18% | 8.7 28% | 7.6 12% | 8.4 24% | |
| WiFi v1.3 (h) | 5.3 | 3.1 -42% | 6.1 15% | 2.8 -47% | 6.1 15% | 6.1 15% |
| Load (h) | 1.2 | 1.2 0% | 1.9 58% | 1.8 50% | 1.7 42% |
Pro
Kontra
Összegzés
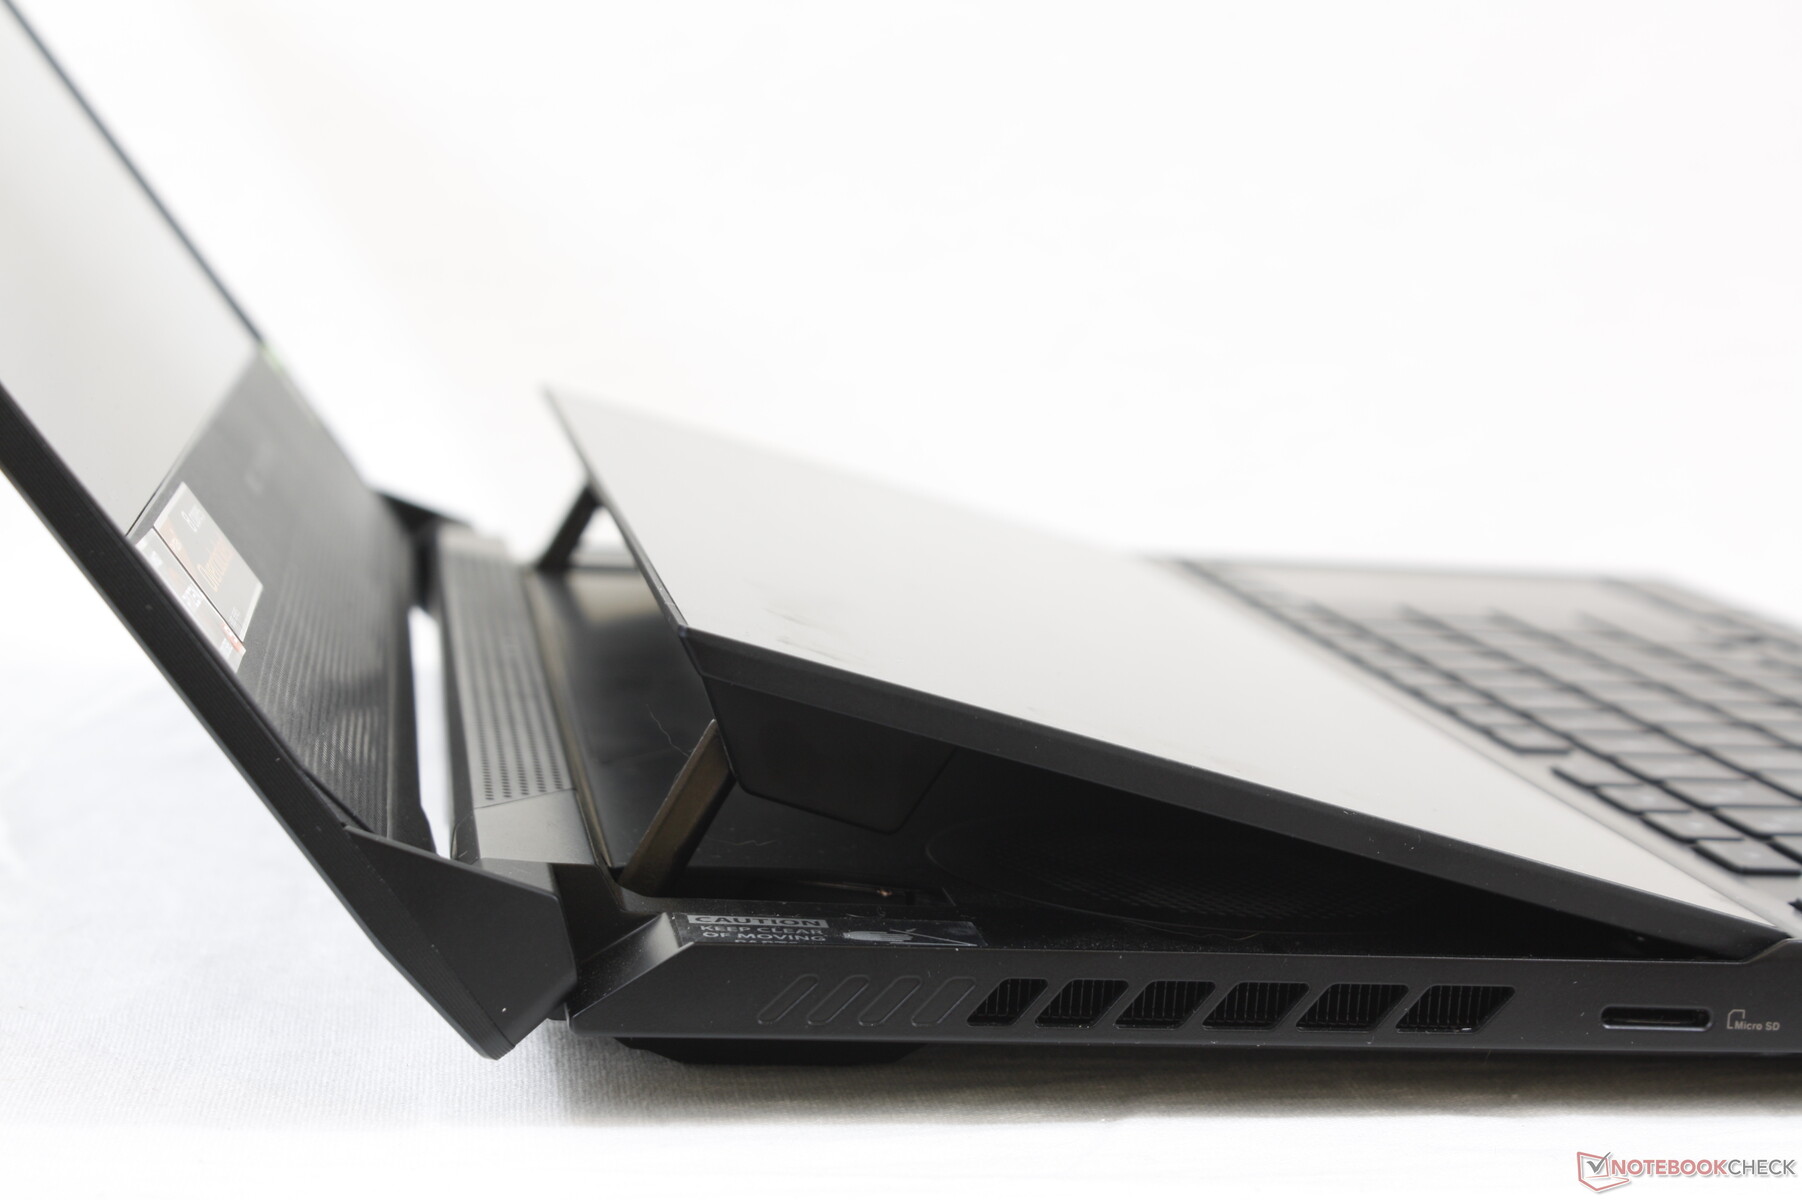
Kívülről mem tűnik úgy. de a régebbi GX550-hez képest az Asus nagy belső javításokat vitt véghez a teljesítmény növelése érdekében. Az csúcskategóriás gamer notebookokat ma már nem kizárólag az Intel Core sorozattal szükséges felszerelni, mivel az AMD Ryzen opciók már a leggyorsabb 10. generációs Core i9 rendszereket is felülmúlták, beleértve az Asus saját Zephyrus Duo 15 GX550 notebookját.
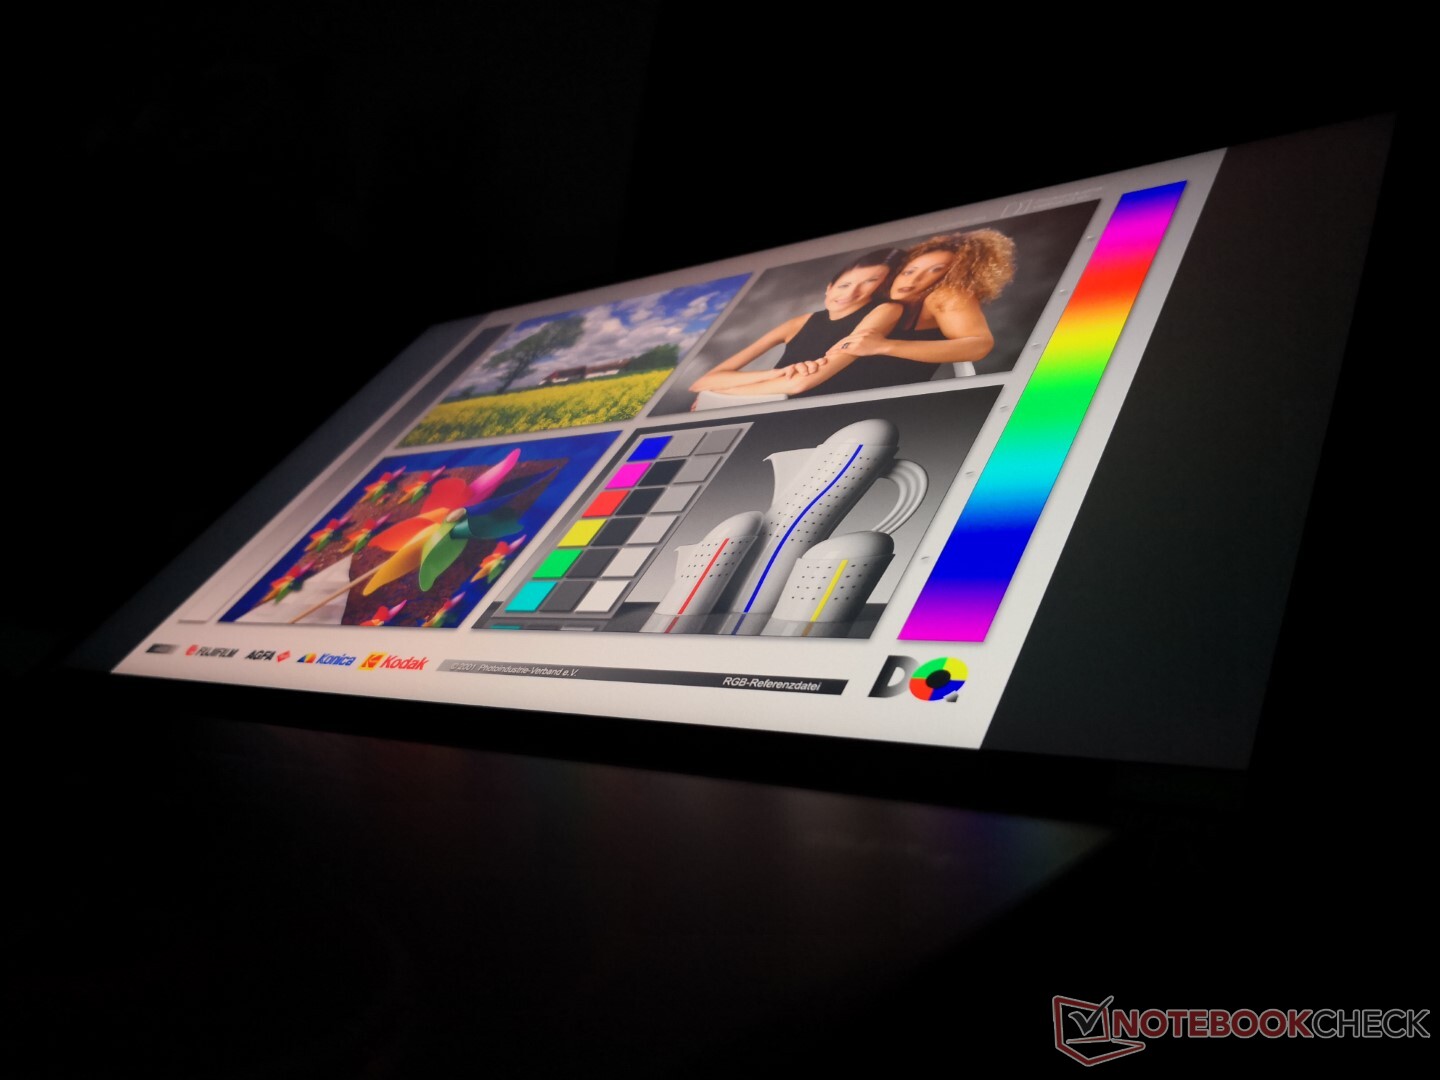
A Zen 3 CPU-n kívül az új 120 Hz-es 4K panel is elismerést igényel. A 15.6 hüvelykes 4K panelek többségével ellentétben az új panel rövidebb fekete-fehér és szürke-szürke válaszidőkkel rendelkezik, amelyek most már jóval közelebb állnak a megszokott 144 Hz-es, 240 Hz-es vagy 300 Hz-es 1080p opciókhoz. A különbség többnyire a pörgős 3D játékok közben érzékelhető.
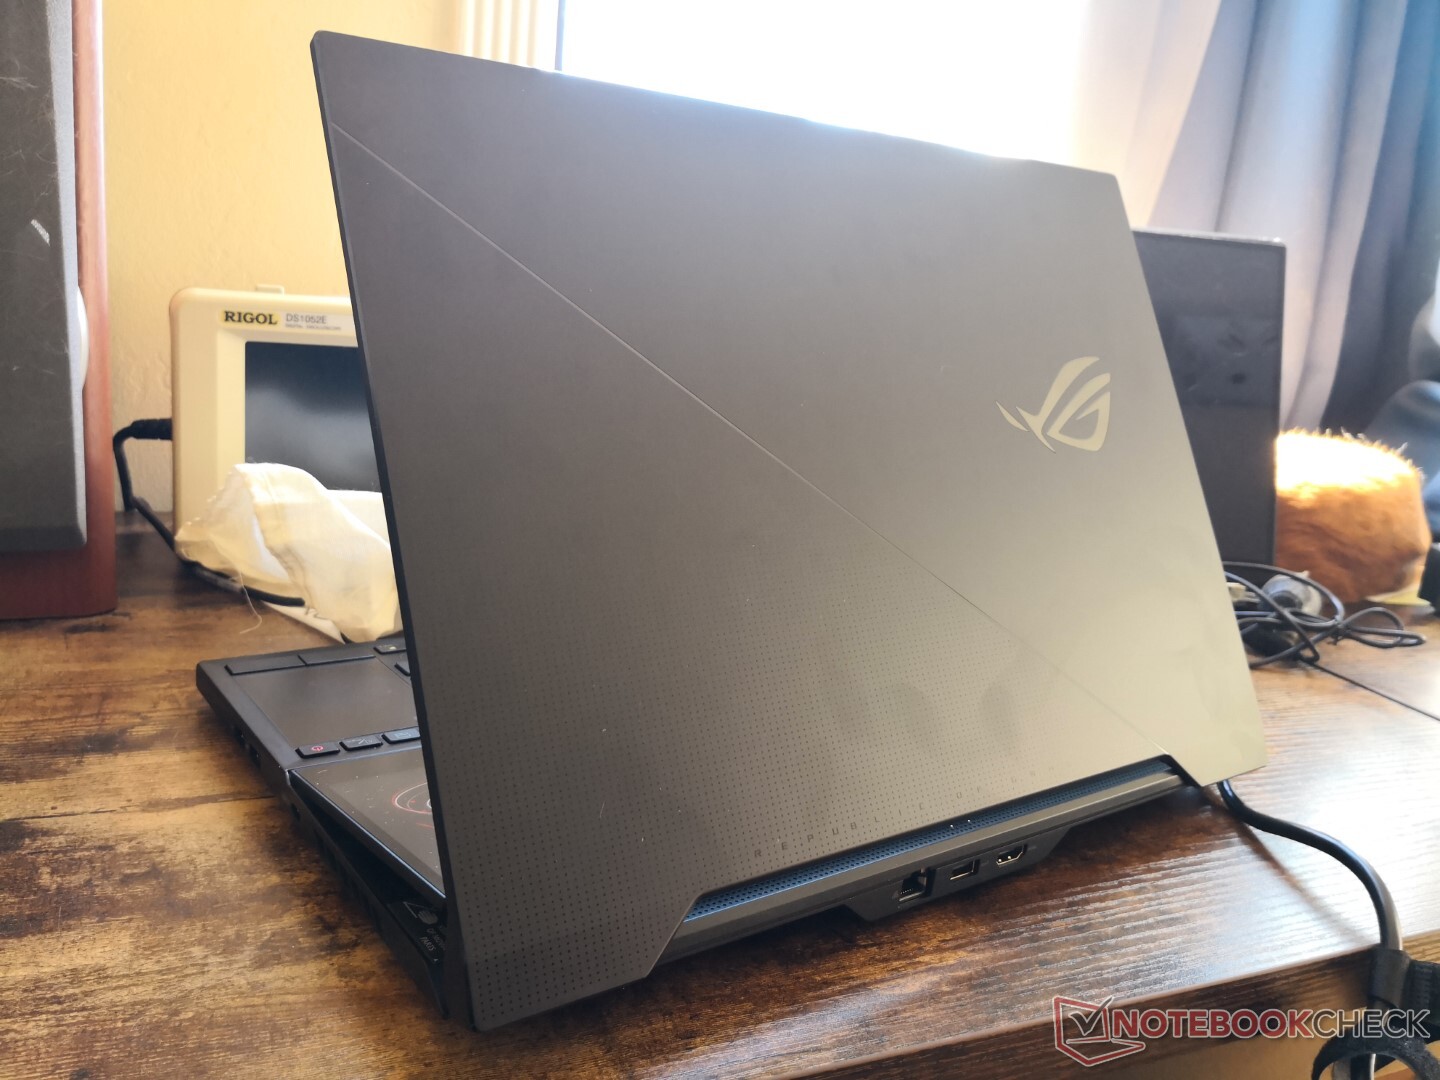
Nem olcsó, de az Asus ROG Zephyrus Duo 15 SE GX551QS új hardverrel sűrűn megpakolt, így jócskán felülmúlja az elődjét. A ScreenPad egyáltalán nem változott, kivéve a simább felhasználói felületet, amelyet a GX550 is megkap.
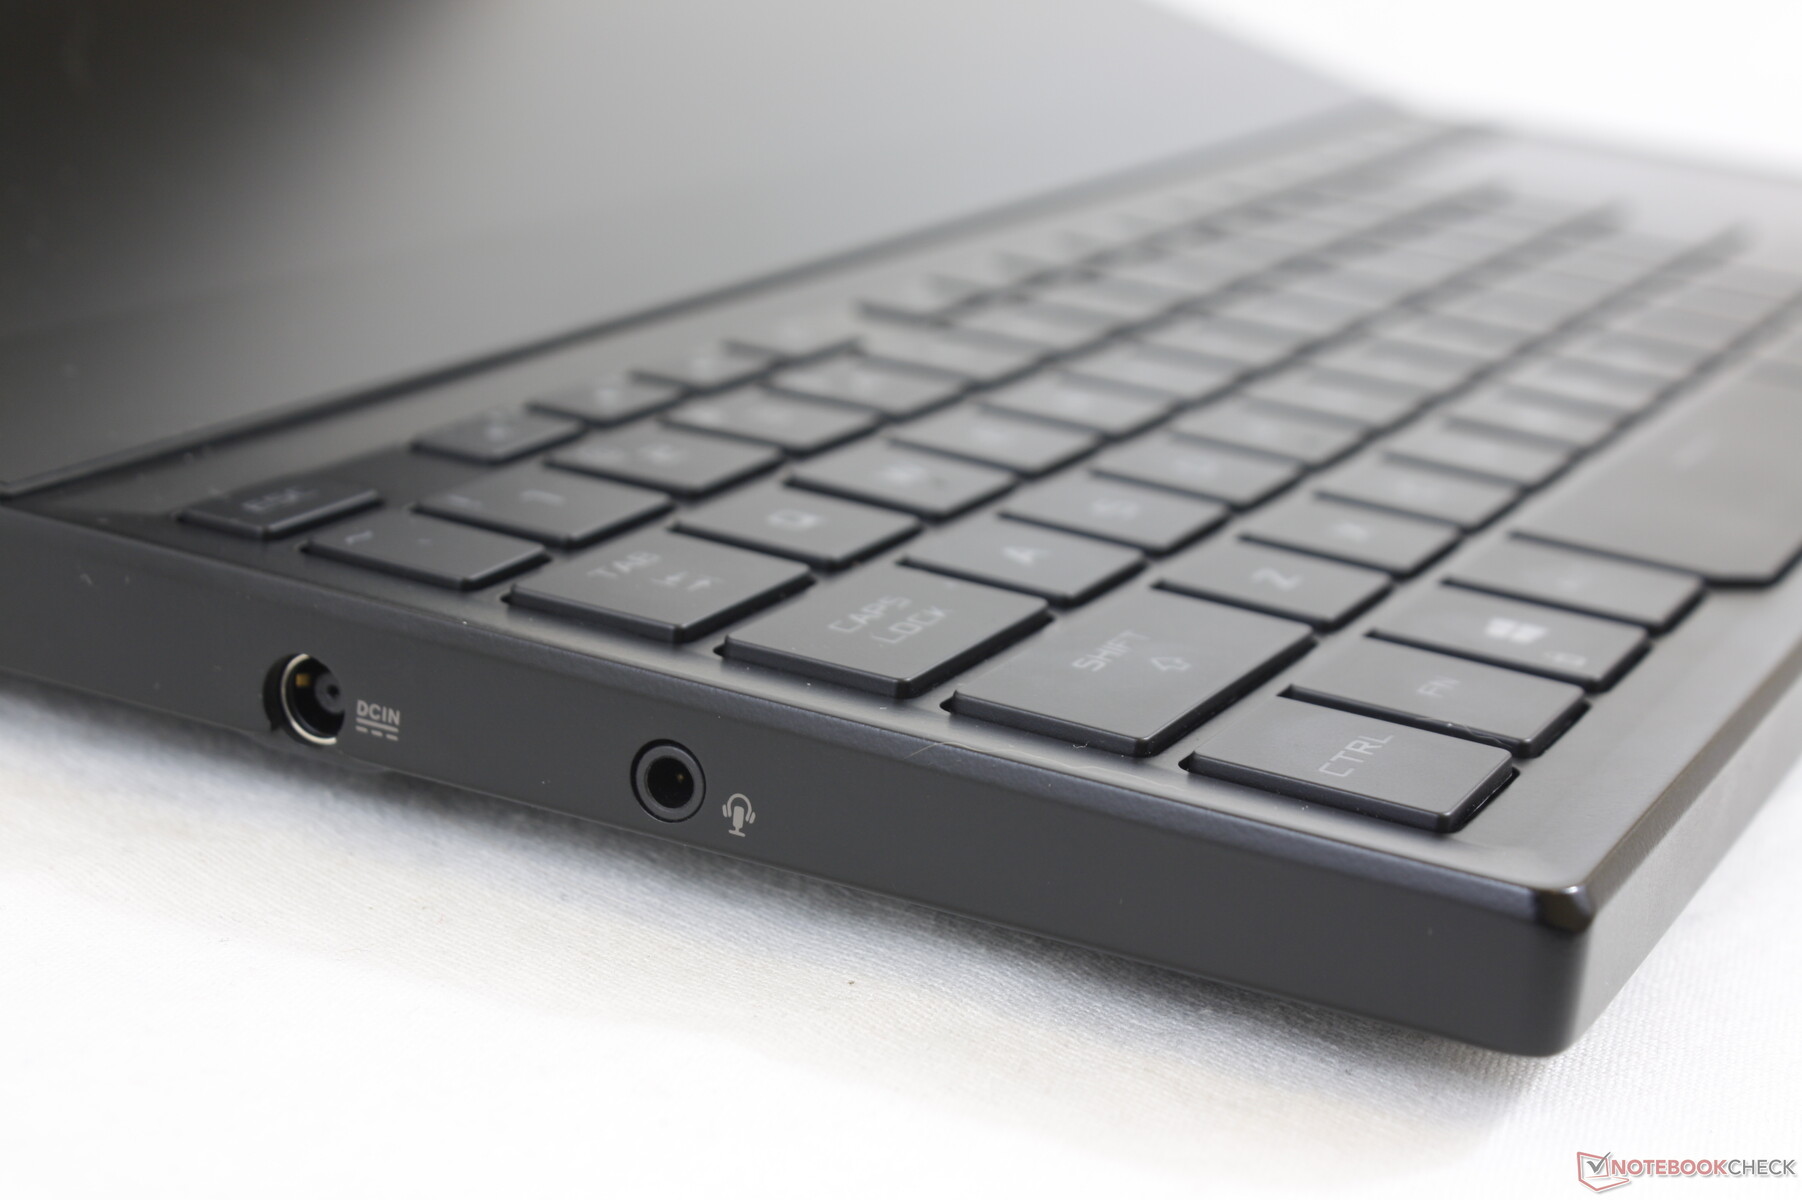
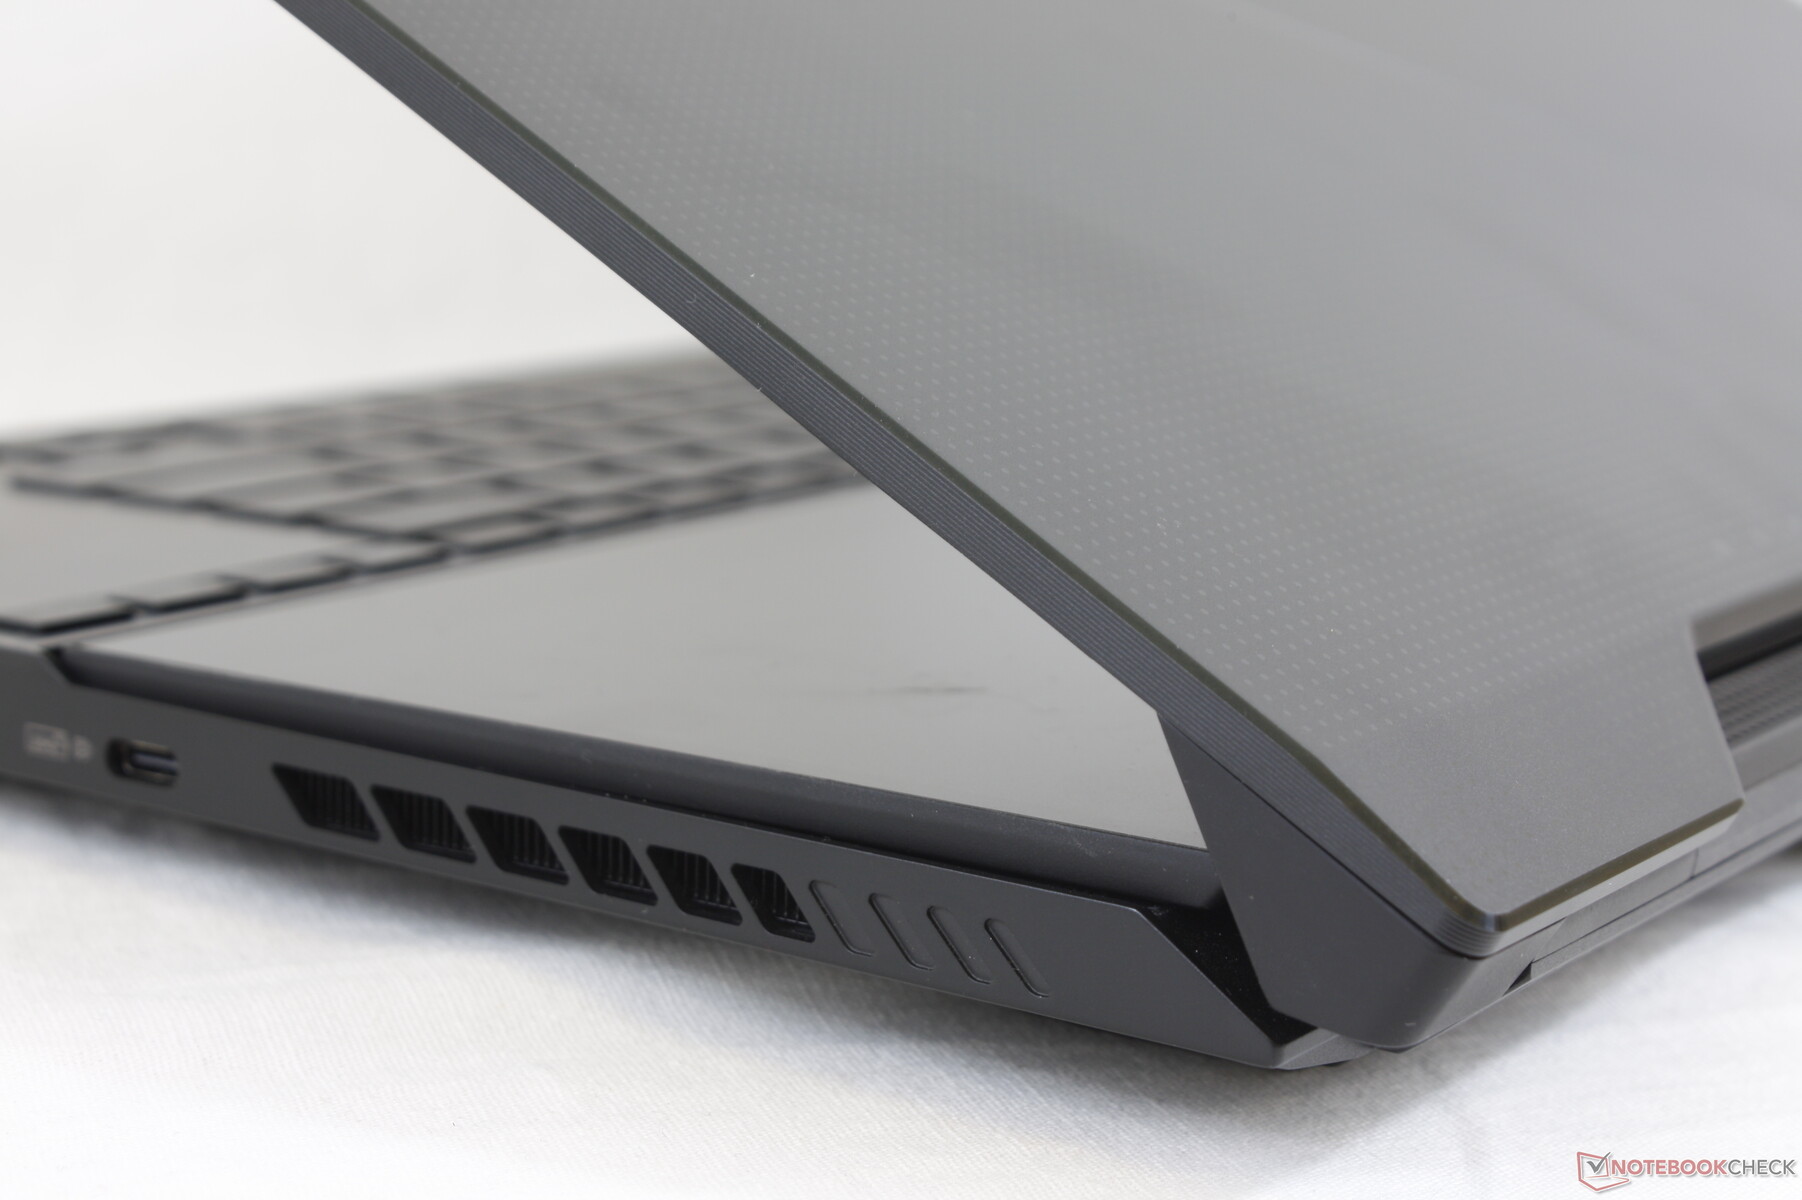
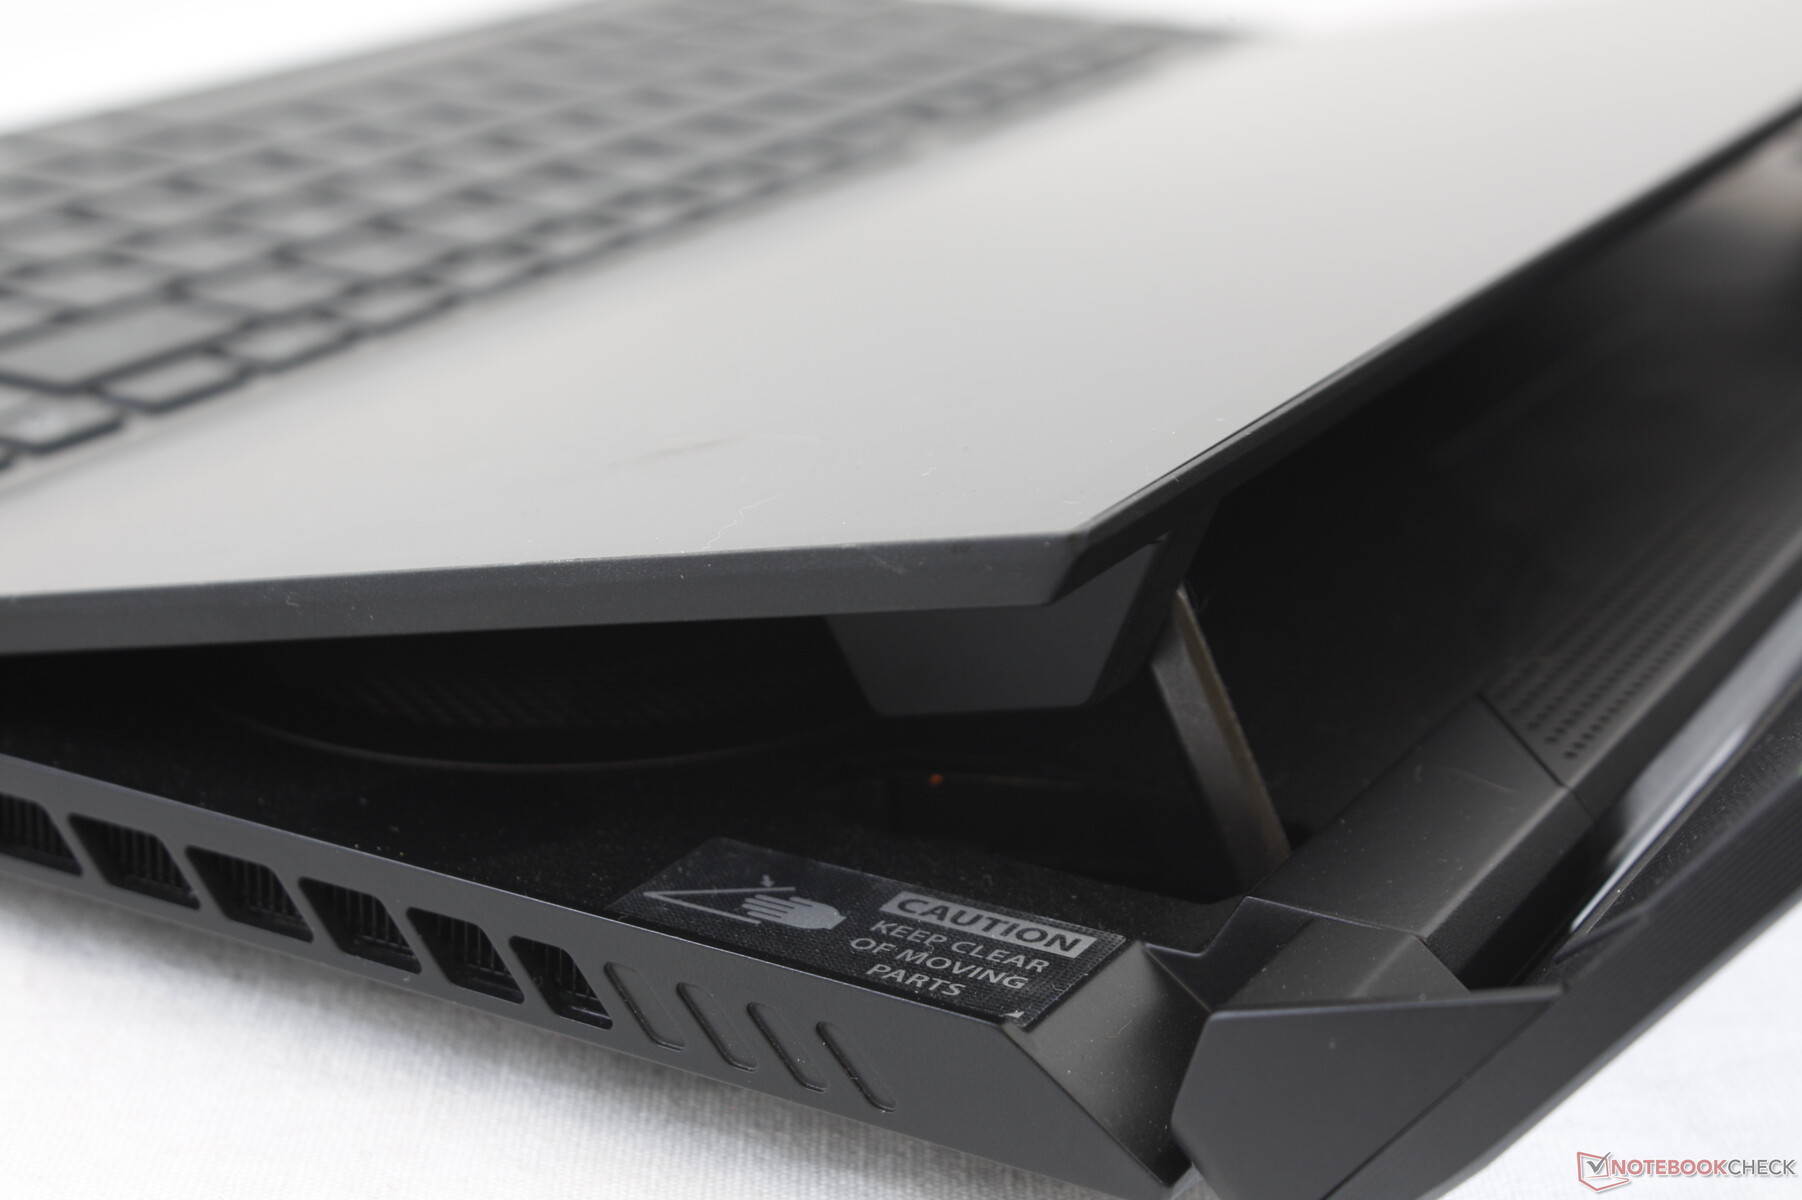
A legnagyobb gond az új előnyökkel az, hogy nem kizárólag a GX551 rendelkezik velük. Előbb-utóbb más laptopok is megkapják ugyanazokat a CPU, GPU és 4K kijelző opciókat, így hasonló teljesítményszintet érnek el. Továbbá, a ház és a ScreenPad nem változott, ami azt jelenti, hogy a tavalyi GX550 minden hátránya itt is megtalálható. Akinek a GX550-ben nem tetszett a sekély billentyűzet, az apró érintőpad, a széles méretek vagy a webkamera hiánya, annak a véleménye valószínűleg a GX551-gyel sem fog megváltozni. A ventilátorok pulzálásán játék közben és Teljesítmény üzemmódban szintén javíthattak volna.
Ár és elérhetőség
A Newegg jelenleg 2900 dollárért árusít egy kisebb, GeForce RTX 3070-nel felszerelt GX551QR konfigurációt. Az Xotic PC a mi egzakt konfigurációnkat árulja 3700 dollárért.
Asus ROG Zephyrus Duo 15 SE GX551QS
- 02/07/2021 v7 (old)
Allen Ngo
Price comparison

