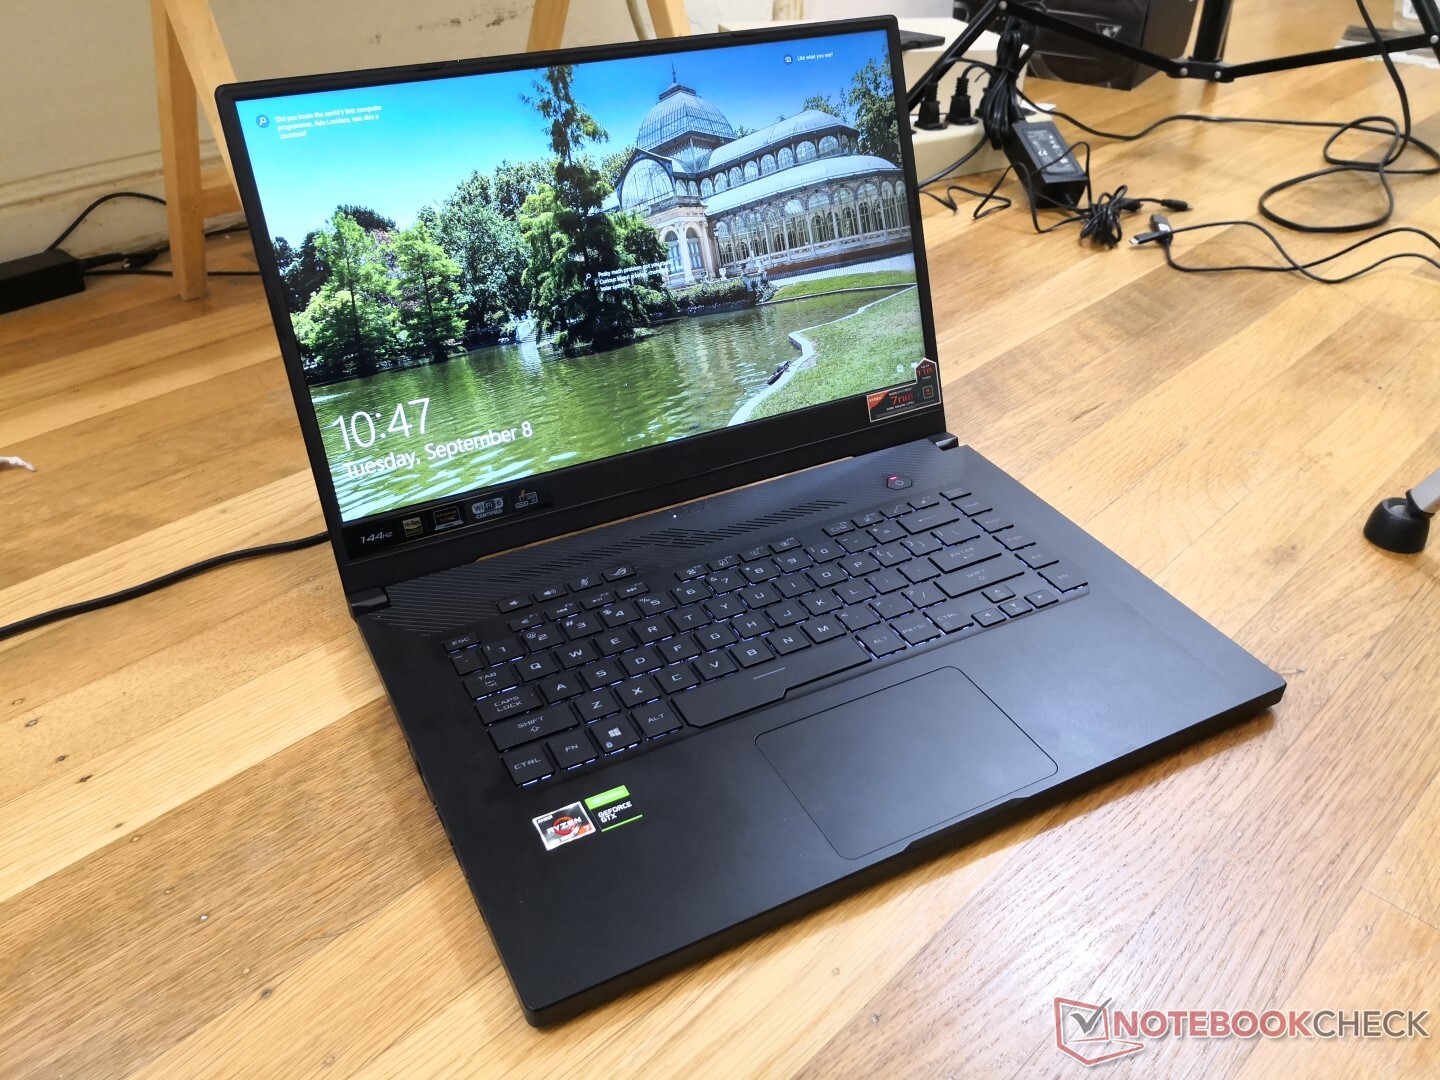
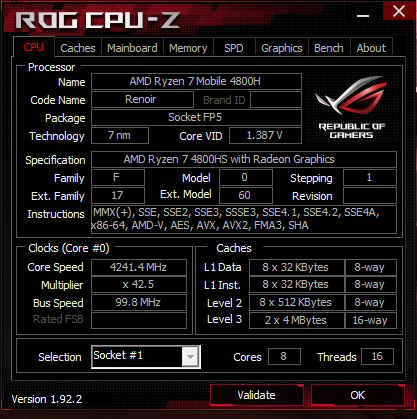
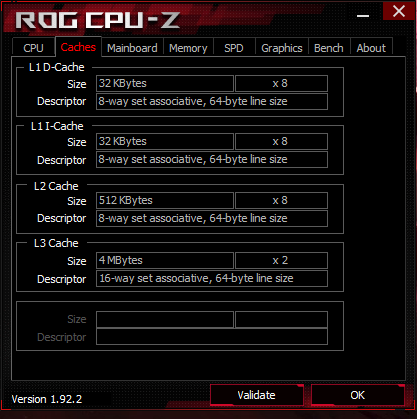
AMD Ryzen 7 4800HS Debütálás: Asus Zephyrus G15 GA502IU Laptop rövid értékelés
Értékelés | Dátum | Modell | Súly | Magasság | Méret | Felbontás | Legjobb ár |
|---|---|---|---|---|---|---|---|
| 81.2 % v7 (old) | 12/2020 | Asus ROG Zephyrus G15 GA502IU-ES76 R7 4800HS, GeForce GTX 1660 Ti Max-Q | 2.1 kg | 19.9 mm | 15.60" | 1920x1080 | |
| 84.5 % v7 (old) | 07/2020 | Asus ROG Zephyrus Duo 15 GX550LXS i9-10980HK, GeForce RTX 2080 Super Max-Q | 2.5 kg | 20 mm | 15.60" | 3840x2160 | |
| 83.3 % v6 (old) | 07/2019 | Asus ROG Zephyrus G15 GA502DU R7 3750H, GeForce GTX 1660 Ti Max-Q | 2.1 kg | 20.4 mm | 15.60" | 1920x1080 | |
| 86.9 % v7 (old) | Razer Blade 15 RTX 2070 Super Max-Q i7-10875H, GeForce RTX 2070 Super Max-Q | 2.1 kg | 17.8 mm | 15.60" | 1920x1080 | ||
| 83.3 % v7 (old) | Lenovo Legion 5 15IMH05H i5-10300H, GeForce RTX 2060 Mobile | 2.5 kg | 26.1 mm | 15.60" | 1920x1080 | ||
| 82.5 % v7 (old) | 12/2020 | MSI GS66 Stealth 10SE-045 i7-10750H, GeForce RTX 2060 Mobile | 2.2 kg | 19.8 mm | 15.60" | 1920x1080 | |
| 82.6 % v7 (old) | Eluktronics RP-15 R7 4800H, GeForce RTX 2060 Mobile | 1.9 kg | 20 mm | 15.60" | 1920x1080 |
| Networking | |
| iperf3 transmit AX12 | |
| Eluktronics RP-15 | |
| MSI GS66 Stealth 10SE-045 | |
| Asus ROG Zephyrus Duo 15 GX550LXS | |
| Razer Blade 15 RTX 2070 Super Max-Q | |
| Asus ROG Zephyrus G15 GA502IU-ES76 | |
| Lenovo Legion 5 15IMH05H | |
| iperf3 receive AX12 | |
| Eluktronics RP-15 | |
| Razer Blade 15 RTX 2070 Super Max-Q | |
| MSI GS66 Stealth 10SE-045 | |
| Asus ROG Zephyrus Duo 15 GX550LXS | |
| Asus ROG Zephyrus G15 GA502IU-ES76 | |
| Lenovo Legion 5 15IMH05H | |
| |||||||||||||||||||||||||
Fényerő megoszlás: 89 %
Centrumban: 255.9 cd/m²
Kontraszt: 1163:1 (Fekete: 0.22 cd/m²)
ΔE ColorChecker Calman: 5.15 | ∀{0.5-29.43 Ø4.73}
calibrated: 4.83
ΔE Greyscale Calman: 4.2 | ∀{0.09-98 Ø4.97}
58% sRGB (Argyll 1.6.3 3D)
36.9% AdobeRGB 1998 (Argyll 1.6.3 3D)
40.22% AdobeRGB 1998 (Argyll 3D)
58.5% sRGB (Argyll 3D)
38.9% Display P3 (Argyll 3D)
Gamma: 2.16
CCT: 7500 K
| Asus ROG Zephyrus G15 GA502IU-ES76 Panda LM156LF-2F01, IPS, 15.6", 1920x1080 | Asus ROG Zephyrus Duo 15 GX550LXS AU Optronics B156ZAN03.1, IPS, 15.6", 3840x2160 | Asus ROG Zephyrus G15 GA502DU Panda LM156LF-CL03, IPS, 15.6", 1920x1080 | Razer Blade 15 RTX 2070 Super Max-Q AU Optronics B156HAN12.0, IPS, 15.6", 1920x1080 | Lenovo Legion 5 15IMH05H BOE CQ NV156FHM-NX1, IPS, 15.6", 1920x1080 | MSI GS66 Stealth 10SE-045 Sharp LQ156M1JW03, IPS, 15.6", 1920x1080 | Eluktronics RP-15 BOE NV156FHM-N4G, IPS, 15.6", 1920x1080 | |
|---|---|---|---|---|---|---|---|
| Display | 114% | 4% | 74% | -0% | 71% | 61% | |
| Display P3 Coverage (%) | 38.9 | 87 124% | 40.33 4% | 69.4 78% | 38.8 0% | 67.5 74% | 63.7 64% |
| sRGB Coverage (%) | 58.5 | 100 71% | 60.6 4% | 98.8 69% | 57.8 -1% | 98.3 68% | 92 57% |
| AdobeRGB 1998 Coverage (%) | 40.22 | 99.9 148% | 41.69 4% | 70.5 75% | 40.09 0% | 68.9 71% | 65.2 62% |
| Response Times | -63% | -24% | 78% | 14% | 55% | 45% | |
| Response Time Grey 50% / Grey 80% * (ms) | 24.4 ? | 56.4 ? -131% | 34 ? -39% | 3.2 ? 87% | 26 ? -7% | 12 ? 51% | 17.2 ? 30% |
| Response Time Black / White * (ms) | 25.6 ? | 24.4 ? 5% | 28 ? -9% | 8 ? 69% | 17 ? 34% | 10.4 ? 59% | 10.4 ? 59% |
| PWM Frequency (Hz) | 21280 ? | 23580 ? | |||||
| Screen | 57% | -4% | 30% | 6% | 28% | 13% | |
| Brightness middle (cd/m²) | 255.9 | 398 56% | 240.1 -6% | 345.4 35% | 301 18% | 272 6% | 298.6 17% |
| Brightness (cd/m²) | 246 | 385 57% | 231 -6% | 342 39% | 277 13% | 259 5% | 289 17% |
| Brightness Distribution (%) | 89 | 90 1% | 85 -4% | 90 1% | 77 -13% | 91 2% | 90 1% |
| Black Level * (cd/m²) | 0.22 | 0.28 -27% | 0.34 -55% | 0.34 -55% | 0.26 -18% | 0.27 -23% | 0.35 -59% |
| Contrast (:1) | 1163 | 1421 22% | 706 -39% | 1016 -13% | 1158 0% | 1007 -13% | 853 -27% |
| Colorchecker dE 2000 * | 5.15 | 1.53 70% | 4.2 18% | 3.18 38% | 5.12 1% | 2.42 53% | 5.01 3% |
| Colorchecker dE 2000 max. * | 17.11 | 3.69 78% | 17.8 -4% | 6.57 62% | 8.86 48% | 6.93 59% | 7.06 59% |
| Colorchecker dE 2000 calibrated * | 4.83 | 0.77 84% | 4.09 15% | 1.77 63% | 4.88 -1% | 0.88 82% | 2.52 48% |
| Greyscale dE 2000 * | 4.2 | 2.4 43% | 2.8 33% | 3.8 10% | 3.47 17% | 4.5 -7% | 5.4 -29% |
| Gamma | 2.16 102% | 2.19 100% | 2.2 100% | 2.15 102% | 2.37 93% | 2.188 101% | 2.54 87% |
| CCT | 7500 87% | 6996 93% | 6925 94% | 7109 91% | 7062 92% | 7369 88% | 7461 87% |
| Color Space (Percent of AdobeRGB 1998) (%) | 36.9 | 100 171% | 38.4 4% | 64.3 74% | 37 0% | 69 87% | 59.1 60% |
| Color Space (Percent of sRGB) (%) | 58 | 100 72% | 60.4 4% | 99 71% | 57 -2% | 91 57% | 91.6 58% |
| Teljes átlag (program / beállítások) | 36% /
53% | -8% /
-5% | 61% /
44% | 7% /
6% | 51% /
39% | 40% /
26% |
* ... a kisebb jobb
Megjelenítési válaszidők
| ↔ Válaszidő Fekete-fehér | ||
|---|---|---|
| 25.6 ms ... emelkedés és süllyedés ↘ kombinálva | ↗ 15.2 ms emelkedés | 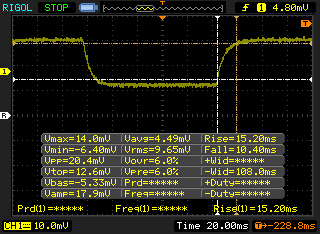 |
| ↘ 10.4 ms ősz | ||
| A képernyő viszonylag lassú reakciósebességet mutat tesztjeinkben, és túl lassú lehet a játékosok számára. Összehasonlításképpen, az összes tesztelt eszköz 0.1 (minimum) és 240 (maximum) ms között mozog. » 61 % of all devices are better. Ez azt jelenti, hogy a mért válaszidő rosszabb, mint az összes vizsgált eszköz átlaga (19.9 ms). | ||
| ↔ Válaszidő 50% szürke és 80% szürke között | ||
| 24.4 ms ... emelkedés és süllyedés ↘ kombinálva | ↗ 11.6 ms emelkedés | 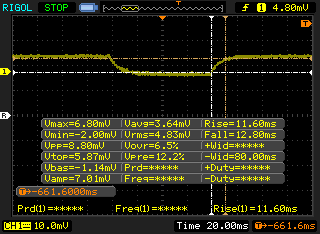 |
| ↘ 12.8 ms ősz | ||
| A képernyő jó reakciósebességet mutat tesztjeinkben, de túl lassú lehet a versenyképes játékosok számára. Összehasonlításképpen, az összes tesztelt eszköz 0.165 (minimum) és 636 (maximum) ms között mozog. » 35 % of all devices are better. Ez azt jelenti, hogy a mért válaszidő jobb, mint az összes vizsgált eszköz átlaga (31.1 ms). | ||
Képernyő villogása / PWM (impulzusszélesség-moduláció)
| Képernyő villogása / PWM nem érzékelhető | 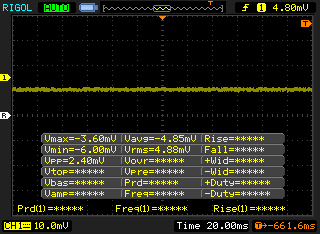 | ||
Összehasonlításképpen: az összes tesztelt eszköz 52 %-a nem használja a PWM-et a kijelző elsötétítésére. Ha PWM-et észleltek, akkor átlagosan 7797 (minimum: 5 - maximum: 343500) Hz-t mértek. | |||
Cinebench R15: CPU Multi 64Bit | CPU Single 64Bit
Blender: v2.79 BMW27 CPU
7-Zip 18.03: 7z b 4 -mmt1 | 7z b 4
Geekbench 5.5: Single-Core | Multi-Core
HWBOT x265 Benchmark v2.2: 4k Preset
LibreOffice : 20 Documents To PDF
R Benchmark 2.5: Overall mean
| Cinebench R20 / CPU (Multi Core) | |
| Eluktronics RP-17 | |
| Alienware m17 R3 P45E | |
| Eurocom Sky X4C i9-9900KS | |
| Asus Zephyrus G14 GA401IV | |
| MSI GS75 10SF-609US | |
| Asus ROG Zephyrus G15 GA502IU-ES76 | |
| Alienware m15 R3 P87F | |
| HP Pavilion Gaming 15-ec1206ng | |
| Walmart EVOO Gaming 17 | |
| Dell G5 15 5590 | |
| Asus ROG Zephyrus G15 GA502DU | |
| Cinebench R20 / CPU (Single Core) | |
| Eurocom Sky X4C i9-9900KS | |
| Asus Zephyrus G14 GA401IV | |
| Eluktronics RP-17 | |
| Asus ROG Zephyrus G15 GA502IU-ES76 | |
| Alienware m15 R3 P87F | |
| MSI GS75 10SF-609US | |
| Alienware m17 R3 P45E | |
| Walmart EVOO Gaming 17 | |
| HP Pavilion Gaming 15-ec1206ng | |
| Dell G5 15 5590 | |
| Asus ROG Zephyrus G15 GA502DU | |
| Cinebench R15 / CPU Multi 64Bit | |
| Eurocom Sky X4C i9-9900KS | |
| Eluktronics RP-17 | |
| Asus Zephyrus G14 GA401IV | |
| Alienware m17 R3 P45E | |
| MSI GS75 10SF-609US | |
| Asus ROG Zephyrus G15 GA502IU-ES76 | |
| HP Pavilion Gaming 15-ec1206ng | |
| Alienware m15 R3 P87F | |
| Walmart EVOO Gaming 17 | |
| Dell G5 15 5590 | |
| Asus ROG Zephyrus G15 GA502DU | |
| Cinebench R15 / CPU Single 64Bit | |
| Eurocom Sky X4C i9-9900KS | |
| Alienware m17 R3 P45E | |
| Alienware m15 R3 P87F | |
| MSI GS75 10SF-609US | |
| Asus Zephyrus G14 GA401IV | |
| Eluktronics RP-17 | |
| Asus ROG Zephyrus G15 GA502IU-ES76 | |
| Walmart EVOO Gaming 17 | |
| HP Pavilion Gaming 15-ec1206ng | |
| Dell G5 15 5590 | |
| Asus ROG Zephyrus G15 GA502DU | |
| Blender / v2.79 BMW27 CPU | |
| Asus ROG Zephyrus G15 GA502DU | |
| HP Pavilion Gaming 15-ec1206ng | |
| Alienware m15 R3 P87F | |
| Asus Zephyrus G14 GA401IV | |
| Asus ROG Zephyrus G15 GA502IU-ES76 | |
| MSI GS75 10SF-609US | |
| Eluktronics RP-17 | |
| Eurocom Sky X4C i9-9900KS | |
| Alienware m17 R3 P45E | |
| 7-Zip 18.03 / 7z b 4 -mmt1 | |
| Eurocom Sky X4C i9-9900KS | |
| Alienware m17 R3 P45E | |
| MSI GS75 10SF-609US | |
| Asus ROG Zephyrus G15 GA502IU-ES76 | |
| Asus Zephyrus G14 GA401IV | |
| Eluktronics RP-17 | |
| Alienware m15 R3 P87F | |
| HP Pavilion Gaming 15-ec1206ng | |
| Asus ROG Zephyrus G15 GA502DU | |
| 7-Zip 18.03 / 7z b 4 | |
| Eurocom Sky X4C i9-9900KS | |
| Eluktronics RP-17 | |
| Asus Zephyrus G14 GA401IV | |
| MSI GS75 10SF-609US | |
| Asus ROG Zephyrus G15 GA502IU-ES76 | |
| Alienware m17 R3 P45E | |
| HP Pavilion Gaming 15-ec1206ng | |
| Alienware m15 R3 P87F | |
| Asus ROG Zephyrus G15 GA502DU | |
| Geekbench 5.5 / Single-Core | |
| Eurocom Sky X4C i9-9900KS | |
| Alienware m17 R3 P45E | |
| MSI GS75 10SF-609US | |
| Alienware m15 R3 P87F | |
| Asus Zephyrus G14 GA401IV | |
| Asus ROG Zephyrus G15 GA502IU-ES76 | |
| Eluktronics RP-17 | |
| HP Pavilion Gaming 15-ec1206ng | |
| Geekbench 5.5 / Multi-Core | |
| Eurocom Sky X4C i9-9900KS | |
| MSI GS75 10SF-609US | |
| Alienware m17 R3 P45E | |
| Eluktronics RP-17 | |
| Asus ROG Zephyrus G15 GA502IU-ES76 | |
| Asus Zephyrus G14 GA401IV | |
| Alienware m15 R3 P87F | |
| HP Pavilion Gaming 15-ec1206ng | |
| HWBOT x265 Benchmark v2.2 / 4k Preset | |
| Eurocom Sky X4C i9-9900KS | |
| Alienware m17 R3 P45E | |
| Eluktronics RP-17 | |
| MSI GS75 10SF-609US | |
| Asus Zephyrus G14 GA401IV | |
| Asus ROG Zephyrus G15 GA502IU-ES76 | |
| Alienware m15 R3 P87F | |
| HP Pavilion Gaming 15-ec1206ng | |
| Asus ROG Zephyrus G15 GA502DU | |
| LibreOffice / 20 Documents To PDF | |
| HP Pavilion Gaming 15-ec1206ng | |
| Alienware m15 R3 P87F | |
| Eluktronics RP-17 | |
| Asus ROG Zephyrus G15 GA502IU-ES76 | |
| MSI GS75 10SF-609US | |
| Alienware m17 R3 P45E | |
| R Benchmark 2.5 / Overall mean | |
| Alienware m15 R3 P87F | |
| HP Pavilion Gaming 15-ec1206ng | |
| MSI GS75 10SF-609US | |
| Eluktronics RP-17 | |
| Asus ROG Zephyrus G15 GA502IU-ES76 | |
| Alienware m17 R3 P45E | |
* ... a kisebb jobb
| PCMark 10 | |
| Score | |
| Razer Blade 15 RTX 2070 Super Max-Q | |
| Eluktronics RP-15 | |
| Asus ROG Zephyrus G15 GA502IU-ES76 | |
| Asus ROG Zephyrus Duo 15 GX550LXS | |
| MSI GS66 Stealth 10SE-045 | |
| Lenovo Legion 5 15IMH05H | |
| Asus ROG Zephyrus G15 GA502DU | |
| Essentials | |
| Razer Blade 15 RTX 2070 Super Max-Q | |
| Eluktronics RP-15 | |
| MSI GS66 Stealth 10SE-045 | |
| Asus ROG Zephyrus Duo 15 GX550LXS | |
| Asus ROG Zephyrus G15 GA502IU-ES76 | |
| Lenovo Legion 5 15IMH05H | |
| Asus ROG Zephyrus G15 GA502DU | |
| Productivity | |
| Razer Blade 15 RTX 2070 Super Max-Q | |
| Lenovo Legion 5 15IMH05H | |
| Asus ROG Zephyrus Duo 15 GX550LXS | |
| MSI GS66 Stealth 10SE-045 | |
| Eluktronics RP-15 | |
| Asus ROG Zephyrus G15 GA502IU-ES76 | |
| Asus ROG Zephyrus G15 GA502DU | |
| Digital Content Creation | |
| Razer Blade 15 RTX 2070 Super Max-Q | |
| Eluktronics RP-15 | |
| Asus ROG Zephyrus G15 GA502IU-ES76 | |
| Asus ROG Zephyrus Duo 15 GX550LXS | |
| Asus ROG Zephyrus G15 GA502DU | |
| MSI GS66 Stealth 10SE-045 | |
| Lenovo Legion 5 15IMH05H | |
| PCMark 8 | |
| Home Score Accelerated v2 | |
| Razer Blade 15 RTX 2070 Super Max-Q | |
| Eluktronics RP-15 | |
| Asus ROG Zephyrus G15 GA502IU-ES76 | |
| MSI GS66 Stealth 10SE-045 | |
| Lenovo Legion 5 15IMH05H | |
| Asus ROG Zephyrus Duo 15 GX550LXS | |
| Asus ROG Zephyrus G15 GA502DU | |
| Work Score Accelerated v2 | |
| Razer Blade 15 RTX 2070 Super Max-Q | |
| Eluktronics RP-15 | |
| MSI GS66 Stealth 10SE-045 | |
| Asus ROG Zephyrus G15 GA502IU-ES76 | |
| Lenovo Legion 5 15IMH05H | |
| Asus ROG Zephyrus G15 GA502DU | |
| Asus ROG Zephyrus Duo 15 GX550LXS | |
| PCMark 8 Home Score Accelerated v2 | 4913 pontok | |
| PCMark 8 Work Score Accelerated v2 | 5901 pontok | |
| PCMark 10 Score | 5291 pontok | |
Segítség | ||
| DPC Latencies / LatencyMon - interrupt to process latency (max), Web, Youtube, Prime95 | |
| Asus ROG Zephyrus Duo 15 GX550LXS | |
| Razer Blade 15 RTX 2070 Super Max-Q | |
| MSI GS66 Stealth 10SE-045 | |
| Asus ROG Zephyrus G15 GA502IU-ES76 | |
| Lenovo Legion 5 15IMH05H | |
| Eluktronics RP-15 | |
* ... a kisebb jobb
| Asus ROG Zephyrus G15 GA502IU-ES76 Intel SSD 660p 1TB SSDPEKNW010T8 | Asus ROG Zephyrus Duo 15 GX550LXS 2x Samsung PM981a MZVLB1T0HBLR (RAID 0) | Asus ROG Zephyrus G15 GA502DU Intel SSD 660p SSDPEKNW512G8 | Razer Blade 15 RTX 2070 Super Max-Q Samsung SSD PM981a MZVLB512HBJQ | Lenovo Legion 5 15IMH05H Samsung PM991 MZALQ512HALU | MSI GS66 Stealth 10SE-045 Samsung SSD PM981 MZVLB1T0HALR | |
|---|---|---|---|---|---|---|
| AS SSD | 60% | -20% | 56% | 1% | 72% | |
| Seq Read (MB/s) | 1197 | 2981 149% | 907 -24% | 1957 63% | 2012 68% | 2612 118% |
| Seq Write (MB/s) | 1637 | 2783 70% | 926 -43% | 2092 28% | 1261 -23% | 2368 45% |
| 4K Read (MB/s) | 56.3 | 43.98 -22% | 47.26 -16% | 50.2 -11% | 43.66 -22% | 51.1 -9% |
| 4K Write (MB/s) | 159 | 113.9 -28% | 98.7 -38% | 96.5 -39% | 109.3 -31% | 135.9 -15% |
| 4K-64 Read (MB/s) | 583 | 1519 161% | 321.5 -45% | 1594 173% | 851 46% | 1635 180% |
| 4K-64 Write (MB/s) | 838 | 1296 55% | 736 -12% | 2005 139% | 780 -7% | 1831 118% |
| Access Time Read * (ms) | 0.062 | 0.062 -0% | 0.064 -3% | 0.057 8% | 0.117 -89% | 0.042 32% |
| Access Time Write * (ms) | 0.128 | 0.033 74% | 0.045 65% | 0.112 12% | 0.036 72% | 0.028 78% |
| Score Read (Points) | 759 | 1861 145% | 459 -40% | 1840 142% | 1096 44% | 1947 157% |
| Score Write (Points) | 1160 | 1688 46% | 927 -20% | 2310 99% | 1016 -12% | 2204 90% |
| Score Total (Points) | 2350 | 4492 91% | 1641 -30% | 5103 117% | 2643 12% | 5138 119% |
| Copy ISO MB/s (MB/s) | 1376 | 2438 77% | 905 -34% | 1793 30% | 1481 8% | 2334 70% |
| Copy Program MB/s (MB/s) | 568 | 604 6% | 496.9 -13% | 573 1% | 467.5 -18% | 569 0% |
| Copy Game MB/s (MB/s) | 1180 | 1404 19% | 819 -31% | 1418 20% | 734 -38% | 1401 19% |
| CrystalDiskMark 5.2 / 6 | 35% | -33% | 21% | -14% | 16% | |
| Write 4K (MB/s) | 189.6 | 127.6 -33% | 132.2 -30% | 139.8 -26% | 145.4 -23% | 156.3 -18% |
| Read 4K (MB/s) | 61.7 | 48.4 -22% | 55.5 -10% | 48.62 -21% | 51.6 -16% | 47.65 -23% |
| Write Seq (MB/s) | 1730 | 2958 71% | 986 -43% | 2260 31% | 1007 -42% | 2374 37% |
| Read Seq (MB/s) | 1620 | 2984 84% | 1318 -19% | 2135 32% | 1145 -29% | 2045 26% |
| Write 4K Q32T1 (MB/s) | 474.2 | 472.7 0% | 220.3 -54% | 499.3 5% | 468.4 -1% | 431.3 -9% |
| Read 4K Q32T1 (MB/s) | 528 | 529 0% | 315.5 -40% | 552 5% | 528 0% | 509 -4% |
| Write Seq Q32T1 (MB/s) | 1795 | 3431 91% | 987 -45% | 2960 65% | 1381 -23% | 2385 33% |
| Read Seq Q32T1 (MB/s) | 1880 | 3536 88% | 1416 -25% | 3269 74% | 2291 22% | 3505 86% |
| Teljes átlag (program / beállítások) | 48% /
51% | -27% /
-25% | 39% /
43% | -7% /
-5% | 44% /
51% |
* ... a kisebb jobb

Disk Throttling: DiskSpd Read Loop, Queue Depth 8
| 3DMark 06 Standard Score | 25384 pontok | |
| 3DMark 11 Performance | 17377 pontok | |
| 3DMark Cloud Gate Standard Score | 38220 pontok | |
| 3DMark Fire Strike Score | 12739 pontok | |
| 3DMark Time Spy Score | 5461 pontok | |
Segítség | ||
| alacsony | közepes | magas | ultra | |
|---|---|---|---|---|
| The Witcher 3 (2015) | 257.5 | 166.5 | 94.5 | 51.3 |
| Dota 2 Reborn (2015) | 119 | 112 | 106 | 103 |
| Final Fantasy XV Benchmark (2018) | 131 | 74.1 | 54.6 | |
| X-Plane 11.11 (2018) | 93.7 | 80.4 | 67.8 | |
| Shadow of the Tomb Raider (2018) | 113 | 85 | 75 | 67 |
| Metro Exodus (2019) | 129.5 | 66.5 | 49.1 | 38.3 |
| Borderlands 3 (2019) | 116.5 | 81.5 | 54.9 | 42.3 |
| Asus ROG Zephyrus G15 GA502IU-ES76 GeForce GTX 1660 Ti Max-Q, R7 4800HS, Intel SSD 660p 1TB SSDPEKNW010T8 | Asus ROG Zephyrus Duo 15 GX550LXS GeForce RTX 2080 Super Max-Q, i9-10980HK, 2x Samsung PM981a MZVLB1T0HBLR (RAID 0) | Asus ROG Zephyrus G15 GA502DU GeForce GTX 1660 Ti Max-Q, R7 3750H, Intel SSD 660p SSDPEKNW512G8 | Razer Blade 15 RTX 2070 Super Max-Q GeForce RTX 2070 Super Max-Q, i7-10875H, Samsung SSD PM981a MZVLB512HBJQ | Lenovo Legion 5 15IMH05H GeForce RTX 2060 Mobile, i5-10300H, Samsung PM991 MZALQ512HALU | MSI GS66 Stealth 10SE-045 GeForce RTX 2060 Mobile, i7-10750H, Samsung SSD PM981 MZVLB1T0HALR | Eluktronics RP-15 GeForce RTX 2060 Mobile, R7 4800H, Phison PM81000GPMQCN28BTF-E12S4 M.2 NVM SSD | |
|---|---|---|---|---|---|---|---|
| Noise | -12% | -7% | -0% | -3% | -9% | -3% | |
| off / környezet * (dB) | 26.3 | 30 -14% | 28 -6% | 27 -3% | 30.7 -17% | 25 5% | 28 -6% |
| Idle Minimum * (dB) | 26.7 | 33 -24% | 29.4 -10% | 27 -1% | 30.7 -15% | 29 -9% | 28 -5% |
| Idle Average * (dB) | 26.7 | 34 -27% | 31.9 -19% | 27 -1% | 30.7 -15% | 30 -12% | 28 -5% |
| Idle Maximum * (dB) | 31.9 | 35 -10% | 33 -3% | 27 15% | 30.7 4% | 40 -25% | 31.5 1% |
| Load Average * (dB) | 38.9 | 48 -23% | 41.2 -6% | 44.7 -15% | 36.6 6% | 51 -31% | 44 -13% |
| Witcher 3 ultra * (dB) | 51 | 48 6% | 53.8 -5% | 51.2 -0% | 47 8% | 48 6% | 48.8 4% |
| Load Maximum * (dB) | 54.9 | 49 11% | 55.7 -1% | 54 2% | 50.9 7% | 54 2% | 54.1 1% |
* ... a kisebb jobb
Zajszint
| Üresjárat |
| 26.7 / 26.7 / 31.9 dB(A) |
| Terhelés |
| 38.9 / 54.9 dB(A) |
 | ||
30 dB csendes 40 dB(A) hallható 50 dB(A) hangos |
||
min: | ||
(-) A felső oldalon a maximális hőmérséklet 52.2 °C / 126 F, összehasonlítva a 40.4 °C / 105 F átlagával , 21.2 és 68.8 °C között a Gaming osztálynál.
(-) Az alsó maximum 65 °C / 149 F-ig melegszik fel, összehasonlítva a 43.2 °C / 110 F átlagával
(+) Üresjáratban a felső oldal átlagos hőmérséklete 27.2 °C / 81 F, összehasonlítva a 33.9 °C / ### eszközátlaggal class_avg_f### F.
(±) A The Witcher 3 játék során a felső oldal átlaghőmérséklete 35.8 °C / 96 F, összehasonlítva a 33.9 °C / ## eszközátlaggal #class_avg_f### F.
(+) A csuklótámasz és az érintőpad hűvösebb, mint a bőr hőmérséklete, maximum 25.4 °C / 77.7 F, ezért hűvös tapintású.
(+) A hasonló eszközök csuklótámasz területének átlagos hőmérséklete 28.8 °C / 83.8 F volt (+3.4 °C / 6.1 F).
Asus ROG Zephyrus G15 GA502IU-ES76 hangelemzés
(±) | a hangszóró hangereje átlagos, de jó (81 dB)
Basszus 100 - 315 Hz
(±) | csökkentett basszus – átlagosan 5.9%-kal alacsonyabb, mint a medián
(±) | a basszus linearitása átlagos (11.4% delta az előző frekvenciához)
Közepes 400-2000 Hz
(+) | kiegyensúlyozott középpontok – csak 2.2% választja el a mediántól
(+) | a középpontok lineárisak (4% delta az előző frekvenciához)
Maximum 2-16 kHz
(±) | magasabb csúcsok – átlagosan 6.5%-kal magasabb, mint a medián
(+) | a csúcsok lineárisak (6.5% delta az előző frekvenciához képest)
Összességében 100 - 16.000 Hz
(+) | általános hangzás lineáris (13.1% eltérés a mediánhoz képest)
Ugyanazon osztályhoz képest
» 18%Ebben az osztályban az összes tesztelt eszköz %-a jobb volt, 4% hasonló, 78%-kal rosszabb
» A legjobb delta értéke 6%, az átlag 18%, a legrosszabb 132% volt
Az összes tesztelt eszközzel összehasonlítva
» 13% az összes tesztelt eszköz jobb volt, 3% hasonló, 84%-kal rosszabb
» A legjobb delta értéke 4%, az átlag 24%, a legrosszabb 134% volt
Apple MacBook 12 (Early 2016) 1.1 GHz hangelemzés
(+) | a hangszórók viszonylag hangosan tudnak játszani (83.6 dB)
Basszus 100 - 315 Hz
(±) | csökkentett basszus – átlagosan 11.3%-kal alacsonyabb, mint a medián
(±) | a basszus linearitása átlagos (14.2% delta az előző frekvenciához)
Közepes 400-2000 Hz
(+) | kiegyensúlyozott középpontok – csak 2.4% választja el a mediántól
(+) | a középpontok lineárisak (5.5% delta az előző frekvenciához)
Maximum 2-16 kHz
(+) | kiegyensúlyozott csúcsok – csak 2% választja el a mediántól
(+) | a csúcsok lineárisak (4.5% delta az előző frekvenciához képest)
Összességében 100 - 16.000 Hz
(+) | általános hangzás lineáris (10.2% eltérés a mediánhoz képest)
Ugyanazon osztályhoz képest
» 7%Ebben az osztályban az összes tesztelt eszköz %-a jobb volt, 2% hasonló, 91%-kal rosszabb
» A legjobb delta értéke 5%, az átlag 18%, a legrosszabb 53% volt
Az összes tesztelt eszközzel összehasonlítva
» 5% az összes tesztelt eszköz jobb volt, 1% hasonló, 94%-kal rosszabb
» A legjobb delta értéke 4%, az átlag 24%, a legrosszabb 134% volt
| Kikapcsolt állapot / Készenlét | |
| Üresjárat | |
| Terhelés |
|
Kulcs:
min: | |
| Asus ROG Zephyrus G15 GA502IU-ES76 R7 4800HS, GeForce GTX 1660 Ti Max-Q, Intel SSD 660p 1TB SSDPEKNW010T8, IPS, 1920x1080, 15.6" | Asus ROG Zephyrus Duo 15 GX550LXS i9-10980HK, GeForce RTX 2080 Super Max-Q, 2x Samsung PM981a MZVLB1T0HBLR (RAID 0), IPS, 3840x2160, 15.6" | Asus ROG Zephyrus G15 GA502DU R7 3750H, GeForce GTX 1660 Ti Max-Q, Intel SSD 660p SSDPEKNW512G8, IPS, 1920x1080, 15.6" | Razer Blade 15 RTX 2070 Super Max-Q i7-10875H, GeForce RTX 2070 Super Max-Q, Samsung SSD PM981a MZVLB512HBJQ, IPS, 1920x1080, 15.6" | Lenovo Legion 5 15IMH05H i5-10300H, GeForce RTX 2060 Mobile, Samsung PM991 MZALQ512HALU, IPS, 1920x1080, 15.6" | MSI GS66 Stealth 10SE-045 i7-10750H, GeForce RTX 2060 Mobile, Samsung SSD PM981 MZVLB1T0HALR, IPS, 1920x1080, 15.6" | Eluktronics RP-15 R7 4800H, GeForce RTX 2060 Mobile, Phison PM81000GPMQCN28BTF-E12S4 M.2 NVM SSD, IPS, 1920x1080, 15.6" | |
|---|---|---|---|---|---|---|---|
| Power Consumption | -204% | -68% | -147% | -17% | -95% | -176% | |
| Idle Minimum * (Watt) | 5.1 | 23 -351% | 7.4 -45% | 14.3 -180% | 3.2 37% | 7 -37% | 21.7 -325% |
| Idle Average * (Watt) | 8.4 | 30 -257% | 8.6 -2% | 22.3 -165% | 8.3 1% | 18 -114% | 30.1 -258% |
| Idle Maximum * (Watt) | 9.1 | 39 -329% | 39.1 -330% | 36.9 -305% | 8.7 4% | 31 -241% | 35 -285% |
| Load Average * (Watt) | 55.1 | 156 -183% | 65.9 -20% | 118.4 -115% | 82 -49% | 107 -94% | 112.6 -104% |
| Witcher 3 ultra * (Watt) | 97.5 | 152 -56% | 106.9 -10% | 153.7 -58% | 151 -55% | 146 -50% | 134.4 -38% |
| Load Maximum * (Watt) | 140.2 | 208 -48% | 141.3 -1% | 220.8 -57% | 195 -39% | 186 -33% | 201.5 -44% |
* ... a kisebb jobb
| Asus ROG Zephyrus G15 GA502IU-ES76 R7 4800HS, GeForce GTX 1660 Ti Max-Q, 76 Wh | Asus ROG Zephyrus Duo 15 GX550LXS i9-10980HK, GeForce RTX 2080 Super Max-Q, 90 Wh | Asus ROG Zephyrus G15 GA502DU R7 3750H, GeForce GTX 1660 Ti Max-Q, 76 Wh | Razer Blade 15 RTX 2070 Super Max-Q i7-10875H, GeForce RTX 2070 Super Max-Q, 80 Wh | Lenovo Legion 5 15IMH05H i5-10300H, GeForce RTX 2060 Mobile, 60 Wh | MSI GS66 Stealth 10SE-045 i7-10750H, GeForce RTX 2060 Mobile, 99.9 Wh | Eluktronics RP-15 R7 4800H, GeForce RTX 2060 Mobile, 46.7 Wh | |
|---|---|---|---|---|---|---|---|
| Akkumulátor üzemidő | -22% | 59% | 19% | 36% | 4% | -32% | |
| Reader / Idle (h) | 7.1 | 8 13% | 15.3 115% | 14.1 99% | 9 27% | ||
| WiFi v1.3 (h) | 5.3 | 3.1 -42% | 8 51% | 6.3 19% | 7.2 36% | 6.4 21% | 3.6 -32% |
| Load (h) | 1.9 | 1.2 -37% | 2.1 11% | 1.4 -26% | 1.2 -37% |
Pro
Kontra

Kétség sem fér hozzá, a Zephyrus G15 GA502IU hatalmas előrelépés a GA502DU-hoz képest, ami a processzor erejét illeti. A wattonkénti teljesítmény lenyűgöző, köszönhetően a 7 nm-es Ryzen CPU és a GeForce Max-Q GPU kombinációjának, míg a ház egyszerre kicsi és vonzó ebben az árban. Ha az olcsó versenytársakkal mérjük össze, mint amilyen azhe Acer Nitro 5, az MSI GL/GF sorozat, Dell G sorozat, or Aorus G sorozat, akkor a Zephyrus G15 határozottan kimagaslik.
A GA502IU legfőbb hátránya az ára és a kijelzője. 1300 dollárért a rendszer drágább, mint az alternatívák többsége ugyanazzal a GeForce GTX 1660 Ti GPU-val. Az extrát lényegében az olcsó gamer notebookok többségéből hiányzó, új AMD CPU-ért és a karcsú házért fizetjük. Mindeközben a 144 Hz-es panel középszerű színtere és válaszideje némiképp kiábrándító. A magasabb szintű 240 Hz-es konfiguráció elvileg kiküszöböli ezeket a gondokat, viszont egy ilyen opció többe is kerül. Még így is ez egy nagyszerű, olcsó, középkategóriás gamer notebook, főleg ha akciós áron kapjuk meg.
Az Asus Zephyrus G15 GA502IU kitűnő processzorteljesítményt kínál egy vonzó kivitelezésű házban, amit ebben az árban nehéz lenne felülmúlni. A grafikus lóerő, billentyűzet visszajelzés, a kijelző válaszideje és a színhűség viszont enyhén kiábrándító. Kár, hogy egy ilyen nagyszerű processzor pillanatnyilag szélesebb körben nem hozzáférhető más modellekben.
Asus ROG Zephyrus G15 GA502IU-ES76
- 09/10/2020 v7 (old)
Allen Ngo
Price comparison

